Exhibit 1
 | Second Quarter 2011 Page 1 of 16 |
| Stock Information: NYSE ADR Ticker: EDN Buenos Aires Stock Exchange Class B Shares Ticker: EDN Ratio: 20 Class B = 1 ADR Investor Relations Contacts: Ivana Del Rossi Finance Manager Tel: 5411.4346.5127 Veronica Gysin Investor Relations Tel: 5411.4346.5231 Edenor S.A. 6363 Del Libertador Avenue, 4th Floor (C1428ARG) Buenos Aires, Argentina Fax: 5411.4346.5358 Email: investor@edenor.com www.edenor.com.ar | EDENOR ANNOUNCES SECOND QUARTER 2011 RESULTS Buenos Aires, Argentina, August 11, 2011 – Empresa Distribuidora y Comercializadora Norte S.A. (NYSE: EDN; Buenos Aires Stock Exchange: EDN) (“EDENOR” or “the Company”), Argentina’s largest electricity distributor, today announced its results for the second quarter of 2011. All figures are stated in Argentine Pesos and have been prepared in accordance with Argentine GAAP. Solely for the convenience of the reader, Peso amounts as of and for the period ended June 30, 2011 have been translated into U.S. Dollars at the buying rate for U.S. Dollars quoted by Banco de la Nación Argentina (Banco Nación) on June 30, 2011 of Ps. 4.11. The following results are based on non consolidated financial statements of Edenor S.A. Second Quarter 2011 Highlights Net Sales increased 6.1% to Ps. 548.9 million in the second quarter of 2011 from Ps. 517.4 million in the second quarter of 2010, mainly due to the 7.3% increase in the volume of electricity sold in the second quarter of 2011, vis a vis the second quarter of 2010. Volume of Energy Sold increased 7.3% to 4,949 GWh in the second quarter of 2011 from 4,614 GWh in the second quarter of 2010. This increase was attributable to a 5.4% increase in the average GWh consumption per customer and a 1.8% increase in the number of customers. Electric Power Purchases increased 10.5% to Ps. 271.7 million in the second quarter of 2011 from Ps. 246.0 million in the second quarter of 2010, mainly due to a 6.8% increase in the volume of electricity purchased, from 4,427 GWh in the second quarter of 2010 to 4,730 GWh in the second quarter of 2011 (excluding in each case the wheeling system demand) and an increase in absolute numbers of the energy losses, given the higher volume of energy purchased. Gross Margin increased 2.1% to Ps. 277.2 million in the second quarter of 2011 from Ps. 271.5 million in the second quarter of 2010, mainly due to the higher volume of energy sold which was partially offset by the increase in Electric Power Purchases. Net Operating Income decreased Ps. 104.8 million, to a loss of Ps. 73.3 million in the second quarter of 2011 from a gain of Ps. 31.5 million in the second quarter of 2010 mainly due to an increase in transmission and distribution expenses of Ps. 87.2 million and an increase in selling expenses of Ps. 23.9 million. These cost increases were partially offset by an increase in gross margin of Ps. 5.7 million. Net Income decreased 59.9 million, to Ps. a loss of 66.2 million in the second quarter of 2011 from a loss of Ps. 6.3 million in the second quarter of 2010, mainly due to the increase in operating expenses and the increase in the financial results generated by liabilities, partially offset by permanent investments and goodwill amortization. |

| Second Quarter 2011 Page 2 of 16 |
Discussion of Financial Results:
| FINANCIAL HIGHLIGHTS | |||||||||
2Q 2011 * | 2Q 2010* | % Change vs.2010 | Six months period ended June 30, 2011* | Six months period ended June 30, 2010* | % Change vs. 2010 | ||||
| Net Sales | 548.9 | 517.4 | 6.1% | 1,041.0 | 1,090.9 | (4.6)% | |||
Electric power purchases | (271.7) | (246.0) | 10.5% | (569.4) | (526.2) | 8.2% | |||
| Gross margin | 277.2 | 271.5 | 2.1% | 571.6 | 564.7 | 1.2% | |||
| Net Operating Income (loss) | (73.3) | 31.5 | (332.9)% | (33.2) | 92.3 | (136.0)% | |||
* In millions of Argentine Pesos
Net sales
Net sales increased by 6.1 % (Ps. 31.4 million) from Ps. 517.4 million in the second quarter of 2010 to Ps. 548.9 million in the second quarter of 2011.
This variation was mainly due to the increase of 7.3 % in the volume of energy sold, from 4,614 GWh sold in the second quarter of 2010 to 4,949 GWh sold in the second quarter of 2011 which is attributable to a 5.4 % rise in the average GWh consumption per customer and a 1.8% increase in the number of customers.
Net energy sales represent approximately 97.7 % of net sales while late payment charges, pole leases, and connection and reconnection charges represent the remaining 2.3 %.
Energy sales increased by 6.4 % (Ps. 32.9 million) from Ps. 518.8 million in the second quarter of 2010 to Ps. 551.8 million in the second quarter of 2011, mainly due to:
| · | an increase of 8.7% in residential customers demand; |
| · | an increase of 6.9% in commercial customers demand; and, |
| · | an increase of 7.0% in industries and wheeling system demand. |
| Second Quarter 2011 Page 3 of 16 |
Electric power purchases
The amount of electric power purchases increased 10.5 % from Ps. 246.0 million in the second quarter of 2010 to Ps. 271.7 million for the second quarter of 2011. This variation results from the higher volume of energy and capacity sold and to an increase in absolute numbers of the energy losses given the higher volume of energy purchased.
Energy losses increased to 12.5 % in the second quarter of 2011 from 12.3 % in the second quarter of 2010.. In absolute numbers the increase was 41GWh.
Gross margin
Gross margin increased 2.1 % from Ps. 271.5 million in the second quarter of 2010 to Ps. 277.2 million in the second quarter of 2011. This positive variation was due to the higher volume of energy and capacity sold.
Transmission and distribution expenses
Transmission and distribution expenses have increased Ps. 87.2 million, from Ps. 154.8 million in the second quarter of 2010 to Ps. 242.0 million in the second quarter of 2011, mainly due to:
| § | a Ps. 42.4 million increase in salaries and social security taxes due to salaries increases granted in 2011; |
| § | a Ps. 38.1 million increase in outsourcing due to recategorization of contractors’ personnel; and, |
| § | a Ps. 2.7 million increase in materials. |
In term of percentage of revenues, transmission and distribution expenses increased from 29.9 % in the second quarter of 2010 to 44.1 % in the second quarter of 2011.
The following table sets forth the principal components of our transmission and distribution expenses for the periods indicated:
| Second Quarter ended June 30, | Six months ended June 30, | |||||||||||||||||||||||
| 2Q 2011 | % of 2Q 2011 net sales | 2Q 2010 | % of 2Q 2010 net sales | 2011 | 2010 | |||||||||||||||||||
| (in millions of Pesos, except percentages) | ||||||||||||||||||||||||
| Salaries and social security taxes | Ps. 109.9 | 20.0 | % | Ps. 67.4 | 13.0 | % | Ps. 183.9 | Ps. 128.4 | ||||||||||||||||
| Supplies | 13.0 | 2.4 | % | 10.2 | 2.0 | % | 23.1 | 20.6 | ||||||||||||||||
| Outsourcing | 69.7 | 12.7 | % | 31.6 | 6.1 | % | 99.6 | 59.8 | ||||||||||||||||
| Depreciation of property, plant & equipment | 44.7 | 8.1 | % | 42.3 | 8.2 | % | 88.8 | 84.4 | ||||||||||||||||
| Others | 4.7 | 0.9 | % | 3.2 | 0.6 | % | 9.5 | 8.1 | ||||||||||||||||
| Total | Ps. 242.0 | 44.1 | % | Ps. 154.8 | 29.9 | % | Ps. 404.9 | Ps. 301.3 | ||||||||||||||||
| Second Quarter 2011 Page 4 of 16 |
Selling expenses
Selling expenses are related to customer services provided at commercial offices, billing, invoice mailing, collection and collection procedures, as well as allowances for doubtful accounts.
Selling expenses had an increase of Ps. 23.9 million, from Ps. 43.9 million in the second quarter of 2010 to Ps. 67.8 million in the second quarter of 2011 mainly due to:
| § | a Ps. 10.3 million increase in outsourcing due to the recategorization of contractors’ personnel; and, |
| § | a Ps. 8.4 million increase in salaries and social security taxes due to salaries increases granted in 2011. |
In terms of percentage revenues, selling expenses increased from 8.5 % in the second quarter of 2010 to 12.4 % in the second quarter of 2011.
The following are the principal components of our selling expenses for the periods indicated:
Second Quarter ended June 30, | Six months ended June 30, | |||||||||||||||||||||||
| 2Q 2011 | % on 2Q 2011 revenues | 2Q 2010 | % on 2Q 2010 revenues | 2011 | 2010 | |||||||||||||||||||
| (in millions of Pesos) | ||||||||||||||||||||||||
| Salaries and social security taxes | Ps. 24.3 | 4.4 | % | Ps. 15.9 | 3.1 | % | Ps.40.0 | Ps. 29.9 | ||||||||||||||||
| Allowance for doubtful accounts | 3.6 | 0.7 | % | 4.1 | 0.8 | % | 7.1 | 10.6 | ||||||||||||||||
| Outsourcing | 21.3 | 3.9 | % | 11.1 | 2.1 | % | 35.3 | 22.6 | ||||||||||||||||
| Taxes and charges | 6.6 | 1.2 | % | 5.1 | 1.0 | % | 10.1 | 10.2 | ||||||||||||||||
| Others | 12.0 | 2.2 | % | 7.7 | 1.5 | % | 21.4 | 17.0 | ||||||||||||||||
| Total | Ps. 67.8 | 12.4 | % | Ps. 43.9 | 8.5 | % | Ps. 113.9 | Ps. 90.3 | ||||||||||||||||
Administrative expenses
Administrative expenses include, among others, expenses associated with accounting, payroll administration, personnel training, systems operation and maintenance.
Administrative expenses decreased 1.3 % from Ps. 41.3 million in the second quarter of 2010 to Ps. 40.8 million in the second quarter of 2011. This variation was mainly due to:
| § | a Ps. 2.3 million decrease in salaries and social security taxes; |
| § | a Ps. 1.9 million decrease in taxes and charges; and, |
| § | a Ps. 1.2 million decrease in rentals and insurances. |
| Second Quarter 2011 Page 5 of 16 |
These variations were partially offset by:
| § | a Ps. 3.1 million increase in outsourcing due to increases in contractors' prices; and, |
| § | a Ps. 1.5 million increase in computer services. |
In terms of percentage of revenues, administrative expenses decreased from 8.0 % in the second quarter of 2010 to 7.4 % in the second quarter of 2011.
The following are the principal components of our administrative expenses for the periods indicated:
Second Quarter ended June 30, | Six months ended June 30, | ||||||||||||||||||||||||
| 2Q 2011 | % of 2Q 2011 revenues | 2Q 2010 | % of 2Q 2010 revenues | 2011 | 2010 | ||||||||||||||||||||
| (in millions of Pesos) | |||||||||||||||||||||||||
| Salaries and social security taxes | Ps. 15.2 | 2.8 | % | Ps. 17.6 | 3.4 | % | Ps 33.2 | Ps. 33.0 | |||||||||||||||||
| Computer services | 7.9 | 1.4 | % | 6.4 | 1.2 | % | 16.0 | 13.3 | |||||||||||||||||
| Outsourcing | 5.1 | 0.9 | % | 2.0 | 0.4 | % | 8.0 | 6.7 | |||||||||||||||||
| Advertising expenses | 3.7 | 0.7 | % | 3.8 | 0.7 | % | 7.3 | 8.0 | |||||||||||||||||
| Others | 8.8 | 1.6 | % | 11.5 | 2.2 | % | 21.6 | 19.7 | |||||||||||||||||
| Total | Ps. 40.8 | 7.4 | % | Ps. 41.3 | 8.0 | % | Ps. 86.0 | Ps. 80.8 | |||||||||||||||||
Net operating income
Net operating income decreased Ps. 104.8 million from a gain of Ps. 31.5 million in the second quarter of 2010 to a loss of Ps. 73.3 million in the second quarter of 2011. This negative variation was due to the increases in transmission, distribution (Ps. 87.2 million) and selling expenses (Ps. 23.9 million), which were partially offset by an increase in gross margin (Ps. 5.7 million).
Financial income (expenses) and holding gains (losses)
Financial income and holding gains generated by assets were a gain of Ps. 13.5 million in the second quarter of 2011 compared to a gain of Ps. 5.1 million in the second quarter of 2010.
This positive variation of Ps. 8.4 million was mainly due to interests collected from loans granted to subsidiaries.
Financial expenses generated by liabilities which include financial interest, exchange results and other expenses, represented a loss of Ps. 72.2 million in the second quarter of 2011 compared to a loss of Ps. 33.4 million in the second quarter of 2010.
| Second Quarter 2011 Page 6 of 16 |
This Ps. 38.8 million negative variation was basically due to increases of Ps. 23.1 million in interest expenses and Ps. 16.8 million in exchange results basically from the increase in debt due to the issuance of the 2022 Notes.
Other income (expense), net
Other incomes (expenses), net, includes mainly voluntary retirements, severance payments, net revenues and expenses from technical transportation services between electricity distribution companies and accrual for lawsuits.
We recorded a loss of Ps. 12.6 million in the second quarter of 2011 vis a vis a loss of Ps. 4.8 million in the second quarter of 2010.
This negative variation was primarily due to the increase in the allowance for contingencies (Ps. 8.6 million) driven by litigations expenses, partially offset by a decrease of Ps. 1.8 million in other non-operating expenses.
Income tax on minimum presumed income
We recorded a tax gain of Ps. 45.5 million in the second quarter of 2011 compared to a charge of Ps. 5.0 million in the second quarter of 2010.
Net income
We recorded net loss of Ps. 66.2 million in the second quarter of 2011 compared to net loss of Ps. 6.3 million in the second quarter of 2010. This negative variation resulted primarily from:
| § | The increases in transmission, distribution and selling expenses; and, |
| § | The increase in financial results generated by liabilities. |
| Second Quarter 2011 Page 7 of 16 |
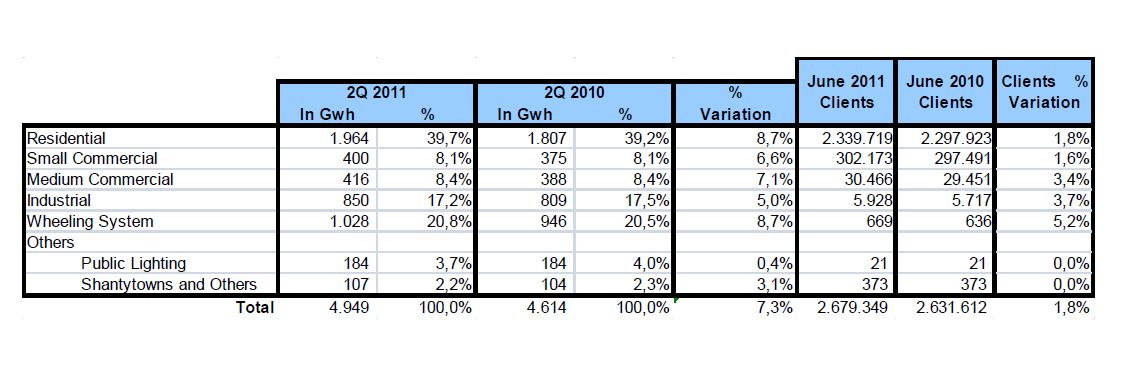
Operating Highlights
The following table shows our energy sales by category of customer (in GWh) and the number of clients for each category:
Capital Expenditures
During the second quarter of 2011, our capital expenditures amounted to Ps. 85.6 million, compared to Ps. 110.9 million in the second quarter of 2010. Our capital expenditures in the second quarter of 2011 consisted mainly of the following:
| · | Ps. 68.6 million in new connections due to the increase in our customer base and grid enhancements; |
| · | Ps. 11.1 million in network maintenance and improvements; |
| · | Ps. 1.6 million in legal requirements; |
| · | Ps. 1.7 million in communications and telecontrol; and |
| · | Ps. 2.6 million of other investment projects. |
For the six-month period ended June 30, 2011, our Capital Expenditures amounted to Ps. 134.3 million,
compared to Ps. 193.1 million in the same period of 2010.
| Second Quarter 2011 Page 8 of 16 |
HIGHLIGHTS
Intercompany Debt with EDEN
On July 8 and August 5, 2011, Empresa Distribuidora de Energía Norte SA prepaid Ps. 2 million and Ps.2.5 million plus interest, respectively, of the intercompany loan with Edenor for Ps. 80 million.
Shares acquisitions
On June 24, 2011, in different operations, the Company bought 2.951.000 ordinary shares of EMDERSA at a purchase price of US$0.42 per share. The shares represent 1.25% of the capital stock and the voting rights of the Company.
Financial position
As of today, the outstanding principal amount of our dollar denominated financial debt is US$ 324.8 million, consisting of US$ 300 million principal amount of Fixed Par Notes due 2022 and US$ 24.8 million principal amount of Senior Notes due 2017. In addition, the outstanding principal amount of our peso denominated debt is Ps. 40.8 million, consisting primarily of our Floating Rate notes due 2013.
| Second Quarter 2011 Page 9 of 16 |
About Edenor
Empresa Distribuidora y Comercializadora Norte S.A. (Edenor) is the largest electricity distribution company in Argentina in terms of number of customers and electricity sold (both in GWh and Pesos). Through a concession, Edenor distributes electricity exclusively to the northwestern zone of the greater Buenos Aires metropolitan area and the northern part of the city of Buenos Aires, which has a population of approximately 7 million people and an area of 4,637 sq. km. In 2010, Edenor sold 19,292 GWh of energy and purchased 22,053 GWh of energy, with net sales of approximately Ps. 2.2 billion and net loss of Ps. 74.0 million.
This press release may contain forward-looking statements. These statements are statements that are not historical facts, and are based on management’s current view and estimates of future economic circumstances, industry conditions, Company performance and financial results. The words “anticipates”, “believes”, “estimates”, “expects”, “plans” and similar expressions, as they relate to the Company are intended to identify forward-looking statements. Such statements reflect the current views of management and are subject to a number of risks and uncertainties, including those identified in the documents filed by the Company with the U.S. Securities and Exchange Commission. There is no guarantee that the expected events, trends or results will actually occur. The statements are based on many assumptions and factors, including general economic and market conditions, industry conditions, and operating factors. Any changes in such assumptions or factors could cause actual results to differ materially from current expectations.
Conference Call Information
There will be a conference call to discuss the Edenor’s quarterly results on Thursday, August 11, 2011, at 12:00 a.m. Buenos Aires time / 11:00 a.m. New York time. For those interested in participating, please dial (888)233-0826 in the United States or, if outside the United States, +1(973) 935-8877. Participants should use conference ID 84276396, and dial in five minutes before the call is set to begin. There will also be a live audio webcast of the conference at www.edenor.com in the Investor Relations section.
There will be a replay of the conference call available from 08/11/2011 1.00pm BA Time to 08/18/2011 23.59 BA Time. To access the replay, please dial 1(855) 859-2056 or 1(404) 537-3406. The Conference ID: 84276396.
For more information, please access www.edenor.com
| Second Quarter 2011 Page 10 of 16 |
Income Statement
(For the six month period ended June 30, 2011 and 2010
in thousands of U.S. dollars and Argentine Pesos)
For the six month period ended June 30, | ||||||||||||
| 2011 | 2010 | |||||||||||
| Net sales | USD 277,609 | Ps. 1,140,975 | Ps. 1,090,918 | |||||||||
| Electric power purchases | (138,544 | ) | (569,414 | ) | (526,230 | ) | ||||||
| Gross margin | 139,066 | 571,561 | 564,688 | |||||||||
| Transmission and distribution expenses | (98,520 | ) | (404,916 | ) | (301,267 | ) | ||||||
| Selling expenses | (27,707 | ) | (113,874 | ) | (90,333 | ) | ||||||
| Administrative expenses | (20,920 | ) | (85,981 | ) | (80,767 | ) | ||||||
| Net operating (loss) income | (8,080 | ) | (33,210 | ) | 92,321 | |||||||
Financial income (expense) and holding gains (losses): | ||||||||||||
| Gain (loss) in permanent investments | 7,480 | 30,744 | 5 | |||||||||
| Goodwill amortization | 1,444 | 5,935 | 0 | |||||||||
| Generated by assets: | ||||||||||||
| Exchange difference | 2,311 | 9,498 | 5,868 | |||||||||
| Interest | 5,309 | 21,820 | 12,593 | |||||||||
| Exposure to inflation and holding results | (225 | ) | (925 | ) | (5,102 | ) | ||||||
| Tax on financial transactions | (2,084 | ) | (8,564 | ) | (6,833 | ) | ||||||
| Generated by liabilities: | ||||||||||||
| Financial expenses | (1,752 | ) | (7,200 | ) | (7,929 | ) | ||||||
| Exchange difference | (9,861 | ) | (40,527 | ) | (24,483 | ) | ||||||
| Interest expenses | (18,110 | ) | (74,431 | ) | (39,952 | ) | ||||||
| Tax on financial transactions | (3,098 | ) | (12,734 | ) | (10,037 | ) | ||||||
| Adjustment to present value of the notes | 0 | 0 | (1,518 | ) | ||||||||
| Gain/Loss from the repurchased of notes | (4,197 | ) | (17,248 | ) | 0 | |||||||
Adjustment to present value of the retroactive tariff increase arising from the application of the new electricity rate schedule and from the Payment Plan Agreement with the Province of Bs.As. | 285 | 1,170 | 9,359 | |||||||||
| Other income (expenses), net | (4,927 | ) | (20,248 | ) | (8,213 | ) | ||||||
| Income before taxes | (35,504 | ) | (145,920 | ) | 16,079 | |||||||
| Income tax | 12,551 | 51,419 | (17,403 | ) | ||||||||
| Net income | (22,993 | ) | (94,501 | ) | (1,324 | ) | ||||||
*Financial tables have been converted into U.S. dollars at a rate of Ps. 4.11 per dollar, the buying rate as of June 30, 2011, solely for the convenience of the reader.
| Second Quarter 2011 Page 11 of 16 |
Cash Flow Statement
(For the six month period ended June 30, 2011 and 2010
in thousands of U.S. dollars and Argentine Pesos)
| For the six month period ended June 30, | ||||||||||||
2011 | 2010 | |||||||||||
| Net income for the period | USD(22,993) | Ps.(94,501) | Ps.(1,324) | |||||||||
| Adjustment to reconcile net income to net cash flows provided by operating activities: | ||||||||||||
| Depreciation of property, plant and equipment | 22,570 | 92,762 | �� | 88,999 | ||||||||
| Retirement of property, plant and equipment | 62 | 255 | 604 | |||||||||
| Gain from the sale of real property | - | - | - | |||||||||
| Gain from permanent investment | (7,480 | ) | (30,744 | ) | 5 | |||||||
| Goodwill amortization | (1,444 | ) | (5,935 | ) | - | |||||||
| Gain from investments | (4,822 | ) | (19,820 | ) | (9.240 | ) | ||||||
| Adjustment to present value of notes | - | - | 1,518 | |||||||||
| Gain/Loss from the repurchase and redemption of notes | 4,197 | 17,248 | - | |||||||||
| Exchange differences, interest and penalties on loans | 25,987 | 106,805 | 57,150 | |||||||||
| Income tax | (12,511 | ) | (51,419 | ) | 17,403 | |||||||
| Allowance for doubtful accounts | 1,580 | 6,492 | 7,783 | |||||||||
| Allowance for other doubtful account | 146 | 600 | 2,857 | |||||||||
| Adjustment to present value of the retroactive tariff increase arising from the application of the new electricity rate schedule and of the Payment Plan Agreement with the Province of Bs.As | (285 | ) | (1,170 | ) | (9,359 | ) | ||||||
| Changes in operating assets and liabilities: | ||||||||||||
| Net increase in trade receivables | 2,380 | 9,780 | 12,066 | |||||||||
Net increase in other receivables | (7,382 | ) | (30,339 | ) | 22,690 | |||||||
| (Increase) decrease in supplies | (839 | ) | (3,447 | ) | (3,222 | ) | ||||||
| Increase in trade accounts payable | 11,716 | 48,152 | 17,588 | |||||||||
| Increase in salaries and social security taxes | (1,563 | ) | (6,425 | ) | (9,002 | ) | ||||||
| Increase (decrease) in taxes | 4,127 | 16,962 | (37,181 | ) | ||||||||
| Increase in other liabilities | 7,653 | 31,455 | 22,090 | |||||||||
| Increase for funds deriving from the Program for the rational use of electric power (PUREE) | 39,082 | 160,628 | 135,746 | |||||||||
| Net increase in accrued litigation | 1,254 | 5,154 | (2,597 | ) | ||||||||
| Financial interest paid (net of interest capitalized) | (15,810 | ) | (64,980 | ) | (30,977 | ) | ||||||
| Financial interest collected | 5,322 | 21,873 | 11,485 | |||||||||
| Net cash flow provided by operating activities | 50,945 | 209,386 | 295,082 | |||||||||
| Cash Flow from investing activities: | ||||||||||||
| Addition to property, plants and equipment | (32,681 | ) | (134,320 | ) | (193,113 | ) | ||||||
| Acquisition of permanent investments | (137,965 | ) | (567,035 | ) | - | |||||||
| Credits for loans granted to companies | (68,127 | ) | (280,000 | ) | - | |||||||
| Net cash flow used in investing activities | (238,773 | ) | (981,355 | ) | (193,113 | ) | ||||||
| Cash Flow from financing activities: | ||||||||||||
| Increase in loans | 62,305 | 256,074 | (32,488 | ) | ||||||||
| Net cash flows provided by (used in) financing activities | 62,305 | 256,074 | (32,488 | ) | ||||||||
| Cash variations: | ||||||||||||
| Cash at beginning of year | 164,682 | 676,843 | 228,372 | |||||||||
| Cash at end of year | 39,160 | 160,948 | 297,853 | |||||||||
| Net increase (decrease) in cash | (125,522 | ) | (515,895 | ) | 69,481 | |||||||
*Financial tables have been converted into U.S. dollars at a rate of Ps. 4.11 per dollar, the buying rate as of June 30, 2011, solely for the convenience of the reader.
| Second Quarter 2011 Page 12 of 16 |
Balance Sheet
(As of June 30, 2011 and December 31, 2010
in thousands of U.S. dollars and Argentine Pesos)
| As of June 30, | As of December 31, | |||||||||||
2011 | 2010 | |||||||||||
| Current Assets: | ||||||||||||
| Cash and banks | USD 2,712 | Ps.11,146 | Ps.8,611 | |||||||||
| Investments | 36,448 | 149,802 | 668,232 | |||||||||
| Trade receivables | 98,306 | 404,038 | 421,193 | |||||||||
| Other receivables | 88,656 | 364,376 | 43,361 | |||||||||
| Supplies | 3,307 | 13,593 | 12,407 | |||||||||
| Total current assets | 229,429 | 942,955 | 1,153,804 | |||||||||
| Non-Current Assets: | ||||||||||||
| Trade receivables | 11,078 | 45,531 | 45,531 | |||||||||
| Other receivables | 46,128 | 189,586 | 119,249 | |||||||||
| Permanent investments in companies | 139,115 | 571,761 | 415 | |||||||||
| Supplies | 6,207 | 25,510 | 23,249 | |||||||||
| Property, plant and equipment | 907,734 | 3,730,785 | 3,689,482 | |||||||||
| Total non-current assets | 1,110,261 | 4,563,173 | 3,877,926 | |||||||||
| Total assets | 1,339,691 | 5,506,128 | 5,031,730 | |||||||||
| Current Liabilities: | ||||||||||||
| Trade account payable | 103,368 | 424,842 | 378,505 | |||||||||
| Loans | 17,893 | 73,539 | 54,108 | |||||||||
| Salaries and social security taxes | 41,417 | 170,223 | 180,432 | |||||||||
| Taxes | 30,780 | 126,507 | 111,080 | |||||||||
| Other liabilities | 6,901 | 28,364 | 4,542 | |||||||||
| Accrued Litigation | 15,325 | 62,986 | 57,832 | |||||||||
| Total current liabilities | 215,684 | 886,461 | 786,499 | |||||||||
| Non-Current Liabilities: | ||||||||||||
| Trade account payable | 12,846 | 52,799 | 50,984 | |||||||||
| Loans | 323,802 | 1,330,827 | 1,035,113 | |||||||||
| Salaries and social security taxes | 13,240 | 54,417 | 50,633 | |||||||||
| Taxes | 2,032 | 8,352 | 8,989 | |||||||||
| Other liabilities | 280,482 | 1,152,779 | 984,518 | |||||||||
| Accrued Litigation | 1,658 | 6,816 | 6,816 | |||||||||
| Total non-current liabilities | 634,061 | 2,605,990 | 2,137,053 | |||||||||
| Total liabilities | 849,745 | 3,492,451 | 2,923,552 | |||||||||
| Shareholders’ equity | 489,946 | 2,013,677 | 2,108,178 | |||||||||
| Total liabilities and shareholders’ equity | 1,339,691 | 5,506,128 | 5,031,730 | |||||||||
*Financial tables have been converted into U.S. dollars at a rate of Ps. 4.11 per dollar, the buying rate as of June 30, 2011, solely for the convenience of the reader.
| Second Quarter 2011 Page 13 of 16 |
Summary of Financial information in AESEBA (EDEN)
| (AR$ MM, Arg. GAAP) | Year Ended | Six months period ended | |
| 2010 | 2011 | ||
| Net Sales | 467.2 | 290.5 | |
| Electricity Purchases | -329.1 | -191.7 | |
| Gross Margin | 138.1 | 98.8 | |
| S&A Expenses | -84.8 | -46.3 | |
| Other income (expense) | 20.0 | 10.7 | |
| Net Operating Result | 73.1 | 63.2 | |
| EBITDA | 99.3 | 76.8 | |
| Net Interest Expense | -15.0 | -9.9 | |
| Income Tax | -17.7 | -20.2 | |
| Net Income (Loss) | 32.4 | 30.5 |
Summary of Financial information in EMDERSA
| (AR$ MM, Arg. GAAP) | Year Ended | Six months period ended | |
| 2010 | 2010 | 2011 | |
| Net Sales | 744.2 | 358.9 | 394.3 |
| Electricity Purchases | -441.5 | -210.6 | -240.3 |
| Gross Margin | 302.8 | 148.3 | 154.0 |
| S&A Expenses | -177.1 | -77.3 | -107.3 |
| Other income (expense) | 20.5 | 9.9 | 15.5 |
| Net Operating Result | 146.3 | 80.9 | 62.2 |
| EBITDA | 193.0 | 103.0 | 91.0 |
| Net Interest Expense | -42.3 | -15.4 | -28.7 |
| Income Tax | -28.9 | -16.7 | -2.6 |
| Net Income (Loss) | 51.9 | 32.0 | 15.5 |
| Second Quarter 2011 Page 14 of 16 |
Tariff Increases
During June 2011, many of our subsidiaries have been granted with tariff increases applied in all cases to the 1st of June, 2011.
| · | EDESA: On June 15, 2011 through resolution N° 533/11 EDESA was granted a 19.07% tariff increase, which represents a 34.4% increase in VAD. |
| · | EDESAL: On June 15, 2011 through resolution N° 597-MOPeI-2011 EDESAL was granted a 9% tariff increase, which represents a 16.1% increase in VAD. |
| · | EDEN: On June 8, 2011 through resolution N° 415/11 EDEN was granted a 9% tariff increase, which represents a 15.0% increase in VAD. |
Summary of the Distributor’s principal variables
| EDENOR | EDELAR | EDESA | EDESAL | EDEN | |
| Clients | 2.679.349 | 111.141 | 283.107 | 146.048 | 336.694 |
| GWh Demand | 5.754,0 | 207,3 | 352,0 | 272,7 | 775,2 |
| GWh Sold | 4.949,0 | 236,0 | 349,0 | 325,0 | 688,0 |
| % of Wholesale Electricity Market (2010) | 19,9% | 1,0% | 1,5% | 1,3% | 2,7% |
Area (KM2) | 4.637 | 102.635 | 266.472 | 139.954 | 109.141 |
| KWh / Client (monthly) | 615,7 | 707,8 | 410,9 | 741,8 | 681,1 |
| Second Quarter 2011 Page 15 of 16 |
Consolidated Income Statement
(For the six month period ended June 30, 2011 and 2010
in thousands of U.S. dollars and Argentine Pesos)
For the six month period ended June 30, | |||||||||||||
2011 | 2010 | ||||||||||||
| Net sales | USD 394,317 | Ps. 1,620,643 | Ps. 1,090,918 | ||||||||||
| Electric power purchases | (179,891) | (739,354) | (526,230) | ||||||||||
| Gross margin | 214,426 | 881,289 | 564,688 | ||||||||||
| Transmission and distribution expenses | (127,097) | (522,367) | (301,267) | ||||||||||
| Selling expenses | (40,799) | (167,684) | (90,333) | ||||||||||
| Administrative expenses | (33,817) | (138,989) | (80,767) | ||||||||||
| Goodwill amortization | 1,422 | 5,844 | 0 | ||||||||||
| Net operating (loss) income | 14,135 | 58,093 | 92,321 | ||||||||||
Financial income (expense) and holding gains (losses): | |||||||||||||
| Generated by assets: | |||||||||||||
| Exchange difference | 2,348 | 9,651 | 5,868 | ||||||||||
| Interest | 2,005 | 8,241 | 12,593 | ||||||||||
| Exposure to inflation and holding results | 545 | 2,238 | (5,097 | ||||||||||
| Taxes and other expenses | (7,682) | (31,573) | (6,833) | ||||||||||
| Others | (115) | (471) | 0 | ||||||||||
| Impairment of other assets | (18) | (72) | 0 | ||||||||||
| Generated by liabilities: | |||||||||||||
| Exchange difference | (10,393) | (42,716) | (24,483) | ||||||||||
| Interest in related companies | (81) | (334) | 0 | ||||||||||
| Interest expenses | (19,526) | (80,253) | (39,952 | ||||||||||
| Taxes and other expenses | 0 | 0 | (17,966) | ||||||||||
| Results for debt restructuring | (515) | (2,116) | 0 | ||||||||||
| Other financial expenses related companies | (1,507) | (6,194) | 0 | ||||||||||
| Others | (1,210) | (4,975) | 0 | ||||||||||
| Adjustment to present value of the notes | (225) | (925) | (1,518) | ||||||||||
| Gain/Loss from the repurchased of notes | (4,197) | (17,248) | 0 | ||||||||||
| Adjustment to present value of the retroactive tariff increase arising from the application of the new electricity rate schedule and from the Payment Plan Agreement with the Province of Bs.As. | (285) | (1,170) | 9,359 | ||||||||||
| Other income (expenses), net | (3,460) | (14,220) | (8,213) | ||||||||||
| Income before taxes | (30,181) | (124,044) | 16,079 | ||||||||||
| Income tax | 8,634 | 35,484 | (17,403) | ||||||||||
| Investments in third parties | (1,445) | (5,941) | 0 | ||||||||||
| Net income | (22,993) | (94,501) | (1,324) | ||||||||||
*Financial tables have been converted into U.S. dollars at a rate of Ps. 4.11 per dollar, the buying rate as of June 30, 2011, solely for the convenience of the reader.
| Second Quarter 2011 Page 16 of 16 |
Consolidated Balance Sheet
(As of June 30, 2011 and December 31, 2010
in thousands of U.S. dollars and Argentine Pesos)
| As of June 30, | As of December 31, | |||||||||||
2011 | 2010 | |||||||||||
| Current Assets: | ||||||||||||
| Cash and banks | USD 10,075 | Ps.41,408 | Ps.8,611 | |||||||||
| Investments | 45,327 | 186,294 | 668,232 | |||||||||
| Trade receivables | 155,779 | 640,251 | 421,193 | |||||||||
| Other receivables | 23,072 | 94,827 | 43,361 | |||||||||
| Supplies | 4,594 | 18,883 | 12,407 | |||||||||
| Other assets | 208 | 854 | 0 | |||||||||
| Total current assets | 239,055 | 982,517 | 1,153,804 | |||||||||
| Non-Current Assets: | ||||||||||||
| Trade receivables | 11,126 | 45,727 | 45,531 | |||||||||
| Other receivables | 31,328 | 128,759 | 119,249 | |||||||||
| Investments in permanent parties | 98 | 402 | 415 | |||||||||
| Other investments | 23 | 94 | 0 | |||||||||
| Supplies | 6,207 | 25,510 | 23,249 | |||||||||
| Property, plant and equipment | 1,377,412 | 5,661,163 | 3,689,482 | |||||||||
| Goodwill | (116,157 | ) | (477,405 | ) | ||||||||
| Total non-current assets | 1,310,036 | 5,384,250 | 3,877,926 | |||||||||
| Total assets | 1,549,092 | 6,366,767 | 5,031,730 | |||||||||
| Current Liabilities: | ||||||||||||
| Trade account payable | 166,712 | 685,188 | 378,505 | |||||||||
| Loans | 27,120 | 111,462 | 54,108 | |||||||||
| Salaries and social security taxes | 55,491 | 228,069 | 180,432 | |||||||||
| Taxes | 45,516 | 187,069 | 111,080 | |||||||||
| Other liabilities | 27,087 | 111,326 | 4,542 | |||||||||
| Accrued Litigation | 19,712 | 81,017 | 57,832 | |||||||||
| Total current liabilities | 341,638 | 1,404,131 | 786,499 | |||||||||
| Non-Current Liabilities: | ||||||||||||
| Trade account payable | 14,645 | 60,193 | 50,984 | |||||||||
| Loans | 344,981 | 1,417,871 | 1,035,113 | |||||||||
| Salaries and social security taxes | 16,180 | 66,501 | 50,633 | |||||||||
| Taxes | 3,182 | 13,078 | 8,989 | |||||||||
| Other liabilities | 280,482 | 1,152,779 | 984,518 | |||||||||
| Accrued Litigation | 2,408 | 9,897 | 6,816 | |||||||||
| Total non-current liabilities | 661,878 | 2,720,319 | 2,137,053 | |||||||||
| Total liabilities | 1,003,516 | 4,124,450 | 2,923,552 | |||||||||
| Investments in third parties | 55,630 | 228,640 | 0 | |||||||||
| Shareholders’ equity | 489,946 | 2,013,677 | 2,108,178 | |||||||||
| Total liabilities and shareholders’ equity | 1,549,092 | 6,366,767 | 5,031,730 | |||||||||
*Financial tables have been converted into U.S. dollars at a rate of Ps. 4.11 per dollar, the buying rate as of June 30, 2011, solely for the convenience of the reader.