Exhibit 1
 | First Quarter 2013 Page of 1 of 8 |
EDENOR ANNOUNCES FIRST QUARTER 2013 RESULTS | |||
 | Stock Information: NYSE ADR Ratio: 20 Class B = 1 ADR Buenos Aires Stock Exchange | Investor Relations Contacts: Leandro Montero Chief Financial Officer Veronica Gysin Planning and Capital Markets Manager Tel: 5411.4346.5511 | |
 | Ticker: EDN | ||
Buenos Aires, Argentina, May 13, 2013 – Empresa Distribuidora y Comercializadora Norte S.A. (NYSE: EDN; Buenos Aires Stock Exchange: EDN) (“EDENOR” or “the Company”), Argentina’s largest electricity distributor, today announced its results for the first quarter of 2013. All figures are stated in Argentine Pesos and have been prepared in accordance with International Financing Reporting Standards (“IFRS”). Solely for the convenience of the reader, Peso amounts as of and for the period ended March 31, 2013 have been translated into U.S. Dollars at the buying rate for U.S. Dollars quoted by Banco de la Nación Argentina (Banco Nación) on March 31, 2013 of Ps. 5.122.
HIGHLIGHTS
Closing Eden’s transaction
As part of the closing of this transaction, on April 5, 2013, the Trust received as contributions, Argentina's public debt securities for a face value amount equivalent to Ps.262 million considering the market value of each bond at the closing date, and including the guarantee the Company had received at the time of the acceptance of the offer. Moreover, the Purchaser is required to complete contributions on or prior to December 31, 2013, of Argentina´s sovereign bonds for an amount equivalent to approximately Ps. 64 million, taking into account the market value at the closing date. As a result of the liquidation of said securities that are contributed to the Management Trustee, the Company's Class 7 and/or Class 9 Corporate Notes, maturing in 2017 and 2022, respectively, will be purchased.
The disinvestment of AESEBA segment resulted in a loss in Edenor’s Financial Statements as of March 31, 2013 of about Ps. 194.3 million (a Ps. 104.9 million loss after income tax effect). The result from the repurchase of the Edenor´s Corporate Bonds will be recognized at the time the purchase transactions are executed.
As of the date of this quarterly report, the Trust purchased US$ 19.3 million face value of our Notes due 2022 in the open market.
CAMMESA
In order to preserve and guarantee the public service concession and lighten the existing cash deficit, since October 2012 the Company decided to partially cancel with surplus cash balances, the obligations with the wholesale electricity market. This decision arise from the importance to face all the compromises necessary to ensure the provision of public services, including investment plans and ongoing operation and maintenance tasks.
From October 2012 to the date of this quarterly report, Edenor owed Ps. 656 million (45% average of the bills) to Cammesa.
Framework Agreement
In 2013, the Company collected Ps. 1.3 million from the Government of the Province of Buenos Aires, including the bonds with maturity in May, 2014. No other collection habe been made relating.
Note due 2013 amortization
On May 7, 2013, Edenor paid the last amortization and interest coupon of our Note in Pesos due 2013, for an amount of Ps. 5.8 million and Ps. 0.3 million, respectively.
Salary Agreement
Since January 2013, with respect to the salary increases granted in 2012, the Company was required to include in the salaries a fixed amount of $ 2.410. In addition, in February 2013, the Company, the National Authorities and the Electric Light and Power Labor Union entered into a salary agreement for a term of eighteen months which establishes an 18% increase as from January 2013, a 5% non-cumulative increase as from June 2013 and a 7% cumulative increase as from January 2014.

| First Quarter 2013 Page of 2 of 8 |
General Ordinary and Extraordinary Shareholders’ Meeting: Approval of Mandatory Stock Reduction
On April 25, 2013, the general ordinary and extraordinary shareholders’ meeting resolved to reduce Edenor’s capital stock pursuant to Article 206 of the Argentine Corporations Law, which establishes a mandatory capital stock reduction when a company’s losses at any given year exceed 100% of the company’s reserves and more than 50% of its capital stock, and, therefore, the shareholders’ meeting decided to reduce the number of shares maintaining the proportionality of the holdings.
As a consequence of the mandatory capital stock reduction, the losses shall be offset against (i) the totality of the following line items: share premium (prima de emisión) and capital stock adjustment (ajuste sobre el capital social), plus (ii) 10% of the capital stock.
Resolution No. 250/13
On May 9th, the board of directors’ approved the Financial Statements corresponding to the period ended March 31, 2013, pursuant to which the Company recorded, as of such date, a negative shareholders’ equity of Ps.92,253,000, as a result of the reasons and to the extent described in the relevant notes to the Financial Statements as of March 31, 2013 and as of December 31, 2012.
The Company was notified, after the board of directors’ meeting, the Resolution No. 250/13 of the Energy Secretariat which, among other things, would allow to offset the debt that the Company maintains in connection with the Program for the Rational Use of Electricity Power (PUREE) (approximately Ps.1,483.3 million pursuant to such Resolution) with the credits that the Company is entitled to pursuant to the Cost Monitoring Mechanism (CMM) contemplated under the Adjustment and Renegotiation Agreement of our Concession, which credits were not recognized until February 2013 (approximately Ps. 2,237.8 million pursuant to such Resolution). In addition, the Resolution instructs CAMMESA to issue Sale Settlements with Maturity Dates To Be Determined (Liquidaciones de Ventas con Fecha de Vencimiento a Definir) in an amount equal to the excess of the credit to which the Company is entitled over the amount of the debt that the Company maintains in connection with the PUREE, and authorizes CAMMESA to receive such Sale Settlements with Maturity Dates To Be Determined as partial payment for the debt owed by Edenor to CAMMESA as of the date of issuance of the Resolution.
Listing Suspension
On May 10, the Buenos Aires Stock Exchange has resolved to suspend the listing of our shares, pursuant to section 42(d) of the Trading Rules.
After the trading suspension of our stock, in accordance with applicable regulation, that in light of Resolution No. 1/2013 of the Buenos Aires Stock Exchange (“BCBA”), the BCBA has decided to revoke the suspension of listing of the Company’s Class B Common Shares. In addition, the BCBA has decided that the Class B Common Shares will trade on a “Reduced
Trading” (Rueda Reducida) basis pursuant to Section 38, subsection “d” of the Trading Rules of the Buenos Aires Stock Exchange.
| First Quarter 2013 Page of 3 of 8 |
First Quarter 2013 Operating Figures
| OPERATING FIGURES | ||||
| In million of Pesos | 1Q 2013 | 1Q 2012 | % Change vs.2012 | |
| Net Sales | 836.4 | 709.1 | 17.9% | |
| Electric power purchases | (487.9) | (404.4) | 20.6% | |
| Net Operating Loss | (272.6) | (102.3) | 166.5% | |
| Net Loss | (510.4) | (90.7) | 462.7% | |
Net Sales increased 17.9% to Ps. 836.4 million in the first quarter of 2013 from Ps. 709.1 million in the first quarter of 2012, mainly due to the additional income from the Resolution No. 347/12 which represents approximately Ps. 137.4 million, partially offset by a decrease in the volume of energy sold.
Volume of Energy Sold decreased 1.0% to 5,156 GWh in the first quarter of 2013 from 5,209 GWh in the first quarter of 2012, mainly due to a decrease of 5.8% in sales in residential customers.
Electric Power Purchases increased 20.6% to Ps. 487.9 million in the first quarter of 2013 from Ps. 404.4 million in the first quarter of 2012, basically due to an increase in the cost set for mobile generation.
Net Operating Loss increased Ps. 170.3 million, to a loss of Ps. 272.6 million in the first quarter of 2013 from a loss of Ps. 102.3 million in the first quarter of 2012. This negative result was due to the increases in transmission and distribution expenses of Ps. 131.2 million, in selling expenses of Ps. 42.7 million and in administrative expenses of Ps. 18.1 million. These increases were generated by the salaries increases granted in 2013, partially offset by an increase in sales, described above.
Net Loss increased Ps. 419.7 million, to a loss of Ps. 510.4 million in the first quarter of 2013 from a loss of Ps. 90.7 million in the first quarter of 2012, mainly due to an increase in operating expenses and a commercial interests accrued to CAMMESA of Ps. 77.6 million, exchange differences of Ps. 39.4 million and discontinued operations of Ps. 120.4 million basically due to the divestiture of Aeseba.
Adjusted EBITDA
Adjusted EBITDA has decreased to a loss of Ps. 83.6 million as of March 31, 2013 vis à vis a gain of Ps. 19.3 million for the same period of 2012.
| Adjusted Ebitda | ||
| 1Q 2013 | 1Q 2012 | |
| (in million of Pesos) | ||
| Operating Profit | (272.6) | (102.3) |
| Amortization | 51.1 | 47.1 |
| Result participation in subsidiaries | (0.0) | (11.9) |
| EBITDA | (221.5) | (67.1) |
| PUREE | 129.7 | 78.8 |
| Commercial Interests | 8.2 | 7.6 |
| Adjusted EBITDA | (83.6) | 19.3 |
| First Quarter 2013 Page of 4 of 8 |
Discussion of Financial Results:
Operating Expenses
| Transmission & Distribution | Selling | Administrative | Total Expenses | % Variation | ||||||||
| expenses | expenses | expenses | ||||||||||
| 1Q 2013 | 1Q 2012 | % Variation | 1Q 2013 | 1Q 2012 | %Variation | 1Q 2013 | 1Q 2012 | %Variation | Term ended March 31, 2013 | Term ended March 31, 2012 | ||
| Salaries and social security taxes | 173,707 | 95,085 | 82.7% | 43,176 | 22,691 | 90.3% | 32,869 | 29,340 | 12.0% | 249,752 | 147,116 | 69.8% |
| Pension Plan | 3,864 | 3,290 | 17.4% | 977 | 785 | 24.5% | 1,065 | 1,016 | 4.8% | 5,906 | 5,091 | 16.0% |
| Communications Expenses | 1,791 | 1,841 | -2.7% | 7,449 | 4,796 | 55.3% | 360 | 500 | -28.0% | 9,600 | 7,137 | 34.5% |
| Allowance for doubtful accounts | 0 | 0 | 0.0% | 7,918 | 2,922 | 171.0% | — | — | 0.0% | 7,918 | 2,922 | 171.0% |
| Supplies Consumption | 18,041 | 19,307 | -6.6% | — | 410 | -100.0% | 1,299 | 776 | 67.4% | 19,340 | 20,493 | -5.6% |
| Rent and Insurance | 1,689 | 1,170 | 44.4% | — | 95 | -100.0% | 5,253 | 4,253 | 23.5% | 6,942 | 5,518 | 25.8% |
| Security Services | 3,531 | 2,501 | 41.2% | 131 | 179 | -26.8% | 2,166 | 970 | 123.3% | 5,828 | 3,650 | 59.7% |
| Fees and remuneration for services | 141,998 | 103,855 | 36.7% | 36,927 | 30,477 | 21.2% | 25,336 | 15,278 | 65.8% | 204,261 | 149,610 | 36.5% |
| Public Relations and Marketing | 0 | 0 | 0.0% | — | — | 0.0% | 475 | 397 | 19.6% | 475 | 397 | 19.6% |
| Advertising and Sponsorship | 0 | 0 | 0.0% | — | — | 0.0% | 245 | 207 | 18.4% | 245 | 207 | 18.4% |
| Reimbursement to personnel | 174 | 244 | -28.7% | 41 | 132 | -68.9% | 184 | 266 | -30.8% | 399 | 642 | -37.9% |
| Depreciation of property, plant and equipment | 47,298 | 44,644 | 5.9% | 1,947 | 1,816 | 0.0% | 1,813 | 654 | — | 51,058 | 47,114 | 8.4% |
| Directors and Supervisory Committee member´s fees | 0 | 0 | 0.0% | — | — | 0.0% | 630 | 658 | -4.3% | 630 | 658 | -4.3% |
| ENRE penalties | 33,972 | 23,002 | 47.7% | 7,400 | 1,240 | 496.8% | — | — | — | 41,372 | 24,242 | 70.7% |
| Taxes and Charges | 0 | 0 | 0.0% | 7,588 | 5,336 | 42.2% | 1,116 | — | 0.0% | 8,704 | 5,336 | 63.1% |
| Other | 80 | 49 | 63.3% | 7 | 17 | -58.8% | 316 | 667 | -52.6% | 403 | 733 | -45.0% |
| Total | 426,145 | 294,988 | 44.5% | 113,561 | 70,896 | 60.2% | 73,127 | 54,982 | 33.0% | 612,833 | 420,866 | 45.6% |
Sales
The following table shows our energy sales by category of customer (in GWh) and the number of clients for each category:
| Variation | March 2013 Clients | March 2012 Clients | Clients Variation | |||||
| 1Q 2013 | 1Q 2012 | |||||||
| In Gwh | % | In Gwh | % | |||||
| Residential | 2,030 | 39.4% | 2,154 | 41.4% | -5.8% | 2,383,293 | 2,360,588 | 1.0% |
| Small Commercial | 434 | 8.4% | 435 | 8.4% | -0.3% | 312,626 | 308,153 | 1.5% |
| Medium Commercial | 474 | 9.2% | 453 | 8.7% | 4.5% | 30,748 | 30,704 | 0.1% |
| Industrial | 882 | 17.1% | 872 | 16.7% | 1.2% | 6,205 | 6,067 | 2.3% |
| Wheeling System | 1,096 | 21.3% | 1,063 | 20.4% | 3.1% | 710 | 695 | 2.2% |
| Others | ||||||||
| Public Lighting | 154 | 3.0% | 147 | 2.8% | 4.6% | 22 | 22 | 0.0% |
| Shantytowns and Others | 86 | 1.7% | 84 | 1.6% | 2.3% | 378 | 378 | 0.0% |
| Total | 5,156 | 100.0% | 5,209 | 100.0% | -1.0% | 2,733,982 | 2,706,607 | 1.0% |
Capital Expenditures
During the first quarter of 2013, our capital expenditures amounted to Ps. 189.9, compared to Ps. 97.6 million in the first quarter of 2012.
Our capital expenditures in the first quarter of 2013 consisted mainly of the following:
| · | Ps. 147.5 million in new connections due to the increase in our customer base and grid enhancements; |
| · | Ps. 27.3 million in network maintenance and improvements; |
| · | Ps. 2.0 million in legal requirements; |
| · | Ps. 0.8 million in communications and telecontrol; and |
| · | Ps. 12.3 million of other investment projects. |
| First Quarter 2013 Page of 5 of 8 |
PUREE Funds In the first quarter of 2013, PUREE funds increased 64.6%, amounting Ps. 129.7 million vis à vis Ps. 78.8 million in the same period of 2012. 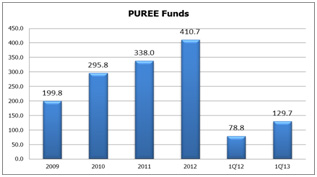 | Energy Losses During the first quarter of 2013 energy losses remained at the same level than the first quarter of 2012. 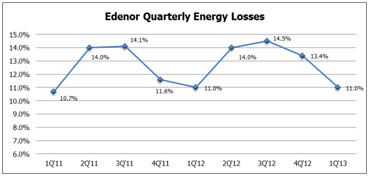 |
Debt Status
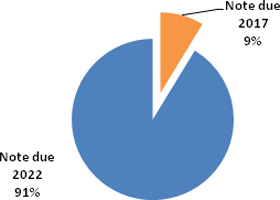
As of today, the outstanding principal amount of our dollar denominated financial debt (net of the senior notes due 2022 that we hold) is US$ 283.3 million, consisting of US$ 24.8 million principal amount of Senior Notes due 2017 and US$ 258.5 million principal amount of Senior Notes due 2022.
| First Quarter 2013 Page of 6 of 8 |
About EDENOR
Empresa Distribuidora y Comercializadora Norte S.A. (Edenor) is the largest electricity distribution company in Argentina in terms of number of customers and electricity sold (both in GWh and Pesos). Through a concession, Edenor distributes electricity exclusively to the northwestern zone of the greater Buenos Aires metropolitan area and the northern part of the city of Buenos Aires, which has a population of approximately 7 million people and an area of 4,637 sq. km. In 2012, Edenor sold 20,760 GWh of energy and purchased 23,934 GWh of energy, with net sales of approximately Ps. 3.0 billion and net loss of Ps. 1,016.5 million.
This press release may contain forward-looking statements. These statements are statements that are not historical facts, and are based on management’s current view and estimates of future economic circumstances, industry conditions, Company performance and financial results. The words “anticipates”, “believes”, “estimates”, “expects”, “plans” and similar expressions, as they relate to the Company are intended to identify forward-looking statements. Such statements reflect the current views of management and are subject to a number of risks and uncertainties, including those identified in the documents filed by the Company with the U.S. Securities and Exchange Commission. There is no guarantee that the expected events, trends or results will actually occur. The statements are based on many assumptions and factors, including general economic and market conditions, industry conditions, and operating factors. Any changes in such assumptions or factors could cause actual results to differ materially from current expectations.
Edenor S.A.
6363 Del Libertador Avenue, 4th Floor
(C1428ARG) Buenos Aires, Argentina
Fax: 5411.4346.5358
investor@edenor.com
www.edenor.com
Conference Call Information
 | There will be a conference call to discuss the Edenor’s quarterly results on Wednesday, May 15, 2013, at 11:00 a.m. Buenos Aires time / 10:00 a.m. New York time. For those interested in participating, please dial 1(877)317-6776 in the United States or, if outside the United States, +1(412) 317-6776 or 0800-444-2930 in Argentina. Participants should use conference ID Edenor and dial in five minutes before the call is set to begin. There will also be a live audio webcast of the conference at www.edenor.com in the Investor Relations section. |
There will be a replay of the conference call available 1 hour after the end of the conference through 05/14/2013 12:00 a.m. NY Time. To access the replay, please dial 1(877) 344-7529 or 1(412) 317-0088. The Conference ID: 10027923.
For more information, please access: www.edenor.com ; www.cnv.gob.ar
| First Quarter 2013 Page of 7 of 8 |
Standalone Income Statement, Cash Flow and Balance Sheet
(For the three month period ended March 31, 2013 and 2012
in thousands of U.S. dollars and Argentine Pesos)*
| Standalone Income Statement | |||
| 31.03.13 | 31.03.12 | ||
| Continuing Operations | US$ | AR$ | AR$ |
| Net sales | 163.291 | 836.379 | 709.109 |
| Electric power purchases | (95.254) | (487.890) | (404.368) |
| Subtotal | 68.038 | 348.489 | 304.741 |
| Transmission and distribution expenses | (273.430) | (426.145) | (294.988) |
| Gross Margin | (21.923) | (77.656) | 9.753 |
| Selling expenses | (22.171) | (113.561) | (70.896) |
| Administrative expenses | (14.277) | (73.127) | (54.982) |
| Other net (expenses) incomes | (1.613) | (8.264) | 1.953 |
| Result participation in subsidiaries | 3 | 17 | 11.875 |
| Operating Result | (53.220) | (272.591) | (102.297) |
| Net financial results | (33.771) | (172.977) | (53.418) |
| Result before income tax | (86.991) | (445.568) | (155.715) |
| Income tax | 6.147 | 31.485 | 40.943 |
| Loss from continuing operations | (80.844) | (414.083) | (114.772) |
| Discontinued operations | (18.811) | (96.351) | 24.088 |
| Loss for the year | (99.655) | (510.434) | (90.684) |
| Basic and diluted loss per share | |||
| Loss per share from continued operations | (0,090) | (0,462) | (0,128) |
| (Loss) Income per share from discontinued operations | (0,021) | (0,107) | 0,027 |
| Standalone Cash Flow | |||
| 31.03.2013 | 31.03.2012 | ||
| Changes in chash and cash equivalents | US$ | AR$ | AR$ |
| Cash and cash equivalents at beginning of year | 19.177 | 98.227 | 98.227 |
| Financial income on cash and cash equivalents | 6.991 | 35.808 | 958 |
| Change in cash and cash equivalents | (13.857) | (70.976) | 67.469 |
| Cash and cash equivalents at end of year | 12.311 | 63.059 | 166.654 |
| Operating activities | |||
| Integral result for the period | (99.655) | (510.434) | (90.684) |
| Net cashflow provided by operating activities | 54.844 | 280.910 | 96.688 |
| Net cash flows used in investing activities | (37.125) | (190.152) | (36.780) |
| Net cash flow (used in) provided by financing activities | (1.307) | (6.693) | 7.561 |
| Increase in cash and cash equivalents | 16.413 | 84.065 | 67.469 |
| Standalone Balance Sheet | |||
| 31.03.2013 | 31.12.2012 | ||
| ASSETS | US$ | AR$ | AR$ |
| Total non-current assets | 889.318 | 4.555.089 | 4.883.088 |
| Total current assets | 232.727 | 1.192.029 | 978.689 |
| Other assets available for sale | 71.755 | 367.528 | 41.518 |
| TOTAL ASSETS | 1.193.800 | 6.114.646 | 5.903.295 |
| TOTAL EQUITY | (18.011) | (92.253) | 418.181 |
| LIABILITIES | |||
| Total non-current liabilities | 761.195 | 3.898.842 | 3.812.330 |
| Total current liabilities | 450.616 | 2.308.057 | 1.672.784 |
| TOTAL LIABILITIES | 1.211.812 | 6.206.899 | 5.485.114 |
| TOTAL LIABILITIES AND EQUITY | 1.193.800 | 6.114.646 | 5.903.295 |
*Financial tables have been converted into U.S. dollars at a rate of Ps. 5.122 per dollar, the buying rate as of March 31, 2013, solely for the convenience of the reader.
| First Quarter 2013 Page of 8 of 8 |
Consolidated Income Statement, Cash Flow and Balance Sheet
(For the three month period ended March 31, 2013 and 2012
in thousands of U.S. dollars and Argentine Pesos)*
| Consolidated Income Statement | |||
| 31.03.13 | 31.03.12 | ||
| US$ | AR$ | AR$ | |
| Net sales | 163.291 | 836.379 | 2.805.817 |
| Electric power purchases | (95.254) | (487.890) | (1.325.458) |
| Subtotal | 68.038 | 348.489 | 1.480.359 |
| Transmission and distribution expenses | (306.535) | (1.570.072) | (1.094.825) |
| Gross Margin | (15.161) | (77.656) | 385.534 |
| Selling expenses | (22.171) | (113.561) | (310.312) |
| Administrative Expenses | (119.655) | (73.169) | (224.316) |
| Other net (expenses) incomes | (1.652) | (8.464) | 27.901 |
| Operating Result | (53.270) | (272.850) | (121.193) |
| Financial incomes | 3.763 | 19.276 | 55.568 |
| Financial expenses | (25.492) | (130.569) | (216.123) |
| Other financial results | (12.005) | (61.488) | (97.214) |
| Net financial results | (33.733) | (172.781) | (257.769) |
| Result before income tax | (87.003) | (445.631) | (378.962) |
| Income tax | 6.147 | 31.485 | (152.971) |
| Profit (Loss) from continuing operations | (80.856) | (414.146) | (531.933) |
| Results of discontinued operations | (18.799) | (96.288) | (139.531) |
| Profit (Loss) for the year | (99.655) | (510.434) | (671.464) |
| Profit (Loss) for the Year attributable to: | |||
| Society owners | (99.655) | (510.434) | (90.684) |
| Non Controlling | — | — | 1.266 |
| Profit (Loss) for the year | (99.655) | (510.434) | (89.418) |
| Profit (Loss) for the year attributable to society owners | |||
| Continued Operations | (80.856) | (414.146) | (164.526) |
| Discontinued Operations | (18.799) | (96.288) | (139.531) |
| (99.655) | (510.434) | (304.057) | |
| Basic and diluted loss per share attributable to sociey owners | |||
| Loss per share from continued operations | (0,090) | (0,460) | (0,150) |
| (Loss) Income per share from discontinued operations | (0,021) | (0,110) | 0,040 |
| Consolidated Cash Flow | ||||
| 31.12.2012 | 31.12.2011 | |||
| Changes in chash and cash equivalents | US$ | AR$ | AR$ | |
| Cash and cash equivalents at beginning of year | 13.883 | 71.108 | 130.509 | |
| Cash and cash equivalents at beginning of the year included in disposal groups classified as held for sale | 2.178 | 11.154 | — | |
| Financial income on cash and cash equivalents | 3.091 | 15.831 | 958 | |
| Change in cash and cash equivalents | 18.130 | 92.863 | 118.571 | |
| Cash and cash equivalents at end of year | 37.282 | 190.956 | 250.038 | |
| Cash and cash equivalents in the finanacial state | 163.030 | 71.108 | 130.509 | |
| Cash and cash equivalents included in assets for sale | 27.926 | 11.154 | 28.305 | |
| Cash and cash equivalents at end of year | 190.956 | 82.262 | 158.814 | |
| Integral result for the period | (99.655) | (510.434) | (89.418) | |
| Net cashflow provided by operating activities | 61.780 | 316.435 | 303.948 | |
| Net cash flows used in investing activities | (39.938) | (220.137) | (116.275) | |
| Net cash flow (used in) provided by financing activities | (671) | (3.435) | (69.102) | |
| (Decrease) Increase in cash and cash equivalents | 18.130 | 92.863 | 118.571 | |
| Consolidated Balance Sheet | |||
| 31.03.2013 | 31.03.2012 | ||
| ASSETS | US$ | AR$ | AR$ |
| Total non-current assets | 889.315 | 4.555.069 | 5.309.090 |
| Total current assets | 232.518 | 1.190.957 | 1.268.952 |
| Other assets available for sale | 272.564 | 1.396.071 | 223.398 |
| TOTAL ASSETS | 1.394.396 | 7.142.097 | 6.801.440 |
| Equity attributable to the owners | (18.011) | (92.253) | 418.181 |
| Non-controlling participation | 14.118 | 72.314 | 71.107 |
| TOTAL EQUITY | (3.893) | (19.939) | 489.288 |
| LIABILITIES | |||
| Total non-current liabilities | 761.195 | 3.898.842 | 4.100.509 |
| Total current liabilities | 450.559 | 2.307.764 | 2.054.376 |
| Liabilities of disposal groups classified as held for sale | 186.535 | 955.430 | 157.267 |
| TOTAL LIABILITIES | 1.398.289 | 7.162.036 | 6.312.152 |
| TOTAL LIABILITIES AND EQUITY | 1.394.396 | 7.142.097 | 6.801.440 |
* Financial tables have been converted into U.S. dollars at a rate of Ps. 5.122 per dollar, the buying rate as of March 31, 2013, solely for the convenience of the reader.