| First Quarter 2014 | |
| Page 1 of 11 |
![]()
Buenos Aires, Argentina, May 14, 2014. Empresa Distribuidora y Comercializadora Norte S.A. (NYSE: EDN; Buenos Aires Stock Exchange: EDN) (“EDENOR” or “the Company”), Argentina’s largest electricity distributor, today announced its results for the first quarter of 2014. All figures are stated in Argentine Pesos and have been prepared in accordance with International Financing Reporting Standards (“IFRS”) on a standalone basis, since the Company has discontinued its operations in subsidiaries. Solely for the convenience of the reader, Peso amounts as of and for the period ended March 31, 2014 have been translated into U.S. Dollars at the buying rate for U.S. Dollars quoted by Banco de la Nación Argentina (Banco Nación) on March, 31, 2014 of Ps. 8.00.
HIGHLIGHTS
AESEBA’S Trust Closing
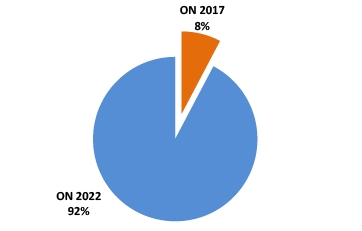
As from the creation of the Trust, the Company’s Senior Notes due 2017 and 2022 have been purchased by U$S 10 million and U$S 68 million of nominal value, respectively, which were subsequently cancelled by Edenor on March 27, 2014. In addition to this, the Company registered during this quarter a profit of Ps. 45 million, included under financial result.
The trust has used all of its available funds and as of the date of this quarterly report, the company has begun the process of dissolution of the trust.
Notes due 2017 and 2022 Interest Coupon Payment
On April 9 and April 25, 2014, Edenor paid the interest coupon of its Notes due 2017 and Notes due 2022, for an amount of U.S. $0.8 million and U.S.$ 8.6 million, respectively.
Agreement for the supply of electric power to Mitre and Sarmiento railway lines.
Pursuant to the agreement signed between the Interior and Transport Ministry, during the first quarter 2014, the Company has received the first installment of Ps. 19.8 million. At the same time, the Company initiated the project and the supply of key materials.
| First Quarter 2014 | |
| Page 2 of 11 |
First Quarter 2014 Operating Figures
Operating Figures | |||
In million of Pesos | 1Q 2014 | 1Q 2013 | % Change vs 13 |
Revenue from Sales | 900.6 | 834.4 | 7.9% |
Electric power Purchases | (439.7) | (487.9) | (9.9%) |
Net Operating Loss | (377.8) | (286.3) | 32.0% |
Net Loss | (738.6) | (510.4) | 45% |
Volume of Energy Soldincreased 0.9 % to 5,204 GWh in the first quarter of 2014 from 5,156 GWh in the first quarter of 2013, mainly due to an increase of 9.3% in sales in residential customers partially offset by a decrease of 8.9 % in medium commercial customers and a 6.5 %% decrease in industrial customers.
Electric Power Purchasesdecreased 9.9% to Ps.439.7 million in the first quarter of 2014 from Ps. 487.9 million in the first quarter of 2013, basically due to a decrease in the cost of mobile generation of Ps. 58.0 million partially offset by an increase in energy losses of Ps. 18.5 million.
Net Operating Lossincreased Ps. 91.5 million, to a loss of Ps. 377.8. million in the first quarter of 2014 from a loss of Ps. 286.3. million in the first quarter of 2013. This negative result was due to the increases in transmission and distribution expenses of Ps. 163.6 million, in selling expenses of Ps. 19.3 million, administrative expenses of Ps. 15.0 million and an increase in other operating expenses, net of Ps. 6.2 million. These increases were generated basically by the salaries increases granted in January 2014 of Ps. 82.5 million, an increase in fees and remuneration for services of Ps. 72.6 million, also mainly related to salary increases to unionized employees and an increase in supplies consumption of Ps. 22.8 million.
Net Lossincreased Ps. 228.1 million to a loss of Ps. 738.6 million in the first quarter of 2014 from a loss of Ps. 510.4 million in the same period of 2013, mainly due the increase in operating costs described above, negative exchange differences of Ps. 260.9 million due to devaluation of US dollars in January 2014, commercial interests accrued to CAMMESA of Ps. 12.9 million and Ps. 18.0 million in income tax loss.
| First Quarter 2014 | |
| Page 3 of 11 |
Adjusted EBITDA
Adjusted EBITDA has decreased to a loss of Ps. 201.0 million as of March 31, 2014 vis à vis a loss of Ps. 97.3 million for the same period of 2013.
EDENOR Adjusted Ebitda |
|
|
| 1Q 2014 | 1Q 2013 |
| ||
| (in million of Pesos) | |
Operating Profit | (377.8) | (286.3) |
Depreciation of PP&E | 55.9 | 51.1 |
EBITDA | (321.9) | (235.2) |
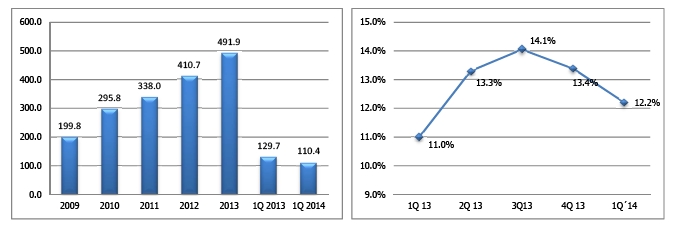
PUREE Funds | 110.4 | 129.7 |
Commercial interests | 10.5 | 8.2 |
Adjusted EBITDA | (201.0) | (97.3) |
Discussion of Financial Results:
Operating Expenses
(in million of Pesos)
| Transmission & Distribution | Selling | Administrative | Total Expenses | % Variation | |||||||
| expenses | expenses | expenses | |||||||||
| 1Q 2014 | 1Q 2013 | % Variation | 1Q 2014 | 1Q 2013 | %Variation | 1Q 2014 | 1Q 2013 |
| Three Month Ended March 31, | ||
| 2014 | 2013 |
| |||||||||
Salaries, Social Security Taxes and Pension Plan | 253.5 | 177.6 | 42.8% | 48.7 | 44.2 | 10.2% | 35.9 | 33.9 | 5.8% | 338.1 | 255.7 | 32.3% |
Communications Expenses | 3.2 | 1.8 | 80.9% | 9.4 | 7.4 | 25.9% | 0.5 | 0.4 | 36.4% | 13.1 | 9.6 | 36.6% |
Allowance for doubtful accounts | 0.0 | 0.0 | 0.0% | 5.3 | 7.9 | (33.0%) | - | - | 0.0% | 5.3 | 7.9 | (33.0%) |
Supplies Consumption | 39.0 | 18.0 | 116.2% | - | - | 0.0% | 3.1 | 1.3 | 139.0% | 42.1 | 19.3 | 117.8% |
Rent and Insurance | 2.7 | 1.7 | 58.0% | - | - | 0.0% | 7.5 | 5.3 | 43.3% | 10.2 | 6.9 | 46.9% |
Security Services | 6.0 | 3.5 | 70.9% | 0.1 | 0.1 | (7.6%) | 4.0 | 2.2 | 85.5% | 10.2 | 5.8 | 74.6% |
Fees and remuneration for services | 191.9 | 142.0 | 35.1% | 53.8 | 36.9 | 45.8% | 31.1 | 25.3 | 22.9% | 276.9 | 204.3 | 35.5% |
Public Relations and Marketing | 0.0 | 0.0 | 0.0% | - | - | 0.0% | 0.4 | 0.5 | (6.1%) | 0.4 | 0.5 | (6.1%) |
Advertising and Sponsorship | 0.0 | 0.0 | 0.0% | - | - | 0.0% | 0.2 | 0.2 | (6.1%) | 0.2 | 0.2 | (6.1%) |
Reimbursement to personnel | 0.3 | 0.2 | 53.4% | 0.0 | 0.0 | 7.3% | 0.3 | 0.2 | 77.2% | 0.6 | 0.4 | 59.6% |
Depreciation of property, plant and equipment | 50.4 | 47.3 | 6.6% | 3.1 | 1.9 | 0.0% | 2.4 | 1.8 | 0.0% | 55.9 | 51.1 | 9.5% |
Directors and Supervisory Committee member´s fees | 0.0 | 0.0 | 0.0% | - | - | 0.0% | 0.7 | 0.6 | 4.3% | 0.7 | 0.6 | 4.3% |
ENRE penalties | 42.6 | 34.0 | 25.5% | 3.1 | 7.4 | (58.0%) | - | - | 0.0% | 45.8 | 41.4 | 10.6% |
Taxes and Charges | 0.0 | 0.0 | 0.0% | 9.3 | 7.6 | 22.8% | 1.6 | 1.1 | 0.0% | 10.9 | 8.7 | 25.7% |
Other | 0.0 | 0.1 | (38.8%) | 0.0 | 0.0 | 200.0% | 0.3 | 0.4 | (5.9%) | 0.4 | 0.4 | (8.5%) |
Total | 589.8 | 426.1 | 38.4% | 132.9 | 113.6 | 17.0% | 88.2 | 73.2 | (5.1%) | 810.9 | 612.9 | 32.3% |
| First Quarter 2014 | |
| Page 4 of 11 |
The following table shows our energy sales by category of customer (in GWh) and the number of clients for each category:
| 1Q 2014 | 1Q 2013 | Variation | March 2014 Customers | March 2013 Customers | Customers Variation | ||
|
|
|
|
| ||||
| In Gwh | % | In Gwh | % | ||||
Residential | 2,219 | 42.6% | 2,030 | 39.4% | 9.3% | 2,403,345 | 2,383,293 | 0.8% |
Small Commercial | 412 | 7.9% | 434 | 8.4% | (5.1%) | 314,653 | 312,626 | 0.6% |
Medium Commercial | 431 | 8.3% | 474 | 9.2% | (8.9%) | 31,913 | 30,748 | 3.8% |
Industrial | 825 | 15.9% | 882 | 17.1% | (6.5%) | 6,421 | 6,205 | 3.5% |
Wheeling System | 1,078 | 20.7% | 1,096 | 21.3% | (1.7%) | 711 | 710 | 0.1% |
Others |
|
|
|
|
|
| ||
Public Lighting | 152 | 2.9% | 154 | 3.0% | (1.5%) | 22 | 22 | 0.0% |
Shantytowns and Others | 87 | 1.7% | 86 | 1.7% | 1.1% | 391 | 378 | 3.4% |
Total | 5,204 | 100.0% | 5,156 | 100.0% | 0.9% | 2,757,456 | 2,733,982 | 0.9% |
During the first quarter of 2014, our capital expenditures amounted to Ps. 275.0 million, compared to Ps. 189.9 million in the first quarter of 2013.
Our capital expenditures in the first quarter of 2014 consisted mainly of the following:
Ps. 207.5 million in new connections due to the increase in our customer base and grid enhancements;
Ps. 41.5 million in network maintenance and improvements;
Ps. 1.5 million in legal requirements;
Ps. 3.1 million in communications and telecontrol; and
Ps. 21.4 million of other investment projects.
| First Quarter 2014 | |
| Page 5 of 11 |
| PUREE Funds | Energy Losses |
| For the period ended March 31, 2014, PUREEfunds decreased 14.9%, amounting Ps 110.4 million vis à visPs. 129.7 million on 2013 first quarter. | In the first quarter of 2014 energy losses increased 1.2%compared to the same quarter in 2013. |
Debt Status
As of of the date of the Financial Statements, the outstanding principal amount of our dollar denominated financial debt is US$ 191.1 million, consisting of US$ 14.8 million principal amount of Senior Notes due 2017 and US$ 176.4 million principal amount of Senior Notes due 2022.
| First Quarter 2014 | |
| Page 6 of 11 |
About EDENOR
Empresa Distribuidora y Comercializadora Norte S.A. (Edenor) is the largest electricity distribution company in Argentina in terms of number of customers and electricity sold (both in GWh and Pesos). Through a concession, Edenor distributes electricity exclusively to the northwestern zone of the greater Buenos Aires metropolitan area and the northern part of the city of Buenos Aires, which has a population of approximately 7 million people and an area of 4,637 sq. km. In 2013, Edenor sold 21,673 GWh of energy and purchased 24,902 GWh of energy, with net sales of approximately Ps. 3.4 billion and net profit of Ps. 771.7 million.
This press release may contain forward-looking statements. These statements are statements that are not historical facts, and are based on management’s current view and estimates of future economic circumstances, industry conditions, Company performance and financial results. The words “anticipates”, “believes”, “estimates”, “expects”, “plans” and similar expressions, as they relate to the Company are intended to identify forward-looking statements. Such statements reflect the current views of management and are subject to a number of risks and uncertainties, including those identified in the documents filed by the Company with the U.S. Securities and Exchange Commission. There is no guarantee that the expected events, trends or results will actually occur. The statements are based on many assumptions and factors, including general economic and market conditions, industry conditions, and operating factors. Any changes in such assumptions or factors could cause actual results to differ materially from current expectations.
Edenor S.A.
6363 Del Libertador Avenue, 4th Floor
(C1428ARG) Buenos Aires, Argentina
Fax: 5411.4346.5358
nvestor@edenor.com
www.edenor.com
Conference Call Information | ||
 | There will be a conference call to discuss Edenor’s quarterly results on Wednesday, May 14, 2014, at 11:00 a.m. Buenos Aires time / 10:00 a.m. New York time. For those interested in participating, please dial + 1(877) 317 - 6776 in the United States or, if outside the United States, +1(412) 317-6717 or 0800-444-2930 in Argentina. Participants should use conference ID Edenor and dial in five minutes before the call is set to begin. There will also be a live audio webcast of the conference at www.edenor.com in the Investor Relations section. There will be a replay of the conference call available 1 hour after the end of the conference through 05/14/2014 12:00 a.m. NY Time. To access the replay, please dial 1(877) 344-7529 or 1(412) 317-0088. The Conference ID: 10045220 For more information, please access:www.edenor.com ; www.cnv.gob.ar |
| First Quarter 2014 | |
| Page 7 of 11 |
Statement of Comprehensive Income (Loss)
(For the period ended March 31, 2014 and 2013
in million of U.S. dollars and Argentine Pesos)
Statement of Comprehensive Income (Loss) | ||||||
| 03.31.2014 |
| 03.31.2013 | |||
| US$ |
| AR$ |
| AR$ | |
Continuing Operations |
|
|
| |||
Revenue from sales | 527.6 | 900.6 |
| 836.4 | ||
Electric power purchases | (54.9) | (439.7) |
| (487.9) | ||
Subtotal | 57.7 |
| 460.9 |
| 348.5 | |
Transmission and distribution expenses | (73.7) | (589.8) |
| (426.1) | ||
Gross (loss) profit | (16.1) |
| (128.9) |
| (77.6) | |
|
|
|
| |||
Selling expenses | (16.6) | (132.9) |
| (113.6) | ||
Administrative expenses | (11.0) | (88.2) |
| (73.2) | ||
Other opertaing expense, net | (3.5) | (28.0) |
| (21.9) | ||
Revenue from customers contributions exempt from devolutions | 0.0 |
| 0.2 |
| 0.0 | |
Operating Loss | (47.2) | (377.8) |
| (286.3) | ||
Financial income | 2.5 | 20.3 |
| 19.3 | ||
Financial expenses | (18.4) | (147.0) |
| (117.2) | ||
Other financial expense | (30.9) |
| (247.5) |
| (61.5) | |
Net financial expense | (46.8) |
| (374.2) |
| (159.4) | |
Loss before taxes | (94.0) |
| (752.1) |
| (445.6) | |
Income tax | 1.7 |
| 13.5 |
| 31.5 | |
Loss for the year from continuing operations | (92.3) |
| (738.6) |
| (414.1) | |
Discontinued OperationS | 0.0 |
| 0.0 |
| (96.3) | |
Lossfor the year | (92.3) |
| (738.6) |
| (510.4) | |
|
|
|
| |||
Loss for the year attributable to: |
|
|
| |||
Owners of the Company | (92.3) |
| (738.6) |
| (510.4) | |
Loss for the year | (92.3) |
| (738.6) |
| (510.4) | |
|
|
|
| |||
Loss for the period attributable to the owners of the parent: |
|
|
| |||
Continuing operations | (92.3) | (738.6) |
| (414.1) | ||
Discontinued operations | 0.0 | 0.0 |
| (96.3) | ||
|
|
|
| |||
|
|
|
| |||
Basic and diluted loss per share attributable to the owners of the parent: |
|
|
| |||
Basic and diluted loss per share from continuing operations | (0.102) | (0.820) |
| (0.460) | ||
Basic and diluted loss per share from discontinued operations |
| 0.000 |
| 0.000 |
| (0.110) |
Financial tables have been converted into U.S. dollars at a rate of Ps. 8.00 per dollar, the buying rate as of March 31, 2014, solely for the convenience of the reader. Certain figures included in this report have been subject to rounding adjustments. Accordingly, any discrepancies between the totals and the sums of amounts are due to rounding.
| First Quarter 2014 | |
| Page 8 of 11 |
Statement of Financial Statement
(For the period ended March 31, 2014 and 2013
in million of U.S. dollars and Argentine Pesos)
Statement of Financial Position | |||||
| 03.31.2014 |
| 03.31.2013 | ||
| US$ |
| AR$ |
| AR$ |
ASSETS |
|
|
|
| |
Non-current assets |
|
|
|
| |
Property, plant and equipment | 675.9 |
| 5,408.2 |
| 5,189.3 |
Interest in joint ventures | 0.0 |
| 0.4 |
| 0.4 |
Other receivables | 27.1 |
| 216.8 |
| 199.4 |
Total non-current assets | 703.1 |
| 5,625.4 |
| 5,389.1 |
|
|
|
|
|
|
Current assets |
|
|
|
|
|
Inventories | 12.4 |
| 99.1 |
| 83.9 |
Other receivables | 64.3 |
| 514.9 |
| 522.1 |
Trade receivables |
|
| 836.8 |
| 803.1 |
Financial assets at fair value through profit or loss | 47.1 |
| 376.5 |
| 216.4 |
Cash and cash equivalents | 14.3 |
| 114.3 |
| 243.5 |
Total current assets | 138.1 |
| 1,941.7 |
| 1,869.0 |
TOTAL ASSETS | 945.8 |
| 7,567.1 |
| 7,258.1 |
|
|
|
|
|
|
EQUITY |
|
|
|
|
|
|
|
|
|
|
|
Capital and reserves attributable to the owners |
|
|
|
|
|
Share capital | 137.6 |
| 897.0 |
| 897.0 |
Adjustment to share capital | 49.7 |
| 397.7 |
| 397.7 |
Additional paid-in capital | 0.4 |
| 3.5 |
| 3.5 |
Treasury stock | 1.2 |
| 9.4 |
| 9.4 |
Adjustment to treasury stock | 1.3 |
| 10.3 |
| 10.3 |
Other comprehensive loss | (3.5) |
| (28.3) |
| (28.3) |
Accumulated deficit | (106.5) |
| (852.0) |
| (113.4) |
TOTAL EQUITY | 54.7 |
| 437.7 |
| 1,176.3 |
Financial tables have been converted into U.S. dollars at a rate of Ps. 8.00 per dollar, the buying rate as of March 31, 2014, solely for the convenience of the reader. Certain figures included in this report have been subject to rounding adjustments. Accordingly, any discrepancies between the totals and the sums of amounts are due to rounding.
| First Quarter 2014 | |
| Page 9 of 11 |
Statement of Financial Statement
(For the period ended March 31, 2014 and 2013
in million of U.S. dollars and Argentine Pesos)(Continued)
|
|
|
|
|
|
| 03.31.2014 |
| 03.31.2013 | ||
| US$ |
| AR$ |
| AR$ |
LIABILITIES |
|
|
|
|
|
Non-current liabilities |
|
|
|
|
|
Trade payables | 30.5 |
| 244.1 |
| 220.8 |
Other payables | 135.9 |
| 1,087.6 |
| 944.7 |
Borrowings | 186.3 |
| 1,490.6 |
| 1,309.9 |
Deferred revenue | 4.2 |
| 33.5 |
| 33.7 |
Salaries and social security taxes payable | 3.3 |
| 26.8 |
| 26.0 |
Benefit plans | 11.6 |
| 92.6 |
| 102.7 |
Deferred tax liability |
|
| 59.9 |
| 73.4 |
Tax liabilities | 0.5 |
| 4.1 |
| 4.4 |
Provisions | 10.4 |
| 83.1 |
| 83.1 |
Total non-current liabilities | 429.3 |
| 3,122.3 |
| 2,798.7 |
|
|
|
|
|
|
Current liabilities |
|
|
|
|
|
Trade payables | 403.8 |
| 3,231.2 |
| 2,481.3 |
Other payables |
|
| 151.1 |
| 147.2 |
Borrowings | 8.8 |
| 70.6 |
| 40.6 |
Salaries and social security taxes payable | 41.7 |
| 333.5 |
| 420.9 |
Benefit plans | - |
| 15.4 |
| - |
Tax liabilities | 23.3 |
| 186.5 |
| 182.5 |
Provisions | 2.3 |
| 18.5 |
| 10.7 |
Total current liabilities | 479.9 |
| 4,006.8 |
| 3,283.2 |
TOTAL LIABILITIES | 909.2 |
| 7,129.1 |
| 6,081.9 |
TOTAL LIABILITIES AND EQUITY | 945.6 |
| 7,566.9 |
| 7,258.2 |
Financial tables have been converted into U.S. dollars at a rate of Ps. 8.00 per dollar, the buying rate as of March 31, 2014, solely for the convenience of the reader. Certain figures included in this report have been subject to rounding adjustments. Accordingly, any discrepancies between the totals and the sums of amounts are due to rounding.
| First Quarter 2014 | |
| Page 10 of 11 |
Cash Flow
(For the period ended March 31, 2014 and 2013
in million of U.S. dollars and Argentine Pesos)
Cash Flow | |||||
| 03.31.2014 |
| 03.31.2013 | ||
| US$ |
| AR$ |
| AR$ |
|
| ||||
Profit (Loss) for the year | 118.5 | (738.6) | (510.4) | ||
Adjustments to reconcile net loss to net cash flows provided by operating activities: |
| ||||
Depreciation of property, plant and equipment | 7.0 | 55.9 | 51.1 | ||
Loss on disposals of property, plant and equipment | 0.0 | 0.2 | 0.4 | ||
Net Accrued Interest | 15.8 | 126.5 | 112.9 | ||
Exchange differences | 39.8 | 318.4 | 57.5 | ||
Income tax | (1.7) | (13.5) | (31.5) | ||
Allowance for the impairment of trade and other receivables, net of recovery | 0.7 | 5.3 | 7.9 | ||
Adjustment to present value ofreceivables | (0.2) | (1.7) | 1.1 | ||
Provision for contingencies | 9.2 | 1.1 | |||
Changes in fair value of financial assets | (3.6) |
| (28.8) |
| (0.1) |
Accrual of benefit plans | 1.1 |
| 9.0 |
| 5.9 |
Net Gain from the repurchase of Corporate Notes | (5.6) |
| (45.0) |
| - |
Discontinued operations | - |
| - |
| 133.3 |
Changes in operating assets and liabilities: |
|
|
|
|
|
Increase in trade receivables | (3.5) |
| (28.4) |
| (38.6) |
Increase in other receivables | (0.6) |
| (5.0) |
| (87.3) |
Increase in inventories | (1.9) |
| (15.2) |
| (9.6) |
Decrease in deferred revenue | (0.0) |
| (0.2) |
| - |
Decrease in trade payables | (8.1) |
| (64.5) |
| (20.0) |
(Decrease) /Increase in salaries and social security taxes payable | (10.8) |
| (86.5) |
| 0.2 |
Decrease in benefit plans | (0.5) |
| (3.7) |
| (4.1) |
Increase in tax liabilities | 0.2 | 1.5 |
| 67.1 | |
Increase in other payables | 4.3 | 34.7 |
| 35.4 | |
Funds obtained from the program for the rational use of electric power (PUREE) (Res SE No. 1037/07) | 13.8 | 110.4 | 129.7 | ||
Net decrease in provisions | (0.2) |
| (1.4) |
| (2.7) |
Subtotal before Cammesa financing | (45.2) |
| (361.3) |
| (101.0) |
Net Increase for funds obtained - Cammesa financing | 90.7 |
| 725.5 |
| 423.7 |
Net cash flows provided by operating activities | 45.5 |
| 364.2 |
| 322.7 |
Financial tables have been converted into U.S. dollars at a rate of Ps. 8.00 per dollar, the buying rate as of March 31, 2014, solely for the convenience of the reader. Certain figures included in this report have been subject to rounding adjustments. Accordingly, any discrepancies between the totals and the sums of amounts are due to rounding.
| First Quarter 2014 | |
| Page 11 of 11 |
Cash Flow
(For the period ended March 31, 2014 and 2013
in million of U.S. dollars and Argentine Pesos)(Continued)
|
| ||||
| 03.31.2014 |
| 03.31.2013 | ||
| US$ |
| AR$ |
| AR$ |
Cash flows from investing activities |
| ||||
Acquisitions of property, plant and equipment | (34.0) | (271.8) | (180.5) | ||
Net (payment for) collection of purchase / sale of financial assets at fair value | (28.8) | (230.7) | (15.6) | ||
Advance payment received for the sale of related parties | - | - | 15.4 | ||
Discontinued operations | - |
| - |
| (30.1) |
Net cash flows used in investing activities | (62.8) |
| (502.5) |
| (210.8) |
|
| ||||
Cash flow from financing activities |
| ||||
Repayment of principal on loans | (0.0) | (0.2) | (6.0) | ||
Payment of interest on loans | (0.0) | (0.0) | (0.7) | ||
Discontinued operations | - |
| - |
| 3.3 |
Net cash flows used in financing activities | (0.0) | (0.2) | (3.4) | ||
|
| ||||
Net (decrease) / increase in cash and cash equivalents | (17.3) |
| (138.5) |
| 108.5 |
|
| ||||
Cash and cash equivalents at beginning of year | 10.9 | 243.5 | 71.1 | ||
Cash and cash equivalents at beginning of year included in assets of disposal group classified as held for sale | - | - | 11.2 | ||
Exchange Differences in cash and cash equivalents | 1.2 | 9.4 | 0.2 | ||
Net (decrease) / increase in cash and cash equivalents | (17.3) |
| (138.5) |
| 108.5 |
Cash and cash equivalents at year end | 37.3 |
| 114.3 |
| 191.0 |
|
| ||||
Cash and cash equivalents at year end in the statement of financial position | 14.3 | 114.3 | 163.0 | ||
Cash and cash equivalents at year end included in assets of disposal group classified as held for sale | - | - | 27.9 | ||
Cash and cash equivalents at year end | 37.3 |
| 114.3 |
| 191.0 |
Financial tables have been converted into U.S. dollars at a rate of Ps. 8.00 per dollar, the buying rate as of March 31, 2014, solely for the convenience of the reader. Certain figures included in this report have been subject to rounding adjustments. Accordingly, any discrepancies between the totals and the sums of amounts are due to rounding.
Empresa Distribuidora y Comercializadora Norte S.A. | ||
| By: | /s/ Leandro Montero | |
| Leandro Montero | ||
| Chief Financial Officer | ||