![]()
 | Second Quarter 2014 |
Page 1 | |

Buenos Aires, Argentina, August 11, 2014. Empresa Distribuidora y Comercializadora Norte S.A. (NYSE: EDN; Buenos Aires Stock Exchange: EDN) (“EDENOR” or “the Company”), Argentina’s largest electricity distributor, today announced its results for the second quarter of 2014. All figures are stated in Argentine Pesos and have been prepared in accordance with International Financing Reporting Standards (“IFRS”) on a standalone basis. Solely for the convenience of the reader, Peso amounts as of and for the quarter ended on June 30, 2014 have been translated into U.S. Dollars at the ask price quoted by Banco de la Nación Argentina of Ps. 8.133 per U.S. Dollar.
HIGHLIGHTS
SE Note No. 4,012/14
On June 2014, the scope of SE Resolution No. 250/13 and SE Note No. 6,852/13 was extended by the Secretariat of Energy pursuant to SE Note No. 4,012/14, by which the Company recorded an income of Ps. 735.5 million and net interests of Ps. 108.2 million for the period October 2013 – March 2014 of recognition of higher costs owed under the Cost Monitoring Mechanism (CMM) which had a positive impact on the operating result but it did not imply in any cash inflow, allowing to partially reduce the debt with CAMMESA for Ps. 1,038.0 million
Also, the Company was authorized to offset the CMM recognition with the debt registered under the PUREE (Programa de Uso Racional de la Energía Eléctrica) for the period due March 2014, for the amount of Ps. 168.4 million.
Cost Monitoring Mechanism (CMM)
With respect to the Company’s tariff situation, as of today we have requested thirteen additional increases under the CMM beginning in May 2008, twelve of which have been recognized by the ENRE pursuant to SE Resolution No.250/13, Note No. 6852/13 and Note No. 4012/14 of the Secretary of Energy with retroactive effect as of May 2008 until March 2014. However, these increases have not yet been incorporated into our tariff structure. Under the terms of the Adjustment Agreement, these thirteen increases should have been incorporated into our tariff structure in May and November of each year from 2008 onwards.
Salary Increases
On May 2014, The Ministry of Labor issued Resolution 836/14 by which it established a wage increase for unionized workers of 15% (retroactive to May 2014) and a cumulative 10% increase in July 2014 plus increases in seniority.
Loan and Pledged Credits Assignment Agreement with CAMMESA
On July 2014, the Company subscribed a financial and pledged credits assignment Agreement with CAMMESA, by which the Company would receive the necessary funds to cope with the salary increases described above. The future Sale Settlements with Maturity Dates to be Determined (Liquidaciones de Venta con Fecha de Vencimiento a Definir - LVFVD) to be issued pursuant to Resolution SE 250/13 will be pledged for the loans provided. As of today, the Company has received the first installment of Ps. 90.0 million from CAMMESA.
| Second Quarter 2014 |
Page 2 | |
Second Quarter 2014 Operating Figures
In million of Pesos | 2Q 2014 | 2Q 2013 | % Change vs 13 |
Revenue from Sales | 852.7 | 820.4 | +3.9% |
Electricity Power Purchases | (469.2) | (505.7) | -7.2% |
Net Operating Loss before CMM Recognition | (661.9) | (408.2) | +62.2% |
Net Income | 15.8 | 1,816.9 | -99.1% |
Revenue from Salesincreased 3.9% to Ps. 852.7 million in the second quarter of 2014 from Ps. 820.4 million in the second quarter of 2013, mainly due to an increase in the volume of energy sold.
Volume of Energy Soldincreased 0.6% to 5,304 GWh in the second quarter of 2014 from 5,272 GWh in the second quarter of 2013, mainly due to an increase of 6.9% in sales in residential customers partially compensated by a decrease of 13.4% in medium commercial customers.
Electricity Power Purchasesdecreased 7.2% to Ps. 469.2 million in the second quarter of 2014 from Ps. 505.7 million in the second quarter of 2013, mainly due to a decrease in the cost of mobile generation which was partially recognized as distributed electricity since November 2013.
Net Operating Loss before CMM Recognitionincreased Ps. 253.8 million to a loss of Ps. 661.9 million in the second quarter of 2014, compared to a loss of Ps. 408.2 million in the same period of 2013. This negative result was due to the increases in transmission and distribution expenses of Ps. 264.3 million and administrative expenses of Ps. 21.8 million and other net expenses of Ps. 39.1 million, partially offset by a decrease in selling expenses of Ps. 2.4 million. These increases were mainly due to the salaries raises amounting 7% from January 2014 and an additional 15% effective from May 2014 under Resolution 836/14 from the Ministry of Labor, which had an estimated impact of Ps. 217.6 million, an increase in third party fees of Ps. 19.8 million, also related to salary increases to unionized employees and an increase in consumption of materials of Ps. 38.8 million.
Net Incomedecreased Ps.1,801.2 million to a profit of Ps. 15.8 million in the second quarter of 2014, compared to a profit of Ps.1,816.9 million in the same period of 2013, mainly due to the difference in the partial recognition of CMM pursuant to Resolution SE 250/13 and additional notes of Ps. 1,477.1 million since the effect in 2013 included the full amount for the period May 2008 – February 2013, an increase in commercial interests of Ps. 187.1 million and the increase in costs described above partially offset by Income tax gain of Ps. 176.5 and positive exchange differences of Ps. 37.3 million.
| Second Quarter 2014 |
Page 3 | |
Adjusted EBITDA
Adjusted EBITDA has decreased to a loss of Ps. 479.4 million as of June 30, 2014 vis à vis a loss of Ps. 193.6 million for the same period of 2013.
| 2Q 2014 | 2Q 2013 | |
| (in million of Pesos) | ||
Net Operating Loss before CMM Recognition | (661.9) | (408.2) |
Depreciation of PP&E | 57.9 | 53.3 |
EBITDA | (604.1) | (354.8) |
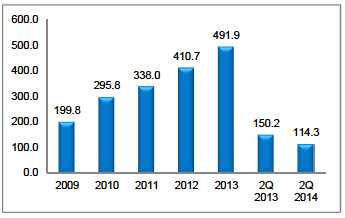
PUREE Funds | 114.3 | 150.2 |
Commercial interests | 10.4 | 11.1 |
Adjusted EBITDA | (479.4) | (193.6) |
Discussion of Financial Results:
Operating Expenses
| In million of Pesos and % | ||||||||||||
| Transmission & Distribution expenses | Selling expenses | Administrative expenses | Total Expenses | % Variation | ||||||||
| 2Q 2014 | 2Q 2013 | % Variation | 2Q 2014 | 2Q 2013 | %Variation | 2Q 2014 | 2Q 2013 | %Variation | 6 Months Ended June 30, | |||
| 2014 | 2013 | |||||||||||
| Salaries, Social Security Taxes and Pension Plan | 357.9 | 178.1 | 101.0% | 57.9 | 42.0 | 37.9% | 57.5 | 35.6 | 61.3% | 811.5 | 511.4 | 58.7% |
| Communications Expenses | 2.5 | 1.7 | 45.1% | 10.4 | 8.2 | 26.4% | 0.8 | 0.4 | 106.3% | 26.7 | 19.9 | 34.5% |
| Allowance for doubtful accounts | 0.0 | 0.0 | 0.0% | -3.3 | 19.5 | (117.2%) | - | - | 0.0% | 2.0 | 27.4 | (92.9%) |
| Supplies Consumption | 61.6 | 24.1 | 155.5% | - | - | 0.0% | 2.7 | 1.5 | 87.9% | 106.5 | 44.9 | 137.0% |
| Rent and Insurance | 2.1 | 1.6 | 25.5% | - | - | 0.0% | 8.0 | 5.3 | 51.4% | 20.2 | 13.9 | 46.1% |
| Security Services | 5.6 | 3.3 | 69.2% | 0.0 | 0.2 | (75.5%) | 2.3 | 2.4 | (3.3%) | 18.1 | 11.7 | 55.3% |
| Fees and remuneration for services | 170.6 | 160.1 | 6.6% | 65.8 | 48.1 | 36.7% | 28.7 | 37.0 | (22.5%) | 542.0 | 449.5 | 20.6% |
| Public Relations and Marketing | 0.0 | 0.0 | 0.0% | - | - | 0.0% | 2.1 | 0.6 | 268.0% | 2.5 | 1.0 | 143.5% |
| Advertising and Sponsorship | 0.0 | 0.0 | 0.0% | - | - | 0.0% | 1.1 | 0.3 | 268.0% | 1.3 | 0.5 | 143.4% |
| Reimbursement to personnel | 0.3 | 0.2 | 49.5% | 0.2 | 0.0 | 368.8% | 0.4 | 0.2 | 78.4% | 1.5 | 0.9 | 73.5% |
| Depreciation of property, plant and equipment | 51.3 | 49.1 | 4.4% | 4.1 | 2.3 | 75.7% | 2.5 | 1.9 | 32.9% | 113.8 | 104.4 | 9.0% |
| Directors and Supervisory Committee member´s fees | 0.0 | 0.0 | 0.0% | - | - | 0.0% | 0.8 | 0.6 | 21.4% | 1.4 | 1.3 | 12.9% |
| ENRE penalties | 73.2 | 42.6 | 71.9% | 2.7 | 21.2 | (87.4%) | - | - | 0.0% | 121.7 | 105.2 | 15.7% |
| Taxes and Charges | 0.0 | 0.0 | 0.0% | 9.3 | 7.8 | 20.0% | 1.8 | 1.3 | 41.1% | 22.1 | 17.8 | 24.3% |
| Other | 0.1 | 0.1 | 23.2% | 0.0 | 0.0 | 83.3% | 0.5 | 0.3 | 62.7% | 1.0 | 0.8 | 20.0% |
| Total | 725.2 | 461.0 | 57.3% | 146.9 | 149.3 | (1.6%) | 109.1 | 87.3 | 25.0% | 1,792.2 | 1,310.5 | 36.8% |
| Second Quarter 2014 |
Page 4 | |
Sales
The following table shows our energy sales by category of customer (in GWh) and the number of clients for each category:
2Q 2014 | 2Q 2013 | Variation | June 2014 Customers | June 2013 Customers | |||
| In Gwh | % | In Gwh | % | ||||
Residential | 2,283 | 43.0% | 2,136 | 40.5% | 6.9% | 2,429,998 | 2,397,271 |
Small Commercial | 449 | 8.5% | 440 | 8.3% | 2.1% | 314,069 | 312,826 |
Medium Commercial | 406 | 7.7% | 469 | 8.9% | (13.4%) | 32,717 | 31,820 |
Industrial | 831 | 15.7% | 844 | 16.0% | (1.5%) | 6,443 | 6,261 |
Wheeling System | 1,033 | 19.5% | 1,071 | 20.3% | (3.6%) | 678 | 728 |
Others | |||||||
Public Lighting | 190 | 3.6% | 194 | 3.7% | (2.1%) | 22 | 22 |
Shantytowns and | |||||||
Others | 112 | 2.1% | 118 | 2.2% | (5.0%) | 394 | 380 |
Total | 5,304 | 100% | 5,272 | 100.0% | 0.6% | 2,784,321 | 2,749,308 |
Capital Expenditures
Edenor’s capital expenditures during the second quarter of 2014 totaled Ps. 368.8 million, compared to Ps. 279.6 million in the second quarter of 2013. This increase was mainly due to the increase in costs and key facilities for ensuring the proper service provision.
Our capital expenditures in the second quarter of 2014 consisted mainly of the following:
- Ps. 27.4 million in new connections;
- Ps. 260.8 million in grid enhancements;
- Ps. 41.1 million in network maintenance and improvements;
- Ps. 2.4 million in legal requirements;
- Ps. 14.2 million in communications and telecontrol; and
- Ps. 22.9 million of other investment projects.
For the six-month period ended June 30, 2014, our Capital Expenditures totalized to Ps. 643.8 million compared to Ps.469.5 million in 2013, including capitalized costs in property, plant and equipment.
| Second Quarter 2014 |
Page 5 | |
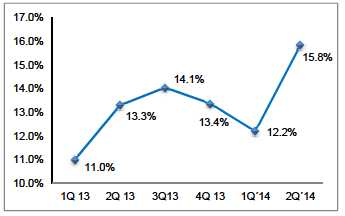
PUREE Funds For the second quarter of 2014 PUREE funds decreased 23.9%, amounting Ps.114.3 million vis à vis Ps. 114.3 million in the for the second quarter of 2013. | Energy Losses In the second quarter of 2014 energy losses increased to 15.8% compared to 13.3% recorded in the same quarter of 2013. | |
|
|
Indebtedness
For the period ended June 30, 2014, the Company’s indebtedness amounted to US$ 190.5 million, net of issuance of costs and including accrued interests. The company’s cash1stood at US$ 40.0 million. As a result of the outstanding debt and cash, net debt as of June 30, 2014 was US$ 150.6 million.
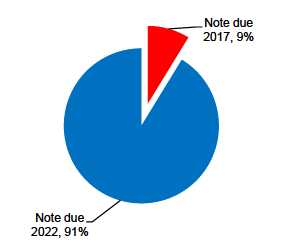
The outstanding principal amount of our dollar denominated financial debt is US$ 191.1 million, consisting of US$ 14.8 million principal amount of Senior Notes due 2017 and US$ 176.4 million principal amount of Senior Notes due 2022.
| 1Defined as cash and cash equivalents plus financial assets at fair value. | |||
| Second Quarter 2014 |
Page 6 | |
About EDENOR
Empresa Distribuidora y Comercializadora Norte S.A. (Edenor) is the largest electricity distribution company in Argentina in terms of number of customers and electricity sold (both in GWh and Pesos). Through a concession, Edenor distributes electricity exclusively to the northwestern zone of the greater Buenos Aires metropolitan area and the northern part of the city of Buenos Aires, which has a population of approximately 7 million people and an area of 4,637 sq. km. In 2013, Edenor sold 21,673 GWh of energy and purchased 24,902 GWh of energy, with net sales of approximately Ps. 3.4 billion and net profit of Ps. 771.7 million.
This press release may contain forward-looking statements. These statements are statements that are not historical facts, and are based on management’s current view and estimates of future economic circumstances, industry conditions, Company performance and financial results. The words “anticipates”, “believes”, “estimates”, “expects”, “plans” and similar expressions, as they relate to the Company are intended to identify forward-looking statements. Such statements reflect the current views of management and are subject to a number of risks and uncertainties, including those identified in the documents filed by the Company with the U.S. Securities and Exchange Commission. There is no guarantee that the expected events, trends or results will actually occur. The statements are based on many assumptions and factors, including general economic and market conditions, industry conditions, and operating factors. Any changes in such assumptions or factors could cause actual results to differ materially from current expectations.
Edenor S.A.
6363 Del Libertador Avenue, 4th Floor
(C1428ARG) Buenos Aires, Argentina
Fax: 5411.4346.5358
investor@edenor.com
www.edenor.com
Conference Call Information
 | There will be a conference call to discuss Edenor’s quarterly results on Wednesday, August 13, 2014, at 11:00 a.m. Buenos Aires time / 10:00 a.m. New York time. For those interested in participating, please dial + 1(877) 317 - 6776 in the United States or, if outside the United States, +1(412) 317-6776 or 0800-444-2930 in Argentina. Participants should use conference ID Edenor and dial in five minutes before the call is set to begin. There will also be a live audio webcast of the conference atwww.edenor.comin the Investor Relations section. For additional information on the Company please access:www.edenor.com; www.cnv.gob.ar |
| Second Quarter 2014 |
Page 7 | |
Condensed Interim Statements of Financial Position
as of June 30, 2014 and December 31, 2013
Million of U.S Dollars and Argentine Pesos | 06.30.14 | 06.30.14 | 12.31.13 | ||
ASSETS | |||||
| US$ | AR$ | AR$ | ||
Non-current assets | |||||
Property, plant and equipment | 703.2 | 5,719.0 | 5,189.3 | ||
Interest in joint ventures | 0.1 | 0.4 | 0.4 | ||
Other receivables | 28.0 | 227.7 | 199.4 | ||
Total non-current assets | 731.2 | 5,947.2 | 5,389.1 | ||
Current assets | |||||
Inventories | 14.0 | 114.2 | 83.9 | ||
Other receivables | 20.3 | 165.2 | 522.1 | ||
Trade receivables | 104.8 | 852.1 | 803.1 | ||
Financial assets at fair value through profit or loss | 20.1 | 163.7 | 216.4 | ||
Cash and cash equivalents | 19.8 | 161.4 | 243.5 | ||
Total current assets | 179.1 | 1,456.6 | 1,869.0 | ||
TOTAL ASSETS | 910.3 | 7,403.8 | 7,258.1 | ||
EQUITY | |||||
Share capital | 110.3 | 897.0 | 897.0 | ||
Adjustment to share capital | 48.9 | 397.7 | 397.7 | ||
Additional paid-in capital | 0.4 | 3.5 | 3.5 | ||
Treasury stock | 1.2 | 9.4 | 9.4 | ||
Adjustment to treasury stock | 1.3 | 10.3 | 10.3 | ||
Other comprehensive loss | (3.5) | (28.3) | (28.3) | ||
Accumulated deficit | (102.8) | (836.2) | (113.4) | ||
TOTAL EQUITY | 55.8 | 453.5 | 1,176.3 | ||
LIABILITIES | |||||
Non-current liabilities | |||||
Trade payables | 29.1 | 236.3 | 220.8 | ||
Other payables | 138.9 | 1,129.4 | 944.7 | ||
Borrowings | 186.5 | 1,516.6 | 1,309.9 | ||
Deferred revenue | 4.0 | 32.5 | 33.7 | ||
Salaries and social security taxes payable | 3.7 | 30.3 | 26.0 | ||
Benefit plans | 13.1 | 106.6 | 102.7 | ||
Deferred tax liability | 4.0 | 32.5 | 73.4 | ||
Tax liabilities | 0.5 | 3.8 | 4.4 | ||
Provisions | 10.2 | 83.1 | 83.1 | ||
Total non-current liabilities | 389.9 | 3,171.2 | 2,798.7 | ||
Current liabilities | - | ||||
Trade payables | 363.5 | 2,956.4 | 2,481.3 | ||
Other payables | 12.0 | 97.4 | 147.2 | ||
Borrowings | 4.1 | 33.0 | 40.6 | ||
Deferred revenue | 0.1 | 0.8 | - | ||
Salaries and social security taxes payable | 55.8 | 454.1 | 420.9 | ||
Benefit plans | 1.2 | 9.6 | - | ||
Tax liabilities | 21.9 | 178.2 | 182.5 | ||
Provisions | 6.1 | 49.5 | 10.7 | ||
Total current liabilities | 464.7 | 3,779.1 | 3,283.1 | ||
TOTAL LIABILITIES | 854.6 | 6,950.3 | 6,081.8 | ||
TOTAL LIABILITIES AND EQUITY | 910.3 | 7,403.8 | 7,258.1 | ||
Financial tables have been converted into U.S. dollars at a rate of Ps. 8.133 per dollar, the buying rate as of June 30, 2014, solely for the convenience of the reader.
| Second Quarter 2014 |
Page 8 | |
Condensed Interim Statements of Comprehensive (Loss) Income
for the six-month periods ended June 30, 2014 and 2013.
Million of U.S Dollars and Argentine Pesos | 06.30.14 | 06.30.14 | 06.30.13 | ||
| US$ | AR$ | AR$ | |||
| Continuing operations | |||||
| Revenue from sales | 215.6 | 1,753.2 | 1,656.8 | ||
| Electric power purchases | (111.8) | (908.9) | (993.6) | ||
| Subtotal | 103.8 | 844.3 | 663.2 | ||
| Transmission and distribution expenses | (161.7) | (1,315.0) | (887.1) | ||
| Gross loss | (57.9) | (470.7) | (223.9) | ||
| Selling expenses | (34.4) | (279.8) | (262.9) | ||
| Administrative expenses | (24.3) | (197.3) | (160.5) | ||
| Other operating expense, net | (11.4) | (92.4) | (47.1) | ||
| Gain from interest in joint ventures | 0.0 | 0.0 | 0.0 | ||
| Revenue from non-reimbursable customer | |||||
| contributions | 0.0 | 0.4 | - | ||
| Operating loss before SE Resolution 250/13 and SE Notes | |||||
| 6852/13 and 4012/14 | (127.8) | (1,039.8) | (694.4) | ||
| Higher costs recognition - SE Resolution 250/13 and SE Notes | |||||
| 6852/13 and 4012/14 | 90.4 | 735.5 | 2,212.6 | ||
| Operating (loss) profit | (37.4) | (304.2) | 1,518.2 | ||
| Financial income | 18.7 | 151.7 | 214.2 | ||
| Financial expenses | (42.0) | (341.8) | (135.9) | ||
| Other financial expense | (33.1) | (269.4) | (85.7) | ||
| Net financial expense (income) | (56.5) | (459.5) | (7.4) | ||
| (Loss) Profit before taxes | (93.9) | (763.7) | 1,510.8 | ||
| Income tax | 5.0 | 40.9 | (117.6) | ||
| (Loss) Profit for the period from continuing operations | |||||
| (88.9) | (722.8) | 1,393.2 | |||
| Discontinued operations | - | - | (88.3) | ||
| (Loss) Profit for the period | (88.9) | (722.8) | 1,304.9 | ||
| Owners of the Company | (88.9) | (722.8) | 1,303.4 | ||
| Non-controlling interests | - | - | 1.6 | ||
| (Loss) Profit for the period | (88.9) | (722.8) | 1,304.9 | ||
| - | |||||
| (Loss) Profit for the period attributable to the owners of the | |||||
| parent | |||||
| Continuing operations | (88.9) | (722.8) | 1,393.2 | ||
| Discontinued operations | - | - | (89.9) | ||
| Basic and diluted (loss) earnings per share: | |||||
| Basic and diluted (loss) earnings per share from | |||||
| continuing operations | (0.099) | (0.806) | 1.550 | ||
| Basic and diluted (loss) earnings per share from | |||||
| discontinued operations | - | - | (0.100) | ||
Financial tables have been converted into U.S. dollars at a rate of Ps. 8.133 per dollar, the ask price as of June 30, 2014, solely for the convenience of the reader.
| Second Quarter 2014 |
Page 9 | |
Condensed Interim Statements of Cash Flows
for the six-month periods ended June 30, 2014 and 2013
Million of U.S Dollars and Argentine Pesos | 06.30.14 | 06.30.14 | 06.30.13 | ||
| US$ | AR$ | AR$ | |||
Cash flows from operating activities | |||||
(Loss) Profit for the period | (88.9) | (722.8) | 1,304.9 | ||
Adjustments to reconcile net (loss) profit to net cash flows provided by | |||||
operating activities: | - | ||||
Depreciation of property, plant and equipment | 14.0 | 113.8 | 104.4 | ||
Loss on disposals of property, plant and equipment | 0.0 | 0.3 | 0.4 | ||
Net accrued interest | 23.3 | 189.5 | (59.9) | ||
Exchange differences | 42.7 | 347.3 | 123.7 | ||
Income tax | (5.0) | (40.9) | 117.6 | ||
Allowance for the impairment of trade and other receivables, net of recovery | 0.0 | 0.1 | 27.4 | ||
Adjustment to present value of receivables | (0.5) | (3.7) | 0.2 | ||
Provision for contingencies | 5.8 | 47.2 | 4.8 | ||
Changes in fair value of financial assets | (4.8) | (39.4) | (0.8) | ||
Accrual of benefit plans | 2.2 | 18.0 | 11.8 | ||
Gain from interest in joint ventures | (0.0) | (0.0) | (0.0) | ||
Higher costs recognition - SE Resolution 250/13 and SE Notes 6852/13 and | |||||
4012/14 | (90.4) | (735.5) | (2,212.6) | ||
Net gain from the repurchase of Corporate Notes | (5.5) | (44.5) | (43.7) | ||
Discontinued operations | - | - | 139.2 | ||
Changes in operating assets and liabilities: | - | ||||
Increase in trade receivables | (3.7) | (29.8) | (24.4) | ||
Increase in other receivables | (3.4) | (27.9) | (52.5) | ||
Increase in inventories | (3.7) | (30.4) | (17.7) | ||
Decrease in deferred revenue | (0.0) | (0.4) | - | ||
Increase in trade payables | 102.7 | 835.6 | 601.6 | ||
Increase / (Decrease) in salaries and social security taxes payable | 4.6 | 37.6 | (16.6) | ||
Decrease in benefit plans | (0.5) | (4.4) | (5.1) | ||
(Decrease) / Increase in tax liabilities | (1.0) | (8.5) | 26.4 | ||
Increase in other payables | 9.5 | 76.9 | 146.1 | ||
Funds obtained from the program for the rational use of electric power | |||||
(PUREE) (SE Resolution No. 1037/07) | 27.6 | 224.7 | 279.9 | ||
Net decrease in provisions | (1.0) | (8.3) | (7.4) | ||
Subtotal before CAMMESA financing | 23.9 | 194.3 | 447.8 | ||
Net increase for funds obtained - CAMMESA financing | 53.3 | 433.5 | 213.0 | ||
Net cash flows provided by operating activities | 77.2 | 627.8 | 660.8 | ||
Financial tables have been converted into U.S. dollars at a rate of Ps. 8.133 per dollar, the ask price as of June 30, 2014, solely for the convenience of the reader.
| Second Quarter 2014 |
Page 10 | |
Condensed Interim Statements of Cash Flows
for the six-month periods ended June 30, 2014 and 2013(Continued)
Million of U.S Dollars and Argentine Pesos | 06.30.14 | 06.30.14 | 06.30.13 | ||
| US$ | AR$ | AR$ | |||
Cash flows from investing activities | |||||
Acquisitions of property, plant and equipment | (78.3) | (636.5) | (451.3) | ||
Net (payment for) collection of purchase / sale of financial assets at fair | |||||
value | (1.0) | (8.0) | (10.4) | ||
Collection of financial receivables with related companies | - | - | 2.2 | ||
Collection of receivables from sale of subsidiaries - SIESA | 0.4 | 3.0 | 2.1 | ||
Cash inflow from subsidiary sale | - | - | 0.3 | ||
Discontinued operations | - | - | (80.4) | ||
Net cash flows used in investing activities | (78.9) | (641.5) | (537.5) | ||
| - | ||||
Cash flows from financing activities | - | ||||
Repayment of principal on loans | (0.0) | (0.4) | (12.0) | ||
Payment of interest on loans | (9.3) | (75.3) | (83.5) | ||
Discontinued operations | - | - | 17.7 | ||
Net cash flows used in financing activities | (9.3) | (75.7) | (77.9) | ||
| - | ||||
Net (decrease) / increase in cash and cash equivalents | (11.0) | (89.3) | 45.5 | ||
| - | ||||
Cash and cash equivalents at beginning of year | 29.9 | 243.5 | 71.1 | ||
Cash and cash equivalents at beginning of year included in assets of | |||||
disposal group classified as held for sale | - | - | 11.2 | ||
Exchange differences in cash and cash equivalents | 0.9 | 7.2 | 14.5 | ||
Net (decrease) / increase in cash and cash equivalents | (11.0) | (89.3) | 45.5 | ||
Cash and cash equivalents at the end of period | 19.8 | 161.4 | 142.2 | ||
| - | ||||
| - | ||||
Cash and cash equivalents at the end of period in the statement of financial | |||||
position | 19.8 | 161.4 | 129.0 | ||
Cash and cash equivalents at the end of period included in assets of | |||||
disposal group classified as held for sale | - | - | 13.2 | ||
Cash and cash equivalents at the end of period | 19.8 | 161.4 | 142.2 | ||
Financial tables have been converted into U.S. dollars at a rate of Ps. 8.133 per dollar, the ask price as of June 30, 2014, solely for the convenience of the reader.
Empresa Distribuidora y Comercializadora Norte S.A. | ||
| By: | /s/ Leandro Montero | |
| Leandro Montero | ||
| Chief Financial Officer | ||