
|
| Edenor announces its third quarter 2017 results
| |
Stock Information: Ticker:EDN NYSE ADR Ratio: 20 Class B = 1 ADR Buenos Aires Stock Exchange |
Investor Relations Contacts: Leandro Montero Chief Financial Officer Juan Pablo Caro Capital Markets & Investor Relations | |
Tel: +54 (11) 4346 -5510 / 5519 | ||

Buenos Aires, Argentina, November 13, 2017. Empresa Distribuidora y Comercializadora Norte S.A. (NYSE: EDN; Buenos Aires Stock Exchange: EDN) (“EDENOR” or “the Company”), Argentina’s largest electricity distributor both in terms of number of customers and Gwh distributed, announces its results for the third quarter of 2017. All figures are stated in Argentine Pesos and have been prepared in accordance with International Financing Reporting Standards (“IFRS”).
RELEVANT EVENTS
Bank Financing
On October 11, 2017, the Company was granted a loan by Industrial and Commercial Bank of China Dubai (ICBC) Branch in the amount of USD 50 million and for a term of 36 months. Proceeds will be allocated to the financing of the Company’s working capital and investment plan and will allow for partially offsetting the impact of the deferral of revenues generated by the staggered recognition of Own Distribution Costs pursuant to ENRE Resolution No. 63/17, as determined by the Integral Tariff Review (RTI). Furthermore, it is worth highlighting that this loan is an “Allowed Indebtedness” within the limits stipulated in the outstanding Corporate Bonds with maturity in 2022.
Public Hearings on Changes to Tariff Schemes
Pursuant to Resolution No. 526/17, the ENRE called for a public hearing for November 17, 2017 to inform on the impact on customer bills of the measures to be implemented by the MEyM as a result of the public hearing convened on the same date to define the following: (i) new reference prices for energy and power capacity within the WEM for the 2017-2018 summer seasonal period; (ii) the electricity savings incentive plan; (iii) the social tariff, and; (iv) the electricity distribution methodology.
As a result, the Company was informed through ENRE Note No. 128,399 that the MEyM instructed the ENRE to defer until December 1, 2017 the application of the tariff increase scheduled for November 1, 2017 pursuant to the RTI, and that the result of such deferral should be recognized pursuant to the adjustment mechanism provided for by ENRE Resolution No. 63/17.
Furthermore, as regards the deferral of the CPD adjustment which should have been collectable as from August, 2017, it is informed that, for its recognition in real terms, this item will be applicable as from December 1, 2017, to such effect also using the above-mentioned adjustment mechanism.
1
|
2017 Collective Bargaining Negotiations
As part of the annual collective bargaining negotiation process for the July 2017 – October 2018 period, the Company agreed with the Luz y Fuerza union to grant its employees a series of salary increases according to the following schedule: Jul-17: 6%; Oct-17: 4%; Dec-17: 4%; Apr-18: 4%; Jun-18: 3%; Oct-18: 3%. This agreement is consistent with the Company’s salary adjustment criterion, which sets out that the evolution of salaries should be in line with domestic inflation, and will be revised accordingly.
Termination of the Fund for Electricity Distribution Expansion and Consolidation Works (FOCEDE)
On October 4, 2017, the MEyM recognized the amount of ARS 323.4 million in consideration of works performed under the FOCEDE. In response to the condition required for implementing such proceeds, on October 9, 2017, the Company declared that it has no administrative or judicial claims against these bodies related to the stated cause.
As of the date of this report, the Company is conducting all applicable business and procedures to enforce this recognition.
2
|
THIRD QUARTER 2017MAINOPERATING FIGURES
| 9 Months | 3rd Quarter | ||||
In millon of Pesos | 2017 | 2016 | Δ% | 2017 | 2016 | Δ% |
Revenue from sales | 17,576.4 | 9,117.3 | 92.8% | 6,458.1 | 3,410.2 | 89.4% |
Energy purchases | (9,237.8) | (4,766.0) | 93.8% | (3,427.3) | (1,996.3) | 71.7% |
Gross margin | 8,338.6 | 4,351.3 | 91.6% | 3,030.8 | 1,413.9 | 114.4% |
Operating expenses | (5,948.6) | (6,488.1) | (8.3%) | (2,027.3) | (2,055.4) | (1.4%) |
Other operating expenses | (541.7) | (300.7) | 80.1% | (270.6) | (73.8) | 266.7% |
Results due to Resolutions | - | 500.9 | N/A | - | (7.7) | N/A |
Net operating income (loss) | 1,848.3 | (1,936.6) | 195.4% | 732.9 | (723.0) | 201.4% |
Financial Results, net | (927.7) | (977.0) | 5.0% | (340.1) | (299.1) | (13.7%) |
Income Tax | (260.7) | 1,071.4 | N/A | (101.6) | 365.3 | N/A |
Net income (loss) | 659.9 | (1,842.2) | 135.8% | 291.2 | (656.8) | 144.3% |
Revenues from services increased by 89.4%, to ARS 6,458.1 million, in the third quarter of 2017, against ARS 3,410.2 million for the same period in 2016, mainly due to the application of the first stage of the tariff increase effective as from February 1, 2017 following the implementation of the RTI under ENRE Resolution No. 63/2017. The impact on income resulting from the gradualness in the recognition of VAD adjustments has not yet been disclosed by the Company in its financial statements; this amounts to approximately ARS 4,196.7 million for the February 1, 2017 - September 30, 2017 period, and will be incorporated in 48 installments into the Company’s Own Distribution Costs as from February 2018.
This increase in revenues from services has been partially offset by a 2.6% decrease in thevolume of energy sales, which reached 5,583 GWh in the third term of 2017, against 5,729 GWh for the same period in 2016, mainly attributable to a 6.4% decrease in the demand by residential customers, as well as a 4.1% decrease in the demand by medium commercial customers, which was partially offset by a 2.9% increase in the wheeling system and a 1.5% increase in the demand by industrial customers. As regards the residential demand, the lower consumption is mainly due to weather conditions, as during the months of August and September 2017 temperatures were on average 1.5º C higher than in 2016, with a lower occurrence of extremely low temperatures. In the case of commercial customers, the decrease in consumption is mainly attributable to a slight fall in the economic activity of certain sectors and a more rational use of energy. On the contrary, industrial and wheeling system customers presented a growth in line with the positive variation of the industrial production index. Furthermore, Edenor’s customer base increased by 2.3%.
| Energy sales | Customers | ||||||
3Q 2017 | 3Q 2016 | Δ% | At | At | Δ% | |||
Gwh | % | Gwh | % | |||||
Residential | 2,464 | 44.1% | 2,631 | 45.9% | (6.4%) | 2,553,412 | 2,489,695 | 2.6% |
Small commercial | 449 | 8.0% | 452 | 7.9% | (0.7%) | 329,019 | 325,246 | 1.2% |
Medium commercial | 426 | 7.6% | 444 | 7.8% | (4.1%) | 33,777 | 34,599 | (2.4%) |
Industrial | 912 | 16.3% | 898 | 15.7% | 1.5% | 6,859 | 6,823 | 0.5% |
Wheeling System | 987 | 17.7% | 959 | 16.7% | 2.9% | 708 | 713 | (0.7%) |
Others |
|
|
|
|
|
|
|
|
Public lighting | 197 | 3.5% | 194 | 3.4% | 2.0% | 21 | 21 | 0.0% |
Shantytowns and others | 148 | 2.7% | 151 | 2.6% | (2.1%) | 419 | 407 | 2.9% |
Total | 5,583 | 100% | 5,729 | 100% | (2.6%) | 2,924,215 | 2,857,504 | 2.3% |
3
|
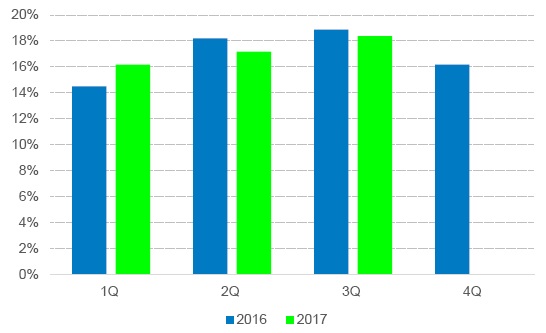
Energy purchases increased by 71.7%, to ARS 3,427.3 million, in the third quarter of 2017, against ARS 1,996.3 million for the same period in 2016, mainly due to an approximate 79% increase in the purchase average price resulting from the entry into effect in February 2017 of the new seasonal prices for electricity set forth by Resolution 20-E/2017 of the Secretariat of Electric Energy (“SEE”). Despite this increase, the reference seasonal price for residential customers is still subsidized by the National Government, especially in the case of residential customers, where the subsidy reaches approximately 50% of the system’s average generation cost. Additionally, even though the energy loss rate decreased by 18.4% in 3Q17, against 18.9% in 3Q16, its associated costs increased by 100% following the application of the new seasonal price for its determination.
Operating expensesremained relatively constant, with a 1.4% quarter-on-quarter decrease, reaching ARS 2,027.3 million in 3Q17 against ARS 2,055.3 million in 3Q16. This is mainly due to a ARS 397.3 million decrease in penalties resulting from changes introduced by ENRE Note No. 125,248 both in the calculation methodology and in the criteria for the adjustment of penalties. However, this effect was partially offset by a ARS 84.6 million increase in salaries, social security taxes and pension plans as a result of the staggered salary increases granted by the Company in line with inflation; a ARS 34.7 million increase in the allowance for the impairment of trade and other receivables as a result of the increase in bad debt, due to the tariff increase; a ARS 107.3 million increase in fees and remuneration for services, mainly attributable to the incorporation of the meter reading personnel into the Luz y Fuerza union agreement, higher collection costs as a result of the application of the new tariff scheme and the new monthly billing modality for T1 customers; and, lastly, a ARS 48.2 million increase in taxes and charges, which is mainly accounted for by the increase in the safety and hygiene tax and ENRE tax.
| 9 Months | 3rd Quarter | ||||
In million of pesos | 2017 | 2016 | Δ% | 2017 | 2016 | Δ% |
Salaries, social security taxes | (3,002.0) | (2,525.7) | 19% | (1,043.5) | (967.0) | 8% |
Pensions Plans | (79.0) | (61.9) | 28% | (28.7) | (20.6) | 39% |
Communications expenses | (167.2) | (104.6) | 60% | (57.2) | (35.2) | 63% |
Allowance for the impairment of trade and other receivables | (206.0) | (91.5) | 125% | (81.6) | (46.9) | 74% |
Supplies consumption | (261.7) | (232.3) | 13% | (101.2) | (75.9) | 33% |
Leases and insurance | (83.6) | (65.9) | 27% | (29.1) | (23.2) | 25% |
Security service | (121.3) | (88.7) | 37% | (45.9) | (32.5) | 41% |
Fees and remuneration for services | (1,206.1) | (931.3) | 30% | (446.9) | (339.5) | 32% |
Public relations and marketing | (18.4) | (15.4) | 20% | (9.2) | (8.3) | 11% |
Advertising and sponsorship | (9.5) | (7.9) | 20% | (4.7) | (4.3) | 11% |
Reimbursements to personnel | (0.5) | (1.7) | (72%) | (0.1) | (0.7) | (83%) |
Depreciation of property, plant and equipment | (310.4) | (257.6) | 21% | (110.5) | (90.4) | 22% |
Directors and Supervisory Committee members’ fees | (9.4) | (5.1) | 85% | (3.2) | (2.2) | 47% |
ENRE penalties | (272.1) | (2,016.2) | (87%) | 12.9 | (384.4) | (103%) |
Taxes and charges | (192.0) | (78.1) | 146% | (71.3) | (23.1) | 209% |
Other | (9.3) | (4.3) | 118% | (7.3) | (1.2) | 513% |
Total | (5,948.6) | (6,488.1) | (8%) | (2,027.3) | (2,055.3) | (1%) |
Net operating income increased by ARS 1,455.9 million, recording profits for ARS 732.9 million in the third quarter of 2017, against losses for ARS 723.0 million for the same period in 2016. This positive result was mainly a result of the 42% Distribution Value Added (“VAD”) increase granted by the RTI in February 2017, which was partially offset by the increase in the average purchase price and its impact on energy losses.
4
|
Financial results experienced a 13.7% decrease, with a ARS 340.2 million loss in the third quarter of 2017, against ARS 299.1 million losses for the same period in 2016, mainly due to the higher negative impact of foreign exchange rate variations, which amounted to ARS 93.1 million, as a result of an acceleration in the domestic currency depreciation rate against the U.S. Dollar, the currency in which the Company’s financial debt is denominated, which also resulted in higher financial interest charges. This loss was partially offset by a ARS 53.9 million lower charge of commercial interests and a ARS 19.6 million increase in the results of financial placements of temporarily available surplus funds.
Net results show a ARS 947.9 million increase, reporting a ARS 291.2 million profit in the third quarter of 2017, against a ARS 656.8 million loss for the same period in 2016. This is mainly accounted for by an improvement in gross margins as a result of the tariff increases established in the RTI, which were partially offset by higher financial losses.
5
|
Adjusted EBITDA
The adjusted EBITDA increased to ARS 869.6 million profits in the third quarter of 2017, against losses for ARS 535.7 million for the same period in 2016. In 3Q16, the EBITDA includes an adjustment for non-recurring items associated with adjustments by the regulatory agency and a reclassification of financial interest on the balance of sanctioned penalties for a total amount of ARS 70.3 million.
In millon of Pesos | 3Q 2017 |
| 3Q 2016 |
|
Net operating income before resolution 32/15 | 732.9 |
| (715.2) |
|
Depreciation of property, plant and equipment | 110.5 |
| 90.4 |
|
Penalty interests | - |
| 70.3 |
|
EBITDA | 843.4 |
| (554.5) |
|
Resolution 32/15 recognition and others(1) | - |
| (7.7) |
|
Commercial Interests | 26.2 |
| 26.6 |
|
Adjusted EBITDA | 869.6 |
| (535.7) |
|
(1) Includes additional income under this resolution and PUREE funds. | ||||
Capital Expenditures
Edenor’s capital expenditures during the third quarter of 2017 totaled ARS 1,108.8 million, compared to ARS 668.9 million in the third quarter of 2016. Our investments mainly consisted of the following:
· ARS 242.5 million in new connections;
· ARS 484.1 million in grid enhancements;
· ARS 251.6 million in network maintenance and improvements;
· ARS 12.8 million in legal requirements;
· ARS 72.0 million in communications and telecontrol;
· ARS 45.8 million in other investment projects.
For the nine-month period ended September 30, 2017, our Capital Expenditures totaled ARS 2,844.5 million, against ARS 2,008.9 million in 2016, including capitalized costs in property, plant and equipment.
The increase in investments results from the ambitious plan devised by Edenor for the 2017-2021 period, which was seriously and adversely affected in its first year of implementation by the partial deferral of the revenues increase granted by the RTI in 48 installments effective as from February 2018. Consequently, the Company has drawn up an investment plan in line with this new scenario, which is currently being strictly executed.
6
|
Energy Losses
In the third quarter of 2017, energy losses decreased by 18.4 %, against 18.9% for the same period in 2016, as a result of the above-mentioned decrease in the demand for energy by residential and commercial customers. Furthermore, during this term the Company continued increasing the activity under the scope of the Market Discipline Plan for the next five-year period, which aims to detect and normalize irregular connections and electricity theft and frauds, and it is expected to be intensified in the following months until reaching the level of actions necessary to meet the defined loss reduction goals.
Indebtedness
As of September 30, 2017, the outstanding principal of our dollar-denominated financial debt amounts to USD 176.4 million and consists of Corporate Bonds maturing in 2022, of which USD 300,000 are held by the Company.
Additionally, the Company took out a USD 50 million loan, as described in the relevant events.
7
|
About EDENOR
Empresa Distribuidora y Comercializadora Norte S.A. (Edenor) is the largest electricity distribution company in Argentina in terms of number of customers and electricity sold (both in GWh and Pesos). Through a concession, Edenor distributes electricity exclusively to the northwestern zone of the greater Buenos Aires metropolitan area and the northern part of the city of Buenos Aires, which has a population of approximately 8.0 million people and an area of 4,637 sq. km. In 2016, Edenor sold 22,253 GWh of energy and purchased 26,838 GWh (including wheeling System demands), with net sales of approximately ARS 13 billion and net loss of ARS 1,188.6 million.
This press release may contain forward-looking statements. These statements are statements that are not historical facts, and are based on management’s current view and estimates of future economic circumstances, industry conditions, Company performance and financial results. The words “anticipates”, “believes”, “estimates”, “expects”, “plans” and similar expressions, as they relate to the Company are intended to identify forward-looking statements. Such statements reflect the current views of management and are subject to a number of risks and uncertainties, including those identified in the documents filed by the Company with the U.S. Securities and Exchange Commission. There is no guarantee that the expected events, trends or results will actually occur. The statements are based on many assumptions and factors, including general economic and market conditions, industry conditions, and operating factors. Any changes in such assumptions or factors could cause actual results to differ materially from current expectations.
Edenor S.A.
6363 Del Libertador Avenue, 4th Floor
(C1428ARG) Buenos Aires, Argentina
Phone: 5411.4346.5510
investor@edenor.com
www.edenor.com
Conference Call Information

There will be a jointly conference call with Pampa Energía to discuss Edenor’s quarterly results on Monday, November 13, 2017, at 12:00 p.m. Buenos Aires time / 10:00 a.m. New York time. For those interested in participating, please dial + 1(844) 854 - 4411 in the United States or, if outside the United States, +1(412) 317-5481 or 0-800-444-2930 in Argentina. Participants should use conference ID Edenor and dial in five minutes before the call is set to begin. There will also be a live audio webcast of the conference atwww.edenor.com in the Investor Relations section.
|
| For additional information on the Company please access:www.edenor.com ;www.cnv.gob.ar |
8
|
Condensed Interim Statements of Financial Position
as of September 30, 2017, and December 31, 2016
In million of US Dollars and Argentine Pesos | 09.30.2017 |
| 09.30.2017 |
| 12.31.2016 |
US$ | AR$ | AR$ | |||
|
|
|
|
|
|
ASSETS |
|
|
|
|
|
|
|
|
|
|
|
Non-current assets |
|
|
|
|
|
Property, plant and equipment | 788.2 |
| 13,644.6 |
| 11,197.0 |
Interest in joint ventures | 0.0 |
| 0.4 |
| 0.4 |
Deferred tax asset | 71.3 |
| 1,234.1 |
| 1,019.0 |
Other receivables | 2.6 |
| 44.3 |
| 50.5 |
Financial assets at amortized cost | - |
| - |
| 44.4 |
Total non-current assets | 862.1 |
| 14,923.4 |
| 12,311.4 |
|
|
|
|
|
|
Current assets |
|
|
|
|
|
Inventories | 18.5 |
| 320.9 |
| 287.8 |
Other receivables | 7.7 |
| 134.1 |
| 179.3 |
Trade receivables | 280.9 |
| 4,861.8 |
| 3,901.1 |
Financial assets at fair value through profit or loss | 92.6 |
| 1,602.5 |
| 1,993.9 |
Financial assets at amortized cost | 11.3 |
| 196.0 |
| 1.5 |
Cash and cash equivalents | 3.9 |
| 67.8 |
| 258.6 |
Total current assets | 415.0 |
| 7,183.1 |
| 6,622.2 |
|
|
|
|
|
|
|
|
|
|
|
|
TOTAL ASSETS | 1,277.1 |
| 22,106.5 |
| 18,933.5 |
Financial tables have been converted into U.S. dollars at a rate of ARS 17.31 per dollar, the selling rate as of September 30, 2017, solely for the convenience of the reader.
9
|
Condensed Interim Statements of Financial Position
as of September 30, 2017, and December 31, 2016
In million of US Dollars and Argentine Pesos | 09.30.2017 |
| 09.30.2017 |
| 12.31.2016 |
US$ | AR$ | AR$ | |||
EQUITY |
|
|
|
|
|
|
|
|
|
|
|
Share capital | 51.9 |
| 898.7 |
| 897.0 |
Adjustment to share capital | 23.1 |
| 399.5 |
| 397.7 |
Additional paid-in capital | 1.8 |
| 31.6 |
| 3.5 |
Treasury stock | 0.5 |
| 7.8 |
| 9.4 |
Adjustment to treasury stock | 0.5 |
| 8.6 |
| 10.3 |
Legal reserve | 4.2 |
| 73.3 |
| 73.3 |
Opcional reserve | 10.2 |
| 176.1 |
| 176.1 |
Other reserves | - |
| - |
| 20.3 |
Other comprehensive loss | (1.1) |
| (19.5) |
| (37.2) |
Accumulated losses | (30.5) |
| (528.7) |
| (1,188.6) |
TOTAL EQUITY | 60.5 |
| 1,047.2 |
| 361.8 |
|
|
|
|
|
|
LIABILITIES |
|
|
|
|
|
Non-current liabilities |
|
|
|
|
|
|
|
|
|
|
|
Trade payables | 13.4 |
| 232.8 |
| 232.9 |
Other payables | 310.3 |
| 5,370.8 |
| 5,103.3 |
Borrowings | 174.6 |
| 3,022.5 |
| 2,769.6 |
Deferred revenue | 11.3 |
| 195.5 |
| 200.0 |
Salaries and social security payable | 6.2 |
| 106.5 |
| 94.3 |
Benefit plans | 16.8 |
| 290.0 |
| 266.1 |
Tax liabilities | - |
| - |
| 0.7 |
Provisions | 31.5 |
| 546.0 |
| 341.4 |
Total non-current liabilities | 564.1 |
| 9,764.0 |
| 9,008.3 |
|
|
|
|
|
|
Current liabilities |
|
|
|
|
|
Trade payables | 470.0 |
| 8,136.2 |
| 6,821.1 |
Other payables | 23.1 |
| 399.1 |
| 134.8 |
Borrowings | 7.6 |
| 132.4 |
| 53.7 |
Deferred revenue | 0.2 |
| 3.4 |
| 0.8 |
Salaries and social security payable | 58.8 |
| 1,017.7 |
| 1,032.2 |
Benefit plans | 1.9 |
| 33.4 |
| 33.4 |
Tax payable | 22.4 |
| 387.0 |
| 155.2 |
Tax liabilities | 61.1 |
| 1,057.0 |
| 1,244.5 |
Provisions | 7.5 |
| 129.2 |
| 87.9 |
Total current liabilities | 652.5 |
| 11,295.3 |
| 9,563.4 |
TOTAL LIABILITIES | 1,216.6 |
| 21,059.3 |
| 18,571.7 |
|
|
| - |
| - |
TOTAL LIABILITIES AND EQUITY | 1,277.1 |
| 22,106.5 |
| 18,933.5 |
Financial tables have been converted into U.S. dollars at a rate of ARS 17.31 per dollar, the selling rate as of September 30, 2017, solely for the convenience of the reader.
10
|
Condensed Interim Statements of Comprehensive Income (Loss)
for the nine-month period ended September 30, 2017, and 2016
In millon of US Dollars and Argentine Pesos | 09.30.2017 |
| 09.30.2017 |
| 09.30.2016 |
US$ | AR$ | AR$ | |||
|
|
|
|
|
|
Continuing operations |
|
|
|
|
|
Revenue | 1,075.0 |
| 17,576.4 |
| 9,117.3 |
Electric power purchases | (565.0) |
| (9,237.8) |
| (4,766.0) |
Subtotal | 510.0 |
| 8,338.6 |
| 4,351.3 |
Transmission and distribution expenses | (212.4) |
| (3,473.2) |
| (4,575.2) |
Gross loss | 297.6 |
| 4,865.4 |
| (223.9) |
Selling expenses | (89.3) |
| (1,459.7) |
| (1,100.5) |
Administrative expenses | (62.1) |
| (1,015.7) |
| (812.5) |
Other operating expense, net | (33.1) |
| (541.7) |
| (300.7) |
Operating loss before higher costs recognition and SE Resolution 32/15 | 113.0 |
| 1,848.3 |
| (2,437.5) |
Income recognition on account of the RTI - SE Resolution 32/15 | - |
| - |
| 419.4 |
Higher costs recognition - SE Resolution 250/13 and subsequents Notes | - |
| - |
| 81.5 |
Operating Loss (Profit) | 113.0 |
| 1,848.3 |
| (1,936.6) |
Financial income | 11.1 |
| 181.5 |
| 133.9 |
Financial expenses | (67.2) |
| (1,098.4) |
| (1,084.9) |
Other financial expense | (0.7) |
| (10.8) |
| (26.0) |
Net financial expense | (56.7) |
| (927.7) |
| (977.0) |
Loss (profit) before taxes | 56.3 |
| 920.6 |
| (2,913.6) |
|
|
|
|
|
|
Income tax | (15.9) |
| (260.7) |
| 1,071.4 |
Loss (Profit) for the period | 40.4 |
| 660.0 |
| (1,842.2) |
|
|
|
|
|
|
Basic and diluted earnings Loss (Profit) per share: |
|
|
|
|
|
Basic and diluted earnings (loss) profit per share | 0.04 |
| 0.73 |
| (2.05) |
Financial tables have been converted into U.S. dollars at a rate of ARS 16.35 per dollar, average selling exchange rate for the nine-month period ended September 30, 2017, solely for the convenience of the reader.
11
|
Condensed Interim Statements of Cash Flows
for the nine-month period ended September 30, 2017, and 2016
In millon of US Dollars and Argentine Pesos | 09.30.2017 |
| 09.30.2017 |
| 09.30.2016 |
US$ | AR$ | AR$ | |||
|
|
|
|
|
|
Cash flows from operating activities |
|
|
|
|
|
Loss (Profit) for the period | 40.4 |
| 660.0 |
| (1,842.2) |
Adjustments to reconcile net (loss) profit to net cash flows provided by operating activities: |
|
|
|
|
|
Depreciation of property, plant and equipment | 19.0 |
| 310.4 |
| 257.6 |
Loss on disposals of property, plant and equipment | 0.3 |
| 5.7 |
| 40.0 |
Net accrued interest | 56.0 |
| 915.9 |
| 948.7 |
Exchange differences | 14.3 |
| 233.4 |
| 359.7 |
Income tax | 15.9 |
| 260.7 |
| (1,071.4) |
Allowance for the impairment of trade and other receivables, net of recovery | 12.6 |
| 206.0 |
| 91.5 |
Adjustment to present value of receivables | 0.0 |
| 0.2 |
| (3.0) |
Provision for contingencies | 16.7 |
| 273.3 |
| 119.4 |
Other expenses - FOCEDE | - |
| - |
| 14.7 |
Changes in fair value of financial assets | (14.5) |
| (237.3) |
| (343.8) |
Accrual of benefit plans | 4.8 |
| 79.0 |
| 61.9 |
Higher costs recognition - SE Resolution 250/13 and subsequents Notes | - |
| - |
| (81.5) |
Income from non-reimbursable customer | (0.1) |
| (1.9) |
| (0.6) |
Other reserve constitution - Share bases compensation plan | 0.5 |
| 7.8 |
| - |
Changes in operating assets and liabilities: |
|
|
|
|
|
Increase in trade receivables | (60.8) |
| (994.8) |
| (2,253.0) |
Decrease in other receivables | 1.7 |
| 27.3 |
| 886.8 |
Increase (Decrease) in inventories | 2.9 |
| 47.8 |
| (99.3) |
Decrease in deferred revenue | - |
| - |
| 41.0 |
Dencrease in trade payables | 36.6 |
| 599.1 |
| 2,582.2 |
Decrease in salaries and social security taxes payable | (0.1) |
| (2.4) |
| 141.8 |
Decrease in benefit plans | (1.7) |
| (27.9) |
| (10.6) |
(Decrease) Increase in tax liabilities | (13.8) |
| (225.3) |
| 239.7 |
Decrease in other payables | 12.5 |
| 203.9 |
| 1,831.7 |
Net decrease in provisions | (1.7) |
| (27.4) |
| (34.2) |
Income Tax Payment | (14.3) |
| (233.9) |
| - |
Net cash flows provided by operating activities | 127.2 |
| 2,079.4 |
| 1,877.1 |
Financial tables have been converted into U.S. dollars at a rate of ARS 16.35 per dollar, average selling exchange rate for the nine-month period ended September 30, 2017, solely for the convenience of the reader.
12
|
Condensed Interim Statements of Cash Flows
for the nine-month period ended September 30, 2017, and 2016
(Continued)
In million of US Dollars and Argentine Pesos | 09.30.2017 |
| 09.30.2017 |
| 09.30.2016 |
US$ | AR$ | AR$ | |||
|
|
|
|
|
|
Cash flows from investing activities |
|
|
|
|
|
Payment of property, plants and equipments | (163.9) |
| (2,679.7) |
| (1,525.5) |
Collection of Financial assets | 74.8 |
| 1,223.1 |
| 194.7 |
Payments of Financial assets | (87.2) |
| (1,426.0) |
| (201.2) |
Redemption (Subscription) net of money market funds | 43.5 |
| 712.0 |
| (47.5) |
Collection of receivables from sale of subsidiaries - SIESA | 2.1 |
| 34.6 |
| 9.9 |
Net cash flows used in investing activities | (130.6) |
| (2,135.9) |
| (1,569.6) |
|
|
|
|
|
|
Cash flows from financing activities |
|
|
|
|
|
Payment of interests on loans | (8.1) |
| (132.9) |
| (136.1) |
Repurchase of corporate notes | - |
| - |
| (4.9) |
Redemption of corporate notes | - |
| - |
| (221.9) |
Net cash flows used in financing activities | (8.1) |
| (132.9) |
| (362.9) |
|
|
|
|
|
|
Net (decrease) increase in cash and cash equivalents | (11.6) |
| (189.4) |
| (55.4) |
|
|
|
|
|
|
|
|
|
|
|
|
Cash and cash equivalents at the beginning of year | 15.8 |
| 258.6 |
| 129.0 |
Exchange differences in cash and cash equivalents | (0.1) |
| (1.4) |
| 17.8 |
Net decrease in cash and cash equivalents | (11.6) |
| (189.4) |
| (55.4) |
Cash and cash equivalents at the end of period | 4.1 |
| 67.8 |
| 91.4 |
Financial tables have been converted into U.S. dollars at a rate of ARS 16.35 per dollar, average selling exchange rate for the nine-month period ended September 30, 2017, solely for the convenience of the reader.
13
|
Condensed Interim Statements of Cash Flows
for the nine-month period ended September 30, 2017, and 2016
(Continued)
In millon of US Dollars and Argentine Pesos | 09.30.2017 |
| 09.30.2017 |
| 09.30.2016 |
US$ | AR$ | AR$ | |||
|
|
|
|
|
|
Supplemental cash flows information |
|
|
|
|
|
Non-cash operating, investing and financing activities |
|
|
|
|
|
|
|
|
|
|
|
Financial costs capitalized in property, plant and equipment | (12.3) |
| (201.6) |
| (203.5) |
Acquisitions of property, plant and equipment through increased trade payables | (10.3) |
| (169.1) |
| (280.0) |
Financial tables have been converted into U.S. dollars at a rate of ARS 16.35 per dollar, average selling exchange rate for the nine-month period ended September 30, 2017, solely for the convenience of the reader.
|
Investor Relations Contacts: Leandro Montero Chief Financial Officer |
Tel: +54 (11) 4346-5510 |

14

Empresa Distribuidora y Comercializadora Norte S.A. | ||
| By: | /s/ Leandro Montero | |
| Leandro Montero | ||
| Chief Financial Officer | ||