UNITED STATES
SECURITIES AND EXCHANGE COMMISSION
Washington, D.C. 20549
Form N-CSR
CERTIFIED SHAREHOLDER REPORT OF REGISTERED
MANAGEMENT INVESTMENT COMPANIES
Investment Company Act File Number: 811-22044
Eaton Vance Risk-Managed Diversified Equity Income Fund
(Exact Name of Registrant as Specified in Charter)
Two International Place, Boston, Massachusetts 02110
(Address of Principal Executive Offices)
Deidre E. Walsh
Two International Place, Boston, Massachusetts 02110
(Name and Address of Agent for Services)
(617) 482-8260
(Registrant’s Telephone Number)
December 31
Date of Fiscal Year End
June 30, 2021
Date of Reporting Period
| Item 1. | Reports to Stockholders |

Eaton Vance
Risk-Managed Diversified Equity Income Fund (ETJ)
Semiannual Report
June 30, 2021

Commodity Futures Trading Commission Registration. The Commodity Futures Trading Commission (“CFTC”) has adopted regulations that subject registered investment companies and advisers to regulation by the CFTC if a fund invests more than a prescribed level of its assets in certain CFTC-regulated instruments (including futures, certain options and swap agreements) or markets itself as providing investment exposure to such instruments. The investment adviser has claimed an exclusion from the definition of “commodity pool operator” under the Commodity Exchange Act with respect to its management of the Fund. Accordingly, neither the Fund nor the adviser with respect to the operation of the Fund is subject to CFTC regulation. Because of its management of other strategies, the Fund’s adviser is registered with the CFTC as a commodity pool operator. The adviser is also registered as a commodity trading advisor.
Managed Distribution Plan. Pursuant to an exemptive order issued by the Securities and Exchange Commission (Order), the Fund is authorized to distribute long-term capital gains to shareholders more frequently than once per year. Pursuant to the Order, the Fund’s Board of Trustees approved a Managed Distribution Plan (MDP) pursuant to which the Fund makes monthly cash distributions to common shareholders, stated in terms of a fixed amount per common share.
The Fund currently distributes monthly cash distributions equal to $0.0760 per share in accordance with the MDP. You should not draw any conclusions about the Fund’s investment performance from the amount of these distributions or from the terms of the MDP. The MDP will be subject to regular periodic review by the Fund’s Board of Trustees and the Board may amend or terminate the MDP at any time without prior notice to Fund shareholders. However, at this time there are no reasonably foreseeable circumstances that might cause the termination of the MDP.
The Fund may distribute more than its net investment income and net realized capital gains and, therefore, a distribution may include a return of capital. A return of capital distribution does not necessarily reflect the Fund’s investment performance and should not be confused with “yield” or “income.” With each distribution, the Fund will issue a notice to shareholders and a press release containing information about the amount and sources of the distribution and other related information. The amounts and sources of distributions contained in the notice and press release are only estimates and are not provided for tax purposes. The amounts and sources of the Fund’s distributions for tax purposes will be reported to shareholders on Form 1099-DIV for each calendar year.
Fund shares are not insured by the FDIC and are not deposits or other obligations of, or guaranteed by, any depository institution. Shares are subject to investment risks, including possible loss of principal invested.
Semiannual Report June 30, 2021
Eaton Vance
Risk-Managed Diversified Equity Income Fund
Eaton Vance
Risk-Managed Diversified Equity Income Fund
June 30, 2021
Performance1
Portfolio Manager Michael A. Allison, CFA and G.R. Nelson
| | | | | | | | | | | | | | | | | | | | |
| % Average Annual Total Returns | | Inception Date | | | Six Months | | | One Year | | | Five Years | | | Ten Years | |
| | | | | |
Fund at NAV | | | 07/31/2007 | | | | 7.90 | % | | | 19.10 | % | | | 10.67 | % | | | 7.60 | % |
Fund at Market Price | | | — | | | | 16.07 | | | | 31.80 | | | | 14.11 | | | | 9.74 | |
|
| |
| | | | | |
S&P 500® Index | | | — | | | | 15.25 | % | | | 40.79 | % | | | 17.64 | % | | | 14.83 | % |
Cboe S&P 500 95–110 Collar IndexSM | | | — | | | | 10.07 | | | | 24.79 | | | | 15.51 | | | | 9.88 | |
| | | | | |
| % Premium/Discount to NAV2 | | | | | | | | | | | | | | | |
| | | | | |
| | | | | | | | | | | | | | | | | | | 10.66 | % |
| | | | | |
| Distributions3 | | | | | | | | | | | | | | | |
| | | | | |
Total Distributions per share for the period | | | | | | | | | | | | | | | | | | $ | 0.456 | |
Distribution Rate at NAV | | | | | | | | | | | | | | | | | | | 8.76 | % |
Distribution Rate at Market Price | | | | | | | | | | | | | | | | | | | 7.92 | |
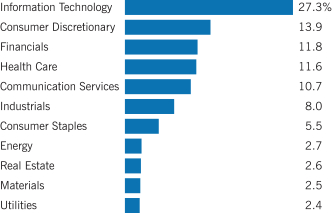
Fund Profile
Sector Allocation (% of total investments)4
Top 10 Holdings (% of total investments)4
| | | | |
Microsoft Corp. | | | 7.2 | % |
| |
Apple, Inc. | | | 6.2 | |
| |
Amazon.com, Inc. | | | 5.8 | |
| |
Alphabet, Inc., Class C | | | 5.1 | |
| |
JPMorgan Chase & Co. | | | 2.8 | |
| |
Visa, Inc., Class A | | | 2.4 | |
| |
UnitedHealth Group, Inc. | | | 2.3 | |
| |
Eaton Corp. PLC | | | 2.2 | |
| |
Bank of America Corp. | | | 2.2 | |
| |
Danaher Corp. | | | 2.2 | |
| |
Total | | | 38.4 | % |
See Endnotes and Additional Disclosures in this report.
Past performance is no guarantee of future results. Returns are historical and are calculated net of management fees and other expenses by determining the percentage change in net asset value (NAV) or market price (as applicable) with all distributions reinvested in accordance with the Fund’s Dividend Reinvestment Plan. Performance at market price will differ from performance at NAV due to variations in the Fund’s market price versus NAV, which may reflect factors such as fluctuations in supply and demand for Fund shares, changes in Fund distributions, shifting market expectations for the Fund’s future returns and distribution rates, and other considerations affecting the trading prices of closed-end funds. Investment return and principal value will fluctuate so that shares, when sold, may be worth more or less than their original cost. Performance for periods less than or equal to one year is cumulative. Performance is for the stated time period only; due to market volatility, current Fund performance may be lower or higher than the quoted return. For performance as of the most recent month-end, please refer to eatonvance.com.
Eaton Vance
Risk-Managed Diversified Equity Income Fund
June 30, 2021
Endnotes and Additional Disclosures
| 1 | S&P 500® Index is an unmanaged index of large-cap stocks commonly used as a measure of U.S. stock market performance. S&P Dow Jones Indices are a product of S&P Dow Jones Indices LLC (“S&P DJI”) and have been licensed for use. S&P® and S&P 500® are registered trademarks of S&P DJI; Dow Jones® is a registered trademark of Dow Jones Trademark Holdings LLC (“Dow Jones”); S&P DJI, Dow Jones and their respective affiliates do not sponsor, endorse, sell or promote the Fund, will not have any liability with respect thereto and do not have any liability for any errors, omissions, or interruptions of the S&P Dow Jones Indices. Cboe S&P 500 95–110 Collar IndexSM is an unmanaged index of the S&P 500® stocks with a collar option strategy of buying put options and selling call options. Unless otherwise stated, index returns do not reflect the effect of any applicable sales charges, commissions, expenses, taxes or leverage, as applicable. It is not possible to invest directly in an index. |
| 2 | The shares of the Fund often trade at a discount or premium to their net asset value. The discount or premium may vary over time and may be higher or lower than what is quoted in this report. For up-to-date premium/discount information, please refer to https://funds.eatonvance.com/closed-end-fund-prices.php. |
| 3 | The Distribution Rate is based on the Fund’s last regular distribution per share in the period (annualized) divided by the Fund’s NAV or market price at the end of the period. The Fund’s distributions may be comprised of amounts characterized for federal income tax purposes as qualified and non-qualified ordinary dividends, capital gains and nondividend distributions, also known as return of capital. For additional information about nondividend distributions, please refer to Eaton Vance Closed-End Fund Distribution Notices (19a) posted on our website, eatonvance.com. The Fund will determine the federal income tax character of distributions paid to a shareholder after the end of the calendar year. This is reported on the IRS form 1099-DIV and provided to the shareholder shortly after each year-end. For information about the tax character of distributions made in prior calendar years, please refer to Performance-Tax Character of Distributions on the Fund’s webpage available at eatonvance.com. In recent years, a significant portion of the Fund’s distributions has been characterized as a return of capital. The Fund’s distributions are determined by the investment adviser based on its current assessment of the Fund’s long-term return potential. Fund distributions may be affected by numerous factors including changes in Fund performance, the cost of financing for leverage, portfolio holdings, realized and projected returns, and other factors. As portfolio and market conditions change, the rate of distributions paid by the Fund could change. |
| 4 | Depictions do not reflect the Fund’s option positions. Excludes cash and cash equivalents. |
Fund profile subject to change due to active management.
Important Notice to Shareholders
Effective July 1, 2021, the Fund is managed by G.R. Nelson.
Eaton Vance
Risk-Managed Diversified Equity Income Fund
June 30, 2021
Portfolio of Investments (Unaudited)
| | | | | | | | |
| Common Stocks — 99.9% | |
| Security | | Shares | | | Value | |
|
| Aerospace & Defense — 0.8% | |
| | |
Huntington Ingalls Industries, Inc.(1) | | | 24,013 | | | $ | 5,060,740 | |
| |
| | | | $ | 5,060,740 | |
|
| Automobiles — 1.2% | |
| | |
General Motors Co.(1)(2) | | | 136,072 | | | $ | 8,051,380 | |
| |
| | | | $ | 8,051,380 | |
|
| Banks — 6.8% | |
| | |
Bank of America Corp.(1) | | | 364,763 | | | $ | 15,039,178 | |
| | |
JPMorgan Chase & Co.(1) | | | 120,064 | | | | 18,674,755 | |
| | |
Wells Fargo & Co.(1) | | | 248,132 | | | | 11,237,898 | |
| |
| | | | $ | 44,951,831 | |
|
| Beverages — 2.4% | |
| | |
Constellation Brands, Inc., Class A(1) | | | 27,443 | | | $ | 6,418,643 | |
| | |
PepsiCo, Inc.(1) | | | 64,034 | | | | 9,487,918 | |
| |
| | | | $ | 15,906,561 | |
|
| Biotechnology — 1.0% | |
| | |
Vertex Pharmaceuticals, Inc.(1)(2) | | | 34,304 | | | $ | 6,916,716 | |
| |
| | | | $ | 6,916,716 | |
|
| Building Products — 1.2% | |
| | |
Johnson Controls International PLC(1) | | | 115,490 | | | $ | 7,926,079 | |
| |
| | | | $ | 7,926,079 | |
|
| Capital Markets — 2.7% | |
| | |
Charles Schwab Corp. (The)(1) | | | 104,055 | | | $ | 7,576,244 | |
| | |
Goldman Sachs Group, Inc. (The)(1) | | | 27,443 | | | | 10,415,442 | |
| |
| | | | $ | 17,991,686 | |
|
| Diversified Telecommunication Services — 1.8% | |
| | |
Verizon Communications, Inc.(1) | | | 219,545 | | | $ | 12,301,106 | |
| |
| | | | $ | 12,301,106 | |
|
| Electric Utilities — 1.1% | |
| | |
NextEra Energy, Inc.(1) | | | 98,338 | | | $ | 7,206,209 | |
| |
| | | | $ | 7,206,209 | |
|
| Electrical Equipment — 2.3% | |
| | |
Eaton Corp. PLC(1) | | | 101,768 | | | $ | 15,079,982 | |
| |
| | | | $ | 15,079,982 | |
| | | | | | | | |
| Security | | Shares | | | Value | |
|
| Entertainment — 3.8% | |
| | |
Live Nation Entertainment, Inc.(1)(2) | | | 85,760 | | | $ | 7,511,719 | |
| | |
Netflix, Inc.(1)(2) | | | 8,005 | | | | 4,228,321 | |
| | |
Walt Disney Co. (The)(1)(2) | | | 77,756 | | | | 13,667,172 | |
| |
| | | | $ | 25,407,212 | |
|
| Equity Real Estate Investment Trusts (REITs) — 2.7% | |
| | |
AvalonBay Communities, Inc.(1) | | | 27,443 | | | $ | 5,727,080 | |
| | |
EastGroup Properties, Inc.(1) | | | 48,025 | | | | 7,897,711 | |
| | |
Mid-America Apartment Communities, Inc.(1) | | | 24,013 | | | | 4,044,269 | |
| |
| | | | $ | 17,669,060 | |
|
| Food Products — 1.2% | |
| | |
Mondelez International, Inc., Class A(1) | | | 125,781 | | | $ | 7,853,766 | |
| |
| | | | $ | 7,853,766 | |
|
| Health Care Equipment & Supplies — 2.3% | |
| | |
Danaher Corp.(1) | | | 56,029 | | | $ | 15,035,943 | |
| |
| | | | $ | 15,035,943 | |
|
| Health Care Providers & Services — 2.3% | |
| | |
UnitedHealth Group, Inc.(1) | | | 38,878 | | | $ | 15,568,306 | |
| |
| | | | $ | 15,568,306 | |
|
| Hotels, Restaurants & Leisure — 2.0% | |
| | |
Hilton Worldwide Holdings, Inc.(1)(2) | | | 51,455 | | | $ | 6,206,502 | |
| | |
Starbucks Corp.(1) | | | 65,178 | | | | 7,287,552 | |
| |
| | | | $ | 13,494,054 | |
|
| Household Products — 2.0% | |
| | |
Procter & Gamble Co. (The)(1) | | | 99,482 | | | $ | 13,423,106 | |
| |
| | | | $ | 13,423,106 | |
|
| Insurance — 2.5% | |
| | |
MetLife, Inc.(1) | | | 112,060 | | | $ | 6,706,791 | |
| | |
Progressive Corp. (The)(1) | | | 98,338 | | | | 9,657,775 | |
| |
| | | | $ | 16,364,566 | |
|
| Interactive Media & Services — 5.2% | |
| | |
Alphabet, Inc., Class C(1)(2) | | | 13,721 | | | $ | 34,389,217 | |
| |
| | | | $ | 34,389,217 | |
|
| Internet & Direct Marketing Retail — 5.8% | |
| | |
Amazon.com, Inc.(1)(2) | | | 11,275 | | | $ | 38,787,804 | |
| |
| | | | $ | 38,787,804 | |
| | | | |
| | 4 | | See Notes to Financial Statements. |
Eaton Vance
Risk-Managed Diversified Equity Income Fund
June 30, 2021
Portfolio of Investments (Unaudited) — continued
| | | | | | | | |
| Security | | Shares | | | Value | |
|
| IT Services — 7.8% | |
| | |
Accenture PLC, Class A(1) | | | 42,308 | | | $ | 12,471,975 | |
| | |
Fidelity National Information Services, Inc.(1) | | | 49,168 | | | | 6,965,631 | |
| | |
GoDaddy, Inc., Class A(1)(2) | | | 51,455 | | | | 4,474,527 | |
| | |
PayPal Holdings, Inc.(1)(2) | | | 40,022 | | | | 11,665,612 | |
| | |
Visa, Inc., Class A(1) | | | 69,752 | | | | 16,309,413 | |
| |
| | | | $ | 51,887,158 | |
|
| Life Sciences Tools & Services — 3.1% | |
| | |
Charles River Laboratories International, Inc.(1)(2) | | | 14,865 | | | $ | 5,498,861 | |
| | |
Thermo Fisher Scientific, Inc.(1) | | | 21,726 | | | | 10,960,115 | |
| | |
Waters Corp.(1)(2) | | | 12,284 | | | | 4,245,473 | |
| |
| | | | $ | 20,704,449 | |
|
| Machinery — 1.9% | |
| | |
Caterpillar, Inc.(1) | | | 29,730 | | | $ | 6,470,140 | |
| | |
PACCAR, Inc.(1) | | | 72,039 | | | | 6,429,481 | |
| |
| | | | $ | 12,899,621 | |
|
| Metals & Mining — 2.5% | |
| | |
Franco-Nevada Corp.(1) | | | 60,603 | | | $ | 8,791,677 | |
| | |
Rio Tinto PLC ADR(1) | | | 94,908 | | | | 7,961,832 | |
| |
| | | | $ | 16,753,509 | |
|
| Multi-Utilities — 1.3% | |
| | |
CMS Energy Corp.(1) | | | 49,168 | | | $ | 2,904,846 | |
| | |
Sempra Energy(1) | | | 44,596 | | | | 5,908,078 | |
| |
| | | | $ | 8,812,924 | |
|
| Oil, Gas & Consumable Fuels — 2.7% | |
| | |
Chevron Corp.(1) | | | 72,038 | | | $ | 7,545,260 | |
| | |
EOG Resources, Inc.(1) | | | 72,038 | | | | 6,010,851 | |
| | |
Phillips 66(1) | | | 53,743 | | | | 4,612,224 | |
| |
| | | | $ | 18,168,335 | |
|
| Pharmaceuticals — 2.9% | |
| | |
Royalty Pharma PLC, Class A(1) | | | 72,039 | | | $ | 2,952,879 | |
| | |
Sanofi | | | 76,612 | | | | 8,049,054 | |
| | |
Zoetis, Inc.(1) | | | 45,739 | | | | 8,523,920 | |
| |
| | | | $ | 19,525,853 | |
|
| Road & Rail — 1.9% | |
| | |
CSX Corp.(1) | | | 397,923 | | | $ | 12,765,370 | |
| |
| | | | $ | 12,765,370 | |
| | | | | | | | |
| Security | | Shares | | | Value | |
|
| Semiconductors & Semiconductor Equipment — 3.2% | |
| | |
Micron Technology, Inc.(1)(2) | | | 73,182 | | | $ | 6,219,006 | |
| | |
Texas Instruments, Inc.(1) | | | 77,756 | | | | 14,952,479 | |
| |
| | | | $ | 21,171,485 | |
|
| Software — 10.3% | |
| | |
Intuit, Inc.(1) | | | 28,587 | | | $ | 14,012,490 | |
| | |
Microsoft Corp.(1) | | | 177,237 | | | | 48,013,503 | |
| | |
Palantir Technologies, Inc., Class A(1)(2) | | | 251,562 | | | | 6,631,174 | |
| |
| | | | $ | 68,657,167 | |
|
| Specialty Retail — 2.4% | |
| | |
Best Buy Co., Inc.(1) | | | 46,881 | | | $ | 5,390,377 | |
| | |
Lowe’s Cos., Inc.(1) | | | 53,743 | | | | 10,424,530 | |
| |
| | | | $ | 15,814,907 | |
|
| Technology Hardware, Storage & Peripherals — 6.2% | |
| | |
Apple, Inc.(1) | | | 303,017 | | | $ | 41,501,208 | |
| |
| | | | $ | 41,501,208 | |
|
| Textiles, Apparel & Luxury Goods — 2.6% | |
| | |
Capri Holdings, Ltd.(1)(2) | | | 93,762 | | | $ | 5,362,249 | |
| | |
NIKE, Inc., Class B(1) | | | 75,469 | | | | 11,659,206 | |
| |
| | | | $ | 17,021,455 | |
| |
Total Common Stocks
(identified cost $394,293,004) | | | $ | 665,068,765 | |
|
| Short-Term Investments — 0.8% | |
| Description | | Units | | | Value | |
| | |
Eaton Vance Cash Reserves Fund, LLC, 0.05%(3) | | | 5,405,121 | | | $ | 5,405,121 | |
| |
Total Short-Term Investments
(identified cost $5,405,121) | | | $ | 5,405,121 | |
| |
Total Purchased Put Options — 0.2%
(identified cost $3,497,511) | | | $ | 1,023,050 | |
| |
Total Investments — 100.9%
(identified cost $403,195,636) | | | $ | 671,496,936 | |
| |
Total Written Call Options — (0.8)%
(premiums received $3,814,764) | | | $ | (5,041,875 | ) |
| |
Other Assets, Less Liabilities — (0.1)% | | | $ | (532,223 | ) |
| |
Net Assets — 100.0% | | | $ | 665,922,838 | |
| | | | |
| | 5 | | See Notes to Financial Statements. |
Eaton Vance
Risk-Managed Diversified Equity Income Fund
June 30, 2021
Portfolio of Investments (Unaudited) — continued
The percentage shown for each investment category in the Portfolio of Investments is based on net assets.
| (1) | Security (or a portion thereof) has been pledged as collateral for written options. |
| (2) | Non-income producing security. |
| (3) | Affiliated investment company, available to Eaton Vance portfolios and funds, which invests in high quality, U.S. dollar denominated money market instruments. The rate shown is the annualized seven-day yield as of June 30, 2021. |
| | | | | | | | | | | | | | | | | | | | |
| Purchased Put Options — 0.2% | |
|
| Exchange-Traded Options — 0.2% | |
| | | | | |
| Description | | Number of
Contracts | | | Notional
Amount | | | Exercise
Price | | | Expiration
Date | | | Value | |
| | | | | |
S&P 500 Index | | | 124 | | | $ | 53,289,000 | | | $ | 4,050 | | | | 7/2/21 | | | $ | 3,100 | |
| | | | | |
S&P 500 Index | | | 124 | | | | 53,289,000 | | | | 4,060 | | | | 7/6/21 | | | | 5,580 | |
| | | | | |
S&P 500 Index | | | 124 | | | | 53,289,000 | | | | 4,060 | | | | 7/7/21 | | | | 8,680 | |
| | | | | |
S&P 500 Index | | | 124 | | | | 53,289,000 | | | | 4,080 | | | | 7/9/21 | | | | 22,940 | |
| | | | | |
S&P 500 Index | | | 124 | | | | 53,289,000 | | | | 4,075 | | | | 7/12/21 | | | | 32,550 | |
| | | | | |
S&P 500 Index | | | 124 | | | | 53,289,000 | | | | 4,040 | | | | 7/14/21 | | | | 45,260 | |
| | | | | |
S&P 500 Index | | | 125 | | | | 53,718,750 | | | | 3,990 | | | | 7/16/21 | | | | 51,250 | |
| | | | | |
S&P 500 Index | | | 124 | | | | 53,289,000 | | | | 4,005 | | | | 7/21/21 | | | | 84,940 | |
| | | | | |
S&P 500 Index | | | 123 | | | | 52,859,250 | | | | 4,090 | | | | 7/21/21 | | | | 129,150 | |
| | | | | |
S&P 500 Index | | | 123 | | | | 52,859,250 | | | | 4,120 | | | | 7/23/21 | | | | 180,810 | |
| | | | | |
S&P 500 Index | | | 123 | | | | 52,859,250 | | | | 4,130 | | | | 7/26/21 | | | | 210,945 | |
| | | | | |
S&P 500 Index | | | 123 | | | | 52,859,250 | | | | 4,130 | | | | 7/28/21 | | | | 247,845 | |
| |
Total | | | $ | 1,023,050 | |
| | | | | | | | | | | | | | | | | | | | |
| Written Call Options — (0.8)% | |
|
| Exchange-Traded Options — (0.8)% | |
| | | | | |
| Description | | Number of
Contracts | | | Notional
Amount | | | Exercise
Price | | | Expiration
Date | | | Value | |
| | | | | |
S&P 500 Index | | | 124 | | | $ | 53,289,000 | | | $ | 4,280 | | | | 7/2/21 | | | $ | (293,880 | ) |
| | | | | |
S&P 500 Index | | | 124 | | | | 53,289,000 | | | | 4,290 | | | | 7/6/21 | | | | (241,800 | ) |
| | | | | |
S&P 500 Index | | | 124 | | | | 53,289,000 | | | | 4,290 | | | | 7/7/21 | | | | (271,560 | ) |
| | | | | |
S&P 500 Index | | | 124 | | | | 53,289,000 | | | | 4,290 | | | | 7/9/21 | | | | (330,460 | ) |
| | | | | |
S&P 500 Index | | | 124 | | | | 53,289,000 | | | | 4,300 | | | | 7/12/21 | | | | (290,160 | ) |
| | | | | |
S&P 500 Index | | | 124 | | | | 53,289,000 | | | | 4,280 | | | | 7/14/21 | | | | (509,640 | ) |
| | | | | |
S&P 500 Index | | | 125 | | | | 53,718,750 | | | | 4,250 | | | | 7/16/21 | | | | (853,750 | ) |
| | | | | |
S&P 500 Index | | | 124 | | | | 53,289,000 | | | | 4,270 | | | | 7/21/21 | | | | (728,500 | ) |
| | | | | |
S&P 500 Index | | | 123 | | | | 52,859,250 | | | | 4,300 | | | | 7/21/21 | | | | (469,860 | ) |
| | | | | |
S&P 500 Index | | | 123 | | | | 52,859,250 | | | | 4,325 | | | | 7/23/21 | | | | (341,940 | ) |
| | | | | |
S&P 500 Index | | | 123 | | | | 52,859,250 | | | | 4,320 | | | | 7/26/21 | | | | (402,210 | ) |
| | | | | |
S&P 500 Index | | | 123 | | | | 52,859,250 | | | | 4,345 | | | | 7/28/21 | | | | (308,115 | ) |
| |
Total | | | $ | (5,041,875 | ) |
Abbreviations:
| | | | |
| | |
| ADR | | – | | American Depositary Receipt |
| | | | |
| | 6 | | See Notes to Financial Statements. |
Eaton Vance
Risk-Managed Diversified Equity Income Fund
June 30, 2021
Statement of Assets and Liabilities (Unaudited)
| | | | |
| Assets | | June 30, 2021 | |
| |
Unaffiliated investments, at value (identified cost, $397,790,515) | | $ | 666,091,815 | |
| |
Affiliated investment, at value (identified cost, $5,405,121) | | | 5,405,121 | |
| |
Dividends receivable | | | 224,454 | |
| |
Dividends receivable from affiliated investment | | | 232 | |
| |
Receivable for premiums on written options | | | 315,282 | |
| |
Receivable from the transfer agent | | | 135,673 | |
| |
Tax reclaims receivable | | | 34,341 | |
| |
Total assets | | $ | 672,206,918 | |
|
| Liabilities | |
| |
Written options outstanding, at value (premiums received, $3,814,764) | | $ | 5,041,875 | |
| |
Payable for closed written options | | | 472,761 | |
| |
Payable to affiliates: | | | | |
| |
Investment adviser fee | | | 544,437 | |
| |
Trustees’ fees | | | 8,097 | |
| |
Accrued expenses | | | 216,910 | |
| |
Total liabilities | | $ | 6,284,080 | |
| |
Net Assets | | $ | 665,922,838 | |
|
| Sources of Net Assets | |
| |
Common shares, $0.01 par value, unlimited number of shares authorized, 63,970,955 shares issued and outstanding | | $ | 639,710 | |
| |
Additional paid-in capital | | | 421,533,769 | |
| |
Distributable earnings | | | 243,749,359 | |
| |
Net Assets | | $ | 665,922,838 | |
|
| Net Asset Value | |
| |
($665,922,838 ÷ 63,970,955 common shares issued and outstanding) | | $ | 10.41 | |
| | | | |
| | 7 | | See Notes to Financial Statements. |
Eaton Vance
Risk-Managed Diversified Equity Income Fund
June 30, 2021
Statement of Operations (Unaudited)
| | | | |
| Investment Income | | Six Months Ended
June 30, 2021 | |
| |
Dividends (net of foreign taxes, $50,635) | | $ | 5,123,430 | |
| |
Dividends from affiliated investment | | | 1,654 | |
| |
Total investment income | | $ | 5,125,084 | |
|
| Expenses | |
| |
Investment adviser fee | | $ | 3,253,460 | |
| |
Trustees’ fees and expenses | | | 15,964 | |
| |
Custodian fee | | | 117,413 | |
| |
Transfer and dividend disbursing agent fees | | | 9,028 | |
| |
Legal and accounting services | | | 40,748 | |
| |
Printing and postage | | | 134,802 | |
| |
Miscellaneous | | | 34,807 | |
| |
Total expenses | | $ | 3,606,222 | |
| |
Net investment income | | $ | 1,518,862 | |
|
| Realized and Unrealized Gain (Loss) | |
| |
Net realized gain (loss) — | | | | |
| |
Investment transactions | | $ | 21,533,221 | |
| |
Investment transactions — affiliated investment | | | 3 | |
| |
Written options | | | (3,754,320 | ) |
| |
Foreign currency transactions | | | 2,562 | |
| |
Net realized gain | | $ | 17,781,466 | |
|
Change in unrealized appreciation (depreciation) — | |
| |
Investments | | $ | 31,716,384 | |
| |
Written options | | | (523,659 | ) |
| |
Foreign currency | | | (427 | ) |
| |
Net change in unrealized appreciation (depreciation) | | $ | 31,192,298 | |
| |
Net realized and unrealized gain | | $ | 48,973,764 | |
| |
Net increase in net assets from operations | | $ | 50,492,626 | |
| | | | |
| | 8 | | See Notes to Financial Statements. |
Eaton Vance
Risk-Managed Diversified Equity Income Fund
June 30, 2021
Statements of Changes in Net Assets
| | | | | | | | |
| Increase (Decrease) in Net Assets | | Six Months Ended
June 30, 2021
(Unaudited) | | | Year Ended
December 31, 2020 | |
| | |
From operations — | | | | | | | | |
| | |
Net investment income | | $ | 1,518,862 | | | $ | 4,287,964 | |
| | |
Net realized gain | | | 17,781,466 | | | | 18,152,540 | |
| | |
Net change in unrealized appreciation (depreciation) | | | 31,192,298 | | | | 83,048,538 | |
| | |
Net increase in net assets from operations | | $ | 50,492,626 | | | $ | 105,489,042 | |
| | |
Distributions to shareholders | | $ | (29,150,188 | )* | | $ | (17,513,647 | ) |
| | |
Tax return of capital to shareholders | | $ | — | | | $ | (40,700,834 | ) |
| | |
Capital share transactions — | | | | | | | | |
| | |
Reinvestment of distributions | | $ | 809,373 | | | $ | 1,025,940 | |
| | |
Net increase in net assets from capital share transactions | | $ | 809,373 | | | $ | 1,025,940 | |
| | |
Net increase in net assets | | $ | 22,151,811 | | | $ | 48,300,501 | |
|
| Net Assets | |
| | |
At beginning of period | | $ | 643,771,027 | | | $ | 595,470,526 | |
| | |
At end of period | | $ | 665,922,838 | | | $ | 643,771,027 | |
| * | A portion of the distributions may be deemed a tax return of capital at year-end. See Note 2. |
| | | | |
| | 9 | | See Notes to Financial Statements. |
Eaton Vance
Risk-Managed Diversified Equity Income Fund
June 30, 2021
Financial Highlights
| | | | | | | | | | | | | | | | | | | | | | | | |
| | | Six Months Ended
June 30, 2021
(Unaudited) | | | Year Ended December 31, | |
| | | 2020 | | | 2019 | | | 2018 | | | 2017 | | | 2016 | |
| | | | | | | |
Net asset value — Beginning of period | | $ | 10.080 | | | $ | 9.340 | | | $ | 8.950 | | | $ | 10.080 | | | $ | 9.980 | | | $ | 11.150 | |
|
| Income (Loss) From Operations | |
| | | | | | |
Net investment income(1) | | $ | 0.024 | | | $ | 0.067 | | | $ | 0.066 | | | $ | 0.059 | | | $ | 0.078 | | | $ | 0.108 | |
| | | | | | |
Net realized and unrealized gain (loss) | | | 0.762 | | | | 1.585 | | | | 1.236 | | | | (0.277 | ) | | | 0.968 | | | | (0.162 | ) |
| | | | | | |
Total income (loss) from operations | | $ | 0.786 | | | $ | 1.652 | | | $ | 1.302 | | | $ | (0.218 | ) | | $ | 1.046 | | | $ | (0.054 | ) |
|
| Less Distributions | |
| | | | | | |
From net investment income | | $ | (0.456 | )* | | $ | (0.080 | ) | | $ | (0.066 | ) | | $ | (0.486 | ) | | $ | (0.946 | ) | | $ | (0.093 | ) |
| | | | | | |
From net realized gain | | | — | | | | (0.194 | ) | | | — | | | | — | | | | — | | | | — | |
| | | | | | |
Tax return of capital | | | — | | | | (0.638 | ) | | | (0.846 | ) | | | (0.426 | ) | | | — | | | | (1.023 | ) |
| | | | | | |
Total distributions | | $ | (0.456 | ) | | $ | (0.912 | ) | | $ | (0.912 | ) | | $ | (0.912 | ) | | $ | (0.946 | ) | | $ | (1.116 | ) |
| | | | | | |
Net asset value — End of period | | $ | 10.410 | | | $ | 10.080 | | | $ | 9.340 | | | $ | 8.950 | | | $ | 10.080 | | | $ | 9.980 | |
| | | | | | |
Market value — End of period | | $ | 11.520 | | | $ | 10.370 | | | $ | 9.330 | | | $ | 8.120 | | | $ | 9.630 | | | $ | 8.960 | |
| | | | | | |
Total Investment Return on Net Asset Value(2) | | | 7.90 | %(3) | | | 18.78 | % | | | 15.18 | % | | | (2.13 | )% | | | 11.66 | % | | | 0.60 | % |
| | | | | | |
Total Investment Return on Market Value(2) | | | 16.07 | %(3) | | | 22.33 | % | | | 26.82 | % | | | (7.06 | )% | | | 18.82 | % | | | (0.88 | )% |
|
| Ratios/Supplemental Data | |
| | | | | | |
Net assets, end of period (000’s omitted) | | $ | 665,923 | | | $ | 643,771 | | | $ | 595,471 | | | $ | 570,021 | | | $ | 641,923 | | | $ | 635,595 | |
| | | | | | |
Ratios (as a percentage of average daily net assets): | | | | | | | | | | | | | | | | | | | | | | | | |
| | | | | | |
Expenses | | | 1.11 | %(4) | | | 1.11 | % | | | 1.11 | % | | | 1.10 | % | | | 1.10 | % | | | 1.11 | % |
| | | | | | |
Net investment income | | | 0.47 | %(4) | | | 0.70 | % | | | 0.71 | % | | | 0.60 | % | | | 0.78 | % | | | 1.05 | % |
| | | | | | |
Portfolio Turnover | | | 17 | %(3) | | | 52 | % | | | 57 | % | | | 53 | % | | | 87 | % | | | 79 | % |
| (1) | Computed using average shares outstanding. |
| (2) | Returns are historical and are calculated by determining the percentage change in net asset value or market value with all distributions reinvested. Distributions are assumed to be reinvested at prices obtained under the Fund’s dividend reinvestment plan. |
| * | A portion of the distributions may be deemed from net realized gain or a tax return of capital at year-end. See Note 2. |
| | | | |
| | 10 | | See Notes to Financial Statements. |
Eaton Vance
Risk-Managed Diversified Equity Income Fund
June 30, 2021
Notes to Financial Statements
1 Significant Accounting Policies
Eaton Vance Risk-Managed Diversified Equity Income Fund (the Fund) is a Massachusetts business trust registered under the Investment Company Act of 1940, as amended (the 1940 Act), as a diversified, closed-end management investment company. The Fund’s primary investment objective is to provide current income and gains, with a secondary objective of capital appreciation.
The following is a summary of significant accounting policies of the Fund. The policies are in conformity with accounting principles generally accepted in the United States of America (U.S. GAAP). The Fund is an investment company and follows accounting and reporting guidance in the Financial Accounting Standards Board (FASB) Accounting Standards Codification Topic 946.
A Investment Valuation — The following methodologies are used to determine the market value or fair value of investments.
Equity Securities. Equity securities listed on a U.S. securities exchange generally are valued at the last sale or closing price on the day of valuation or, if no sales took place on such date, at the mean between the closing bid and ask prices on the exchange where such securities are principally traded. Equity securities listed on the NASDAQ Global or Global Select Market generally are valued at the NASDAQ official closing price. Unlisted or listed securities for which closing sales prices or closing quotations are not available are valued at the mean between the latest available bid and ask prices.
Derivatives. U.S. exchange-traded options are valued at the mean between the bid and ask prices at valuation time as reported by the Options Price Reporting Authority. Non-U.S. exchange-traded options and over-the-counter options are valued by a third party pricing service using techniques that consider factors including the value of the underlying instrument, the volatility of the underlying instrument and the period of time until option expiration.
Foreign Securities and Currencies. Foreign securities and currencies are valued in U.S. dollars, based on foreign currency exchange rate quotations supplied by a third party pricing service. The pricing service uses a proprietary model to determine the exchange rate. Inputs to the model include reported trades and implied bid/ask spreads. The daily valuation of exchange-traded foreign securities generally is determined as of the close of trading on the principal exchange on which such securities trade. Events occurring after the close of trading on foreign exchanges may result in adjustments to the valuation of foreign securities to more accurately reflect their fair value as of the close of regular trading on the New York Stock Exchange. When valuing foreign equity securities that meet certain criteria, the Fund’s Trustees have approved the use of a fair value service that values such securities to reflect market trading that occurs after the close of the applicable foreign markets of comparable securities or other instruments that have a strong correlation to the fair-valued securities.
Affiliated Fund. The Fund may invest in Eaton Vance Cash Reserves Fund, LLC (Cash Reserves Fund), an affiliated investment company managed by Eaton Vance Management (EVM). While Cash Reserves Fund is not a registered money market mutual fund, it conducts all of its investment activities in accordance with the requirements of Rule 2a-7 under the 1940 Act. Investments in Cash Reserves Fund are valued at the closing net asset value per unit on the valuation day. Cash Reserves Fund generally values its investment securities based on available market quotations provided by a third party pricing service.
Fair Valuation. Investments for which valuations or market quotations are not readily available or are deemed unreliable are valued at fair value using methods determined in good faith by or at the direction of the Trustees of the Fund in a manner that most fairly reflects the security’s “fair value”, which is the amount that the Fund might reasonably expect to receive for the security upon its current sale in the ordinary course. Each such determination is based on a consideration of relevant factors, which are likely to vary from one pricing context to another. These factors may include, but are not limited to, the type of security, the existence of any contractual restrictions on the security’s disposition, the price and extent of public trading in similar securities of the issuer or of comparable companies or entities, quotations or relevant information obtained from broker/dealers or other market participants, information obtained from the issuer, analysts, and/or the appropriate stock exchange (for exchange-traded securities), an analysis of the company’s or entity’s financial statements, and an evaluation of the forces that influence the issuer and the market(s) in which the security is purchased and sold.
B Investment Transactions — Investment transactions for financial statement purposes are accounted for on a trade date basis. Realized gains and losses on investments sold are determined on the basis of identified cost.
C Income — Dividend income is recorded on the ex-dividend date for dividends received in cash and/or securities. However, if the ex-dividend date has passed, certain dividends from foreign securities are recorded as the Fund is informed of the ex-dividend date. Withholding taxes on foreign dividends and capital gains have been provided for in accordance with the Fund’s understanding of the applicable countries’ tax rules and rates.
D Federal Taxes — The Fund’s policy is to comply with the provisions of the Internal Revenue Code applicable to regulated investment companies and to distribute to shareholders each year substantially all of its net investment income, and all or substantially all of its net realized capital gains. Accordingly, no provision for federal income or excise tax is necessary.
As of June 30, 2021, the Fund had no uncertain tax positions that would require financial statement recognition, de-recognition, or disclosure. The Fund files a U.S. federal income tax return annually after its fiscal year-end, which is subject to examination by the Internal Revenue Service for a period of three years from the date of filing.
E Foreign Currency Translation — Investment valuations, other assets, and liabilities initially expressed in foreign currencies are translated each business day into U.S. dollars based upon current exchange rates. Purchases and sales of foreign investment securities and income and expenses denominated in foreign currencies are translated into U.S. dollars based upon currency exchange rates in effect on the respective dates of such transactions. Recognized gains or losses on investment transactions attributable to changes in foreign currency exchange rates are recorded for financial statement purposes as net
Eaton Vance
Risk-Managed Diversified Equity Income Fund
June 30, 2021
Notes to Financial Statements — continued
realized gains and losses on investments. That portion of unrealized gains and losses on investments that results from fluctuations in foreign currency exchange rates is not separately disclosed.
F Use of Estimates — The preparation of the financial statements in conformity with U.S. GAAP requires management to make estimates and assumptions that affect the reported amounts of assets and liabilities at the date of the financial statements and the reported amounts of income and expense during the reporting period. Actual results could differ from those estimates.
G Indemnifications — Under the Fund’s organizational documents, its officers and Trustees may be indemnified against certain liabilities and expenses arising out of the performance of their duties to the Fund. Under Massachusetts law, if certain conditions prevail, shareholders of a Massachusetts business trust (such as the Fund) could be deemed to have personal liability for the obligations of the Fund. However, the Fund’s Declaration of Trust contains an express disclaimer of liability on the part of Fund shareholders and the By-laws provide that the Fund shall assume, upon request by the shareholder, the defense on behalf of any Fund shareholders. Moreover, the By-laws also provide for indemnification out of Fund property of any shareholder held personally liable solely by reason of being or having been a shareholder for all loss or expense arising from such liability. Additionally, in the normal course of business, the Fund enters into agreements with service providers that may contain indemnification clauses. The Fund’s maximum exposure under these arrangements is unknown as this would involve future claims that may be made against the Fund that have not yet occurred.
H Written Options — Upon the writing of a call or a put option, the premium received by the Fund is included in the Statement of Assets and Liabilities as a liability. The amount of the liability is subsequently marked-to-market to reflect the current market value of the option written, in accordance with the Fund’s policies on investment valuations discussed above. Premiums received from writing options which expire are treated as realized gains. Premiums received from writing options which are exercised or are closed are added to or offset against the proceeds or amount paid on the transaction to determine the realized gain or loss. When an index option is exercised, the Fund is required to deliver an amount of cash determined by the excess of the exercise price of the option over the value of the index (in the case of a put) or the excess of the value of the index over the exercise price of the option (in the case of a call) at contract termination. If a put option on a security is exercised, the premium reduces the cost basis of the securities purchased by the Fund. The Fund, as a writer of an option, may have no control over whether the underlying securities or other assets may be sold (call) or purchased (put) and, as a result, bears the market risk of an unfavorable change in the price of the securities or other assets underlying the written option. The Fund may also bear the risk of not being able to enter into a closing transaction if a liquid secondary market does not exist.
I Purchased Options — Upon the purchase of a call or put option, the premium paid by the Fund is included in the Statement of Assets and Liabilities as an investment. The amount of the investment is subsequently marked-to-market to reflect the current market value of the option purchased, in accordance with the Fund’s policies on investment valuations discussed above. As the purchaser of an index option, the Fund has the right to receive a cash payment equal to any depreciation in the value of the index below the exercise price of the option (in the case of a put) or equal to any appreciation in the value of the index over the exercise price of the option (in the case of a call) as of the valuation date of the option. If an option which the Fund had purchased expires on the stipulated expiration date, the Fund will realize a loss in the amount of the cost of the option. If the Fund enters into a closing sale transaction, the Fund will realize a gain or loss, depending on whether the sales proceeds from the closing sale transaction are greater or less than the cost of the option. If the Fund exercises a put option on a security, it will realize a gain or loss from the sale of the underlying security, and the proceeds from such sale will be decreased by the premium originally paid. If the Fund exercises a call option on a security, the cost of the security which the Fund purchases upon exercise will be increased by the premium originally paid. The risk associated with purchasing options is limited to the premium originally paid.
J Interim Financial Statements — The interim financial statements relating to June 30, 2021 and for the six months then ended have not been audited by an independent registered public accounting firm, but in the opinion of the Fund’s management, reflect all adjustments, consisting only of normal recurring adjustments, necessary for the fair presentation of the financial statements.
2 Distributions to Shareholders and Income Tax Information
Subject to its Managed Distribution Plan, the Fund makes monthly distributions from its cash available for distribution, which consists of the Fund’s dividends and interest income after payment of Fund expenses, net option premiums and net realized and unrealized gains on stock investments. The Fund intends to distribute all or substantially all of its net realized capital gains. Distributions are recorded on the ex-dividend date. Distributions to shareholders are determined in accordance with income tax regulations, which may differ from U.S. GAAP. As required by U.S. GAAP, only distributions in excess of tax basis earnings and profits are reported in the financial statements as a return of capital. Permanent differences between book and tax accounting relating to distributions are reclassified to paid-in capital. For tax purposes, distributions from short-term capital gains are considered to be from ordinary income. Distributions in any year may include a substantial return of capital component. For the six months ended June 30, 2021, the amount of distributions
estimated to be a tax return of capital was approximately $27,336,000. The final determination of tax characteristics of the Fund’s distributions will occur at the end of the year, at which time it will be reported to the shareholders.
At December 31, 2020, the Fund had a net capital loss of $16,383,977 attributable to security transactions incurred after October 31, 2020 that it has elected to defer. This net capital loss is treated as arising on the first day of the Fund’s taxable year ending December 31, 2021.
Eaton Vance
Risk-Managed Diversified Equity Income Fund
June 30, 2021
Notes to Financial Statements — continued
The cost and unrealized appreciation (depreciation) of investments, including open derivative contracts, of the Fund at June 30, 2021, as determined on a federal income tax basis, were as follows:
| | | | |
| |
Aggregate cost | | $ | 399,919,823 | |
| |
Gross unrealized appreciation | | $ | 271,481,783 | |
| |
Gross unrealized depreciation | | | (4,946,545 | ) |
| |
Net unrealized appreciation | | $ | 266,535,238 | |
3 Investment Adviser Fee and Other Transactions with Affiliates
The investment adviser fee is earned by EVM as compensation for investment advisory services rendered to the Fund. On March 1, 2021, Morgan Stanley acquired Eaton Vance Corp. (the “Transaction”) and EVM became an indirect, wholly-owned subsidiary of Morgan Stanley. In connection with the Transaction, the Fund entered into a investment advisory agreement (the “New Agreement”) with EVM, which took effect on March 1, 2021. Pursuant to the New Agreement (and the Fund’s investment advisory agreement with EVM in effect prior to March 1, 2021), the fee is computed at an annual rate of 1.00% of the Fund’s average daily gross assets and is payable monthly. Gross assets as referred to herein represent net assets plus obligations attributable to investment leverage, if any. For the six months ended June 30, 2021, the investment adviser fee amounted to $3,253,460. The Fund may invest its cash in Cash Reserves Fund. EVM does not currently receive a fee for advisory services provided to Cash Reserves Fund. EVM also serves as administrator of the Fund, but receives no compensation.
Trustees and officers of the Fund who are members of EVM’s organization receive remuneration for their services to the Fund out of the investment adviser fee. Trustees of the Fund who are not affiliated with EVM may elect to defer receipt of all or a percentage of their annual fees in accordance with the terms of the Trustees Deferred Compensation Plan. For the six months ended June 30, 2021, no significant amounts have been deferred. Certain officers and Trustees of the Fund are officers of EVM.
4 Purchases and Sales of Investments
Purchases and sales of investments, other than short-term obligations, aggregated $110,724,323 and $170,547,821, respectively, for the six months ended June 30, 2021.
5 Common Shares of Beneficial Interest
Common shares issued by the Fund pursuant to its dividend reinvestment plan for the six months ended June 30, 2021 and the year ended December 31, 2020 were 78,089 and 105,884, respectively.
In August 2012, the Board of Trustees initially approved a share repurchase program for the Fund. Pursuant to the reauthorization of the share repurchase program by the Board of Trustees in March 2019, the Fund is authorized to repurchase up to 10% of its common shares outstanding as of the last day of the prior calendar year at market prices when shares are trading at a discount to net asset value. The share repurchase program does not obligate the Fund to purchase a specific amount of shares. There were no repurchases of common shares by the Fund for the six months ended June 30, 2021 and the year ended December 31, 2020.
6 Financial Instruments
The Fund may trade in financial instruments with off-balance sheet risk in the normal course of its investing activities. These financial instruments may include written options and may involve, to a varying degree, elements of risk in excess of the amounts recognized for financial statement purposes. The notional or contractual amounts of these instruments represent the investment the Fund has in particular classes of financial instruments and do not necessarily represent the amounts potentially subject to risk. The measurement of the risks associated with these instruments is meaningful only when all related and offsetting transactions are considered. A summary of obligations under these financial instruments at June 30, 2021 is included in the Portfolio of Investments. At June 30, 2021, the Fund had sufficient cash and/or securities to cover commitments under these contracts.
The Fund is subject to equity price risk in the normal course of pursuing its investment objectives. The Fund pursues a “collared” options strategy which consists of buying S&P 500 index put options below the current value of the index and writing S&P 500 index call options above the current value of the index with the same expiration. The strategy uses the premium income from the written call options to buy an equal number of put options. In buying put options on an index, the Fund in effect, acquires protection against decline in the value of the applicable index below the exercise price in exchange for the option premium paid. In writing index call options, the Fund in effect, sells potential appreciation in the value of the applicable index above the exercise price. The Fund retains the risk of lost appreciation, minus the premium received, should the price of the underlying index rise above the exercise price. Under normal market conditions, the Fund’s use of option collars is expected to provide a more consistent level of market exposure and market protection.
Eaton Vance
Risk-Managed Diversified Equity Income Fund
June 30, 2021
Notes to Financial Statements — continued
The fair value of open derivative instruments (not considered to be hedging instruments for accounting disclosure purposes) and whose primary underlying risk exposure is equity price risk at June 30, 2021 was as follows:
| | | | | | | | |
| | | Fair Value | |
| Derivative | | Asset Derivative(1) | | | Liability Derivative(2) | |
| | |
Purchased options | | $ | 1,023,050 | | | $ | — | |
| | |
Written options | | | — | | | | (5,041,875 | ) |
| | |
Total | | $ | 1,023,050 | | | $ | (5,041,875 | ) |
| (1) | Statement of Assets and Liabilities location: Unaffiliated investments, at value. |
| (2) | Statement of Assets and Liabilities location: Written options outstanding, at value. |
The effect of derivative instruments (not considered to be hedging instruments for accounting disclosure purposes) on the Statement of Operations and whose primary underlying risk exposure is equity price risk for the six months ended June 30, 2021 was as follows:
| | | | | | | | |
| Derivative | | Realized Gain (Loss)
on Derivatives Recognized
in Income(1) | | | Change in Unrealized
Appreciation (Depreciation) on
Derivatives Recognized in Income(2) | |
| | |
Purchased options | | $ | (28,929,500 | ) | | $ | 270,471 | |
| | |
Written options | | | (3,754,320 | ) | | | (523,659 | ) |
| | |
| | | $ | (32,683,820 | ) | | $ | (253,188 | ) |
| (1) | Statement of Operations location: Net realized gain (loss) – Investment transactions and Written options, respectively. |
| (2) | Statement of Operations location: Change in unrealized appreciation (depreciation) – Investments and Written options, respectively. |
The average number of purchased and written options contracts outstanding during the six months ended June 30, 2021, which are indicative of the volume of these derivative types, were 1,565 and 1,565 contracts, respectively.
7 Investments in Affiliated Funds
At June 30, 2021, the value of the Fund’s investment in affiliated funds was $5,405,121, which represents 0.8% of the Fund’s net assets. Transactions in affiliated funds by the Fund for the six months ended June 30, 2021 were as follows:
| | | | | | | | | | | | | | | | | | | | | | | | | | | | | | | | |
| Name of affiliated fund | | Value,
beginning
of period | | | Purchases | | | Sales
proceeds | | | Net
realized
gain (loss) | | | Change in
unrealized
appreciation
(depreciation) | | | Value, end
of period | | | Dividend
income | | | Units, end
of period | |
| | | | | | | | |
Short-Term Investments | | | | | | | | | | | | | | | | | | | | | | | | | | | | | | | | |
| | | | | | | | |
Eaton Vance Cash Reserves Fund, LLC | | $ | 4,783,085 | | | $ | 61,970,326 | | | $ | (61,348,293 | ) | | $ | 3 | | | $ | — | | | $ | 5,405,121 | | | $ | 1,654 | | | | 5,405,121 | |
8 Fair Value Measurements
Under generally accepted accounting principles for fair value measurements, a three-tier hierarchy to prioritize the assumptions, referred to as inputs, is used in valuation techniques to measure fair value. The three-tier hierarchy of inputs is summarized in the three broad levels listed below.
| • | | Level 1 – quoted prices in active markets for identical investments |
| • | | Level 2 – other significant observable inputs (including quoted prices for similar investments, interest rates, prepayment speeds, credit risk, etc.) |
| • | | Level 3 – significant unobservable inputs (including a fund’s own assumptions in determining the fair value of investments) |
Eaton Vance
Risk-Managed Diversified Equity Income Fund
June 30, 2021
Notes to Financial Statements — continued
In cases where the inputs used to measure fair value fall in different levels of the fair value hierarchy, the level disclosed is determined based on the lowest level input that is significant to the fair value measurement in its entirety. The inputs or methodology used for valuing securities are not necessarily an indication of the risk associated with investing in those securities.
At June 30, 2021, the hierarchy of inputs used in valuing the Fund’s investments and open derivative instruments, which are carried at value, were as follows:
| | | | | | | | | | | | | | | | |
| Asset Description | | Level 1 | | | Level 2 | | | Level 3 | | | Total | |
| | | | |
Common Stocks | | | | | | | | | | | | | | | | |
| | | | |
Communication Services | | $ | 72,097,535 | | | $ | — | | | $ | — | | | $ | 72,097,535 | |
| | | | |
Consumer Discretionary | | | 93,169,600 | | | | — | | | | — | | | | 93,169,600 | |
| | | | |
Consumer Staples | | | 37,183,433 | | | | — | | | | — | | | | 37,183,433 | |
| | | | |
Energy | | | 18,168,335 | | | | — | | | | — | | | | 18,168,335 | |
| | | | |
Financials | | | 79,308,083 | | | | — | | | | — | | | | 79,308,083 | |
| | | | |
Health Care | | | 69,702,213 | | | | 8,049,054 | | | | — | | | | 77,751,267 | |
| | | | |
Industrials | | | 53,731,792 | | | | — | | | | — | | | | 53,731,792 | |
| | | | |
Information Technology | | | 183,217,018 | | | | — | | | | — | | | | 183,217,018 | |
| | | | |
Materials | | | 16,753,509 | | | | — | | | | — | | | | 16,753,509 | |
| | | | |
Real Estate | | | 17,669,060 | | | | — | | | | — | | | | 17,669,060 | |
| | | | |
Utilities | | | 16,019,133 | | | | — | | | | — | | | | 16,019,133 | |
| | | | |
Total Common Stocks | | $ | 657,019,711 | | | $ | 8,049,054 | * | | $ | — | | | $ | 665,068,765 | |
| | | | |
Short-Term Investments | | $ | — | | | $ | 5,405,121 | | | $ | — | | | $ | 5,405,121 | |
| | | | |
Purchased Put Options | | | 1,023,050 | | | | — | | | | — | | | | 1,023,050 | |
| | | | |
Total Investments | | $ | 658,042,761 | | | $ | 13,454,175 | | | $ | — | | | $ | 671,496,936 | |
| | | | |
Liability Description | | | | | | | | | | | | | | | | |
| | | | |
Written Call Options | | $ | (5,041,875 | ) | | $ | — | | | $ | — | | | $ | (5,041,875 | ) |
| | | | |
Total | | $ | (5,041,875 | ) | | $ | — | | | $ | — | | | $ | (5,041,875 | ) |
| * | Includes foreign equity securities whose values were adjusted to reflect market trading of comparable securities or other correlated instruments that occurred after the close of trading in their applicable foreign markets. |
9 Risks and Uncertainties
Pandemic Risk
An outbreak of respiratory disease caused by a novel coronavirus was first detected in China in late 2019 and subsequently spread internationally. This coronavirus has resulted in closing borders, enhanced health screenings, changes to healthcare service preparation and delivery, quarantines, cancellations, disruptions to supply chains and customer activity, as well as general concern and uncertainty. Health crises caused by outbreaks, such as the coronavirus outbreak, may exacerbate other pre-existing political, social and economic risks and disrupt normal market conditions and operations. The impact of this outbreak has negatively affected the worldwide economy, the economies of individual countries, individual companies, and the market in general, and may continue to do so in significant and unforeseen ways, as may other epidemics and pandemics that may arise in the future. Any such impact could adversely affect the Fund’s performance, or the performance of the securities in which the Fund invests.
Eaton Vance
Risk-Managed Diversified Equity Income Fund
June 30, 2021
Joint Special Meeting of Shareholders (Unaudited)
The Fund held a Joint Special Meeting of Shareholders (the “Special Meeting”) with certain other Eaton Vance closed-end funds on January 7, 2021 and adjourned until January 22, 2021 for the following purpose: approval of a new investment advisory agreement with EVM (“Proposal 1”). The shareholder meeting results are as follows:
| | | | | | | | | | | | | | | | |
| | | Number of Shares(1) | |
| | | For | | | Against | | | Abstain(2) | | | Broker
Non-Votes(2) | |
| | | | |
Proposal 1 | | | 31,849,471 | | | | 874,241 | | | | 2,151,181 | | | | 0 | |
| (1) | Fractional shares were voted proportionately. |
| (2) | All shares that were voted and votes to abstain were counted towards establishing a quorum, as were broker non-votes. (Broker non-votes are shares for which a broker returns a proxy but for which (i) the beneficial owner has not voted and (ii) the broker holding the shares does not have discretionary authority to vote on the particular matter.) Abstentions and broker non-votes had the effect of a negative vote on the Proposal. Broker non-votes were not expected with respect to the Proposal because brokers are required to receive instructions from the beneficial owners or persons entitled to vote in order to submit proxies. |
Eaton Vance
Risk-Managed Diversified Equity Income Fund
June 30, 2021
Annual Meeting of Shareholders (Unaudited)
The Fund held its Annual Meeting of Shareholders on April 15, 2021. The following action was taken by the shareholders:
Proposal 1: The election of George J. Gorman, William H. Park, Helen Frame Peters and Susan J. Sutherland as Class II Trustees of the Fund, each for a three-year term ending in 2024.
| | | | | | | | |
Nominee for Trustee | | Number of Shares | |
| | For | | | Withheld | |
| | |
George J. Gorman | | | 43,101,085 | | | | 8,418,559 | |
| | |
William H. Park | | | 43,073,986 | | | | 8,445,658 | |
| | |
Helen Frame Peters | | | 43,049,228 | | | | 8,470,416 | |
| | |
Susan J. Sutherland | | | 43,071,164 | | | | 8,448,480 | |
Eaton Vance
Risk-Managed Diversified Equity Income Fund
June 30, 2021
Officers and Trustees
Officers
Edward J. Perkin
President
Deidre E. Walsh
Vice President and Chief Legal Officer
James F. Kirchner
Treasurer
Kimberly M. Roessiger
Secretary
Richard F. Froio
Chief Compliance Officer
Trustees
George J. Gorman
Chairperson
Thomas E. Faust Jr.*
Mark R. Fetting
Cynthia E. Frost
Valerie A. Mosley
William H. Park
Helen Frame Peters
Keith Quinton
Marcus L. Smith
Susan J. Sutherland
Scott E. Wennerholm
Eaton Vance Funds
| | |
| Privacy Notice | | April 2021 |
| | |
| |
| FACTS | | WHAT DOES EATON VANCE DO WITH YOUR
PERSONAL INFORMATION? |
| | | |
| |
| | |
| Why? | | Financial companies choose how they share your personal information. Federal law gives consumers the right to limit some but not all sharing. Federal law also requires us to tell you how we collect, share, and protect your personal information. Please read this notice carefully to understand what we do. |
| | |
| | | |
| What? | | The types of personal information we collect and share depend on the product or service you have with us. This information can include: ∎ Social Security number and income ∎ investment experience and risk tolerance ∎ checking account number and wire transfer instructions |
| | |
| | | |
| How? | | All financial companies need to share customers’ personal information to run their everyday business. In the section below, we list the reasons financial companies can share their customers’ personal information; the reasons Eaton Vance chooses to share; and whether you can limit this sharing. |
| | |
| | | |
| | | | |
Reasons we can share your
personal information | | Does Eaton Vance share? | | Can you limit this sharing? |
| For our everyday business purposes — such as to process your transactions, maintain your account(s), respond to court orders and legal investigations, or report to credit bureaus | | Yes | | No |
| For our marketing purposes — to offer our products and services to you | | Yes | | No |
| For joint marketing with other financial companies | | No | | We don’t share |
| For our investment management affiliates’ everyday business purposes — information about your transactions, experiences, and creditworthiness | | Yes | | Yes |
| For our affiliates’ everyday business purposes — information about your transactions and experiences | | Yes | | No |
| For our affiliates’ everyday business purposes — information about your creditworthiness | | No | | We don’t share |
| For our investment management affiliates to market to you | | Yes | | Yes |
| For our affiliates to market to you | | No | | We don’t share |
| For nonaffiliates to market to you | | No | | We don’t share |
| | |
| To limit our sharing | | Call toll-free 1-800-262-1122 or email: EVPrivacy@eatonvance.com Please note: If you are a new customer, we can begin sharing your information 30 days from the date we sent this notice. When you are no longer our customer, we continue to share your information as described in this notice. However, you can contact us at any time to limit our sharing. |
| | |
| | | |
| | |
| Questions? | | Call toll-free 1-800-262-1122 or email: EVPrivacy@eatonvance.com |
| | |
| | | |
Eaton Vance Funds
| | |
| Privacy Notice — continued | | April 2021 |
| | |
| Who we are |
| Who is providing this notice? | | Eaton Vance Management, Eaton Vance Distributors, Inc., Eaton Vance Trust Company, Eaton Vance Management (International) Limited, Eaton Vance Advisers International Ltd., Eaton Vance Global Advisors Limited, Eaton Vance Management’s Real Estate Investment Group, Boston Management and Research, Calvert Research and Management, Eaton Vance and Calvert Fund Families and our investment advisory affiliates (“Eaton Vance”) (see Investment Management Affiliates definition below) |
| What we do |
| How does Eaton Vance protect my personal information? | | To protect your personal information from unauthorized access and use, we use security measures that comply with federal law. These measures include computer safeguards and secured files and buildings. We have policies governing the proper handling of customer information by personnel and requiring third parties that provide support to adhere to appropriate security standards with respect to such information. |
| How does Eaton Vance collect my personal information? | | We collect your personal information, for example, when you ∎ open an account or make deposits or withdrawals from your account ∎ buy securities from us or make a wire transfer ∎ give us your contact information We also collect your personal information from others, such as credit bureaus, affiliates, or other companies. |
| Why can’t I limit all sharing? | | Federal law gives you the right to limit only ∎ sharing for affiliates’ everyday business purposes — information about your creditworthiness ∎ affiliates from using your information to market to you ∎ sharing for nonaffiliates to market to you State laws and individual companies may give you additional rights to limit sharing. See below for more on your rights under state law. |
| Definitions |
| Investment Management Affiliates | | Eaton Vance Investment Management Affiliates include registered investment advisers, registered broker-dealers, and registered and unregistered funds. Investment Management Affiliates does not include entities associated with Morgan Stanley Wealth Management, such as Morgan Stanley Smith Barney LLC and Morgan Stanley & Co. |
| Affiliates | | Companies related by common ownership or control. They can be financial and nonfinancial companies. ∎ Our affiliates include companies with a Morgan Stanley name and financial companies such as Morgan Stanley Smith Barney LLC and Morgan Stanley & Co. |
| Nonaffiliates | | Companies not related by common ownership or control. They can be financial and nonfinancial companies. ∎ Eaton Vance does not share with nonaffiliates so they can market to you. |
| Joint marketing | | A formal agreement between nonaffiliated financial companies that together market financial products or services to you. ∎ Eaton Vance doesn’t jointly market. |
| Other important information |
Vermont: Except as permitted by law, we will not share personal information we collect about Vermont residents with Nonaffiliates unless you provide us with your written consent to share such information. California: Except as permitted by law, we will not share personal information we collect about California residents with Nonaffiliates and we will limit sharing such personal information with our Affiliates to comply with California privacy laws that apply to us. |
Eaton Vance Funds
IMPORTANT NOTICES
Delivery of Shareholder Documents. The Securities and Exchange Commission (SEC) permits funds to deliver only one copy of shareholder documents, including prospectuses, proxy statements and shareholder reports, to fund investors with multiple accounts at the same residential or post office box address. This practice is often called “householding” and it helps eliminate duplicate mailings to shareholders. American Stock Transfer & Trust Company, LLC (“AST”), the closed-end funds transfer agent, or your financial intermediary, may household the mailing of your documents indefinitely unless you instruct AST, or your financial intermediary, otherwise. If you would prefer that your Eaton Vance documents not be householded, please contact AST or your financial intermediary. Your instructions that householding not apply to delivery of your Eaton Vance documents will typically be effective within 30 days of receipt by AST or your financial intermediary.
Portfolio Holdings. Each Eaton Vance Fund and its underlying Portfolio(s) (if applicable) files a schedule of portfolio holdings on Part F to Form N-PORT with the SEC. Certain information filed on Form N-PORT may be viewed on the Eaton Vance website at www.eatonvance.com, by calling Eaton Vance at 1-800-262-1122 or in the EDGAR database on the SEC’s website at www.sec.gov.
Proxy Voting. From time to time, funds are required to vote proxies related to the securities held by the funds. The Eaton Vance Funds or their underlying Portfolios (if applicable) vote proxies according to a set of policies and procedures approved by the Funds’ and Portfolios’ Boards. You may obtain a description of these policies and procedures and information on how the Funds or Portfolios voted proxies relating to portfolio securities during the most recent 12-month period ended June 30, without charge, upon request, by calling 1-800-262-1122 and by accessing the SEC’s website at www.sec.gov.
Share Repurchase Program. The Fund’s Board of Trustees has approved a share repurchase program authorizing the Fund to repurchase up to 10% of its common shares outstanding as of the last day of the prior calendar year in open-market transactions at a discount to net asset value. The repurchase program does not obligate the Fund to purchase a specific amount of shares. The Fund’s repurchase activity, including the number of shares purchased, average price and average discount to net asset value, is disclosed in the Fund’s annual and semi-annual reports to shareholders.
Additional Notice to Shareholders. If applicable, a Fund may also redeem or purchase its outstanding preferred shares in order to maintain compliance with regulatory requirements, borrowing or rating agency requirements or for other purposes as it deems appropriate or necessary.
Closed-End Fund Information. Eaton Vance closed-end funds make fund performance data and certain information about portfolio characteristics available on the Eaton Vance website shortly after the end of each month. Other information about the funds is available on the website. The funds’ net asset value per share is readily accessible on the Eaton Vance website. Portfolio holdings for the most recent month-end are also posted to the website approximately 30 days following the end of the month. This information is available at www.eatonvance.com on the fund information pages under “Individual Investors — Closed-End Funds”.
This Page Intentionally Left Blank
This Page Intentionally Left Blank
This Page Intentionally Left Blank
Investment Adviser and Administrator
Eaton Vance Management
Two International Place
Boston, MA 02110
Custodian
State Street Bank and Trust Company
State Street Financial Center, One Lincoln Street
Boston, MA 02111
Transfer Agent
American Stock Transfer & Trust Company, LLC
6201 15th Avenue
Brooklyn, NY 11219
Fund Offices
Two International Place
Boston, MA 02110

7759 6.30.21
Not required in this filing.
| Item 3. | Audit Committee Financial Expert |
Not required in this filing.
| Item 4. | Principal Accountant Fees and Services |
Not required in this filing.
| Item 5. | Audit Committee of Listed Registrants |
Not required in this filing.
| Item 6. | Schedule of Investments |
Please see schedule of investments contained in the Report to Stockholders included under Item 1 of this Form N-CSR.
| Item 7. | Disclosure of Proxy Voting Policies and Procedures for Closed-End Management Investment Companies |
Not required in this filing.
| Item 8. | Portfolio Managers of Closed-End Management Investment Companies |
Not required in this filing.
| Item 9. | Purchases of Equity Securities by Closed-End Management Investment Company and Affiliated Purchasers |
No such purchases this period.
| Item 10. | Submission of Matters to a Vote of Security Holders |
No material changes.
| Item 11. | Controls and Procedures |
(a) It is the conclusion of the registrant’s principal executive officer and principal financial officer that the effectiveness of the registrant’s current disclosure controls and procedures (such disclosure controls and procedures having been evaluated within 90 days of the date of this filing) provide reasonable assurance that the information required to be disclosed by the registrant has been recorded, processed, summarized and reported within the time period specified in the Commission’s rules and forms and that the information required to be disclosed by the registrant has been accumulated and communicated to the registrant’s principal executive officer and principal financial officer in order to allow timely decisions regarding required disclosure.
(b) There have been no changes in the registrant’s internal controls over financial reporting during the period covered by this report that has materially affected, or is reasonably likely to materially affect, the registrant’s internal control over financial reporting.
| Item 12. | Disclosure of Securities Lending Activities for Closed-End Management Investment Companies |
No activity to report for the registrant’s most recent fiscal year end.
Signatures
Pursuant to the requirements of the Securities Exchange Act of 1934 and the Investment Company Act of 1940, the registrant has duly caused this report to be signed on its behalf by the undersigned, thereunto duly authorized.
Eaton Vance Risk-Managed Diversified Equity Income Fund
| | |
| By: | | /s/ Edward J. Perkin |
| | Edward J. Perkin |
| | President |
| |
| Date: | | August 19, 2021 |
Pursuant to the requirements of the Securities Exchange Act of 1934 and the Investment Company Act of 1940, this report has been signed below by the following persons on behalf of the registrant and in the capacities and on the dates indicated.
| | |
| By: | | /s/ James F. Kirchner |
| | James F. Kirchner |
| | Treasurer |
| |
| Date: | | August 19, 2021 |
| |
| By: | | /s/ Edward J. Perkin |
| | Edward J. Perkin |
| | President |
| |
| Date: | | August 19, 2021 |