Washington, D.C. 20549
Wisconsin Capital Funds, Inc.
1200 John Q. Hammons Drive
Thomas G. Plumb
1200 John Q. Hammons Drive
Item 1. Report to Stockholders.
Plumb Funds is a trademark of
Wisconsin Capital Funds, Inc.
Plumb Balanced Fund
Plumb Equity Fund
ANNUAL REPORT
March 31, 2009
www.plumbfunds.com
PLUMB FUNDS
Dear Fellow Shareholders:
2008 may well be remembered as our generation’s “Great Recession”. It is now widely known that the housing boom of 2000-2006 was fueled by extremely lax lending standards and historically low interest rates. The fallout from lenders’ poor decision making coupled with falling real estate prices revealed the insolvency of many of our nation’s financial institutions. We witnessed the collapse of Bear Stearns, Lehman Brothers, American International Group, Fannie Mae, Freddie Mac, Countrywide Financial, Washington Mutual, IndyMac and many other smaller banks and financial institutions. Without the generous support of the US taxpayer, many more financial institutions that made poor business decisions with other peoples’ money and exorbitant leverage would be added to the list.
What started as a U.S. recession quickly spread across the globe, and many economists now believe that we are in the midst of the most severe global economic downturn since the 1930’s. The International Monetary Fund estimates that worldwide losses tied to bad loans and securitized assets may reach $4.1 trillion by the end of 2010.
For the year ending March 31, 2009, the U.S. Stock Market returned negative 38.09 percent as measured by the S&P 500. During the same one-year period, the Plumb Balanced Fund performed better than the U.S. Stock Market with a return of negative 25.33 percent and 2.66 percent better than the Morningstar Moderate Allocation Category of mutual funds with a return of negative 27.99 percent. The Plumb Equity Fund returned a negative 30.81 percent, also an improvement over its benchmark return (i.e. the S&P 500) of negative 38.09 percent. We are proud that, for the one-year period ending March 31, 2009, Morningstar ranked the Plumb Equity Fund in the top five percent among 2,268 funds in the Large Blend category based on total returns. For the one-year period ending March 31, 2009, Morningstar ranked the Balanced Fund in the top 20 percent among 1,306 funds in the Moderate Allocation category based on total returns, although we are disappointed that our returns over the period were negative. In 2009, we aim to return to an overall positive return on investment to our shareholders.
We noted in our letter last year that we were approaching the financial sector with extreme caution. It is this caution that helped us to outperform our peers in 2008. The S&P 500 Financial segment was down 62.87% over the last twelve months. By being underweighted to this sector and owning stocks that did not deteriorate as badly, this aided your Fund’s relative performance. We continue to remain extremely cautious on the financial sector. Non-performing assets at the major banks continue to rise at an accelerating pace, and delinquencies have spread from subprime loans to prime loans as unemployment has increased and the economy continues to deteriorate. We expect continued shareholder dilution at many of the nation’s largest banks. We believe commercial real estate is only now starting to show signs of deterioration, and that significant risk remains in these assets. At the end of our 2009 fiscal year, we had very little exposure to financial institutions, and still do not yet know when we will return to buying the common shares of banks. We expect future opportunities in the banking sector, possibly in 2009. If we see them, we are in a position to quickly take advantage of them. But if bank fundamentals continue to deteriorate, we would rather stay out of that sector rather than to expose you to what we believe to be an unreasonable tradeoff between risk and reward.
PLUMB FUNDS
Our investments in the school stocks, most notably the Apollo Group and Corinthian Colleges, performed well and contributed to our outperformance. Both companies have strong balance sheets and improving profitability. We believe that for the fiscal year ended March 31, 2009 both companies are also well situated in the economic downturn, as people tend to go back to school as unemployment rises. We continue to hold Corinthian Colleges as we believe the company still provides an attractive tradeoff between risk and reward as the company’s margins continue to expand.
Our holdings in the technology sector also contributed to our funds relative outperformance compared to our benchmark. We spent most of 2008 overweight in technology, as these companies tend to have strong balance sheets with little or no debt. The companies we own also have strong market positions, generate a lot of cash relative to peers and we believe have durable competitive advantages. The main contributors to our outperformance included Cisco Systems, EMC, and Corning, while the main detractor was Anixter International.
We fully expect these companies will survive the credit crisis unimpaired. We use bonds in the Balanced Fund to moderate the volatility of the stock market, but bonds can be very volatile in their own right if they are exposed to either credit or interest rate risk. Preferred stocks of major financial institutions had historically been considered stable additions to a fixed income portfolio. Unfortunately, the Balanced Fund had exposure to some of these instruments and they significantly detracted from the performance of the fixed income portfolio. The Balanced Fund still has limited exposure to some of these instruments and holds some bonds whose creditworthiness is not what it used to be.
However, the overall profile of the fixed income investments is relatively conservative, with an average Moody’s quality rating of A and an average maturity of 3.7 years. We are finding attractive fixed income opportunities in companies with strong balance sheets that should be able to withstand the problems in the financial sector. During the year, high grade corporate bonds were trading at historically high spreads over treasuries. We took advantage of the wide spreads and expect them to provide attractive risk-adjusted returns over time. We are excited about the opportunities we are finding in fixed income.
Our strategy continues to be to keep bonds short and to buy only investment grade bonds. We are positioned today in bonds that on average have less than four years to maturity and yields in excess of 5%. In addition, the Balanced Fund holds some preferred stocks that are obligations of very strong financial institutions. These are paying almost 8% and we believe that such a yield will be quite attractive over the next few years.
PLUMB FUNDS
Conclusion
We expect the financial crisis that officially started in 2008 to go down in the history books as our generation’s “Great Recession”. Only time will tell whether we have yet seen the worst of the recession, or how long the current situation will last. While we have no ability to call market bottoms, we can tell you that we are finding what we believe are great businesses at fantastic prices-prices that we haven’t seen in decades. In time, we believe we will be rewarded handsomely for these findings.
Sincerely,
Thomas G. Plumb
Portfolio Manager
Past performance is not a guarantee of future results.
Fund holdings and sector allocations are subject to change at any time and should not be considered a recommendation to buy or sell any security. Please refer to the Schedule of Investments in this report for complete holdings information.
Current and future portfolio holdings are subject to risk.
Mutual fund investing involves risk. Principal loss is possible. The Funds may invest in smaller companies, which involve additional risks such as limited liquidity and greater volatility. Temporary Defensive Positions – Under adverse market conditions the funds could invest a substantial portion of their assets in US Treasury Securities and money market securities, which could reduce the benefit from any upswing in the market.
The Plumb Balanced Fund will invest in debt securities, which typically decrease in value when interest rates rise. This risk is usually greater for longer-term debt securities. Investment by the Fund in lower-rated and non-rated securities presents a greater risk of loss to principal and interest than higher-rated securities. The Fund may engage in short-term trading, which could produce higher transaction costs and taxable distributions and lower the fund’s after tax performance. Investments in Asset Backed and Mortgage Backed Securities include additional risks that investors should be aware of such as credit risk, prepayment risk, possible illiquidity and default, as well as increased susceptibility to adverse economic developments.
The S&P 500 Index is a broad based unmanaged index of 500 stocks, which is widely recognized as representative of the equity market in general. It is not possible to invest directly in an index.
Morningstar rankings represent a fund’s total-return percentile rank relative to all funds that have the same Morningstar category. The highest percentile rank is 1 and the lowest is 100. It is based on Morningstar total return, which includes both income and capital gains or losses and is not adjusted for sales charges or redemption fees.
PLUMB FUNDS
Bonds which are rated A by Moody’s Investor Services possess many favorable investment attributes and are to be considered as upper medium grade obligations. Factors giving security to principal and interest are considered adequate but elements may be present which suggest a susceptibility to impairment sometime in the future.
PLUMB FUNDS
Expense Example
March 31, 2009 (Unaudited)
As a shareholder of the Plumb Funds (the “Funds”), you incur ongoing costs, including investment advisory fees; distribution (12b-1) fees; and other Fund expenses. This example is intended to help you understand your ongoing costs (in dollars) of investing in the Funds and to compare these costs with the ongoing costs of investing in other mutual funds.
The Example is based on an investment of $1,000 invested at the beginning of the period and held for the entire period (October 1, 2008 – March 31, 2009).
Actual Expenses
The first line of the table on the following page provides information about actual account values and actual expenses. However, the table does not include shareholder specific fees such as the $15.00 fee charged for wire redemptions. The table also does not include portfolio trading commissions and related trading costs. You may use the information in this line, together with the amount you invested, to estimate the expenses that you paid over the period. Simply divide your account value by $1,000 (for example, an $8,600 account value divided by $1,000 = 8.6), then multiply the result by the number in the first line under the heading entitled “Expenses Paid During the Period” to estimate the expenses you paid on your account during this period.
Hypothetical Example for Comparison Purposes
The second line of the table on the following page provides information about hypothetical account values and hypothetical expenses based on the Fund’s actual expense ratio and an assumed rate of return of 5% per year before expenses, which is not the Fund’s actual return. The hypothetical account values and expenses may not be used to estimate the actual ending account balance or expenses you paid for the period. You may use this information to compare the ongoing costs of investing in the Funds and other funds. To do so, compare this 5% hypothetical example with the 5% hypothetical examples that appear in the shareholder reports of the other funds.
Please note that the expenses shown in the table are meant to highlight your ongoing costs only and do not reflect any transactional costs, such as sales charges (loads), redemption fees, or exchange fees, which, although not charged by the Funds, may be charged by other funds. Therefore, the second line of the table is useful in comparing ongoing costs only, and will not help you determine the relative costs of owning different funds. In addition, if these transactional costs were included, your costs would have been higher.
PLUMB FUNDS
Expense Example (Continued)
March 31, 2009
Plumb Balanced Fund
| | | | | | | | | Expenses Paid | |
| | | Beginning | | | Ending | | | During the Period* | |
| | | Account Value | | | Account Value | | | October 1, 2008 to | |
| | | October 1, 2008 | | | March 31, 2009 | | | March 31, 2009 | |
| | | | | | | | | | |
| Actual | | $ | 1,000.00 | | | $ | 804.50 | | | $ | 4.95 | |
| | | | | | | | | | | | | |
| Hypothetical | | | | | | | | | | | | |
| (5% return per | | | | | | | | | | | | |
| year before expenses) | | $ | 1,000.00 | | | $ | 1,019.45 | | | $ | 5.54 | |
| * | Expenses are equal to the Fund’s annualized expense ratio of 1.10%, multiplied by the average account value over the period, multiplied by 182/365 (to reflect the partial year period). |
Plumb Equity Fund
| | | | | | | | | Expenses Paid | |
| | | Beginning | | | Ending | | | During the Period* | |
| | | Account Value | | | Account Value | | | October 1, 2008 to | |
| | | October 1, 2008 | | | March 31, 2009 | | | March 31, 2009 | |
| | | | | | | | | | |
| Actual | | $ | 1,000.00 | | | $ | 723.50 | | | $ | 5.16 | |
| | | | | | | | | | | | | |
| Hypothetical | | | | | | | | | | | | |
| (5% return per | | | | | | | | | | | | |
| year before expenses) | | $ | 1,000.00 | | | $ | 1,018.95 | | | $ | 6.04 | |
| * | Expenses are equal to the Fund’s annualized expense ratio of 1.20%, multiplied by the average account value over the period, multiplied by 182/365 (to reflect the partial year period). |
PLUMB FUNDS
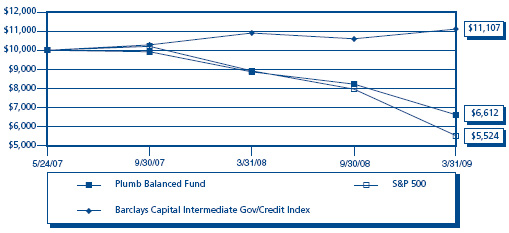
Plumb Balanced Fund
(Unaudited)
Growth of a Hypothetical $10,000 Investment at March 31, 2009 vs. Barclays
Capital Intermediate Government/Credit Bond Index & S&P 500 Index
Average Annual Rate of Return
Periods ended March 31, 2009
| | | | Since Inception |
| | 1 Year | | 5/24/2007 |
| Plumb Balanced Fund | -25.33% | | -19.99% |
| Barclays Capital Intermediate Government/Credit Bond Index | 1.96% | | 5.83% |
| S&P 500 Index | -38.09% | | -27.38% |
Performance data quoted represents past performance and does not guarantee future results. The investment return and principal value of an investment will fluctuate so that an investor’s shares, when redeemed, may be worth more or less than their original cost. Current performance of the Fund may be lower or higher than the performance quoted. Performance data current to the most recent month end may be obtained by calling 1-866-987-7888.
The line graph and performance table do not reflect the deduction of taxes that a shareholder may pay on fund distributions or the redemption of fund shares. Total return calculations reflect expense reimbursements and fee waivers.
The Barclays Capital Intermediate Government/Credit Bond Index is an unmanaged index which includes nonconvertible bonds publicly issued by the U.S. government or its agencies; corporate bonds guaranteed by the U.S. government and quasi-federal corporations; and publicly issued, fixed rate, nonconvertible domestic bonds of companies in industry, public utilities, and finance.
The Standard & Poor’s 500 Index (S&P 500) is an unmanaged, capitalization-weighted index generally representative of the U.S. market for large capitalization stocks.
The Fund’s portfolio holdings may differ significantly from the securities held in the relevant index and, unlike a mutual fund, an unmanaged index assumes no transaction costs, taxes, management fees or other expenses. You cannot invest directly in an index.
PLUMB FUNDS
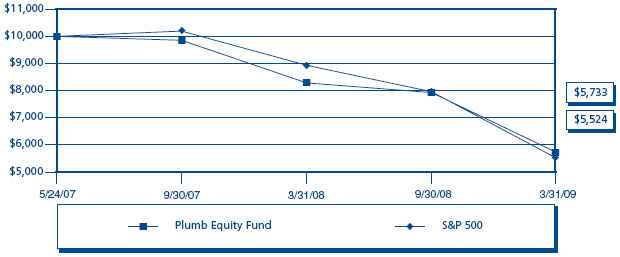
Plumb Equity Fund
(Unaudited)
Growth of a Hypothetical $10,000 Investment
at March 31, 2009 vs. S&P 500 Index
Average Annual Rate of Return
Periods ended March 31, 2009
| | | | Since Inception |
| | 1 Year | | 5/24/2007 |
| Plumb Equity Fund | -30.81% | | -25.91% |
| S&P 500 Index | -38.09% | | -27.38% |
Performance data quoted represents past performance and does not guarantee future results. The investment return and principal value of an investment will fluctuate so that an investor’s shares, when redeemed, may be worth more or less than their original cost. Current performance of the Fund may be lower or higher than the performance quoted. Performance data current to the most recent month end may be obtained by calling 1-866-987-7888.
The line graph and performance table do not reflect the deduction of taxes that a shareholder may pay on fund distributions or the redemption of fund shares. Total return calculations reflect expense reimbursements and fee waivers.
The Standard & Poor’s 500 Index (S&P 500) is an unmanaged, capitalization-weighted index generally representative of the U.S. market for large capitalization stocks.
The Fund’s portfolio holdings may differ significantly from the securities held in the relevant index and, unlike a mutual fund, an unmanaged index assumes no transaction costs, taxes, management fees or other expenses. You cannot invest directly in an index.
PLUMB FUNDS
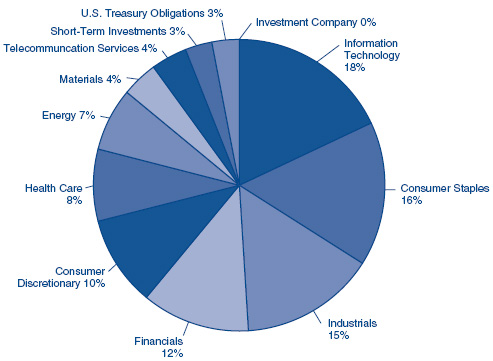
Plumb Balanced Fund
Investments by Sector as of March 31, 2009
(as a Percentage of Total Investments) (Unaudited)
PLUMB FUNDS
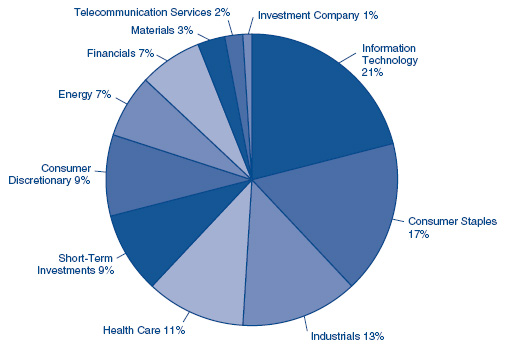
Plumb Equity Fund
Investments by Sector as of March 31, 2009
(as a Percentage of Total Investments) (Unaudited)
PLUMB FUNDS
Plumb Balanced Fund
Schedule of Investments – March 31, 2009
| | | Shares | | | Value | |
| COMMON STOCKS – 55.09% | | | | | | |
| | | | | | | |
| Aerospace & Defense – 1.07% | | | | | | |
| Boeing Co. | | | 10,500 | | | $ | 373,590 | |
| | | | | | | | | |
| Air Freight & Logistics – 1.54% | | | | | | | | |
| United Parcel Service, Inc. – Class B | | | 10,900 | | | | 536,498 | |
| | | | | | | | | |
| Beverage and Tobacco Product Manufacturing – 0.48% | | | | | | | | |
| Wendy’s / Arby’s Group, Inc. – Class A | | | 32,822 | | | | 165,095 | |
| | | | | | | | | |
| Chemicals – 1.29% | | | | | | | | |
| EI Du Pont de Nemours & Co. | | | 20,000 | | | | 446,600 | |
| | | | | | | | | |
| Communications Equipment – 3.53% | | | | | | | | |
| Cisco Systems, Inc. (a) | | | 60,000 | | | | 1,006,200 | |
| Corning, Inc. | | | 16,500 | | | | 218,955 | |
| | | | | | | | 1,225,155 | |
| Computers & Peripherals – 2.04% | | | | | | | | |
| Apple, Inc. (a) | | | 1,000 | | | | 105,120 | |
| EMC Corp. (a) | | | 53,000 | | | | 604,200 | |
| | | | | | | | 709,320 | |
| Construction & Engineering – 0.97% | | | | | | | | |
| McDermott International, Inc. (a)(b) | | | 25,200 | | | | 337,428 | |
| | | | | | | | | |
| Diversified Consumer Services – 1.96% | | | | | | | | |
| Apollo Group, Inc. (a) | | | 2,500 | | | | 195,825 | |
| Corinthian Colleges, Inc. (a) | | | 25,000 | | | | 486,250 | |
| | | | | | | | 682,075 | |
| Diversified Financial Services – 3.99% | | | | | | | | |
| CME Group, Inc. | | | 3,670 | | | | 904,251 | |
| Moody’s Corp. | | | 21,000 | | | | 481,320 | |
| | | | | | | | 1,385,571 | |
| Diversified Telecommunication Services – 1.13% | | | | | | | | |
| Verizon Communications, Inc. | | | 13,000 | | | | 392,600 | |
| | | | | | | | | |
| Energy Equipment & Services – 1.11% | | | | | | | | |
| ENSCO International, Inc. | | | 7,800 | | | | 205,920 | |
| Patterson-UTI Energy, Inc. | | | 20,000 | | | | 179,200 | |
| | | | | | | | 385,120 | |
The accompanying notes are an integral part of these financial statements.
PLUMB FUNDS
Plumb Balanced Fund
Schedule of Investments – March 31, 2009 (Continued)
| | | Shares | | | Value | |
| COMMON STOCKS (Continued) | | | | | | |
| | | | | | | |
| Food & Staples Retailing – 5.39% | | | | | | |
| CVS / Caremark Corp. | | | 19,100 | | | $ | 525,059 | |
| Walgreen Co. | | | 27,300 | | | | 708,708 | |
| Wal-Mart Stores, Inc. | | | 12,300 | | | | 640,830 | |
| | | | | | | | 1,874,597 | |
| | | | | | | | | |
| Food Products – 5.51% | | | | | | | | |
| Cadbury PLC – ADR (b) | | | 17,000 | | | | 515,100 | |
| The Hain Celestial Group, Inc. (a) | | | 27,000 | | | | 384,480 | |
| Kraft Foods, Inc. | | | 17,600 | | | | 392,304 | |
| Nestle SA – ADR (b) | | | 18,450 | | | | 624,385 | |
| | | | | | | | 1,916,269 | |
| | | | | | | | | |
| Health Care Equipment & Supplies – 0.74% | | | | | | | | |
| Zimmer Holdings, Inc. (a) | | | 7,000 | | | | 255,500 | |
| | | | | | | | | |
| Health Care Providers & Services – 1.20% | | | | | | | | |
| UnitedHealth Group, Inc. | | | 20,000 | | | | 418,600 | |
| | | | | | | | | |
| Industrial Conglomerates – 2.14% | | | | | | | | |
| 3M Co. | | | 7,500 | | | | 372,900 | |
| Tyco International Ltd. (b) | | | 19,000 | | | | 371,640 | |
| | | | | | | | 744,540 | |
| | | | | | | | | |
| IT Services – 4.41% | | | | | | | | |
| Automatic Data Processing, Inc. | | | 16,300 | | | | 573,108 | |
| Paychex, Inc. | | | 27,500 | | | | 705,925 | |
| The Western Union Co. | | | 20,000 | | | | 251,400 | |
| | | | | | | | 1,530,433 | |
| | | | | | | | | |
| Management Consulting Services – 1.07% | | | | | | | | |
| ABB Ltd. – ADR (b) | | | 26,700 | | | | 372,198 | |
| | | | | | | | | |
| Media – 2.92% | | | | | | | | |
| The McGraw-Hill Companies, Inc. | | | 30,500 | | | | 697,535 | |
| The Walt Disney Co. | | | 17,500 | | | | 317,800 | |
| | | | | | | | 1,015,335 | |
| | | | | | | | | |
| Oil, Gas & Consumable Fuels – 4.20% | | | | | | | | |
| Chevron Corp. | | | 8,900 | | | | 598,436 | |
| Exxon Mobil Corp. | | | 8,200 | | | | 558,420 | |
| Petro-Canada (b) | | | 11,400 | | | | 303,012 | |
| | | | | | | | 1,459,868 | |
The accompanying notes are an integral part of these financial statements.
PLUMB FUNDS
Plumb Balanced Fund
Schedule of Investments – March 31, 2009 (Continued)
| | | Shares | | | Value | |
| COMMON STOCKS (Continued) | | | | | | |
| | | | | | | |
| Pharmaceuticals – 4.50% | | | | | | |
| Genzyme Corp. (a) | | | 3,400 | | | $ | 201,926 | |
| Johnson & Johnson | | | 16,000 | | | | 841,600 | |
| Merck & Co., Inc. | | | 9,000 | | | | 240,750 | |
| Sanofi-Aventis SA – ADR (b) | | | 10,000 | | | | 279,300 | |
| | | | | | | | 1,563,576 | |
| | | | | | | | | |
| Road & Rail – 0.97% | | | | | | | | |
| Burlington Northern Santa Fe Corp. | | | 5,600 | | | | 336,840 | |
| | | | | | | | | |
| Semiconductor & Semiconductor Equipment – 0.61% | | | | | | | | |
| Microchip Technology, Inc. | | | 10,000 | | | | 211,900 | |
| | | | | | | | | |
| Software – 1.37% | | | | | | | | |
| Microsoft Corp. | | | 26,000 | | | | 477,620 | |
| | | | | | | | | |
| Specialty Retail – 0.19% | | | | | | | | |
| Cost Plus, Inc. (a) | | | 68,541 | | | | 65,114 | |
| | | | | | | | | |
| Tobacco – 0.76% | | | | | | | | |
| Philip Morris International, Inc. | | | 7,400 | | | | 263,292 | |
| | | | | | | | | |
| TOTAL COMMON STOCKS | | | | | | | | |
(Cost $25,136,012) | | | | | | | 19,144,734 | |
| | | | | | | | | |
| PREFERRED STOCKS – 1.25% | | | | | | | | |
| | | | | | | | | |
| Diversified Financial Services – 0.38% | | | | | | | | |
| Citigroup Capital VII, 7.125% | | | 15,000 | | | | 133,050 | |
| | | | | | | | | |
| Commercial Banks – 0.83% | | | | | | | | |
| Fifth Third Capital Trust V, 7.250% (c) | | | 30,000 | | | | 286,500 | |
| | | | | | | | | |
| Thrifts & Mortgage Finance – 0.04% | | | | | | | | |
| Federal National Mortgage Association, 8.250% | | | 20,000 | | | | 14,200 | |
| | | | | | | | | |
| TOTAL PREFERRED STOCKS | | | | | | | | |
(Cost $976,718) | | | | | | | 433,750 | |
The accompanying notes are an integral part of these financial statements.
PLUMB FUNDS
Plumb Balanced Fund
Schedule of Investments – March 31, 2009 (Continued)
| | | Shares | | | Value | |
| EXCHANGE-TRADED FUND – 0.18% | | | | | | |
| iShares Silver Trust (a) | | | 5,000 | | | $ | 64,000 | |
| | | | | | | | | |
| TOTAL EXCHANGE-TRADED FUND | | | | | | | | |
(Cost $67,200) | | | | | | | 64,000 | |
| | | | | | | | | |
| | | Principal | | | | | |
| | | Amount | | | | | |
| CONVERTIBLE BONDS – 2.45% | | | | | | | | |
| | | | | | | | | |
| Health Care Equipment & Supplies – 1.79% | | | | | | | | |
| Medtronic, Inc. | | | | | | | | |
1.625%, 04/15/2013 | | $ | 700,000 | | | | 622,125 | |
| | | | | | | | | |
| Support Activities for Mining – 0.66% | | | | | | | | |
| Transocean, Inc. (b) | | | | | | | | |
1.625%, 12/15/2037 | | | 250,000 | | | | 230,937 | |
| | | | | | | | | |
| TOTAL CONVERTIBLE BONDS | | | | | | | | |
(Cost $849,220) | | | | | | | 853,062 | |
| | | | | | | | | |
| CORPORATE BONDS – 33.53% | | | | | | | | |
| | | | | | | | | |
| Capital Markets – 2.84% | | | | | | | | |
| The Bear Stearns Companies, LLC | | | | | | | | |
4.550%, 06/23/2010 | | | 1,000,000 | | | | 987,331 | |
| | | | | | | | | |
| Chemicals – 2.96% | | | | | | | | |
| EI Du Pont De Nemours & Co. | | | | | | | | |
6.875%, 10/15/2009 | | | 1,000,000 | | | | 1,029,882 | |
| | | | | | | | | |
| Computer and Electronic Product Manufacturing – 2.44% | | | | | | | | |
| Lexmark International, Inc. | | | | | | | | |
5.900%, 06/01/2013 | | | 1,000,000 | | | | 849,260 | |
| | | | | | | | | |
| Consumer Finance – 1.08% | | | | | | | | |
| American Express Co. | | | | | | | | |
4.750%, 06/17/2009 | | | 373,000 | | | | 373,852 | |
| | | | | | | | | |
| Credit Intermediation and Related Activities – 2.74% | | | | | | | | |
| Bank of America Corp. | | | | | | | | |
6.600%, 05/15/2010 | | | 500,000 | | | | 453,401 | |
The accompanying notes are an integral part of these financial statements.
PLUMB FUNDS
Plumb Balanced Fund
Schedule of Investments – March 31, 2009 (Continued)
| | | Principal | | | | |
| | | Amount | | | Value | |
| CORPORATE BONDS (Continued) | | | | | | |
| | | | | | | |
| Credit Intermediation and Related Activities (Continued) | | | | | | |
| Toyota Motor Credit Corp. | | | | | | |
4.911%, 01/09/2012 (c) | | $ | 500,000 | | | $ | 499,883 | |
| | | | | | | | 953,284 | |
| | | | | | | | | |
| Electric, Gas, And Sanitary Services – 2.91% | | | | | | | | |
| Integrys Energy Group, Inc. | | | | | | | | |
7.000%, 11/01/2009 | | | 1,000,000 | | | | 1,012,433 | |
| | | | | | | | | |
| Food & Staples Retailing – 2.93% | | | | | | | | |
| Wal-Mart Stores, Inc. | | | | | | | | |
6.875%, 08/10/2009 | | | 1,000,000 | | | | 1,018,764 | |
| | | | | | | | | |
| Food Products – 1.52% | | | | | | | | |
| Kraft Foods, Inc. | | | | | | | | |
6.250%, 06/01/2012 | | | 500,000 | | | | 527,946 | |
| | | | | | | | | |
| Industrial Conglomerates – 2.16% | | | | | | | | |
| General Electric Co. | | | | | | | | |
5.000%, 02/01/2013 | | | 750,000 | | | | 750,730 | |
| | | | | | | | | |
| Machinery – 1.49% | | | | | | | | |
| Caterpillar, Inc. | | | | | | | | |
7.900%, 12/15/2018 | | | 500,000 | | | | 518,211 | |
| | | | | | | | | |
| Miscellaneous Manufacturing – 1.44% | | | | | | | | |
| Mattel, Inc. | | | | | | | | |
7.480%, 04/22/2009 | | | 500,000 | | | | 500,831 | |
| | | | | | | | | |
| Non-depository Credit Institutions – 3.10% | | | | | | | | |
| American General Finance Corp. | | | | | | | | |
5.800%, 09/15/2013 | | | 500,000 | | | | 79,416 | |
| General Electric Capital Corp. | | | | | | | | |
5.200%, 02/01/2011 | | | 1,000,000 | | | | 996,572 | |
| | | | | | | | 1,075,988 | |
| | | | | | | | | |
| Software – 3.02% | | | | | | | | |
| Oracle Corp. | | | | | | | | |
5.000%, 01/15/2011 | | | 1,000,000 | | | | 1,048,840 | |
The accompanying notes are an integral part of these financial statements.
PLUMB FUNDS
Plumb Balanced Fund
Schedule of Investments – March 31, 2009 (Continued)
| | | Principal | | | | |
| | | Amount | | | Value | |
| CORPORATE BONDS (Continued) | | | | | | |
| | | | | | | |
| Specialty Retail – 2.90% | | | | | | |
| Home Depot, Inc. | | | | | | |
5.200%, 03/01/2011 | | $ | 1,000,000 | | | $ | 1,006,181 | |
| | | | | | | | | |
| TOTAL CORPORATE BONDS | | | | | | | | |
(Cost $12,073,260) | | | | | | | 11,653,533 | |
| | | | | | | | | |
| FOREIGN CORPORATE BONDS – 1.48% | | | | | | | | |
| Noble Holding International Inc. (b) | | | | | | | | |
7.375%, 03/15/2014 | | | 500,000 | | | | 514,777 | |
| TOTAL FOREIGN CORPORATE BONDS | | | | | | | | |
(Cost $519,132) | | | | | | | 514,777 | |
| | | | | | | | | |
| U.S. TREASURY OBLIGATIONS – 2.79% | | | | | | | | |
| U.S. Treasury Inflation Indexed Bonds – 2.79% | | | | | | | | |
4.250%, 01/15/2010 | | | 941,228 | | | | 967,994 | |
| TOTAL U.S. TREASURY OBLIGATIONS | | | | | | | | |
(Cost $959,576) | | | | | | | 967,994 | |
| | | Shares | | | | | |
| SHORT-TERM INVESTMENTS – 3.10% | | | | | | | | |
| Money Market Fund – 3.10% | | | | | | | | |
| AIM Liquid Assets Portfolio – Institutional | | | | | | | | |
Class, 0.75% (c) | | | 1,076,378 | | | | 1,076,378 | |
| | | | | | | | | |
| TOTAL SHORT-TERM INVESTMENTS | | | | | | | | |
(Cost $1,076,378) | | | | | | | 1,076,378 | |
| Total Investments | | | | | | | | |
(Cost $41,657,496) – 99.87% | | | | | | | 34,708,228 | |
| Other Assets in Excess of Liabilities – 0.13% | | | | | | | 45,519 | |
| TOTAL NET ASSETS – 100.00% | | | | | | $ | 34,753,747 | |
Percentages are stated as a percent of net assets.
ADR – American Depository Receipt
(a) Non-income producing security.
(b) Foreign issued security.
(c) Variable rate security. The rate listed is as of March 31, 2009.
The accompanying notes are an integral part of these financial statements.
PLUMB FUNDS
Plumb Equity Fund
Schedule of Investments – March 31, 2009
| | | Shares | | | Value | |
| COMMON STOCKS – 90.31% | | | | | | |
| | | | | | | |
| Aerospace & Defense – 2.30% | | | | | | |
| Boeing Co. | | | 7,000 | | | $ | 249,060 | |
| | | | | | | | | |
| Air Freight & Logistics – 2.41% | | | | | | | | |
| United Parcel Service, Inc. – Class B | | | 5,300 | | | | 260,866 | |
| | | | | | | | | |
| Biotechnology – 1.14% | | | | | | | | |
| BioMarin Pharmaceutical, Inc. (a) | | | 10,000 | | | | 123,500 | |
| | | | | | | | | |
| Chemicals – 2.99% | | | | | | | | |
| EI Du Pont de Nemours & Co. | | | 14,500 | | | | 323,785 | |
| | | | | | | | | |
| Communications Equipment – 5.28% | | | | | | | | |
| Cisco Systems, Inc. (a) | | | 27,000 | | | | 452,790 | |
| Corning, Inc. | | | 9,000 | | | | 119,430 | |
| | | | | | | | 572,220 | |
| Computers & Peripherals – 3.87% | | | | | | | | |
| Apple, Inc. (a) | | | 1,000 | | | | 105,120 | |
| EMC Corp. (a) | | | 27,500 | | | | 313,500 | |
| | | | | | | | 418,620 | |
| Construction & Engineering – 1.48% | | | | | | | | |
| McDermott International, Inc. (a)(b) | | | 12,000 | | | | 160,680 | |
| | | | | | | | | |
| Diversified Consumer Services – 3.42% | | | | | | | | |
| Apollo Group, Inc. – Class A (a) | | | 1,500 | | | | 117,495 | |
| Corinthian Colleges, Inc. (a) | | | 13,000 | | | | 252,850 | |
| | | | | | | | 370,345 | |
| Diversified Financial Services – 6.65% | | | | | | | | |
| CME Group, Inc. | | | 1,900 | | | | 468,141 | |
| Moody’s Corp. | | | 11,000 | | | | 252,120 | |
| | | | | | | | 720,261 | |
| Diversified Telecommunication Services – 1.81% | | | | | | | | |
| Verizon Communications, Inc. | | | 6,500 | | | | 196,300 | |
| | | | | | | | | |
| Energy Equipment & Services – 1.80% | | | | | | | | |
| ENSCO International, Inc. | | | 4,000 | | | | 105,600 | |
| Patterson-UTI Energy, Inc. | | | 10,000 | | | | 89,600 | |
| | | | | | | | 195,200 | |
The accompanying notes are an integral part of these financial statements.
PLUMB FUNDS
Plumb Equity Fund
Schedule of Investments – March 31, 2009 (Continued)
| | | Shares | | | Value | |
| COMMON STOCKS (Continued) | | | | | | |
| | | | | | | |
| Food & Staples Retailing – 7.64% | | | | | | |
| CVS / Caremark Corp. | | | 11,000 | | | $ | 302,390 | |
| Walgreen Co. | | | 7,600 | | | | 197,296 | |
| Wal-Mart Stores, Inc. | | | 6,300 | | | | 328,230 | |
| | | | | | | | 827,916 | |
| Food Products – 8.56% | | | | | | | | |
| Cadbury PLC – ADR (b) | | | 7,000 | | | | 212,100 | |
| The Hain Celestial Group, Inc. (a) | | | 14,000 | | | | 199,360 | |
| Kraft Foods, Inc. – Class A | | | 9,500 | | | | 211,755 | |
| Nestle SA – ADR (b) | | | 9,000 | | | | 304,578 | |
| | | | | | | | 927,793 | |
| Health Care Equipment & Supplies – 1.35% | | | | | | | | |
| Zimmer Holdings, Inc. (a) | | | 4,000 | | | | 146,000 | |
| | | | | | | | | |
| Health Care Providers & Services – 1.93% | | | | | | | | |
| UnitedHealth Group, Inc. | | | 10,000 | | | | 209,300 | |
| | | | | | | | | |
| Industrial Conglomerates – 3.64% | | | | | | | | |
| 3M Co. | | | 4,000 | | | | 198,880 | |
| Tyco International Ltd. (b) | | | 10,000 | | | | 195,600 | |
| | | | | | | | 394,480 | |
| Internet Software & Services – 0.32% | | | | | | | | |
| Google, Inc. – Class A (a) | | | 100 | | | | 34,806 | |
| | | | | | | | | |
| IT Services – 7.76% | | | | | | | | |
| Automatic Data Processing, Inc. | | | 9,000 | | | | 316,440 | |
| Paychex, Inc. | | | 15,500 | | | | 397,885 | |
| The Western Union Co. | | | 10,000 | | | | 125,700 | |
| | | | | | | | 840,025 | |
| Management Consulting Services – 1.76% | | | | | | | | |
| ABB Ltd. – ADR (b) | | | 13,700 | | | | 190,978 | |
| | | | | | | | | |
| Media – 5.05% | | | | | | | | |
| The McGraw-Hill Companies, Inc. | | | 16,000 | | | | 365,920 | |
| The Walt Disney Co. | | | 10,000 | | | | 181,600 | |
| | | | | | | | 547,520 | |
The accompanying notes are an integral part of these financial statements.
PLUMB FUNDS
Plumb Equity Fund
Schedule of Investments – March 31, 2009 (Continued)
| | | Shares | | | Value | |
| COMMON STOCKS (Continued) | | | | | | |
| | | | | | | |
| Oil, Gas & Consumable Fuels – 5.25% | | | | | | |
| Chevron Corp. | | | 4,300 | | | $ | 289,132 | |
| Exxon Mobil Corp. | | | 4,100 | | | | 279,210 | |
| | | | | | | | 568,342 | |
| Pharmaceuticals – 6.17% | | | | | | | | |
| Genzyme Corp. (a) | | | 1,700 | | | | 100,963 | |
| Johnson & Johnson | | | 8,500 | | | | 447,100 | |
| Merck & Co., Inc. | | | 4,500 | | | | 120,375 | |
| | | | | | | | 668,438 | |
| Road & Rail – 1.83% | | | | | | | | |
| Burlington Northern Santa Fe Corp. | | | 3,300 | | | | 198,495 | |
| | | | | | | | | |
| Semiconductor & Semiconductor Equipment – 2.09% | | | | | | | | |
| Microchip Technology, Inc. | | | 10,700 | | | | 226,733 | |
| | | | | | | | | |
| Software – 2.21% | | | | | | | | |
| Microsoft Corp. | | | 13,000 | | | | 238,810 | |
| | | | | | | | | |
| Specialty Retail – 0.35% | | | | | | | | |
| Cost Plus, Inc. (a) | | | 40,266 | | | | 38,253 | |
| | | | | | | | | |
| Tobacco – 1.25% | | | | | | | | |
| Philip Morris International, Inc. | | | 3,800 | | | | 135,204 | |
| | | | | | | | | |
| TOTAL COMMON STOCKS | | | | | | | | |
(Cost $12,172,570) | | | | | | | 9783,930 | |
| | | | | | | | | |
| EXCHANGE-TRADED FUND – 0.89% | | | | | | | | |
| iShares Silver Trust (a) | | | 7,500 | | | | 96,000 | |
| | | | | | | | | |
| TOTAL EXCHANGE-TRADED FUND | | | | | | | | |
(Cost $93,835) | | | | | | | 96,000 | |
The accompanying notes are an integral part of these financial statements.
PLUMB FUNDS
Plumb Equity Fund
Schedule of Investments – March 31, 2009 (Continued)
| | | Shares | | | Value | |
| SHORT-TERM INVESTMENTS – 9.02% | | | | | | |
| | | | | | | |
| Money Market Funds – 9.02% | | | | | | |
| AIM Liquid Assets Portfolio – Institutional | | | | | | |
Class 0.75% (c) | | | 430,000 | | | $ | 430,000 | |
| AIM STIT-STIC Prime Portfolio 0.4% (c) | | | 430,000 | | | | 430,000 | |
| Fidelity Institutional Money Market Funds – | | | | | | | | |
Money Market Portfolio 0.93% (c) | | | 117,250 | | | | 117,250 | |
| | | | | | | | 977,250 | |
| | | | | | | | | |
| | | | | | | | | |
| TOTAL SHORT-TERM INVESTMENTS | | | | | | | | |
(Cost $977,250) | | | | | | | 977,250 | |
| Total Investments | | | | | | | | |
(Cost $13,243,655) – 100.22% | | | | | | | 10,857,180 | |
Liabilities in Excess of Other Assets – (0.22)% . | | | | | | | (24,013 | ) |
| TOTAL NET ASSETS – 100.00% | | | | | | $ | 10,833,167 | |
Percentages are stated as a percent of net assets.
ADR – American Depository Receipt
(a) Non-income producing security.
(b) Foreign issued security.
(c) Variable rate security. The rate listed is as of March 31, 2009.
The accompanying notes are an integral part of these financial statements.
PLUMB FUNDS
Statements of Assets and Liabilities
March 31, 2009
| | | Plumb | | | Plumb | |
| | | Balanced | | | Equity | |
| | | Fund | | | Fund | |
| Assets | | | | | | |
| Investments, at value* | | $ | 34,708,228 | | | $ | 10,857,180 | |
| Dividends and interest receivable | | | 239,853 | | | | 14,908 | |
| Receivable for investments sold | | | 664,771 | | | | 389,713 | |
| Receivable for fund shares sold | | | — | | | | 10,000 | |
| Receivable from Advisor (a) | | | 3,338 10,770 | | | | | |
| Prepaid expenses | | | 6,461 | | | | 3,874 | |
| Total Assets | | | 35622,651 | | | | 11,286,445 | |
| | | | | | | | | |
| Liabilities | | | | | | | | |
| Payable for investments purchased | | | 777,970 | | | | 407,624 | |
| Payable for fund shares redeemed | | | 11,000 | | | | — | |
| Accrued distribution fees | | | 4,882 | | | | 102 | |
| Administrative & accounting | | | | | | | | |
services fee payable (a) | | | 4,251 | | | | 1,304 | |
| Accrued expenses and other liabilities | | | 70,801 | | | | 44,248 | |
| Total Liabilities | | | 868,904 | | | | 453,278 | |
| Net Assets | | $ | 34,753,747 | | | $ | 10,833,167 | |
| | | | | | | | | |
| Net Assets Consist Of: | | | | | | | | |
| Paid in capital | | $ | 56,594,949 | | | $ | 19,959,980 | |
| Accumulated net investment income | | | 239,874 | | | | 31,639 | |
| Accumulated net realized loss | | | (15,131,799 | ) | | | (6,771,977 | ) |
| Net unrealized depreciation on investments | | | (6,949,277 | ) | | | (2,386,475 | ) |
| Net assets | | $ | 34,753,747 | | | $ | 10,833,167 | |
| | | | | | | | | |
| Capital shares outstanding, | | | | | | | | |
$0.001 par value (200 million shares issued each) | | | 2,733,132 | | | | 957,860 | |
| Net asset value, offering and | | | | | | | | |
redemption price per share | | $ | 12.72 | | | $ | 11.31 | |
| | | | | | | | | |
| * Cost of Investments | | $ | 41,657,496 | | | $ | 13,243,655 | |
(a) See Note 4 in the Notes to Financial Statements.
The accompanying notes are an integral part of these financial statements.
PLUMB FUNDS
Statements of Operations
For the Fiscal Year Ended March 31, 2009
| | | Plumb | | | Plumb | |
| | | Balanced | | | Equity | |
| | | Fund | | | Fund | |
| Investment Income: | | | | | | |
| Dividends (Net of foreign withholding | | | | | | |
taxes of $2,791 and $959, respectively) | | $ | 658,688 | | | $ | 260,541 | |
| Interest | | | 821,569 | | | | 10,337 | |
Total Investment Income | | | 1,480,257 | | | | 270,878 | |
| | | | | | | | | |
| Expenses: | | | | | | | | |
| Investment Advisor’s fee (a) | | | 292,438 | | | | 95,034 | |
| Distribution fees | | | 112,476 | | | | 36,552 | |
| Administrative & accounting services fee (a) | | | 67,486 | | | | 21,931 | |
| Administration fee | | | 48,223 | | | | 45,958 | |
| Professional fees | | | 43,522 | | | | 12,529 | |
| Transfer agent fees and expenses | | | 42,924 | | | | 28,915 | |
| Fund accounting fees | | | 34,835 | | | | 32,743 | |
| Director fees and expenses | | | 22,591 | | | | 7,466 | |
| Registration fees | | | 19,494 | | | | 18,696 | |
| Printing and mailing expense | | | 6,726 | | | | 1,062 | |
| Custody fees | | | 6,379 | | | | 4,811 | |
| Insurance expense | | | 4,671 | | | | 1,384 | |
| Other expenses | | | 6,305 | | | | 6,305 | |
Total expenses before waiver | | | 708,070 | | | | 313,386 | |
Less: Fees waived/reimbursed by Advisor (a) | | | (213,244 | ) | | | (137,938 | ) |
Net expenses | | | 494,826 | | | | 175,448 | |
| Net Investment Income | | | 985,431 | | | | 95,430 | |
| | | | | | | | | |
| Realized and Unrealized Loss: | | | | | | | | |
Net realized loss on investments | | | (11,365,878 | ) | | | (4,925,253 | ) |
Net change in unrealized | | | | | | | | |
depreciation on investments | | | (2,471,691 | ) | | | (374,436 | ) |
Net realized and unrealized | | | | | | | | |
loss on investments | | | (13,837,569 | ) | | | (5,299,689 | ) |
| | | | | | | | | |
| Net Decrease in Net Assets | | | | | | | | |
Resulting from Operations | | $ | (12,852,138 | ) | | $ | (5,204,259 | ) |
(a) See Note 4 in the Notes to the Financial Statements.
The accompanying notes are an integral part of these financial statements.
PLUMB FUNDS
Plumb Balanced Fund
Statements of Changes in Net Assets
| | | For the | | | For the Period | |
| | | Fiscal Year | | | May 24, 2007* | |
| | | Ended | | | through | |
| | | March 31, | | | March 31, | |
| | | 2009 | | | 2008 | |
| Operations: | | | | | | |
Net investment income | | $ | 985,431 | | | $ | 882,206 | |
Net realized loss on investments | | | (11,365,878 | ) | | | (3,765,904 | ) |
Net change in unrealized | | | | | | | | |
depreciation on investments | | | (2,471,691 | ) | | | (4,477,586 | ) |
Net decrease in net assets | | | | | | | | |
resulting from operations | | | (12,852,138 | ) | | | (7,361,284 | ) |
| | | | | | | | | |
| Dividends and Distributions To Shareholders: | | | | | | | | |
Net investment income | | | (1,020,553 | ) | | | (657,363 | ) |
Total dividends and distributions | | | (1,020,553 | ) | | | (657,363 | ) |
| | | | | | | | | |
| Capital Share Transactions: | | | | | | | | |
Proceeds from shares sold | | | 3,772,197 | | | | 70,466,806 | |
Shares issued in reinvestment of dividends | | | 420,635 | | | | 218,964 | |
Cost of shares redeemed | | | (11,267,334 | ) | | | (7,016,183 | ) |
Net increase (decrease) in net assets | | | | | | | | |
from capital share transactions | | | (7,074,502 | ) | | | 63,669,587 | |
Total increase (decrease) in net assets | | | (20,947,193 | ) | | | 55,650,940 | |
| | | | | | | | | |
| Net Assets: | | | | | | | | |
Beginning of period | | | 55,700,940 | | | | 50,000 | |
End of period** | | $ | 34,753,747 | | | $ | 55,700,940 | |
| | | | | | | | | |
| ** Including undistributed net | | | | | | | | |
investment income of | | $ | 239,874 | | | $ | 268,674 | |
| | | | | | | | | |
| Change In Shares Outstanding: | | | | | | | | |
Shares sold | | | 238,433 | | | | 3,541,392 | |
Shares issued in reinvestment of dividends | | | 31,915 | | | | 11,691 | |
Shares redeemed | | | (717,400 | ) | | | 375,399 | ) |
Net increase (decrease) | | | 447,052 | ) | | | 3,177,684 | |
* Commencement of operations.
The accompanying notes are an integral part of these financial statements.
PLUMB FUNDS
Plumb Equity Fund
Statements of Changes in Net Assets
| | | For the | | | For the Period | |
| | | Fiscal Year | | | May 24, 2007* | |
| | | Ended | | | through | |
| | | March 31, | | | March 31, | |
| | | 2009 | | | 2008 | |
| Operations: | | | | | | |
Net investment income | | $ | 95,430 | | | $ | 93,803 | |
Net realized loss on investments | | | (4,925,253 | ) | | | (1,846,724 | ) |
Net change in unrealized | | | | | | | | |
depreciation on investments | | | (374,436 | ) | | | (2,012,039 | ) |
Net decrease in net assets | | | | | | | | |
resulting from operations | | | (5,204,259 | ) | | | (3,764,960 | ) |
| | | | | | | | | |
| Dividends and Distributions To Shareholders: | | | | | | | | |
Net investment income | | | (101,823 | ) | | | (102,110 | ) |
Total dividends and distributions | | | (101,823 | ) | | | (102,110 | ) |
| | | | | | | | | |
| Capital Share Transactions: | | | | | | | | |
Proceeds from shares sold | | | 2,585,617 | | | | 26,171,160 | |
Shares issued in reinvestment of dividends | | | 57,800 | | | | 44,331 | |
Cost of shares redeemed | | | (4,132,841 | ) | | | (4,769,748 | ) |
Net increase (decrease) in net assets | | | | | | | | |
from capital share transactions | | | (1,489,424 | ) | | | 21,445,743 | |
Total increase (decrease) in net assets | | | (6,795,506 | ) | | | 17,578,673 | |
| | | | | | | | | |
| Net Assets: | | | | | | | | |
Beginning of period | | | 17,628,673 | | | | 50,000 | |
End of period** | | $ | 10,833,167 | | | $ | 17,628,673 | |
| | | | | | | | | |
| ** Including undistributed net | | | | | | | | |
investment income of | | $ | 31,639 | | | $ | 31,727 | |
| | | | | | | | | |
| Change In Shares Outstanding: | | | | | | | | |
Shares sold | | | 175,597 | | | | 1,326,871 | |
Shares issued in reinvestment of dividends | | | 4,857 | | | | 2,417 | |
Shares redeemed | | | (291,664 | ) | | | (262,718 | ) |
Net increase (decrease) | | | (111,210 | ) | | | 1,066,570 | |
* Commencement of operations.
The accompanying notes are an integral part of these financial statements.
PLUMB FUNDS
Plumb Balanced Fund
Financial Highlights
| | | For the | | | For the Period | |
| | | Fiscal Year | | | May 24, 2007* | |
| | | Ended | | | through | |
| | | March 31, | | | March 31, | |
| | | 2009 | | | 2008 | |
| Per share operating performance | | | | | | |
| (For a share outstanding throughout the period) | | | | | | |
| | | | | | | |
| Net asset value, beginning of period | | $ | 17.52 | | | $ | 20.00 | |
| | | | | | | | | |
| Operations: | | | | | | | | |
Net investment income(1) | | | 0.37 | | | | 0.28 | |
| Net realized and unrealized loss | | | (4.80 | ) | | | (2.55 | ) |
| Total from investment operations | | | (4.43 | ) | | | (2.27 | ) |
| | | | | | | | | |
| Dividends and distributions to shareholders: | | | | | | | | |
| Dividends from net investment income | | | (0.37 | ) | | | (0.21 | ) |
| Total dividends and distributions | | | (0.37 | ) | | | (0.21 | ) |
| Change in net asset value for the period | | | (4.80 | ) | | | (2.48 | ) |
| Net asset value, end of period | | $ | 12.72 | | | $ | 17.52 | |
| | | | | | | | | |
Total return(4) | | | (25.33 | )% | | | (11.44 | )%(2) |
| | | | | | | | | |
| Ratios/supplemental data | | | | | | | | |
| Net assets, end of period (000) | | $ | 34,754 | | | $ | 55,701 | |
| | | | | | | | | |
| Ratio of net expenses to average net assets: | | | | | | | | |
Before expense reimbursement and waivers | | | 1.57 | % | | | 1.56 | %(3) |
After expense reimbursement and waivers | | | 1.10 | % | | | 1.10 | %(3) |
| | | | | | | | | |
| Ratio of net investment income | | | | | | | | |
to average net assets: | | | | | | | | |
After expense reimbursement and waivers | | | 2.19 | % | | | 1.78 | %(3) |
| | | | | | | | | |
| Portfolio turnover rate | | | 63 | % | | | 51 | %(2) |
| * | Commencement of operations. |
| (1) | Net investment income per share is calculated using ending balances prior to consideration of adjustment for permanent book and tax differences. |
| (2) | Not annualized. |
| (3) | Annualized. |
| (4) | Total return represents the rate that the investor would have earned or lost on an investment in the Fund, assuming reinvestment of dividends. |
The accompanying notes are an integral part of these financial statements.
PLUMB FUNDS
Plumb Equity Fund
Financial Highlights
| | | | | | For the Period | |
| | | For the Year | | | May 24, 2007* | |
| | | Ended | | | through | |
| | | March 31, | | | March 31, | |
| | | 2009 | | | 2008 | |
| Per share operating performance | | | | | | |
| (For a share outstanding throughout the period) | | | | | | |
| | | | | | | |
| Net asset value, beginning of period | | $ | 16.49 | | | $ | 20.00 | |
| | | | | | | | | |
| Operations: | | | | | | | | |
Net investment income(1) | | | 0.10 | | | | 0.08 | |
| Net realized and unrealized loss | | | (5.17 | ) | | | (3.50 | ) |
| Total from investment operations | | | (5.07 | ) | | | (3.42 | ) |
| | | | | | | | | |
| Dividends and distributions to shareholders: | | | | | | | | |
| Dividends from net investment income | | | (0.11 | ) | | | (0.09 | ) |
| Total dividends and distributions | | | (0.11 | ) | | | (0.09 | ) |
| Change in net asset value for the period | | | (5.18 | ) | | | (3.51 | ) |
| Net asset value, end of period | | $ | 11.31 | | | $ | 16.49 | |
| | | | | | | | | |
Total return(4) | | | (30.81 | )% | | | (17.14 | )%(2) |
| | | | | | | | | |
| Ratios/supplemental data | | | | | | | | |
| Net assets, end of period (000) | | $ | 10,883 | | | $ | 17,629 | |
| | | | | | | | | |
| Ratio of net expenses to average net assets: | | | | | | | | |
Before expense reimbursement and waivers | | | 2.14 | % | | | 2.10 | %(3) |
After expense reimbursement and waivers | | | 1.20 | % | | | 1.20 | %(3) |
| | | | | | | | | |
| Ratio of net investment income | | | | | | | | |
to average net assets: | | | | | | | | |
After expense reimbursement and waivers | | | 0.65 | % | | | 0.56 | %(3) |
| | | | | | | | | |
| Portfolio turnover rate | | | 83 | % | | | 67 | %(2) |
| * | Commencement of operations. |
| (1) | Net investment income per share is calculated using ending balances prior to consideration of adjustment for permanent book and tax differences. |
| (2) | Not annualized. |
| (3) | Annualized. |
| (4) | Total return represents the rate that the investor would have earned or lost on an investment in the Fund, assuming reinvestment of dividends. |
The accompanying notes are an integral part of these financial statements.
PLUMB FUNDS
Notes to Financial Statements
March 31, 2009
1. ORGANIZATION
Wisconsin Capital Funds, Inc. (the “Company”) is registered under the Investment Company Act of 1940 (the “1940 Act”) as an open-end, diversified management investment company. The Company was organized as a Maryland corporation on April 3, 2007. The Company is authorized to issue up to 2 billion shares, which are units of beneficial interest with a $0.001 par value. The Company currently offers shares of two series, each with its own investment strategy and risk/reward profile: the Plumb Balanced Fund and the Plumb Equity Fund (individually a “Fund”, collectively the “Funds”). The investment objective of the Plumb Balanced Fund is high total return through capital appreciation while attempting to preserve principal, with current income as a secondary objective. The investment objective of the Plumb Equity Fund is long-term capital appreciation. Wisconsin Capital Management, LLC (the “Advisor”) serves as the Funds’ investment advisor.
2. SIGNIFICANT ACCOUNTING POLICIES
The following is a summary of significant accounting policies consistently followed by the Funds in the preparation of its financial statements. These policies are in conformity with accounting principles generally accepted in the United States of America (“GAAP”).
Security Valuation:
Portfolio securities which are traded on an exchange are valued at the last sale price reported by the exchange on which the securities are primarily traded on the day of valuation. If there are no sales on a given day for securities traded on an exchange, the latest bid quotation will be used. If there is no Nasdaq Official Closing Price for a Nasdaq-listed security or sale price available for an over-the-counter security, the mean of the latest bid and asked quotations from Nasdaq will be used. Debt securities for which market quotations are not readily available may be valued based on information supplied by independent pricing services, including services using matrix pricing formulas and/or independent broker bid quotations. Debt securities with remaining maturities of 60 days or less may be valued on an amortized cost basis, which involves valuing an instrument at its cost and thereafter assuming a constant amortization to maturity of any discount or premium, regardless of the impact of fluctuating rates on the market value of the instrument. Any securities or other assets for which market quotations are not readily available are valued at fair value as determined in good faith by the Advisor pursuant to procedures established under the general supervision and responsibility of the Funds’ Board of Directors.
PLUMB FUNDS
Notes to Financial Statements (Continued)
March 31, 2009
Use of Estimates:
The presentation of the financial statements in conformity with GAAP requires management to make estimates and assumptions that affect the reported amounts of assets and liabilities and disclosure of contingent assets and liabilities at the date of the financial statements and the reported amounts of increases and decreases in net assets from operations during the reporting period. Actual results could differ from those estimates.
Expenses:
Expenses directly attributable to a Fund are charged to the Fund, while expenses attributable to more than one series of the Company are allocated among the respective series based on relative net assets or another appropriate basis.
Federal Income Taxes:
The Funds intend to meet the requirements of the Internal Revenue Code (the “Code”) applicable to regulated investment companies and to distribute substantially all net investment taxable income and net capital gains to shareholders in a manner which results in no tax cost to the Funds. Therefore, no federal income or excise tax provision is recorded.
Distributions to Shareholders:
Dividends from net investment income are declared and paid at least annually. Distributions of net realized capital gains, if any, will be declared and paid at least annually. Distributions to shareholders are recorded on the ex-dividend date.
The Funds may periodically make reclassifications among certain of its capital accounts as a result of the recognition and characterization of certain income and capital gain distributions determined annually in accordance with federal tax regulations which may differ from GAAP. Any such reclassifications will have no effect on net assets, results of operations or net asset values per share of the Funds. For the fiscal period ended March 31, 2009, $17 for the Plumb Balanced Fund was reclassified from accumulated realized loss on investment to undistributed net investment income, and $6,305 was reclassified from paid in capital to undistributed net investment income for both the Plumb Balanced Fund and Plumb Equity Fund.
New Accounting Pronouncements:
The Funds adopted Financial Accounting Standards Board Statement of Financial Accounting Standards No. 157, Fair Value Measurements (“SFAS 157”), effective April 1, 2008. SFAS 157 establishes a hierarchy that prioritizes the inputs to valuation techniques giving the highest priority to readily available unadjusted quoted prices in active markets for identical assets (level 1 measurements) and the lowest priority to unobservable inputs (level 3 measurements) when market prices are not readily available or reliable.
PLUMB FUNDS
Notes to Financial Statements (Continued)
March 31, 2009
Various inputs are used in determining the value of the Funds’ investments. The inputs are summarized in three broad levels listed below.
| | Level 1 | – | quoted prices in active markets for identical securities |
| | Level 2 | – | other significant observable inputs (including quoted prices for similar securities, interest rates, prepayment speeds, credit risk, etc.) |
| | Level 3 | – | significant unobservable inputs (including the Funds’ ownassumptions in determining fair value of investments) |
The inputs or methodology used for valuing securities may not be an indication of the risk associated with investing in those securities.
The following is a summary of the inputs used, as of March 31, 2009, involving the Funds’ assets carried at fair value:
| Description | | Level 1 | | | Level 2 | | | Level 3 | | | Total | |
| Investments in Securities | | | | | | | | | | | | |
The Plumb Balanced Fund | | $ | 20,718,862 | | | $ | 13,989,366 | | | $ | — | | | $ | 34,708,228 | |
The Plumb Equity Fund | | | 10,857,180 | | | | — | | | | — | | | | 10,857,180 | |
The Funds did not hold any Level 3 assets during the fiscal year.
In March 2008, the Financial Accounting Standards Board issued Statement of Financial Accounting Standards No. 161, Disclosures about Derivative Instruments and Hedging Activities (“SFAS 161”). SFAS 161 is effective for fiscal years beginning after November 15, 2008. SFAS 161 is intended to improve financial reporting for derivative instruments by requiring enhanced disclosure that enables investors to understand how and why an entity uses derivatives, how derivatives are accounted for, and how derivative instruments affect an entity’s results of operations and financial position. Management is currently evaluating the implications of SFAS 161. The impact on the Funds’ financial statement disclosures, if any, is currently being assessed.
3. DISTRIBUTION PLAN
The Company has adopted a plan pursuant to Rule 12b-1 under the 1940 Act (the “12b-1 Plan”), on behalf of the Funds, which authorizes it to pay Quasar Distributors, LLC (the “Distributor”) a distribution fee of 0.25% of the Funds’ average daily net assets for services to prospective Fund shareholders and distribution of Fund shares. During the year ended March 31, 2009, the Plumb Balanced Fund and the Plumb Equity Fund incurred expenses of $112,476 and $36,552, respectively, pursuant to the 12b-1 Plan. As of March 31, 2009, $4,882 and $102 for the Plumb Balanced Fund and Plumb Equity Fund, respectively, were accrued.
PLUMB FUNDS
Notes to Financial Statements (Continued)
March 31, 2009
4. INVESTMENT ADVISOR AND OTHER AFFILIATES
The Funds have an Investment Advisory Agreement (the “Advisory Agreement”) with Wisconsin Capital Management, LLC. The Advisory Agreement provides for advisory fees computed daily and paid monthly at an annual rate of 0.65% of the Funds’ average daily net assets.
Under the terms of the Advisory Agreement, the Advisor has contractually agreed to limit the expenses until June 30, 2010, to the extent that the Funds total annual operating expenses exceed 1.10% and 1.20% for the Plumb Balanced Fund and the Plumb Equity Fund, respectively. Any such waiver or reimbursement is subject to later adjustment to allow the Advisor to recoup amounts waived or reimbursed to the extent actual fees and expenses for a period are less than the expense limitation caps, provided, however, that the Advisor shall only be entitled to recoup such amounts for a period of three years from the date such amount was waived or reimbursed. For the year ended March 31, 2009, the Advisor waived expenses for the Plumb Balanced Fund and the Plumb Equity Fund of $213,244 and $137,938, respectively.
The following table shows the remaining waived or reimbursed expenses subject to potential recovery expiring in:
| Plumb Balanced Fund | | Plumb Equity Fund |
| 2011 | $ 231,096 | | 2011 | $ 153,281 |
| 2012 | $ 213,244 | | 2012 | $ 137,938 |
The Funds also have an Administrative and Accounting Services Agreement with the Advisor which provides for the administrative and accounting fees computed daily and paid monthly at an annual rate of 0.15% of the Funds’ average daily net assets.
5. INVESTMENT TRANSACTIONS
For the year ended March 31, 2009, purchases and sales of investment securities, other than short-term investments and short-term U.S. Government obligations were as follows:
| | | Plumb Balanced Fund | | | Plumb Equity Fund | |
| Purchases: | | | $ 27,743,639 | | | | $ 11,674,951 | |
| Sales: | | | $ 34,188,966 | | | | $ 13,994,876 | |
PLUMB FUNDS
Notes to Financial Statements (Continued)
March 31, 2009
6. BENEFICIAL OWNERSHIP
The beneficial ownership, either directly or indirectly, of more than 25% of the voting securities of a fund creates a presumption of control of the fund, under Section 2(a)(9) of the Investment Company Act of 1940. As of March 31, 2009, Charles Schwab Inc., for the benefit of its customers, owned 34% of the Plumb Equity Fund. As of March 31, 2009, the Plumb Trust Company, for the benefit of its customers, owned 58% and 44% of the Plumb Balanced Fund and the Plumb Equity Fund, respectively. As a result, Charles Schwab Inc. may be deemed to control the Plumb Equity Fund and the Plumb Trust Company may be deemed to control both the Plumb Balanced Fund and the Plumb Equity Fund.
7. FEDERAL TAX INFORMATION
As of and during the year ended March 31, 2009, the Funds did not have a liability for any unrecognized tax benefits. The Funds recognize interest and penalties, if any, related to unrecognized tax benefits as income tax expense in the statement of operations. During the year, the Funds did not incur any interest or penalties. The Funds are not subject to examination by U.S. federal tax authorities for tax years prior to 2007.
As of March 31, 2009 the components of accumulated earnings (losses) for income tax purposes were as follows:
| | | Plumb Balanced Fund | | | Plumb Equity Fund | |
| Tax cost of Investments | | $ | 41,684,289 | | | $ | 13,545,866 | |
| | | | | | | | | |
| Unrealized Appreciation | | $ | 832,919 | | | $ | 367,844 | |
| Unrealized Depreciation | | | (7,808,980 | ) | | | (3,056,530 | ) |
| Net tax unrealized | | | | | | | | |
depreciation on investments | | $ | (6,976,061 | ) | | $ | (2,688,686 | ) |
| | | | | | | | | |
| Undistributed ordinary income | | $ | 239,874 | | | $ | 31,639 | |
| Distributable earnings | | $ | 239,874 | | | $ | 31,639 | |
| | | | | | | | | |
| Other accumulated losses | | | (15,105,015 | ) | | | (6,469,766 | ) |
| Total accumulated losses | | $ | (21,841,202 | ) | | $ | (9,126,813 | ) |
The tax basis of investments for tax and financial reporting purposes differs principally due to the deferral of losses on wash sales.
PLUMB FUNDS
Notes to Financial Statements (Continued)
March 31, 2009
As of March 31, 2009 the Funds had tax basis capital losses which may be carried over to offset future capital gains as shown below.
| | Capital Loss Carryover |
| | Plumb Balanced Fund | | Plumb Equity Fund |
| Expires: | | | |
March 31, 2016 | (506,660) | | (211,702) |
March 31, 2017 | (6,710,977) | | (3,162,317) |
As of March 31, 2009, the Funds deferred, on a tax basis, post-October losses of:
| Plumb Balanced Fund | (7,887,378) |
| Plumb Equity Fund | (3,095,747) |
8.DISTRIBUTIONS TO SHAREHOLDERS
The tax character of distributions paid during the fiscal periods ended March 31, 2009 and 2008 were as follows:
| | | Plumb Balanced Fund | |
| | | Year Ended | | | Period Ended | |
| | | March 31, 2009 | | | March 31, 2008 | |
| Distributions paid from: | | | | | | |
| Ordinary Income | | $ | 1,020,553 | | | $ | 657,363 | |
Total Distributions Paid | | $ | 1,020,553 | | | $ | 657,363 | |
| | | | | | | | | |
| | | Plumb Equity Fund | |
| | | Year Ended | | | Period Ended | |
| | | March 31, 2009 | | | March 31, 2008 | |
| Distributions paid from: | | | | | | | | |
| Ordinary Income | | $ | 101,823 | | | $ | 102,110 | |
Total Distributions Paid | | $ | 101,823 | | | $ | 102,110 | |
PLUMB FUNDS
Report of Independent Registered Public Accounting Firm
To The Shareholders and Board of Directors
Wisconsin Capital Funds, Inc.
We have audited the accompanying statements of assets and liabilities, including the schedules of investments, of Wisconsin Capital Funds, Inc., comprising the Plumb Balanced Fund and the Plumb Equity Fund (the “Funds”), as of March 31, 2009, and the related statements of operations for the year then ended, the statements of changes in net assets and financial highlights for each of the two periods in the period then ended. These financial statements and financial highlights are the responsibility of Funds’ management. Our responsibility is to express an opinion on these financial statements and financial highlights based on our audits.
We conducted our audits in accordance with the standards of the Public Company Accounting Oversight Board (United States). Those standards require that we plan and perform the audit to obtain reasonable assurance about whether the financial statements and financial highlights are free of material misstatement. An audit includes examining, on a test basis, evidence supporting the amounts and disclosures in the financial statements. Our procedures included confirmation of securities owned as of March 31, 2009 by correspondence with the custodian and brokers. An audit also includes assessing the accounting principles used and significant estimates made by management, as well as evaluating the overall financial statement presentation. We believe that our audits provide a reasonable basis for our opinion.
In our opinion, the financial statements and financial highlights referred to above present fairly, in all material respects, the financial position of the Plumb Balanced Fund and the Plumb Equity Fund as of March 31, 2009, the results of its operations for the year then ended, the changes in its net assets and financial highlights for each of the two periods in the period then ended, in conformity with accounting principles generally accepted in the United States of America.
COHEN FUND AUDIT SERVICES, LTD.
Westlake, Ohio
May 21, 2009
PLUMB FUNDS
Additional Information (Unaudited)
1. ADDITIONAL DISCLOSURE REGARDING FUND DIRECTORS AND OFFICERS
| | | | | Term of | | | | |
| | | Position(s) | | Office | | | | |
| | | Held with | | and | | Principal | | Other |
| | | Wisconsin | | Length | | Occupation(s) | | Directorships |
| Name, | | Capital | | of Time | | During Past | | Held by |
| Address and Age | | Funds, Inc. | | Served(1) | | Five Years | | Director |
| | | | | | | | | |
| Independent Directors: | | | | | | | | |
| | | | | | | | | |
| Patrick J. Quinn | | Director | | Since | | President and Chairman | | National |
| Birth date | | | | 2007 | | of the Board of Ayres | | Presto |
| September 13, 1949 | | | | | | Associates (professional | | Industries |
| | | | | | | civil engineering firm) | | since May |
| | | | | | | since April 2000. | | 2001. |
| | | | | | | | | |
| Jay Loewi | | Director | | Since | | CEO of the QTI Group since | | None. |
| Birth date: | | | | 2007 | | November 2007; prior | | |
| March 1, 1957 | | | | | | thereto, President of QTI | | |
| | | | | | | Group of Companies | | |
| | | | | | | since 1992. | | |
| | | | | | | | | |
| Jeffrey B. Sauer | | Director | | Since | | Assistant to the | | None. |
| Birth date: | | | | 2007 | | Commissioner of Western | | |
| March 10, 1943 | | | | | | Collegiate Hockey | | |
| | | | | | | Association since 2002. | | |
| Interested Directors and Officers: | | | | | | | | |
| | | | | | | | | |
Thomas G. Plumb(2) | | Director, | | Since | | President of Wisconsin | | None. |
| Birth date: | | President | | 2007 | | Capital Management, LLC | | |
| July 29, 1952 | | and Chief | | | | since January, 2004; CEO of | | |
| | | Executive | | | | Plumb Trust Company; | | |
| | | Officer | | | | President of Thompson | | |
| | | | | | | Plumb Funds until | | |
| | | | | | | March, 2005. | | |
| | | | | | | | | |
| Timothy R. O’Brien | | Chief | | Since | | Vice President and | | None. |
| Birth date: | | Financial | | 2007 | | Portfolio Manager for | | |
| June 8, 1959 | | Officer | | | | Wisconsin Capital | | |
| | | and | | | | Management, LLC since 2004; | | |
| | | Treasurer | | | | Principal of Wisconsin | | |
| | | | | | | Capital Management, LLC | | |
| | | Secretary | | Since | | until December 2008. | | |
| | | | | 2009 | | | | |
PLUMB FUNDS
Additional Information (Unaudited) (Continued)
| | | | | Term of | | | | |
| | | Position(s) | | Office | | | | |
| | | Held with | | and | | Principal | | Other |
| | | Wisconsin | | Length | | Occupation(s) | | Directorships |
| Name, | | Capital | | of Time | | During Past | | Held by |
| Address and Age | | Funds, Inc. | | Served(1) | | Five Years | | Director |
| | | | | | | | | |
| Connie M. Redman | | Chief | | Since | | Vice President, Chief | | None. |
| Birth date: | | Compliance | | 2007 | | Compliance Officer and | | |
| February 27, 1966 | | Officer | | | | Corporate Secretary of | | |
| | | | | | | Wisconsin Capital | | |
| | | | | | | Management, LLC since | | |
| | | | | | | March, 2008; Vice President, | | |
| | | | | | | Chief Compliance Officer, | | |
| | | | | | | Human Resources Manager | | |
| | | | | | | and Corporate Secretary of | | |
| | | | | | | Wisconsin Capital Management, | | |
| | | | | | | LLC since October, 2005; Vice | | |
| | | | | | | President, Human Resources | | |
| | | | | | | Manager and Corporate | | |
| | | | | | | Secretary of Wisconsin Capital | | |
| | | | | | | Management, LLC from | | |
| | | | | | | January, 2004 through | | |
| | | | | | | October, 2005; prior thereto | | |
| | | | | | | Human Resources Manager | | |
| | | | | | | and Corporate Secretary of | | |
| | | | | | | Wisconsin Capital | | |
| | | | | | | Management, LLC. | | |
| (1) | Officers of the Funds serve one-year terms, subject to annual reappointment by the Board of Directors. Directors of the Funds serve a term of indefinite length until their resignation or removal, and stand for re-election by shareholders as and when required under the 1940 Act. |
| (2) | Thomas G. Plumb is an “interested person” of the Funds by virtue of his positions with the Funds and the Advisor. |
PLUMB FUNDS
Additional Information (Unaudited) (Continued)
The Board of Directors of the Funds have an audit committee and a nominating committee. The audit committee consults with the independent auditors for the Funds on matters pertaining to their audits of the Funds’ annual financial statements, and approves all audit and non-audit services to be provided by the independent auditors. The audit committee has adopted a written charter, which is available upon request. The audit committee consists of Jay Loewi (Chair), Patrick J. Quinn and Jeffrey B. Sauer, none of whom is an “interested” person of the Funds. Jay Loewi has been determined by the Board to be an audit committee financial expert.
The nominating committee considers and recommends nominees for directors to the Board to fill vacancies and for election and re-election as and when required. All nominations of directors who are not “interested persons” of the Funds must be made and approved by the nominating committee. The nominating committee has not established any specific, minimum qualifications or standards for director nominees. The nominating committee will generally not consider any director candidates recommended by shareholders. The nominating committee has adopted a written charter, which is available upon request. No policy or procedure has been established as to the recommendation of director nominees by shareholders, except that nominations of directors who are not “interested persons” of the Funds must be made and approved by the nominating committee. The nominating committee consists of Jeffrey B. Sauer (Chair), Jay Loewi and Patrick J. Quinn.
The Funds’ Statement of Additional Information includes additional information about the directors of the Company and is available, without charge, at www.wiscap.com or upon request, by calling 1-866-987-7888.
2. QUALIFIED DIVIDEND INCOME/DIVIDENDS RECEIVED DEDUCTION
For the fiscal year ended March 31, 2009, certain dividends paid by the Funds may be subject to a maximum tax rate of 15%, as provided for by the Jobs and Growth Tax Relief Reconciliation Act of 2003. The percentage of dividends declared from ordinary income designated as qualified dividend income was as follows:
| Plumb Balanced Fund | 65.49% |
| Plumb Equity Fund | 100.00% |
For corporate shareholders, the percent of ordinary income distributions qualifying for the corporate dividends received deduction for the fiscal year ended March 31, 2009, was as follows:
| Plumb Balanced Fund | 63.70% |
| Plumb Equity Fund | 100.00% |
(This Page Intentionally Left Blank.)
WISCONSIN CAPITAL FUNDS, INC.
c/o U.S. Bancorp Fund Services, LLC
P.O. Box 701
Milwaukee, WI 53201-0701
1-866-987-7888
INVESTMENT ADVISOR
Wisconsin Capital Management, LLC
1200 John Q. Hammons Drive
Madison, WI 53717
Telephone: (608) 824-8800
DISTRIBUTOR
Quasar Distributors, LLC
615 East Michigan Street
Milwaukee, WI 53202
CUSTODIAN
U.S. Bank National Association
1555 N. Rivercenter Drive
MK-WI-5302
Milwaukee, WI 53212
TRANSFER AGENT AND
DIVIDEND DISBURSING AGENT
US Bancorp Fund Services, LLC
615 East Michigan Street
Milwaukee, WI 53202
INDEPENDENT ACCOUNTANTS
Cohen Fund Audit Services, Ltd.
800 Westpoint Parkway
Suite 1100
Westlake, OH 44145
LEGAL COUNSEL
Quarles & Brady LLP
411 East Wisconsin Avenue
Milwaukee, WI 53202
This report has been prepared for shareholders and may be distributed to others only if preceded or accompanied by a current prospectus.
The Funds’ Proxy Voting Policies and Procedures are available without charge upon request by calling 1-866-987-7888. Information regarding how the Funds voted proxies relating to portfolio securities during the 12-month period ended June 30, 2008 is available by calling 1-866-987-7888 and on the SEC’s website at www.sec.gov.
The Funds’ complete schedule of portfolio holdings for the first and third quarters is filed with the SEC on Form N-Q. The Funds’ Form N-Q is available without charge, upon request, by calling 1-866-987-7888 and on the SEC’s website at www.sec.gov.
Item 2. Code of Ethics.
The registrant has adopted a code of ethics that applies to the registrant’s principal executive officer and principal financial officer. The registrant has not made any amendments to its code of ethics during the period covered by this report. The registrant has not granted any waivers from any provisions of the code of ethics during the period covered by this report.
A copy of the registrant’s Code of Ethics is filed herewith.
Item 3. Audit Committee Financial Expert.
The registrant’s board of directors has determined that there is at least one audit committee financial expert serving on its audit committee. Jay V. Loewi, is the “audit committee financial expert” and is considered to be “independent” as each term is defined in Item 3 of Form N-CSR.
Item 4. Principal Accountant Fees and Services.
The registrant has engaged its principal accountant to perform audit services. “Audit services” refer to performing an audit of the registrant's annual financial statements or services that are normally provided by the accountant in connection with statutory and regulatory filings or engagements for those fiscal years. “Audit-related services” refer to the assurance and related services by the principal accountant that are reasonably related to the performance of the audit. “Tax services” refer to professional services rendered by the principal accountant for tax compliance, tax advice, and tax planning. There were no “other services” provided by the principal accountant during the last fiscal year ended March 31, 2009. The following table details the aggregate fees billed or expected to be billed for the last two fiscal years for audit fees, audit-related fees, tax fees and other fees by the principal accountant.
The audit committee has adopted pre-approval policies and procedures that require the audit committee to pre-approve all audit and non-audit services of the registrant, including services provided to any entity affiliated with the registrant. All of the principal accountant’s hours spent on auditing the registrant’s financial statements were attributed to work performed by full-time permanent employees of the principal accountant.
Item 5. Audit Committee of Listed Registrants.
Not applicable to registrants who are not listed issuers (as defined in Rule 10A-3 under the Securities Exchange Act of 1934).
Item 6. Schedule of Investments.
Schedule of Investments is included as part of the report to shareholders filed under Item 1 of this Form.
Item 7. Disclosure of Proxy Voting Policies and Procedures for Closed-End Management Investment Companies.
Not applicable to open-end investment companies.
Item 8. Portfolio Managers of Closed-End Management Investment Companies.
Not applicable to open-end investment companies.
Item 9. Purchases of Equity Securities by Closed-End Management Investment Company and Affiliated Purchasers.
Not applicable to open-end investment companies.
Item 10. Submission of Matters to a Vote of Security Holders.
There have been no material changes to the procedures by which shareholders may recommend nominees to the registrant’s board of directors/trustees
Item 11. Controls and Procedures.
Item 12. Exhibits.