
Plumb Balanced Fund
Investor Shares (PLBBX)
Institutional Shares (PLIBX)
Class A Shares (PLABX)
Plumb Equity Fund
Investor Shares (PLBEX)
Institutional Shares (PLIEX)
Class A Shares (PLAEX)
SEMI-ANNUAL REPORT
September 30, 2022
www.plumbfunds.com
PLUMB FUNDS
Thomas G. Plumb, CFA
Lead Fund Portfolio Manager
President, CEO, Chairman
October 2022
Dear Fellow Shareholders,
“History Does Not Repeat Itself, But It Rhymes” – quote attributed to Mark Twain

In 1976, President Gerald Ford’s administration initiated their plan to address the double-digit inflation which rose to 12% during the Arab oil embargo-induced recession. The administration named their program the Whip Inflation Now initiative and actually had “WIN” buttons distributed to show their commitment to defeating inflation. However, as headline inflation dropped to 4%, the markets, economy and electors grew much more concerned about the flagging economy and Jimmy Carter was elected president. By the late 1970s, inflation re-emerged and approached 15%. Conventional wisdom, and apparently the current Federal Reserve policy, holds that Paul Volker, the Chairman of the Federal Reserve at the time, broke the back of inflation by raising the prime interest rate to over 20% and causing two recessions in the next two years.
Federal Reserve Bank’s restrictive policy, which saw the three-month US Treasury Bill interest rate increase from 0.04% to 3.27% in the last year, amidst political tension around the world as well as domestically, helped cause the S&P 500, Dow Jones Industrial Average and NASDAQ to record their worst nine months since 2002. Technology stocks, the many of which had been leaders over the last decade, were especially hard hit as investors grew more concerned about the implications of potential “Stagflation” similar to the world’s experience of the 1970s.
After the dismal first nine months of 2002, the Stock market rose 20% over the next fifteen months. Recessions typically pressure corporate profit margins and the stock market tends to anticipate recoveries in both revenues and profit margins. But an old saying reminds us that history never repeats itself, though sometimes it rhymes.
Though the Federal Reserve Bank seems to be one foot on the gas, followed by the other on the brake while publicly saying they are avoiding those past mistakes, there are many differences to this cycle compared to the past fights against inflation.
| 1. | Corporate profit margins are 50% higher than past cycles as we have moved to a software as a service (SAAS) economy. Business models are in our view much more sustainable than they were in the past. |
FOR MORE INFORMATION OR TO INVEST visit plumbfunds.com 866.787.7888
PLUMB FUNDS
| 2. | Consumer debt payments as a percent of disposable income are almost 25% less than in 2002, liabilities are only 12% of assets. Though recent wage growth has not appeared to have kept up with inflation recently, wage gains and balance sheets for lower-income workers are actually better than pre-pandemic measures. Federal Reserve figures show the cash balances held by the lower half of our population (by net worth) are up 49% from the fourth quarter of 2019. |
| 3. | The stock market retreat coupled with the rise in interest rates have provided investors with cash yields from stock and bond investments that we haven’t seen in over a decade. Blue chip stocks like JP Morgan, Merck, and Exxon have dividend yields over 3%, while cash rich companies like Microsoft and Apple are raising their dividend and/or buying back own stock at an accelerating rate. |
| 4. | Finally, there are significant indications that core inflation, from commodities like oil, steel, and copper, to home prices and apartment rents are showing signs that they have peaked as they are significantly off their highs. Federal Reserve policies tend to lead their economic consequences by months and our data dependent Fed may pause sooner than the market’s worst case. |
As we recently discussed in our interview with TD Ameritrade on September 16, 2022, we believe it is time to catch fallen stars. Some of the best companies in the world are on sale and have significant recovery potential over the next few years. Bonds are starting to reward fixed income investors with reasonable yields for the first time in years. Guessing a bottom is exceedingly difficult, but we have gone through many of these cycles and know that recoveries tend to begin when sentiment is the weakest. Recently, we have seen many of those sentiment indicators touching the low levels where past recoveries have started.
Thank you for the confidence that you have placed in us. Best wishes for the remaining year.

SPXT-S&P 500 Total Return Index. S&P 500 is an unmanaged index which is widely regarded as the standard for measuring large-cap U.S. stock market performance. Calculated intraday by S&P based on the price changes and reinvested dividends of SPX with a starting date of Jan 4, 1988.
It is not possible to invest directly in an index.
The Fund’s investment objectives, risks, charges, and expenses must be considered carefully before investing. The prospectus contains this and other important information about the investment company, and it may be obtained on www.plumbfunds.com or by calling 1- 866-987-7888. Read it carefully before investing.
FOR MORE INFORMATION OR TO INVEST visit plumbfunds.com 866.787.7888
PLUMB FUNDS
Past performance does not guarantee future results.
Opinions expressed are those of the author as of October 5, 2022 and are subject to change, are not intended to be a forecast of future events, a guarantee of future results, nor investment advice.
Earnings growth is the annual rate of growth of earnings from investments.
Mutual fund investing involves risk. Principal loss is possible.
The fund may invest in small and mid-sized companies which involve additional risks such as limited liquidity and greater volatility. The funds invest in foreign securities which involve greater volatility and political, economic and currency risks and differences in accounting methods. Because the funds may invest in ETFs, they are subject to additional risks that do not apply to conventional mutual funds, including the risks that the market price of an ETF’s shares may trade at a discount to its net asset value (“NAV”), an active secondary trading market may not develop or be maintained, or trading may be halted by the exchange in which they trade, which may impact a fund’s ability to sell its shares. The fund may also use options and future contracts, which have the risks of unlimited losses of the underlying holdings due to unanticipated market movements and failure to correctly predict the direction of securities prices, interest rates and currency exchange rates. The investment in options is not suitable for all investors. The Plumb Balanced Fund will invest in debt securities, which typically decrease in value when interest rates rise. This risk is usually greater for longer-term debt securities.
Fund holdings are subject to change at any time and should not be considered a recommendation to buy or sell any security.
Diversification does not assure a profit nor protect against loss in a declining market. Plumb Funds are distributed by Quasar Distributors, LLC, distributor.
The Dow Jones Industrial Average (DJIA) is an index that tracks 30 large, publicly owned blue-chip companies trading on the New York Stock Exchange (NYSE) and the NASDAQ
Nasdaq is a global electronic marketplace for buying and selling securities. Nasdaq was created by the National Association of Securities Dealers (NASD) to enable investors to trade securities on a computerized, speedy, and transparent system, and commenced operations on February 8, 1971.
FOR MORE INFORMATION OR TO INVEST visit plumbfunds.com 866.787.7888
PLUMB FUNDS
Expense Example
September 30, 2022 (Unaudited)
As a shareholder of the Plumb Funds (the “Funds”), you incur two types of costs: (1) transaction costs, including sales charges (loads) on purchase payments and redemption fees (for Class A Shares); and (2) ongoing costs, including investment advisory fees; distribution (12b-1) fees; and other fund expenses. This example is intended to help you understand your ongoing costs (in dollars) of investing in the Funds and to compare these costs with the ongoing costs of investing in other mutual funds.
The Example is based on an investment of $1,000 invested at the beginning of the period and held for the entire period (April 1, 2022 – September 30, 2022).
Actual Expenses
The first line of the table on the following page provides information about actual account values and actual expenses. However, the table does not include shareholder-specific fees such as the $15.00 fee charged for wire redemptions. The table also does not include portfolio trading commissions and related trading costs. You may use the information in this line, together with the amount you invested, to estimate the expenses that you paid over the period. Simply divide your account value by $1,000 (for example, an $8,600 account value divided by $1,000 = 8.6), then multiply the result by the number in the first line under the heading entitled “Expenses Paid During the Period” to estimate the expenses you paid on your account during this period.
Hypothetical Example for Comparison Purposes
The second line of the table on the following page provides information about hypothetical account values and hypothetical expenses based on the Fund’s actual expense ratio and an assumed rate of return of 5% per year before expenses, which is not the Fund’s actual return. The hypothetical account values and expenses may not be used to estimate the actual ending account balanced or expenses you paid for the period. You may use this information to compare the ongoing costs of investing in the Funds and other funds. To do so, compare this 5% hypothetical example with the 5% hypothetical examples that appear in the shareholder reports of the other funds.
Please note that the expenses shown in the table are meant to highlight your ongoing costs only and do not reflect any transactional costs, such as sales charges (loads), redemption fees, or exchange fees. Therefore, the second line of the table is useful in comparing ongoing costs only, and will not help you determine the relative costs of owning different funds. In addition, if these transactional costs were included, your costs would have been higher.
PLUMB FUNDS
Expense Example
September 30, 2022 (Unaudited) (Continued)
Plumb Balanced Fund
| | | | | Ending | | |
| | | Beginning | | Account Value | | Expenses Paid |
| | | Account Value | | September 30, 2022 | | During the Period |
| Actual - Investor Shares(1) | | $1,000.00 | | $ | 796.30 | | | $5.36 |
| Actual - Institutional Shares(2) | | $1,000.00 | | $ | 797.00 | | | $4.46 |
| Actual - Class A Shares(1) | | $1,000.00 | | $ | 796.30 | | | $5.36 |
| Hypothetical - Investor Shares(3) | | $1,000.00 | | $ | 1,019.10 | | | $6.02 |
| Hypothetical - Institutional Shares(4) | | $1,000.00 | | $ | 1,020.10 | | | $5.01 |
| Hypothetical - Class A Shares(3) | | $1,000.00 | | $ | 1,019.10 | | | $6.02 |
| (1) | Expenses are equal to the Fund’s annualized six-month expense ratio of 1.19%, multiplied by the average account value over the period, multiplied by 183/365 (to reflect the partial year period). |
| (2) | Expenses are equal to the Fund’s annualized six-month expense ratio of 0.99%, multiplied by the average account value over the period, multiplied by 183/365 (to reflect the partial year period). |
| (3) | Assumes 5% return per year before expenses. Expenses are equal to the Fund’s annualized six-month expense ratio of 1.19%, multiplied by the average account value over the period, multiplied by 183/365 (to reflect the partial year period). |
| (4) | Assumes 5% return per year before expenses. Expenses are equal to the Fund’s annualized six-month expense ratio of 0.99%, multiplied by the average account value over the period, multiplied by 183/365 (to reflect the partial year period). |
PLUMB FUNDS
Expense Example
September 30, 2022 (Unaudited) (Continued)
Plumb Equity Fund
| | | | | Ending | | |
| | | Beginning | | Account Value | | Expenses Paid |
| | | Account Value | | September 30, 2022 | | During the Period |
| Actual - Investor Shares(1) | | $1,000.00 | | $ | 718.30 | | | $5.13 |
| Actual - Institutional Shares(2) | | $1,000.00 | | $ | 718.80 | | | $4.27 |
| Actual - Class A Shares(1) | | $1,000.00 | | $ | 718.30 | | | $5.13 |
| Hypothetical - Investor Shares(3) | | $1,000.00 | | $ | 1,019.10 | | | $6.02 |
| Hypothetical - Institutional Shares(4) | | $1,000.00 | | $ | 1,020.10 | | | $5.01 |
| Hypothetical - Class A Shares(3) | | $1,000.00 | | $ | 1,019.10 | | | $6.02 |
| (1) | Expenses are equal to the Fund’s annualized six-month expense ratio of 1.19%, multiplied by the average account value over the period, multiplied by 183/365 (to reflect the partial year period). |
| (2) | Expenses are equal to the Fund’s annualized six-month expense ratio of 0.99%, multiplied by the average account value over the period, multiplied by 183/365 (to reflect the partial year period). |
| (3) | Assumes 5% return per year before expenses. Expenses are equal to the Fund’s annualized six-month expense ratio of 1.19%, multiplied by the average account value over the period, multiplied by 183/365 (to reflect the partial year period). |
| (4) | Assumes 5% return per year before expenses. Expenses are equal to the Fund’s annualized six-month expense ratio of 0.99%, multiplied by the average account value over the period, multiplied by 183/365 (to reflect the partial year period). |
PLUMB FUNDS
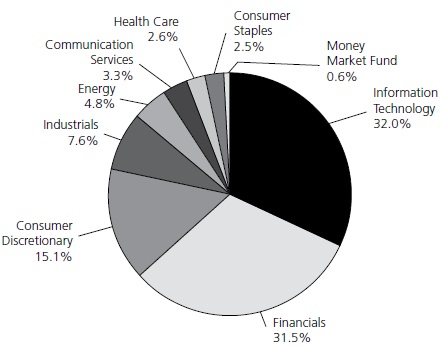
Plumb Balanced Fund
Investments by Industry Sector as of September 30, 2022
(as a Percentage of Total Investments) (Unaudited)
PLUMB FUNDS
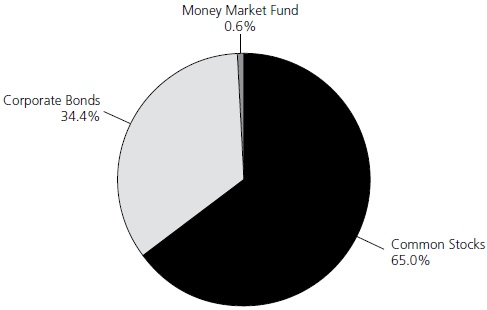
Plumb Balanced Fund
Investments by Asset Allocation as of September 30, 2022
(as a Percentage of Total Investments) (Unaudited)
PLUMB FUNDS
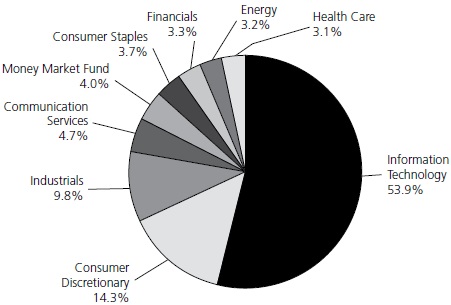
Plumb Equity Fund
Investments by Industry Sector as of September 30, 2022
(as a Percentage of Total Investments) (Unaudited)
The Global Industry Classification Standard (GICS®) was developed by and/or is the exclusive property of MSCI, Inc. (“MSCI”) and Standard & Poor’s Financial Services LLC (“S&P”). GICS is a service mark of MSCI and S&P and has been licensed for use by U.S. Bank Global Fund Services.
PLUMB FUNDS
Plumb Balanced Fund
Schedule of Investments – September 30, 2022 (Unaudited)
| | | Shares | | | Value | |
| COMMON STOCKS — 65.08% | | | | | | | | |
| Automobiles & Components — 0.57% | | | | | | | | |
| Ford Motor Co. | | | 30,000 | | | $ | 336,000 | |
| | | | | | | | | |
| Banks — 2.38% | | | | | | | | |
| JPMorgan Chase & Co. | | | 13,500 | | | | 1,410,750 | |
| | | | | | | | | |
| Capital Goods — 2.77% | | | | | | | | |
| Raytheon Technologies Corp. | | | 20,000 | | | | 1,637,200 | |
| | | | | | | | | |
| Consumer Discretionary — 2.40% | | | | | | | | |
| Nutrien Ltd. (a)(b) | | | 17,000 | | | | 1,417,460 | |
| | | | | | | | | |
| Consumer Services — 2.57% | | | | | | | | |
| Booking Holdings, Inc. (a) | | | 550 | | | | 903,766 | |
| Yum China Holdings, Inc. | | | 13,000 | | | | 615,290 | |
| | | | | | | | 1,519,056 | |
| Commercial & Professional Services — 4.04% | | | | | | | | |
| Copart, Inc. (a) | | | 12,500 | | | | 1,330,000 | |
| VSE Corp. | | | 30,000 | | | | 1,062,000 | |
| | | | | | | | 2,392,000 | |
| Diversified Financials — 4.81% | | | | | | | | |
| American Express Co. | | | 11,000 | | | | 1,484,010 | |
| Discover Financial Services | | | 15,000 | | | | 1,363,800 | |
| | | | | | | | 2,847,810 | |
| Energy — 4.39% | | | | | | | | |
| Exxon Mobil Corp. | | | 12,500 | | | | 1,091,375 | |
| Schlumberger NV - ADR (b) | | | 42,000 | | | | 1,507,800 | |
| | | | | | | | 2,599,175 | |
| Food, Beverage & Tobacco — 2.50% | | | | | | | | |
| Constellation Brands, Inc. - Class A | | | 6,447 | | | | 1,480,747 | |
| | | | | | | | | |
| Media & Entertainment — 3.31% | | | | | | | | |
| Alphabet, Inc. - Class A (a) | | | 20,500 | | | | 1,960,825 | |
| | | | | | | | | |
| Pharmaceuticals, Biotechnology & Life Sciences — 2.33% | | | | | | | | |
| Merck & Co., Inc. | | | 16,000 | | | | 1,377,920 | |
| | | | | | | | | |
| Retailing — 5.23% | | | | | | | | |
| Amazon.com, Inc. (a) | | | 12,000 | | | | 1,356,000 | |
The accompanying notes are an integral part of these financial statements.
PLUMB FUNDS
Plumb Balanced Fund
Schedule of Investments – September 30, 2022 (Unaudited) (Continued)
| | | Shares | | | Value | |
| COMMON STOCKS (Continued) | | | | | | | | |
| Retailing (Continued) | | | | | | | | |
| MercadoLibre, Inc. (a) | | | 2,100 | | | $ | 1,738,338 | |
| | | | | | | | 3,094,338 | |
| Semiconductors & Semiconductor Equipment — 5.83% | | | | | | | | |
| Advanced Micro Devices, Inc. (a) | | | 17,000 | | | | 1,077,120 | |
| Microchip Technology, Inc. | | | 17,500 | | | | 1,068,025 | |
| NVIDIA Corp. | | | 10,750 | | | | 1,304,942 | |
| | | | | | | | 3,450,087 | |
| Software & Services — 18.51% | | | | | | | | |
| Adobe, Inc. (a) | | | 2,900 | | | | 798,080 | |
| Mastercard, Inc. - Class A | | | 7,000 | | | | 1,990,380 | |
| Microsoft Corp. | | | 10,750 | | | | 2,503,675 | |
| Mitek Systems, Inc. (a) | | | 136,000 | | | | 1,245,760 | |
| Olo, Inc. (a) | | | 140,000 | | | | 1,106,000 | |
| Visa, Inc. - Class A | | | 9,000 | | | | 1,598,850 | |
| WEX, Inc. (a) | | | 13,500 | | | | 1,713,690 | |
| | | | | | | | 10,956,435 | |
| Technology Hardware & Equipment — 3.44% | | | | | | | | |
| Apple, Inc. | | | 14,750 | | | | 2,038,450 | |
| TOTAL COMMON STOCKS | | | | | | | | |
| (Cost $32,421,927) | | | | | | | 38,518,253 | |
| | | Principal | | | | |
| | | Amount | | | | |
| CORPORATE BONDS — 34.41% | | | | | | | | |
| Banks — 19.35% | | | | | | | | |
| Amalgamated Financial Corp. | | | | | | | | |
| 3.25%, (3 Month LIBOR USD + 2.30%) 11/15/2031 (c) | | $ | 1,500,000 | | | | 1,338,546 | |
| Banc of California, Inc. | | | | | | | | |
| 4.38%, (SOFR + 4.20%) 10/30/2030 (c) | | | 1,700,000 | | | | 1,564,928 | |
| Bank OZK | | | | | | | | |
| 2.75%, (SOFR + 2.09%) 10/01/2031 (c) | | | 1,000,000 | | | | 859,586 | |
| Citigroup, Inc. | | | | | | | | |
| 4.13%, (3 Month LIBOR USD + 1.35%) 04/25/2024 (c) | | | 500,000 | | | | 499,229 | |
| 4.70%, (SOFR + 3.23%) Perpetual Maturity (c) | | | 600,000 | | | | 483,720 | |
| Flagstar Bancorp, Inc. | | | | | | | | |
| 4.13%, (SOFR + 3.91%) 11/01/2030 (c) | | | 500,000 | | | | 461,951 | |
The accompanying notes are an integral part of these financial statements.
PLUMB FUNDS
Plumb Balanced Fund
Schedule of Investments – September 30, 2022 (Unaudited) (Continued)
| | | Principal | | | | |
| | | Amount | | | Value | |
| CORPORATE BONDS (Continued) | | | | | | | | |
| Banks (Continued) | | | | | | | | |
| JPMorgan Chase & Co. | | | | | | | | |
| 6.75%, (3 Month LIBOR USD + 3.78%) Perpetual Maturity (c) | | $ | 2,325,000 | | | $ | 2,304,706 | |
| Pinnacle Financial Partners, Inc. | | | | | | | | |
| 4.13%, (3 Month LIBOR USD + 2.78%) 09/15/2029 (c) | | | 1,575,000 | | | | 1,516,471 | |
| TriState Capital Holdings, Inc. | | | | | | | | |
| 5.75%, (3 Month LIBOR USD + 5.36%) 05/15/2030 (c) | | | 500,000 | | | | 488,876 | |
| Wells Fargo & Co. | | | | | | | | |
| 4.05%, 08/15/2026 | | | 500,000 | | | | 482,779 | |
| Western Alliance Bank | | | | | | | | |
| 5.25%, (SOFR + 5.12%) 06/01/2030 (c) | | | 1,500,000 | | | | 1,452,812 | |
| | | | | | | | 11,453,604 | |
| Capital Goods — 0.81% | | | | | | | | |
| Carlisle Cos, Inc. | | | | | | | | |
| 3.50%, 12/01/2024 | | | 500,000 | | | | 481,974 | |
| | | | | | | | | |
| Consumer Services — 4.33% | | | | | | | | |
| Expedia Group, Inc. | | | | | | | | |
| 5.00%, 02/15/2026 | | | 2,600,000 | | | | 2,560,449 | |
| | | | | | | | | |
| Diversified Financials — 4.18% | | | | | | | | |
| Credit Suisse Group AG | | | | | | | | |
| 4.48%, (3 Month LIBOR USD + 1.24%) 06/12/2024 (b)(c) | | | 500,000 | | | | 494,513 | |
| The Charles Schwab Corp. | | | | | | | | |
| 5.38%, (H15T5Y + 4.97%) 05/01/2025 (c) | | | 1,000,000 | | | | 977,500 | |
| The Goldman Sachs Group, Inc. | | | | | | | | |
| 3.99%, (3 Month LIBOR USD + 1.70%) 04/05/2026 (c) | | | 1,000,000 | | | | 1,001,912 | |
| | | | | | | | 2,473,925 | |
| Health Care Equipment & Services — 0.29% | | | | | | | | |
| CVS Pass-Through Trust | | | | | | | | |
| 6.94%, 01/10/2030 | | | 167,923 | | | | 173,030 | |
| | | | | | | | | |
| Insurance — 0.84% | | | | | | | | |
| Old Republic International Corp. | | | | | | | | |
| 4.88%, 10/01/2024 | | | 500,000 | | | | 499,698 | |
The accompanying notes are an integral part of these financial statements.
PLUMB FUNDS
Plumb Balanced Fund
Schedule of Investments – September 30, 2022 (Unaudited) (Continued)
| | | Principal | | | | |
| | | Amount | | | Value | |
| CORPORATE BONDS (Continued) | | | | | | | | |
| Oil & Gas — 0.41% | | | | | | | | |
| Murphy Oil USA, Inc. | | | | | | | | |
| 5.63%, 05/01/2027 | | $ | 250,000 | | | $ | 239,457 | |
| | | | | | | | | |
| Semiconductors & Semiconductor Equipment — 3.63% | | | | | | | | |
| Qorvo, Inc. | | | | | | | | |
| 4.38%, 10/15/2029 | | | 2,500,000 | | | | 2,145,038 | |
| | | | | | | | | |
| Software & Services — 0.57% | | | | | | | | |
| VeriSign, Inc. | | | | | | | | |
| 4.75%, 07/15/2027 | | | 350,000 | | | | 337,405 | |
| TOTAL CORPORATE BONDS | | | | | | | | |
| (Cost $22,640,317) | | | | | | | 20,364,580 | |
| | | Shares | | | | |
| SHORT TERM INVESTMENT — 0.63% | | | | | | | | |
| Money Market Fund — 0.63% | | | | | | | | |
| First American Government Obligations Fund - Class X — 2.77% (d) | | | 373,648 | | | | 373,648 | |
| TOTAL SHORT TERM INVESTMENT | | | | | | | | |
| (Cost $373,648) | | | | | | | 373,648 | |
| | | | | | | | | |
| Total Investments (Cost $55,435,892) — 100.12% | | | | | | | 59,256,481 | |
| Liabilities in Excess of Other Assets — (0.12)% | | | | | | | (71,187 | ) |
| TOTAL NET ASSETS — 100.00% | | | | | | $ | 59,185,294 | |
Percentages are stated as a percent of net assets.
ADR – American Depositary Receipt
H15T5Y – 5 Year Treasury Constant Maturity Rate
LIBOR – London Inter-bank Offered Rate
SOFR – Secured Overnight Financing Rate
| (a) | Non-income producing security. |
| (b) | Foreign issued security. |
| (c) | Variable or Floating rate security based on a reference index and spread. The rate listed is as of September 30, 2022. |
| (d) | Rate shown is the 7-day effective yield. |
The Global Industry Classification Standard (GICS®) was developed by and/or is the exclusive property of MSCI, Inc. and Standard & Poor’s Financial Services LLC (“S&P”). GICS is a service mark of MSCI and S&P and has been licensed for use by U.S. Bancorp Global Fund Services, LLC.
The accompanying notes are an integral part of these financial statements.
PLUMB FUNDS
Plumb Equity Fund
Schedule of Investments – September 30, 2022 (Unaudited)
| | | Shares | | | Value | |
| COMMON STOCKS — 96.21% | | | | | | | | |
| Capital Goods — 3.28% | | | | | | | | |
| Raytheon Technologies Corp. | | | 7,250 | | | $ | 593,485 | |
| | | | | | | | | |
| Commercial & Professional Services — 6.56% | | | | | | | | |
| Copart, Inc. (a) | | | 8,000 | | | | 851,200 | |
| VSE Corp. | | | 9,500 | | | | 336,300 | |
| | | | | | | | 1,187,500 | |
| Consumer Discretionary — 2.65% | | | | | | | | |
| Nutrien Ltd. (a)(b) | | | 5,750 | | | | 479,435 | |
| | | | | | | | | |
| Consumer Services — 3.45% | | | | | | | | |
| Booking Holdings, Inc. (a) | | | 150 | | | | 246,481 | |
| Yum China Holdings, Inc. | | | 8,000 | | | | 378,640 | |
| | | | | | | | 625,121 | |
| Diversified Financials — 3.28% | | | | | | | | |
| American Express Co. | | | 4,400 | | | | 593,604 | |
| | | | | | | | | |
| Energy — 3.17% | | | | | | | | |
| Schlumberger NV - ADR (b) | | | 16,000 | | | | 574,400 | |
| | | | | | | | | |
| Food, Beverage & Tobacco — 3.68% | | | | | | | | |
| Constellation Brands, Inc. - Class A | | | 2,900 | | | | 666,072 | |
| | | | | | | | | |
| Health Care Equipment & Services — 3.10% | | | | | | | | |
| Intuitive Surgical, Inc. (a) | | | 3,000 | | | | 562,320 | |
| | | | | | | | | |
| Media & Entertainment — 4.75% | | | | | | | | |
| Alphabet, Inc. - Class A (a) | | | 9,000 | | | | 860,850 | |
| | | | | | | | | |
| Retailing — 8.27% | | | | | | | | |
| Amazon.com, Inc. (a) | | | 6,300 | | | | 711,900 | |
| MercadoLibre, Inc. (a) | | | 950 | | | | 786,391 | |
| | | | | | | | 1,498,291 | |
| Semiconductors & Semiconductor Equipment — 6.87% | | | | | | | | |
| Advanced Micro Devices, Inc. (a) | | | 9,500 | | | | 601,920 | |
| NVIDIA Corp. | | | 5,300 | | | | 643,367 | |
| | | | | | | | 1,245,287 | |
The accompanying notes are an integral part of these financial statements.
PLUMB FUNDS
Plumb Equity Fund
Schedule of Investments – September 30, 2022 (Unaudited) (Continued)
| | | Shares | | | Value | |
| COMMON STOCKS (Continued) | | | | | | | | |
| Software & Services — 42.38% | | | | | | | | |
| Adobe, Inc. (a) | | | 1,700 | | | $ | 467,840 | |
| Autodesk, Inc. (a) | | | 4,300 | | | | 803,240 | |
| Domo, Inc. (a) | | | 13,513 | | | | 243,099 | |
| Fiserv, Inc. (a) | | | 7,000 | | | | 654,990 | |
| Mastercard, Inc. - Class A | | | 3,000 | | | | 853,020 | |
| Microsoft Corp. | | | 4,000 | | | | 931,600 | |
| Mitek Systems, Inc. (a) | | | 64,000 | | | | 586,240 | |
| Olo, Inc. (a) | | | 50,000 | | | | 395,000 | |
| Snowflake, Inc. (a) | | | 3,300 | | | | 560,868 | |
| Toast, Inc. (a) | | | 34,367 | | | | 574,616 | |
| Visa, Inc. - Class A | | | 4,900 | | | | 870,485 | |
| WEX, Inc. (a) | | | 5,800 | | | | 736,252 | |
| | | | | | | | 7,677,250 | |
| Technology Hardware & Equipment — 4.77% | | | | | | | | |
| Apple, Inc. | | | 6,250 | | | | 863,750 | |
| TOTAL COMMON STOCKS | | | | | | | | |
| (Cost $14,708,271) | | | | | | | 17,427,365 | |
| | | | | | | | | |
| SHORT TERM INVESTMENT — 4.03% | | | | | | | | |
| Money Market Fund — 4.03% | | | | | | | | |
| First American Government Obligations Fund - Class X — 2.77% (c) | | | 730,443 | | | | 730,443 | |
| TOTAL SHORT TERM INVESTMENT | | | | | | | | |
| (Cost $730,443) | | | | | | | 730,443 | |
| | | | | | | | | |
| Total Investments (Cost $15,438,714) — 100.24% | | | | | | | 18,157,808 | |
| Liabilities in Excess of Other Assets — (0.24)% | | | | | | | (43,733 | ) |
| TOTAL NET ASSETS — 100.00% | | | | | | $ | 18,114,075 | |
Percentages are stated as a percent of net assets.
ADR – American Depositary Receipt
| (a) | Non-income producing security. |
| (b) | Foreign issued security. |
| (c) | Rate shown is the 7-day effective yield. |
The Global Industry Classification Standard (GICS®) was developed by and/or is the exclusive property of MSCI, Inc. and Standard & Poor’s Financial Services LLC (“S&P”). GICS is a service mark of MSCI and S&P and has been licensed for use by U.S. Bancorp Global Fund Services, LLC.
The accompanying notes are an integral part of these financial statements.
PLUMB FUNDS
Statements of Assets and Liabilities
September 30, 2022 (Unaudited)
| | | Plumb | | | Plumb | |
| | | Balanced | | | Equity | |
| | | Fund | | | Fund | |
| Assets | | | | | | |
| Investments, at value* | | $ | 59,256,481 | | | $ | 18,157,808 | |
| Dividends and interest receivable | | | 287,948 | | | | 5,969 | |
| Receivable from Adviser | | | — | | | | 6,938 | |
| Receivable for fund shares sold | | | 1,194 | | | | — | |
| Prepaid assets | | | 37,251 | | | | 26,489 | |
| Total Assets | | | 59,582,874 | | | | 18,197,204 | |
| | | | | | | | | |
| Liabilities | | | | | | | | |
| Payable for fund shares redeemed | | | 303,542 | | | | 24,607 | |
| Dividends payable | | | 1,224 | | | | 414 | |
| Payable to Adviser (Note 4) | | | 19,292 | | | | — | |
| Accrued 12b-1 fees (Note 3) | | | 5,893 | | | | 13,767 | |
| Accrued Directors’ fees | | | 8,145 | | | | 1,895 | |
| Accrued expenses and other liabilities | | | 59,484 | | | | 42,446 | |
| Total Liabilities | | | 397,580 | | | | 83,129 | |
| Total Net Assets | | $ | 59,185,294 | | | $ | 18,114,075 | |
| | | | | | | | | |
| Net Assets Consist Of: | | | | | | | | |
| Paid in capital | | $ | 50,599,414 | | | $ | 14,284,692 | |
| Total distributable earnings | | | 8,585,880 | | | | 3,829,383 | |
| Total Net Assets | | $ | 59,185,294 | | | $ | 18,114,075 | |
The accompanying notes are an integral part of these financial statements.
PLUMB FUNDS
Statements of Assets and Liabilities
September 30, 2022 (Unaudited) (Continued)
| | | Plumb | | | Plumb | |
| | | Balanced | | | Equity | |
| | | Fund | | | Fund | |
| Investor Shares | | | | | | |
| Net Assets | | $ | 39,306,078 | | | $ | 11,762,956 | |
| Capital shares outstanding, $0.001 par value (200 million shares issued each) | | | 1,408,364 | | | | 635,490 | |
| Net asset value, offering and redemption price per share | | $ | 27.91 | | | $ | 18.51 | |
| | | | | | | | | |
| Institutional Shares | | | | | | | | |
| Net Assets | | $ | 19,828,000 | | | $ | 6,316,090 | |
| Capital shares outstanding, $0.001 par value (200 million shares issued each) | | | 708,249 | | | | 340,230 | |
| Net asset value, offering and redemption price per share | | $ | 28.00 | | | $ | 18.56 | |
| | | | | | | | | |
| Class A Shares | | | | | | | | |
| Net Assets | | $ | 51,216 | | | $ | 35,029 | |
| Capital shares outstanding, $0.001 par value (200 million shares issued each) | | | 1,835 | | | | 1,893 | |
| Net asset value, minimum offering and redemption price per share(a) | | $ | 27.91 | | | $ | 18.51 | |
| | | | | | | | | |
| Maximum offering price per share | | | | | | | | |
| ($27.91/0.9425) ($18.50/0.9425)(b) | | $ | 29.62 | | | $ | 19.64 | |
| | | | | | | | | |
| * Cost of Investments | | $ | 55,435,892 | | | $ | 15,438,714 | |
| (a) | A 1.00% contingent deferred sales charge is imposed on Class A share purchases of $1 million or more that are redeemed within 18 months after purchase. |
| (b) | On investments of $25,000 or more, the offering price may be reduced. |
The accompanying notes are an integral part of these financial statements.
PLUMB FUNDS
Statements of Operations
For the Six Months Ended September 30, 2022 (Unaudited)
| | | Plumb | | | Plumb | |
| | | Balanced | | | Equity | |
| | | Fund | | | Fund | |
| Investment Income: | | | | | | | | |
| Dividend income* | | $ | 229,581 | | | $ | 53,549 | |
| Interest income | | | 466,933 | | | | 1,468 | |
| Total Investment Income | | | 696,514 | | | | 55,017 | |
| | | | | | | | | |
| Expenses: | | | | | | | | |
| Investment Advisor’s fee (Note 4) | | | 249,715 | | | | 70,751 | |
| 12b-1 fees - Investor shares (Note 3) | | | 62,948 | | | | — | |
| 12b-1 fees - Class A shares (Note 3) | | | 74 | | | | 51 | |
| Fund administration and accounting fees | | | 68,569 | | | | 54,364 | |
| Transfer agent fees and expenses | | | 65,894 | | | | 41,998 | |
| Registration fees | | | 28,084 | | | | 24,610 | |
| Director fees and expenses | | | 15,828 | | | | 4,210 | |
| Legal fees | | | 11,412 | | | | 13,444 | |
| Audit and tax fees | | | 8,327 | | | | 8,327 | |
| Insurance expense | | | 7,503 | | | | 2,013 | |
| Custody fees | | | 5,119 | | | | 4,024 | |
| Printing and mailing expense | | | 1,092 | | | | 913 | |
| Total expenses before Adviser waiver | | | 524,565 | | | | 224,705 | |
| Less: Fees waived by Adviser (Note 4) | | | (93,813 | ) | | | (102,641 | ) |
| Net expenses | | | 430,752 | | | | 122,064 | |
| Net Investment Income (Loss) | | | 265,762 | | | | (67,047 | ) |
| | | | | | | | | |
| Realized and Unrealized Gain (Loss): | | | | | | | | |
| Net realized gain (loss) on investments | | | 260,739 | | | | (726,580 | ) |
| Net change in unrealized depreciation on investments | | | (18,461,415 | ) | | | (6,434,576 | ) |
| Net Realized and Unrealized Loss on Investments | | | (18,200,676 | ) | | | (7,161,156 | ) |
| | | | | | | | | |
| Net Decrease in Net Assets Resulting from Operations | | $ | (17,934,914 | ) | | $ | (7,228,203 | ) |
| * | Net of foreign withholding taxes of $2,448 and $828, respectively. |
The accompanying notes are an integral part of these financial statements.
PLUMB FUNDS
Plumb Balanced Fund
Statements of Changes in Net Assets
| | | For the Six Months Ended September 30, 2022 | | | For the Year Ended March 31, 2022 | |
| | | (Unaudited) | | | | |
| Operations: | | | | | | |
| Net investment income | | $ | 265,762 | | | $ | 202,913 | |
| Net realized gain on investments | | | 260,739 | | | | 9,959,962 | |
| Net change in unrealized appreciation (depreciation) on investments | | | (18,461,415 | ) | | | (11,844,515 | ) |
| Net decrease in net assets resulting from operations | | | (17,934,914 | ) | | | (1,681,640 | ) |
| | | | | | | | | |
| Distributions To Shareholders: | | | | | | | | |
| Net distributions - Investor shares | | | — | | | | (6,226,837 | ) |
| Net distributions - Institutional shares | | | — | | | | (3,479,208 | ) |
| Net distributions - Class A shares | | | — | | | | (5,569 | ) |
| Total distributions to shareholders | | | — | | | | (9,711,614 | ) |
| | | | | | | | | |
| Capital Share Transactions: | | | | | | | | |
| Proceeds from shares sold - Investor shares | | | 2,740,627 | | | | 13,723,072 | |
| Proceeds from shares sold - Institutional shares | | | 302,657 | | | | 19,005,833 | |
| Proceeds from shares sold - Class A shares | | | 570 | | | | 23,857 | |
| Shares issued in reinvestment of dividends - Investor shares | | | — | | | | 6,193,307 | |
| Shares issued in reinvestment of dividends - Institutional shares | | | — | | | | 3,478,904 | |
| Shares issued in reinvestment of dividends - Class A shares | | | — | | | | 5,569 | |
| Cost of shares redeemed - Investor shares | | | (14,526,606 | ) | | | (44,390,523 | ) |
| Cost of shares redeemed - Institutional shares | | | (8,838,042 | ) | | | (30,788,251 | ) |
| Cost of shares redeemed - Class A shares | | | (3,559 | ) | | | — | |
| Net decrease in net assets from capital share transactions | | | (20,324,353 | ) | | | (32,748,232 | ) |
| | | | | | | | | |
| Total decrease in net assets | | | (38,259,267 | ) | | | (44,141,486 | ) |
| | | | | | | | | |
| Net Assets: | | | | | | | | |
| Beginning of period | | | 97,444,561 | | | | 141,586,047 | |
| End of period | | $ | 59,185,294 | | | $ | 97,444,561 | |
The accompanying notes are an integral part of these financial statements.
PLUMB FUNDS
Plumb Balanced Fund
Statements of Changes in Net Assets (Continued)
| | | For the Six Months Ended September 30, 2022 | | | For the Year Ended March 31, 2022 | |
| | | (Unaudited) | | | | |
| Change in Shares Outstanding: | | | | | | | | |
| Investor Shares | | | | | | | | |
| Shares sold | |
| 86,075 | | |
| 339,749 | |
| Shares issued in reinvestment of dividends | | | — | | | | 165,375 | |
| Shares redeemed | | | (467,235 | ) | | | (1,136,598 | ) |
| Net decrease | | | (381,160 | ) | | | (631,474 | ) |
| | | | | | | | | |
| Institutional Shares | | | | | | | | |
| Shares sold | | | 9,519 | | | | 470,356 | |
| Shares issued in reinvestment of dividends | | | — | | | | 92,771 | |
| Shares redeemed | | | (288,064 | ) | | | (780,936 | ) |
| Net decrease | | | (278,545 | ) | | | (217,809 | ) |
| | | | | | | | | |
| Class A Shares | | | | | | | | |
| Shares sold | | | 17 | | | | 564 | |
| Shares issued in reinvestment of dividends | | | — | | | | 149 | |
| Shares redeemed | | | (114 | ) | | | — | |
| Net increase (decrease) | | | (97 | ) | | | 713 | |
The accompanying notes are an integral part of these financial statements.
PLUMB FUNDS
Plumb Equity Fund
Statements of Changes in Net Assets
| | | For the Six Months Ended September 30, 2022 | | | For the Year Ended March 31, 2022 | |
| | | (Unaudited) | | | | |
| Operations: | | | | | | |
| Net investment loss | | $ | (67,047 | ) | | $ | (308,587 | ) |
| Net realized gain (loss) on investments | | | (726,580 | ) | | | 5,970,497 | |
| Net change in unrealized appreciation (depreciation) on investments | | | (6,434,576 | ) | | | (7,277,985 | ) |
| Net decrease in net assets resulting from operations | | | (7,228,203 | ) | | | (1,616,075 | ) |
| | | | | | | | | |
| Distributions To Shareholders: | | | | | | | | |
| Net distributions - Investor shares | | | — | | | | (4,760,982 | ) |
| Net distributions - Institutional shares | | | — | | | | (2,236,119 | ) |
| Net distributions - Class A shares | | | — | | | | (11,468 | ) |
| Total distributions to shareholders | | | — | | | | (7,008,569 | ) |
| | | | | | | | | |
| Capital Share Transactions: | | | | | | | | |
| Proceeds from shares sold - Investor shares | | | 87,724 | | | | 469,109 | |
| Proceeds from shares sold - Institutional shares | | | 2,631 | | | | 719,955 | |
| Proceeds from shares sold - Class A shares | | | 2,200 | | | | 9,700 | |
| Shares issued in reinvestment of dividends - Investor shares | | | — | | | | 4,760,982 | |
| Shares issued in reinvestment of dividends - Institutional shares | | | — | | | | 2,236,119 | |
| Shares issued in reinvestment of dividends - Class A shares | | | — | | | | 11,468 | |
| Cost of shares redeemed - Investor shares | | | (856,734 | ) | | | (5,393,982 | ) |
| Cost of shares redeemed - Institutional shares | | | (178,411 | ) | | | (6,161,956 | ) |
| Cost of shares redeemed - Class A shares | | | (2,000 | ) | | | (3,200 | ) |
| Net decrease in net assets from capital share transactions | | | (944,590 | ) | | | (3,351,805 | ) |
| | | | | | | | | |
| Total decrease in net assets | | | (8,172,793 | ) | | | (11,976,449 | ) |
| | | | | | | | | |
| Net Assets: | | | | | | | | |
| Beginning of period | | | 26,286,868 | | | | 38,263,317 | |
| End of period | | $ | 18,114,075 | | | $ | 26,286,868 | |
The accompanying notes are an integral part of these financial statements.
PLUMB FUNDS
Plumb Equity Fund
Statements of Changes in Net Assets (Continued)
| | | For the Six Months Ended September 30, 2022 | | | For the Year Ended March 31, 2022 | |
| | | (Unaudited) | | | | |
| Change in Shares Outstanding: | | | | | | | | |
| Investor Shares | | | | | | | | |
| Shares sold | |
| 3,949 | | |
| 13,467 | |
| Shares issued in reinvestment of dividends | | | — | | | | 165,715 | |
| Shares redeemed | | | (38,175 | ) | | | (180,606 | ) |
| Net decrease | | | (34,226 | ) | | | (1,424 | ) |
| | | | | | | | | |
| Institutional Shares | | | | | | | | |
| Shares sold | | | 116 | | | | 23,804 | |
| Shares issued in reinvestment of dividends | | | — | | | | 77,724 | |
| Shares redeemed | | | (8,073 | ) | | | (178,310 | ) |
| Net decrease | | | (7,957 | ) | | | (76,782 | ) |
| | | | | | | | | |
| Class A Shares | | | | | | | | |
| Shares sold | | | 99 | | | | 267 | |
| Shares issued in reinvestment of dividends | | | — | | | | 399 | |
| Shares redeemed | | | (90 | ) | | | (111 | ) |
| Net increase | | | 9 | | | | 555 | |
The accompanying notes are an integral part of these financial statements.
(This page intentionally left blank.)
PLUMB FUNDS
Plumb Balanced Fund – Investor Shares
Financial Highlights
| | | For the
Six Months
Ended
September 30,
2022 | |
| | | (Unaudited) | |
| | | | |
| Per share operating performance | | | |
| (For a share outstanding throughout the period) | | | | |
| | | | | |
| Net asset value, beginning of period | | $ | 35.05 | |
| Operations: | | | | |
| Net investment income(1) | | | 0.10 | |
| Net realized and unrealized gain (loss) | | | (7.24 | ) |
| Total from investment operations | | | (7.14 | ) |
| | | | | |
| Distributions to shareholders: | | | | |
| Distributions from net investment income | | | — | |
| Distributions from net realized gains | | | — | |
| Total distributions to shareholders | | | — | |
| | | | | |
| Change in net asset value for the period | | | (7.14 | ) |
| | | | | |
| Net asset value, end of period | | $ | 27.91 | |
| Total return(2) | | | (20.37 | )%(3) |
| | | | | |
| Ratios / supplemental data | | | | |
| Net assets, end of period (000) | | $ | 39,306 | |
| Ratio of net expenses to average net assets: | | | | |
| Before expense reimbursement and waivers/recoupment | | | 1.45 | %(4) |
| After expense reimbursement and waivers/recoupment(5) | | | 1.19 | %(4) |
| Ratio of net investment income to average net assets: | | | | |
| After expense reimbursement and waivers/recoupment(5) | | | 0.62 | %(4) |
| Portfolio turnover rate | | | 14 | %(3) |
| (1) | Net investment income (loss) per share has been calculated based on average shares outstanding during the period. Prior to the period ended March 31, 2021, net investment income per share was calculated using current period ending balances prior to consideration of adjustment for permanent book and tax differences. |
| (2) | Total return represents the rate that the investor would have earned or lost on an investment in the Fund, assuming reinvestment of dividends. |
| (3) | Not annualized for the six months ended September 30, 2022. |
| (4) | Annualized for the six months ended September 30, 2022. |
| (5) | Effective December 1, 2017, the Advisor contractually agreed to cap the Funds expenses at 1.19%. Prior to December 1, 2017, the Fund’s expense cap was 1.30%. |
The accompanying notes are an integral part of these financial statements.
PLUMB FUNDS
Plumb Balanced Fund – Investor Shares
Financial Highlights (Continued)
| For the Years Ended March 31, | |
| | 2022 | | | | 2021 | | | | 2020 | | | | 2019 | | | | 2018 | |
| | | | | | | | | | | | | | | | | | | |
| $ | 39.04 | | | $ | 28.33 | | | $ | 30.98 | | | $ | 28.77 | | | $ | 24.75 | |
| | | | | | | | | | | | | | | | | | | |
| | 0.03 | | | | 0.05 | | | | 0.17 | | | | 0.16 | | | | 0.15 | |
| | (0.89 | ) | | | 10.82 | | | | (2.01 | ) | | | 2.51 | | | | 4.05 | |
| | (0.86 | ) | | | 10.87 | | | | (1.84 | ) | | | 2.67 | | | | 4.20 | |
| | | | | | | | | | | | | | | | | | | |
| | (0.06 | ) | | | (0.16 | ) | | | (0.15 | ) | | | — | | | | (0.18 | ) |
| | (3.07 | ) | | | — | | | | (0.66 | ) | | | (0.46 | ) | | | — | |
| | (3.13 | ) | | | (0.16 | ) | | | (0.81 | ) | | | (0.46 | ) | | | (0.18 | ) |
| | | | | | | | | | | | | | | | | | | |
| | (3.99 | ) | | | 10.71 | | | | (2.65 | ) | | | 2.21 | | | | 4.02 | |
| | | | | | | | | | | | | | | | | | | |
| $ | 35.05 | | | $ | 39.04 | | | $ | 28.33 | | | $ | 30.98 | | | $ | 28.77 | |
| | (2.73 | )% | | | 38.35 | % | | | (6.27 | )% | | | 9.47 | % | | | 16.98 | % |
| | | | | | | | | | | | | | | | | | | |
| $ | 62,718 | | | $ | 94,514 | | | $ | 96,148 | | | $ | 97,139 | | | $ | 44,722 | |
| | | | | | | | | | | | | | | | | | | |
| | 1.25 | % | | | 1.22 | % | | | 1.19 | % | | | 1.18 | % | | | 1.50 | % |
| | 1.19 | % | | | 1.19 | % | | | 1.19 | % | | | 1.19 | % | | | 1.26 | % |
| | | | | | | | | | | | | | | | | | | |
| | 0.08 | % | | | 0.13 | % | | | 0.58 | % | | | 0.66 | % | | | 0.57 | % |
| | 38 | % | | | 63 | % | | | 52 | % | | | 58 | % | | | 37 | % |
The accompanying notes are an integral part of these financial statements.
PLUMB FUNDS
Plumb Balanced Fund – Institutional Shares
Financial Highlights
| | | For the
Six Months
Ended
September 30,
2022 | |
| | | (Unaudited) | |
| | | | | |
| Per share operating performance | | | | |
| (For a share outstanding throughout the period) | | | | |
| | | | | |
| Net asset value, beginning of period | | $ | 35.12 | |
| | | | | |
| Operations: | | | | |
| Net investment income(1) | | | 0.13 | |
| Net realized and unrealized gain (loss) | | | (7.25 | ) |
| Total from investment operations | | | (7.12 | ) |
| | | | | |
| Distributions to shareholders: | | | | |
| Distributions from net investment income | | | — | |
| Distributions from net realized gains | | | — | |
| Total distributions to shareholders | | | — | |
| | | | | |
| Change in net asset value for the period | | | (7.12 | ) |
| | | | | |
| Net asset value, end of period | | $ | 28.00 | |
| Total return(2) | | | (20.30 | )%(3) |
| | | | | |
| Ratios / supplemental data | | | | |
| Net assets, end of period (000) | | $ | 19,828 | |
| Ratio of net expenses to average net assets: | | | | |
| Before expense reimbursement and waivers | | | 1.20 | %(4) |
| After expense reimbursement and waivers | | | 0.99 | %(4) |
| Ratio of net investment income to average net assets: | | | | |
| After expense reimbursement and waivers | | | 0.82 | %(4) |
| Portfolio turnover rate | | | 14 | %(3) |
| (1) | Net investment income (loss) per share has been calculated based on average shares outstanding during the period. |
| (2) | Total return represents the rate that the investor would have earned or lost on an investment in the Fund, assuming reinvestment of dividends. |
| (3) | Not annualized for the period. |
| (4) | Annualized for the period. |
| * | Institutional Shares began operations on August 3, 2020. |
The accompanying notes are an integral part of these financial statements.
PLUMB FUNDS
Plumb Balanced Fund – Institutional Shares
Financial Highlights (Continued)
| For the | | | For the | |
| Year Ended | | | Period Ended | |
| March 31, | | | March 31, | |
| 2022 | | | 2021* |
|
| | | | | | | |
| $ | 39.04 | | | $ | 35.38 | |
| | | | | | | |
| | 0.12 | | | | 0.04 | |
| | (0.91 | ) | | | 3.85 | |
| | (0.79 | ) | | | 3.89 | |
| | | | | | | |
| | (0.06 | ) | | | (0.23 | ) |
| | (3.07 | ) | | | — | |
| | (3.13 | ) | | | (0.23 | ) |
| | | | | | | |
| | (3.92 | ) | | | 3.66 | |
| | | | | | | |
| $ | 35.12 | | | $ | 39.04 | |
| | (2.52 | )% | | | 10.97 | %(3) |
| | | | | | | |
| $ | 34,659 | | | $ | 47,024 | |
| | | | | | | |
| | 1.00 | % | | | 1.02 | %(4) |
| | 0.99 | % | | | 0.99 | %(4) |
| | | | | | | |
| | 0.30 | % | | | 0.16 | %(4) |
| | 38 | % | | | 63 | %(3) |
The accompanying notes are an integral part of these financial statements.
PLUMB FUNDS
Plumb Balanced Fund – Class A Shares
Financial Highlights
| | | For the Six Months Ended September 30, 2022 | |
| | | (Unaudited) | |
| | | | | |
| Per share operating performance | | | | |
| (For a share outstanding throughout the period) | | | | |
| | | | | |
| Net asset value, beginning of period | | $ | 35.05 | |
| | | | | |
| Operations: | | | | |
| Net investment income(1) | | | (0.07 | ) |
| Net realized and unrealized gain (loss) | | | (7.07 | ) |
| Total from investment operations | | | (7.14 | ) |
| | | | | |
| Distributions to shareholders: | | | | |
| Distributions from net investment income | | | — | |
| Distributions from net realized gains | | | — | |
| Total distributions to shareholders | | | — | |
| | | | | |
| Change in net asset value for the period | | | (7.14 | ) |
| | | | | |
| Net asset value, end of period | | $ | 27.91 | |
| Total return(4)(5) | | | (20.39 | )%(6) |
| | | | | |
| Ratios / supplemental data | | | | |
| Net assets, end of period (000) | | $ | 51 | |
| Ratio of net expenses to average net assets: | | | | |
| Before expense reimbursement and waivers | | | 1.45 | %(7) |
| After expense reimbursement and waivers | | | 1.19 | %(7) |
| Ratio of net investment income to average net assets: | | | | |
| After expense reimbursement and waivers | | | (0.47 | )%(7) |
| Portfolio turnover rate | | | 14 | %(6) |
| (1) | Net investment income (loss) per share has been calculated based on average shares outstanding during the period. |
| (2) | Amount rounds to less than $0.005. |
| (3) | Net realized and unrealized gains and losses per share in this caption are balancing amounts necessary to reconcile the change in net asset value per share for the period, and may not reconcile with the Fund’s statement of operations due to share transactions for the period. |
| (4) | Total return represents the rate that the investor would have earned or lost on an investment in the Fund, assuming reinvestment of dividends. |
| (5) | Total investment return excludes the effect of applicable sales charges. |
| (6) | Not annualized for the period. |
| (7) | Annualized for the period. |
| * | Class A Shares began operations on February 8, 2021. |
The accompanying notes are an integral part of these financial statements.
PLUMB FUNDS
Plumb Balanced Fund – Class A Shares
Financial Highlights (Continued)
| For the | | | For the | |
| Year Ended | | | Period Ended | |
| March 31, | | | March 31, | |
| 2022 | | | 2021* |
|
| | | | | | | |
| $ | 39.04 | | | $ | 41.04 | |
| | | | | | | |
| | 0.05 | | | | (0.00 | )(2) |
| | (0.91 | ) | | | (2.00 | )(3) |
| | (0.86 | ) | | | (2.00 | ) |
| | | | | | | |
| | (0.06 | ) | | | — | |
| | (3.07 | ) | | | — | |
| | (3.13 | ) | | | — | |
| | | | | | | |
| | (3.99 | ) | | | (2.00 | ) |
| | | | | | | |
| $ | 35.05 | | | $ | 39.04 | |
| | (2.70 | )% | | | (4.87 | )%(6) |
| | | | | | | |
| $ | 68 | | | $ | 48 | |
| | | | | | | |
| | 1.26 | % | | | 1.33 | %(7) |
| | 1.19 | % | | | 1.19 | %(7) |
| | | | | | | |
| | 0.12 | % | | | (0.03 | )%(7) |
| | 38 | % | | | 63 | %(6) |
| | | | | | | |
The accompanying notes are an integral part of these financial statements.
PLUMB FUNDS
Plumb Equity Fund – Investor Shares
Financial Highlights
| | | For the
Six Months
Ended
September 30,
2022 | |
| | | (Unaudited) | |
| | | | | |
| Per share operating performance | | | | |
| (For a share outstanding throughout the period) | | | | |
| | | | | |
| Net asset value, beginning of period | | $ | 25.76 | |
| | | | | |
| Operations: | | | | |
| Net investment loss(1) | | | (0.07 | ) |
| Net realized and unrealized gain (loss) | | | (7.18 | ) |
| Total from investment operations | | | (7.25 | ) |
| | | | | |
| Distributions to shareholders: | | | | |
| Distributions from net investment income | | | — | |
| Distributions from net realized gains | | | — | |
| Total distributions to shareholders | | | — | |
| | | | | |
| Change in net asset value for the period | | | (7.25 | ) |
| | | | | |
| Net asset value, end of period | | $ | 18.51 | |
| Total return(3) | | | (28.17 | )%(4) |
| | | | | |
| Ratios / supplemental data | | | | |
| Net assets, end of period (000) | | $ | 11,763 | |
| Ratio of net expenses to average net assets: | | | | |
| Before expense reimbursement and waivers | | | 2.06 | %(5) |
| After expense reimbursement and waivers(6) | | | 1.19 | %(5) |
| Ratio of net investment income to average net assets: | | | | |
| After expense reimbursement and waivers(6) | | | (0.68 | )%(5) |
| Portfolio turnover rate | | | 13 | %(4) |
| (1) | Net investment income (loss) per share has been calculated based on average shares outstanding during the period. Prior to the period ended March 31, 2021, net investment income per share was calculated using current period ending balances prior to consideration of adjustment for permanent book and tax differences. |
| (2) | Realized and unrealized gains and losses per share in this caption are balancing amounts necessary to reconcile the change in net asset value per share for the period, and may not reconcile with the aggregate gains and losses in the Statement of Operations due to share transactions for the period. |
| (3) | Total return represents the rate that the investor would have earned or lost on an investment in the Fund, assuming reinvestment of dividends. |
| (4) | Not annualized for the six months ended September 30, 2022. |
| (5) | Annualized for the six months ended September 30, 2022. |
| (6) | Effective December 1, 2017, the Advisor contractually agreed to cap the Funds’ expenses at 1.19%. Prior to December 1, 2017, the Fund’s expense cap was 1.45%. |
The accompanying notes are an integral part of these financial statements.
PLUMB FUNDS
Plumb Equity Fund – Investor Shares
Financial Highlights (Continued)
| For the Years Ended March 31, | |
| | 2022 | | | | 2021 | | | | 2020 | | | | 2019 | | | | 2018 | |
| | | | | | | | | | | | | | | | | | | |
| $ | 34.87 | | | $ | 23.90 | | | $ | 28.35 | | | $ | 28.78 | | | $ | 24.70 | |
| | | | | | | | | | | | | | | | | | | |
| | (0.33 | ) | | | (0.24 | ) | | | (0.21 | ) | | | (0.17 | ) | | | (0.21 | ) |
| | (1.24 | ) | | | 14.57 | | | | (2.97 | ) | | | 3.23 | | | | 7.84 | (2) |
| | (1.57 | ) | | | 14.33 | | | | (3.18 | ) | | | 3.06 | | | | 7.63 | |
| | | | | | | | | | | | | | | | | | | |
| | — | | | | (0.15 | ) | | | — | | | | — | | | | — | |
| | (7.54 | ) | | | (3.21 | ) | | | (1.27 | ) | | | (3.49 | ) | | | (3.55 | ) |
| | (7.54 | ) | | | (3.36 | ) | | | (1.27 | ) | | | (3.49 | ) | | | (3.55 | ) |
| | | | | | | | | | | | | | | | | | | |
| | (9.11 | ) | | | 10.97 | | | | (4.45 | ) | | | (0.43 | ) | | | 4.08 | |
| | | | | | | | | | | | | | | | | | | |
| $ | 25.76 | | | $ | 34.87 | | | $ | 23.90 | | | $ | 28.35 | | | $ | 28.78 | |
| | (6.69 | )% | | | 59.42 | % | | | (12.07 | )% | | | 12.67 | % | | | 31.65 | % |
| | | | | | | | | | | | | | | | | | | |
| $ | 17,252 | | | $ | 23,404 | | | $ | 31,056 | | | $ | 37,587 | | | $ | 29,641 | |
| | | | | | | | | | | | | | | | | | | |
| | 1.74 | % | | | 1.53 | % | | | 1.43 | % | | | 1.44 | % | | | 1.68 | % |
| | 1.19 | % | | | 1.19 | % | | | 1.19 | % | | | 1.19 | % | | | 1.36 | % |
| | | | | | | | | | | | | | | | | | | |
| | (0.95 | )% | | | (0.75 | )% | | | (0.70 | )% | | | (0.63 | )% | | | (0.79 | )% |
| | 40 | % | | | 66 | % | | | 46 | % | | | 64 | % | | | 69 | % |
The accompanying notes are an integral part of these financial statements.
PLUMB FUNDS
Plumb Equity Fund – Institutional Shares
Financial Highlights
| | | For the
Six Months
Ended
September 30,
2022 | |
| | | (Unaudited) | |
| | | | | |
| Per share operating performance | | | | |
| (For a share outstanding throughout the period) | | | | |
| | | | | |
| Net asset value, beginning of period | | $ | 25.81 | |
| | | | | |
| Operations: | | | | |
| Net investment income(1) | | | (0.05 | ) |
| Net realized and unrealized gain (loss) | | | (7.20 | ) |
| Total from investment operations | | | (7.25 | ) |
| | | | | |
| Distributions to shareholders: | | | | |
| Distributions from net investment income | | | — | |
| Distributions from net realized gains | | | — | |
| Total distributions to shareholders | | | — | |
| | | | | |
| Change in net asset value for the period | | | (7.25 | ) |
| | | | | |
| Net asset value, end of period | | $ | 18.56 | |
| Total return(2) | | | (28.12 | )%(3) |
| | | | | |
| Ratios / supplemental data | | | | |
| Net assets, end of period (000) | | $ | 6,316 | |
| Ratio of net expenses to average net assets: | | | | |
| Before expense reimbursement and waivers | | | 2.06 | %(4) |
| After expense reimbursement and waivers | | | 0.99 | %(4) |
| Ratio of net investment income to average net assets: | | | | |
| After expense reimbursement and waivers | | | (0.48 | )%(4) |
| Portfolio turnover rate | | | 13 | %(3) |
| (1) | Net investment income (loss) per share has been calculated based on average shares outstanding during the period. |
| (2) | Total return represents the rate that the investor would have earned or lost on an investment in the Fund, assuming reinvestment of dividends. |
| (3) | Not annualized for the period. |
| (4) | Annualized for the period. |
| * | Institutional Shares began operations on August 3, 2020. |
The accompanying notes are an integral part of these financial statements.
PLUMB FUNDS
Plumb Equity Fund – Institutional Shares
Financial Highlights (Continued)
| For the | | | For the | |
| Year Ended | | | Period Ended | |
| March 31, | | | March 31, | |
| 2022 | | | 2021* |
|
| | | | | | | |
| $ | 34.86 | | | $ | 32.57 | |
| | | | | | | |
| | (0.26 | ) | | | (0.16 | ) |
| | (1.25 | ) | | | 5.88 | |
| | (1.51 | ) | | | 5.72 | |
| | | | | | | |
| | — | | | | (0.22 | ) |
| | (7.54 | ) | | | (3.21 | ) |
| | (7.54 | ) | | | (3.43 | ) |
| | | | | | | |
| | (9.05 | ) | | | 2.29 | |
| | | | | | | |
| $ | 25.81 | | | $ | 34.86 | |
| | (6.51 | )% | | | 17.17 | %(3) |
| | | | | | | |
| $ | 8,986 | | | $ | 14,813 | |
| | | | | | | |
| | 1.57 | % | | | 1.39 | %(4) |
| | 0.99 | % | | | 0.99 | %(4) |
| | | | | | | |
| | (0.75 | )% | | | (0.70 | )%(4) |
| | 40 | % | | | 66 | %(3) |
The accompanying notes are an integral part of these financial statements.
PLUMB FUNDS
Plumb Equity Fund – Class A Shares
Financial Highlights
| | | For the
Six Months
Ended
September 30,
2022 | |
| | | (Unaudited) | |
| | | | | |
| Per share operating performance | | | | |
| (For a share outstanding throughout the period) | | | | |
| | | | | |
| Net asset value, beginning of period | | $ | 25.76 | |
| | | | | |
| Operations: | | | | |
| Net investment income(1) | | | (0.07 | ) |
| Net realized and unrealized gain (loss) | | | (7.18 | ) |
| Total from investment operations | | | (7.25 | ) |
| | | | | |
| Distributions to shareholders: | | | | |
| Distributions from net investment income | | | — | |
| Distributions from net realized gains | | | — | |
| Total distributions to shareholders | | | — | |
| | | | | |
| Change in net asset value for the period | | | (7.25 | ) |
| | | | | |
| Net asset value, end of period | | $ | 18.51 | |
| Total return(3)(4) | | | (28.17 | )%(5) |
| | | | | |
| Ratios / supplemental data | | | | |
| Net assets, end of period (000) | | $ | 35 | |
| Ratio of net expenses to average net assets: | | | | |
| Before expense reimbursement and waivers | | | 2.32 | %(6) |
| After expense reimbursement and waivers | | | 1.19 | %(6) |
| Ratio of net investment income to average net assets: | | | | |
| After expense reimbursement and waivers | | | (0.69 | )%(6) |
| Portfolio turnover rate | | | 13 | %(5) |
| (1) | Net investment income (loss) per share has been calculated based on average shares outstanding during the period. |
| (2) | Net realized and unrealized gains and losses per share in this caption are balancing amounts necessary to reconcile the change in net asset value per share for the period, and may not reconcile with the Fund’s statement of operations due to share transactions for the period. |
| (3) | Total return represents the rate that the investor would have earned or lost on an investment in the Fund, assuming reinvestment of dividends. |
| (4) | Total investment return excludes the effect of applicable sales charges. |
| (5) | Not annualized for the period. |
| (6) | Annualized for the period. |
| * | Class A Shares began operations on February 8, 2021. |
The accompanying notes are an integral part of these financial statements.
PLUMB FUNDS
Plumb Equity Fund – Class A Shares
Financial Highlights (Continued)
| For the | | | For the | |
| Year Ended | | | Period Ended | |
| March 31, | | | March 31, | |
| 2022 | | | 2021* |
|
| | | | | | | |
| $ | 34.87 | | | $ | 37.67 | |
| | | | | | | |
| | (0.33 | ) | | | (0.05 | ) |
| | (1.24 | ) | | | (2.75 | )(2) |
| | (1.57 | ) | | | (2.80 | ) |
| | | | | | | |
| | — | | | | — | |
| | (7.54 | ) | | | — | |
| | (7.54 | ) | | | — | |
| | | | | | | |
| | (9.11 | ) | | | (2.80 | ) |
| | | | | | | |
| $ | 25.76 | | | $ | 34.87 | |
| | (6.68 | )% | | | (7.43 | )%(5) |
| | | | | | | |
| $ | 49 | | | $ | 46 | |
| | | | | | | |
| | 1.84 | % | | | 1.77 | %(6) |
| | 1.19 | % | | | 1.19 | %(6) |
| | | | | | | |
| | (0.95 | )% | | | (0.98 | )%(6) |
| | 40 | % | | | 66 | %(5) |
| | | | | | | |
The accompanying notes are an integral part of these financial statements.
PLUMB FUNDS
Notes to Financial Statements
September 30, 2022 (Unaudited)
Wisconsin Capital Funds, Inc. (the “Company”), also referred to as the “Plumb Funds”, is registered under the Investment Company Act of 1940 (the “1940 Act”) as an open-end, diversified management investment company. The Company was organized as a Maryland corporation on April 3, 2007. The Company is authorized to issue up to 2 billion shares, which are units of beneficial interest with a $0.001 par value. The Company currently offers shares of two series, each with its own investment strategy and risk/reward profile: the Plumb Balanced Fund and the Plumb Equity Fund (individually a “Fund”, collectively the “Funds”). Each Fund offers three share classes: the Investor Shares (Inception date of May 24, 2007), the Institutional Shares (Inception date of August 3, 2020), and the Class A Shares (Inception date of February 8, 2021). Each share class represents an interest in the same assets of the Fund, has the same rights and is identical in all material respects except that (i) Class A Shares have a maximum front end sales load of 5.75% and maximum deferred sales charge of 1.00%; (ii) Investor Shares and Class A Shares have a 12b-1 fee of up to 0.25%; and (iii) certain other class specific expenses will be borne solely by the class to which such expenses are attributable.
The investment objective of the Plumb Balanced Fund is high total return through capital appreciation while attempting to preserve principal, with current income as a secondary objective. The investment objective of the Plumb Equity Fund is long-term capital appreciation. Wisconsin Capital Management, LLC (the “Advisor”) serves as the Funds’ investment advisor. As of December 31, 2014, the Advisor is owned by TGP, Inc. The Advisor is controlled by Thomas G. Plumb indirectly through TGP, Inc. Certain directors or officers of the Funds are also officers of the Advisor.
| 2. | SIGNIFICANT ACCOUNTING POLICES |
The following is a summary of significant accounting policies consistently followed by the Funds in the preparation of its financial statements. These policies are in conformity with accounting principles generally accepted in the United States of America (“GAAP”). The Fund is an investment company and accordingly follows the investment company accounting and reporting guidance of the Financial Accounting Standards Board (“FASB”) Accounting Standards Codification Topic 946 Financial Services – Investment Companies.
PLUMB FUNDS
Notes to Financial Statements
September 30, 2022 (Unaudited) (Continued)
Security Valuation:
The Funds have adopted authoritative fair valuation accounting standards which establish an authoritative definition of fair value and set out a hierarchy for measuring fair value. These standards require additional disclosures about the various inputs and valuation techniques used to develop the measurements of fair value and a discussion in changes in valuation techniques and related inputs during the year. These inputs are summarized in the three broad levels listed below.
Level 1 – quoted prices in active markets for identical securities
Level 2 – other significant observable inputs (including quoted prices for similar securities, interest rates, prepayment speeds, credit risk, etc.)
Level 3 – significant unobservable inputs (including the Funds’ own assumptions in determining far value of investments)
Equity securities, including domestic common stocks and foreign issued common stocks, are valued at the last sale price reported by the exchange on which the securities are primarily traded on the day of valuation. Nasdaq-listed securities are valued at their Nasdaq Official Closing Price. Equity securities not traded on a listed exchange or not traded using Nasdaq are valued as of the last sale price at the close of the U.S. market. If there are no sales on a given day for securities traded on an exchange, the latest bid quotation will be used. These securities will generally be classified as Level 1 securities.
Investments in mutual funds, including money market funds, are generally priced at the ending net asset value (NAV) provided by the service agent of the Funds and will be classified as Level 1 securities.
Debt securities such as corporate bonds and preferred securities are valued using a market approach based on information supplied by independent pricing services. The market inputs used by the independent pricing service include benchmark yields, reported trades, broker/dealer quotes, issuer spreads, two sided markets, benchmark securities, bids, offers, and reference data including market research publications. Debt securities with remaining maturities of 60 days or less may be valued on an amortized cost basis, which involves valuing an instrument at its cost and thereafter assuming a constant amortization to maturity of any discount or premium, regardless of the impact of fluctuating rates on the fair value of the instrument. To the extent the inputs are observable and timely, these debt securities will generally be classified as Level 2 securities.
Any securities or other assets for which market quotations are not readily available are valued at fair value as determined in good faith by the Advisor pursuant to procedures established under the general supervision and responsibility of the Funds’ Board of Directors and will be classified as Level 3 securities.
The inputs or methodology used for valuing securities may not be an indication of the risk associated with investing in those securities. The inputs used to measure fair value may fall into different levels of the fair value hierarchy. In such cases, for disclosure purposes, the level in the fair value hierarchy within which the fair value measurement falls in its entirety is determined based on the lowest level input that is significant to the fair value measurement in its entirety.
PLUMB FUNDS
Notes to Financial Statements
September 30, 2022 (Unaudited) (Continued)
The following is a summary of the inputs used, as of September 30, 2022, to value the Funds’ investments carried at fair value:
| Description | | Level 1 | | | Level 2 | | | Level 3 | | | Total | |
| Plumb Balanced Fund | | | | | | | | | | | | |
| Common Stocks* | | $ | 38,518,253 | | | $ | — | | | $ | — | | | $ | 38,518,253 | |
| Corporate Bonds* | | | — | | | | 20,364,580 | | | | — | | | | 20,364,580 | |
| Short-Term Investment | | | 373,648 | | | | — | | | | — | | | | 373,648 | |
| Total | | $ | 38,891,901 | | | $ | 20,364,580 | | | $ | — | | | $ | 59,256,481 | |
| Description | | Level 1 | | | Level 2 | | | Level 3 | | | Total | |
| Plumb Equity Fund | | | | | | | | | | | | |
| Common Stocks* | | $ | 17,427,365 | | | $ | — | | | $ | — | | | $ | 17,427,365 | |
| Short-Term Investment | | | 730,443 | | | | — | | | | — | | | | 730,443 | |
| Total | | $ | 18,157,808 | | | $ | — | | | $ | — | | | $ | 18,157,808 | |
| * | For detailed industry descriptions, refer to the Schedule of Investments. |
Rule 2a -5:
In December 2020, the SEC adopted a new rule providing a framework for fund valuation practices (“Rule 2a-5”). Rule 2a-5 establishes requirements for determining fair value in good faith for purposes of the 1940 Act. Rule 2a-5 permits fund boards to designate certain parties to perform fair value determinations, subject to board oversight and certain other conditions. Rule 2a-5 also defines when market quotations are “readily available” for purposes of the 1940 Act and the threshold for determining whether a fund must fair value a security. In connection with Rule 2a-5, the SEC also adopted related recordkeeping requirements and rescinded previously issued guidance, including with respect to the role of a board in determining fair value and the accounting and auditing of fund investments. The Funds were required to comply with the rules by September 8, 2022. Management has determined that there would be no material impact of the new rules on the Funds’ financial statements.
Use of Estimates:
The presentation of the financial statements in conformity with GAAP requires management to make estimates and assumptions that affect the reported amounts of assets and liabilities and disclosure of contingent assets and liabilities at the date of the financial statements and the reported amounts of increases and decreases in net assets from operations during the reporting period. Actual results could differ from those estimates.
PLUMB FUNDS
Notes to Financial Statements
September 30, 2022 (Unaudited) (Continued)
Allocation of Income and Expenses:
Net investment income, other than class specific expenses, and realized and unrealized gains and losses are allocated daily to each class of shares based upon the relative NAV of outstanding shares of each class of shares at the beginning of the day (after adjusting for the current capital shares activity of the respective class). Generally, expenses directly attributable to a Fund are charged to the Fund, while expenses attributable to more than one series of the Company are allocated among the respective series based on relative net assets or another appropriate basis.
Federal Income Taxes:
The Funds intend to meet the requirements of the Internal Revenue Code (the “Code”) applicable to regulated investment companies and to distribute substantially all net investment taxable income and net capital gains to shareholders in a manner which results in no tax cost to the Funds. Therefore, no federal income or excise tax provision is recorded.
As of and during the year ended March 31, 2022, the Funds did not have a liability for any unrecognized tax benefits. The Funds recognize interest and penalties, if any, related to unrecognized tax benefits as income tax expense in the Statements of Operations. During the year ended March 31, 2022, the Funds did not incur any interest or penalties.
Distributions to Shareholders:
Dividends from net investment income are declared and paid at least annually. Distributions of net realized capital gains, if any, will be declared and paid at least annually. Distributions to shareholders are recorded on the ex-dividend date.
The Funds may periodically make reclassifications among certain of its capital accounts as a result of the recognition and characterization of certain income and capital gain distributions determined annually in accordance with federal tax regulations which may differ from GAAP. Any such reclassifications will have no effect on net assets, results of operations or net asset values per share of the Funds.
Other:
Investment and shareholder transactions are recorded on the trade date. Gains or losses from investment transactions are determined using the specific identification method. Dividend income is recognized on the ex-dividend date and interest income is recognized on an accrual basis. Discounts and premiums on securities purchased are amortized over the expected life of the respective securities using the effective interest method. Withholding taxes on foreign dividends have been provided for in accordance with the Funds’ understanding of the applicable country’s tax rules and rates.
PLUMB FUNDS
Notes to Financial Statements
September 30, 2022 (Unaudited) (Continued)
Investment securities and other assets and liabilities denominated in foreign currencies are translated into U.S. dollar amounts at the date of valuation. Purchases and sales of investment securities and income and expense items denominated in foreign currencies are translated into U.S. dollar amounts on the respective dates of such transactions. The Fund does not isolate the portion of the results of operations from changes in foreign exchange rates on investments from the fluctuations arising from changes in market prices of securities held. Realized foreign exchange gains or losses arising from sales of portfolio securities and sales and maturities of short-term securities are reported within realized gain (loss) on investments. Net unrealized foreign exchange gains and losses arising from changes in the values of investments in securities from fluctuations in exchange rates are reported within unrealized gain (loss) on investments.
Under the Company’s organizational documents, the Company will indemnify its officers and directors for certain liabilities that may arise from performance of their duties to the Funds. Additionally, in the normal course of business, the Funds enter into contracts that contain a variety of representatives and warranties which provide general indemnifications. The Funds’ maximum exposure under these arrangements is unknown, as this would involve future claims that may be made against the Funds that have not yet occurred.
The Company has adopted a plan pursuant to Rule 12b-1 under the 1940 Act (the “12b-1 Plan”), on behalf of the Funds, which authorizes it to pay a distribution fee up to 0.25% of the Funds’ average daily net assets attributable to both the Investor Shares and the Class A Shares of each Fund, for services to prospective Fund shareholders and distribution of Fund shares. During the period ended September 30, 2022, the Plumb Balanced Fund Investor Shares and Class A Shares incurred expenses of $62,948 and $74, respectively, and the Plumb Equity Fund Class A Shares incurred expenses of $51, pursuant to the 12b-1 Plan. The Institutional Shares of each Fund are not subject to any 12b-1 fees under this Plan.
| 4. | INVESTMENT ADVISOR AND OTHER AFFILIATES |
The Funds have an Investment Advisory Agreement (the “Advisory Agreement”) with Wisconsin Capital Management, LLC. The Advisory Agreement provides for advisory fees computed daily and paid monthly at an annual rate of 0.65% of the Funds’ average daily net assets.
PLUMB FUNDS
Notes to Financial Statements
September 30, 2022 (Unaudited) (Continued)
Under the terms of the Advisory Agreement, the Advisor has contractually agreed to limit the Funds’ expenses. Effective December 1, 2017, Wisconsin Capital Management, LLC, the investment advisor to the Funds (the “Advisor”), has contractually agreed to waive its advisory fee and/or reimburse expenses in order to limit the Total Annual Fund Operating Expenses of each Fund to 1.19% of the Fund’s average daily net assets for the Investor Shares and the Class A Shares, and 0.99% of the Fund’s average daily net assets for the Institutional Shares. This contractual limitation is in effect until July 31, 2023 and may not be terminated without the approval of the Board of Directors of Wisconsin Capital Funds, Inc. Prior to December 1, 2017, the Plumb Balanced Fund and the Plumb Equity Fund’s expense cap was 1.30% and 1.45% for the Investor Shares, respectively. Any such waiver or reimbursement is subject to later adjustment to allow the Advisor to recoup amounts waived or reimbursed to the extent actual fees and expenses for a period are less than the expense limitation caps in place at the time the waiver was made, provided, however, that the Advisor shall only be entitled to recoup such amounts for a period of three years from the date such amount was waived or reimbursed. For the period ended September 30, 2022, the Advisor waived $65,988, $27,746, and $79 of expenses in the Plumb Balanced Fund’s Investor Shares, Institutional Shares, and Class A Shares, respectively. For the period ended September 30, 2022, the Advisor waived $62,297, $40,113 and $231 of expenses in the Plumb Equity Fund’s Investor Shares, Institutional Shares, and Class A Shares, respectively.
As of September 30, 2022, the Advisor has waived and recouped fees. The following table shows the remaining amount subject to potential recoupment as of September 30, 2022 and expiring on:
| Plumb Balanced Fund Investor Shares | |
| March 31, 2023 | | $ | 28,760 | |
| March 31, 2024 | | | 36,933 | |
| March 31, 2025 | | | 56,546 | |
| March 31, 2026 | | | 65,988 | |
| Plumb Balanced Fund Institutional Shares | |
| March 31, 2024 | | $ | 2,051 | |
| March 31, 2025 | | | 12,148 | |
| March 31, 2026 | | | 27,746 | |
| Plumb Balanced Fund Class A Shares | |
| March 31, 2024 | | $ | 9 | |
| March 31, 2025 | | | 44 | |
| March 31, 2026 | | | 79 | |
| Plumb Equity Fund Investor Shares | |
| March 31, 2023 | | $ | 58,695 | |
| March 31, 2024 | | | 108,883 | |
| March 31, 2025 | | | 127,658 | |
| March 31, 2026 | | | 62,297 | |
| Plumb Equity Fund Institutional Shares | |
| March 31, 2024 | | $ | 31,336 | |
| March 31, 2025 | | | 66,528 | |
| March 31, 2026 | | | 40,113 | |
| Plumb Equity Fund Class A Shares | |
| March 31, 2024 | | $ | 38 | |
| March 31, 2025 | | | 352 | |
| March 31, 2026 | | | 231 | |
PLUMB FUNDS
Notes to Financial Statements
September 30, 2022 (Unaudited) (Continued)
| 5. | INVESTMENT TRANSACTIONS |
For the period ended September 30, 2022, the aggregate purchases and sales of investment securities, other than short-term investments, were as follows:
| | | U.S. Government Securities | | | Other | |
| | | Purchases | | | Sales | | | Purchases | | | Sales | |
| Plumb Balanced Fund | | $ | — | | | $ | — | | | $ | 10,347,168 | | | $ | 28,946,866 | |
| Plumb Equity Fund | | | — | | | | — | | | | 2,864,066 | | | | 3,853,021 | |
The beneficial ownership, either directly or indirectly, of more than 25% of the voting securities of a fund creates a presumption of control of the fund under Section 2(a)(9) of the 1940 Act. As of September 30, 2022, beneficial ownership of more than 25% of the shares outstanding in each class is as follows:
| | | Plumb Balanced Fund | | | Plumb Equity Fund | |
| | | Investor
Shares | | | Institutional
Shares | | | Class A
Shares | | | Investor
Shares | | | Institutional
Shares | | | Class A
Shares | |
| National Financial Services LLC | | | 32.29 | % | | | 66.44 | % | | | — | | | | — | | | | 51.05 | % | | | — | |
| Charles Schwab & Co, Inc. | | | — | | | | 31.32 | % | | | — | | | | — | | | | 45.29 | % | | | — | |
| Thomas G. Plumb | | | — | | | | — | | | | 71.94 | % | | | — | | | | — | | | | 88.55 | % |
| 7. | FEDERAL TAX INFORMATION |
As of September 30, 2022, the components of accumulated earnings (losses) for income tax purposes were as follows:
| | | Plumb Balanced Fund Plumb Equity Fund | |
| Unrealized appreciation | | $ | 25,587,571 | | | $ | 10,233,920 | |
| Unrealized depreciation | | | (3,451,235 | ) | | | (1,080,250 | ) |
| Net unrealized appreciation on investments | | | 22,136,336 | | | | 9,153,670 | |
| Undistributed ordinary income | | | 220,458 | | | | — | |
| Undistributed long-term capital gain | | | 4,181,500 | | | | 1,960,369 | |
| Other accumulated losses | | | — | | | | (43,653 | ) |
| Total accumulated gains | | $ | 26,538,294 | | | $ | 11,070,386 | |
PLUMB FUNDS
Notes to Financial Statements
September 30, 2022 (Unaudited) (Continued)
The tax cost of investments as of March 31, 2022 was $75,036,585 and $17,187,240 for the Plumb Balanced Fund and Plumb Equity Fund, respectively. The tax basis of investments for tax and financial reporting purposes differs principally due to the deferral of losses on wash sales.
During the fiscal year ended March 31, 2022, the Funds did not utilize any capital loss carryforwards. As of March 31, 2022, the Funds did not have any capital loss carryforwards.
As of March 31, 2022, the Plumb Equity Fund deferred, on a tax basis, $43,653 of late year ordinary losses and did not defer, on a tax basis, any post-October capital losses. The Plumb Balanced Fund did not differ, on a tax basis, any late year ordinary or post-October capital losses.
| 8. | DISTRIBUTIONS TO SHAREHOLDERS |
The tax character of distributions paid during the fiscal years ended March 31, 2022 and 2021 was as follows:
| | | Plumb Balanced Fund | |
| | | Year Ended | | | Year Ended | |
| | | March 31, 2022 | | | March 31, 2021 | |
| Distributions paid from: | | | | | | | | |
| Ordinary Income | | $ | 181,891 | | | $ | 645,094 | |
| Short-Term Capital Gains | | | 1,274,929 | | | | — | |
| Long-Term Capital Gains | | | 8,254,791 | | | | — | |
| Total Distributions Paid | | $ | 9,711,611 | | | $ | 645,094 | |
| | | Plumb Equity Fund | |
| | | Year Ended | | | Year Ended | |
| | | March 31, 2022 | | | March 31, 2021 | |
| Distributions paid from: | | | | | | | | |
| Ordinary Income | | $ | — | | | $ | 190,449 | |
| Short-Term Capital Gains | | | 970,758 | | | | — | |
| Long-Term Capital Gains | | | 6,037,811 | | | | 3,561,943 | |
| Total Distributions Paid | | $ | 7,008,569 | | | $ | 3,752,392 | |
Unexpected events, such as the global outbreak of COVID-19, have caused adverse effects on many companies, sectors, regions, and the market in general, and may cause these effects for an unknown period of time and in ways that cannot be foreseen. The effects may impact the value and performance of the Funds, their ability to buy and sell fund investments at appropriate valuations and their ability to achieve investment objectives.
PLUMB FUNDS
Notes to Financial Statements
September 30, 2022 (Unaudited) (Continued)
In preparing these financial statements, the Funds have evaluated events and transactions for potential recognition or disclosure through the date the financial statements were issued. Management has determined that there were no material events that would require disclosure in the Fund’s financial statements.
PLUMB FUNDS
Additional Information (Unaudited)
| 1. | BOARD REVIEW OF FUNDS’ INVESTMENT ADVISORY AGREEMENT |
The Investment Company Act of 1940, as amended (“1940 Act”), requires that the Funds’ Investment Advisory Agreement (the “Advisory Agreement”) with the Advisor be approved on an annual basis by the vote of a majority of the Board of Directors who are not parties to the Advisory Agreement or “interested persons” of the Funds (as that term is defined in the 1940 Act) (the “Independent Directors”), cast in person at a meeting called for the purpose of voting on such approval. At its meeting held May 13, 2022, the Board of Directors, including all of the Independent Directors (all of whom were present via videoconference pursuant to SEC Release No. 33817), unanimously approved the continuation of the Advisory Agreement for another year with a contractual waiver by the Advisor.
The Board’s approval was based on its consideration and evaluation of a variety of factors, which included, among other things: (i) the nature, extent and quality of the services rendered; (ii) the investment performance of each Fund; (iii) fees and expenses paid by each Fund to the Advisor; (iv) the economies of scale and whether economies of scale will accrue to the shareholders; and (v) the costs of the services to the Advisor and profits realized by the Advisor in providing services to the Funds. The Board generally viewed these factors in their totality, with no single factor serving as the principal reason for determining whether to renew the Agreement and with individual Board members giving different weight to different factors.
In connection with its consideration of the Advisory Agreement, the Board reviewed, discussed, and considered various materials at this meeting, including:
| ● | a memorandum from Fund counsel discussing the duties and responsibilities of directors when approving investment advisory agreements; |
| ● | a memorandum and related materials from the Funds’ management providing information regarding: |
| ○ | the Funds’ absolute performances as well as their performances relative to industry benchmarks and universes of relevant peers identified by Morningstar; |
| ○ | the expense ratios of the Funds compared to their respective peers identified by Morningstar; and |
| ○ | the scope of investment management services provided by the Advisor; |
| ● | the Advisory Agreement with the Advisor; and |
| ● | reports from the Funds’ Chief Compliance Officer regarding the Advisor’s adherence to the Funds’ compliance program. |
PLUMB FUNDS
Additional Information (Unaudited) (Continued)
The nature, extent and quality of the services rendered by the Advisor.
The Board considered the nature, extent, and quality of services provided by the Advisor, including services required to be provided under the Agreement and additional services provided by the Advisor that were not required under the Agreement. The Board considered the background and experience of the Funds’ portfolio manager as well as other advisory, compliance, administrative, and other support provided by the Advisor. The Board observed that, in addition to investment management and broker-selection services, the Advisor oversees the performance of regular compliance and risk analysis functions for the Funds, and provides office space, equipment, and certain information-technology services necessary for the operation of the Funds.
The Board determined that the significant experience of the Advisor and portfolio manager, including several decades in the investment management industry and managing mutual funds, made them well qualified to continue managing the Funds. The Board determined that, based on the information presented to it in the Board Materials at this meeting and during previous quarters throughout the past year, it believed that the nature, extent, and quality of services provided by the Advisor were reasonably comparable to those provided by advisors to comparable funds, and that such services were adequate for the Funds’ needs.
The Board discussed the investment-related and other support available from the Advisor. The Advisor outlined initiatives at the Advisor and indicated that the corporate parent of the Advisor, TGP, Inc., continues to be committed to supporting the Advisor if and as needed.
The performance of the Funds.
In reviewing the investment performance of each of the Funds, the Board reviewed the performances of the Balanced Fund and Equity Fund over various periods, including the year-to-date, one-year, three-year, five-year, and ten-year periods. The Advisor discussed the performance of the Funds, noting that performance for the Balanced Fund had been challenging for the one-year period after many years of above-average performance. The Advisor said that the Investor Share class of the Balanced Fund had performed behind its benchmark for the one-year, three-year, and ten-year periods while performing ahead of it for the five-year period, and performed behind its Morningstar category average for the one-year and three-year periods while performing ahead of it for the five-year and ten-year periods. The Advisor said that the Investor Share class of the Equity Fund had performed behind both its benchmark and its Morningstar category average for the one-year, three-year, five-year, and ten-year periods.
The Board discussed the performance of the Equity Fund and the Balanced Fund over the periods measured. The Board considered the reason behind recent underperformance of the Funds, the adherence of the Advisor to its stated investment strategies, and opportunities for improvement going forward. After considering the performances of the Balanced Fund and the Equity Fund in this context, the Board determined that the performances of the Balanced Fund and the Equity Fund were satisfactory.
PLUMB FUNDS
Additional Information (Unaudited) (Continued)
The fees and expenses charged by the Advisor
The Advisor reviewed the management fees and expense ratios for each Fund. The Advisor reviewed gross expense ratio information with respect to each class of each of the Funds, and said that after the waiver of certain fees and expenses relating to the Funds, the expense ratio for each Fund was currently 1.19 percent for their Investor Shares and Class A Shares and 0.99 percent for their Institutional Shares. The Advisor said that the Advisor was proposing to continue fee waivers for each class of each of the Funds at their current levels through July 31, 2023. The Advisor remarked that the gross expense ratio for the Balanced Fund had remained relatively stable across classes relative to the prior fiscal year, while the gross expense ratio for the Equity Fund had risen somewhat as net assets declined.
The Advisor reviewed information regarding the median expense ratios of funds in the Morningstar comparison group for each Fund, which showed that the expense ratios for both Funds’ class of Investor Shares were higher than their respective Morningstar category average and the median for their comparison group. The Advisor indicated that it believed that the expense ratios of the Funds were reasonable as compared with other funds and fund complexes with less than $200 million in assets.
In reviewing the cost of services provided to the Funds and profits realized by the Advisor from these relationships, the Board in particular looked at the Advisor’s willingness to waive and reimburse portions of its advisory fee in an effort to keep the Funds’ expense ratios more competitive. The Board observed that the Advisor had made efforts in recent years to grow fund assets, including through the launch of multiple new share classes and additional marketing efforts associated with those launches, which it believed created the opportunity to grow Fund assets and thereby potentially reduce the expense ratios of the Funds.
The Advisor discussed other accounts advised by the Advisor, indicating that the Advisor does not provide similar services to any other registered investment company. The Advisor provided an overview of the Advisor’s standard investment advisory contract fee schedule for its separately managed account clients and the services provided to these Advisor clients. The Board considered the fees for these other accounts. The Advisor noted that separately managed account clients require different services and entail a different level of regulatory and compliance costs than does a registered investment company, so the standard fees for separately managed account clients and under the advisory contract with the Funds were not entirely analogous. Based on all factors it considered, the Board determined that the fees charged by the Advisor to the Funds were acceptable given the quality and scope of services and fees charged by the Advisor to other clients, and the Funds’ expense ratios were reasonable compared to peers and competitors.
PLUMB FUNDS
Additional Information (Unaudited) (Continued)
Profits realized by the Advisor.
The Board considered the profitability of the Advisor. The Advisor indicated that the Advisor had operated at a modestly profitable level in 2021. The Advisor reviewed information regarding Advisor profits reinvested by the Advisor in an effort to sustain and grow Fund assets, including in the ongoing engagement of Cantor Fitzgerald and public relations firm SunStar Strategic. The Advisor said that it expected the Advisor would operate at a similar modestly profitable level for the current year. The Board determined that the profitability of the Advisor was reasonable.
The extent to which economies of scale will be realized as the Funds grow.
The Board considered whether economies of scale might be realized to the extent the Funds’ assets increase. The Board observed that although the gross expense ratios of each of the Funds had tended to decline in periods where the Funds had grown in assets, the Funds had not exhibited significant recent asset growth. The Board determined that although increases in assets would likely help the Funds to achieve economies of scale in the Funds’ operations, in light of their continued relatively small size, neither Fund had yet to achieve any significant economies of scale and neither was likely to realize material economies of scale until assets under management in each Fund grew significantly, which it determined was unlikely in the near future. The Board considered “fall-out” benefits that the Advisor received from managing the Funds, including reputational enhancement as well as the ability to market audited investment capabilities to prospective clients of the Advisor. The Board determined that these benefits were consistent with those received in prior years and similar to benefits received by other Advisors to mutual funds.
After full consideration of the above factors, as well as of other factors that were instructive in its consideration, the Board, including all of the Independent Directors, concluded that the continuation of the Advisory Agreement for the Funds was in the best interest of each respective Fund and its shareholders.
PLUMB FUNDS
Additional Information (Unaudited) (Continued)
| 2. | QUALIFIED DIVIDEND INCOME/DIVIDENDS RECEIVED DEDUCTION |
For the fiscal year ended March 31, 2022, certain dividends paid by the Funds may be subject to a maximum tax rate of 23.80% (which includes a 3.80% Medicare tax). The percentage of dividends declared from ordinary income designated as qualified dividend income was as follows:
| Plumb Balanced Fund | | | 27.71 | % |
| Plumb Equity Fund | | | 13.53 | % |
For corporate shareholders, the percent of ordinary income distributions qualifying for the corporate dividends-received deduction for the fiscal year ended March 31, 2022, was as follows:
| Plumb Balanced Fund | | | 26.20 | % |
| Plumb Equity Fund | | | 13.17 | % |
WISCONSIN CAPITAL FUNDS, INC.
c/o U.S. Bank Global Fund Services
P.O. Box 701
Milwaukee, WI 53201
1-866-987-7888
INVESTMENT ADVISOR
Wisconsin Capital Management, LLC
8401 Excelsior Drive, Suite 102
Madison, WI 53717
(608) 960-4616
DISTRIBUTOR
Quasar Distributors, LLC
111 East Kilbourn Avenue, Suite 2200
Milwaukee, WI 53202
CUSTODIAN
U.S. Bank National Association
1555 North Rivercenter Drive
Suite 302
Milwaukee, WI 53212
TRANSFER AGENT AND
DIVIDEND DISBURSING AGENT
U.S. Bank Global Fund Services
615 East Michigan Street
Milwaukee, WI 53202
INDEPENDENT REGISTERED PUBLIC ACCOUNTING FIRM
Cohen & Company, Ltd.
342 North Water Street, Suite 830
Milwaukee, WI 53202
LEGAL COUNSEL
Quarles & Brady LLP
411 East Wisconsin Avenue
Milwaukee, WI 53202
This report has been prepared for shareholders and may be distributed to others only if preceded or accompanied by a current prospectus.
The Funds’ Statement of Additional Information contains additional information about the Funds’ directors and officers and is available, without charge, at www.plumbfunds.com or upon request by calling 1-866-987-7888.
The Funds’ Proxy Voting Policies and Procedures are available without charge upon request by calling 1-866-987-7888 and on the SEC’s website at www.sec.gov. Information regarding how the Funds voted proxies relating to portfolio securities during the 12-month period ended June 30 is available by calling 1-866-987-7888 and on the SEC’s website at www.sec.gov.
The Funds’ complete schedule of portfolio holdings for the first and third quarters is filed with the SEC on Form N-PORT Part F. The Funds’ Form N-PORT Part F is available on the SEC’s website at www.sec.gov.
Not applicable for semi-annual reports.
Not applicable for semi-annual reports.
Not applicable for semi-annual reports.
Not applicable to registrants who are not listed issuers (as defined in Rule 10A-3 under the Securities Exchange Act of 1934).
(a) Schedule of Investments is included as part of the report to shareholders filed under Item 1 of this Form.
(b) Not applicable.
Not applicable to open-end investment companies.
Not applicable to open-end investment companies.
Not applicable to open-end investment companies.
Not applicable to open-end investment companies.
(4) There was no change in the registrant’s independent public accountant for the period covered by this report.
Pursuant to the requirements of the Securities Exchange Act of 1934 and the Investment Company Act of 1940, the registrant has duly caused this report to be signed on its behalf by the undersigned, thereunto duly authorized.
Thomas G. Plumb, President (Principal Executive Officer)
Pursuant to the requirements of the Securities Exchange Act of 1934 and the Investment Company Act of 1940, this report has been signed below by the following persons on behalf of the registrant and in the capacities and on the dates indicated.
Alissa Schlimgen, Chief Financial Officer (Principal Financial Officer)
* Print the name and title of each signing officer under his or her signature.