Exhibit 99.1
|

Lenders Presentation - Public
June 6th, 2016
|
Disclaimer
This document contains highly confidential information and is solely for informational purposes. You should not rely upon or use it to form the definitive basis for any decision or action whatsoever, with respect to any proposed transaction or otherwise. You and your affiliates and agents must hold this document and any oral information provided in connection with this document, as well as any information derived by you from the information contained herein, in strict confidence and may not communicate, reproduce or disclose it to any other person, or refer to it publicly, in whole or in part at any time except with our prior written consent. If you are not the intended recipient of this document, please delete and destroy all copies immediately.
This document is “as is” and is based, in part, on information obtained from other sources. Our use of such information does not imply that we have independently verified or necessarily agree with any of such information, and we have assumed and relied upon the accuracy and completeness of such information for purposes of this document. Neither we nor any of our affiliates or agents, make any representation or warranty, express or implied, in relation to the accuracy or completeness of the information contained in this document or any oral information provided in connection herewith, or any data it generates and expressly disclaim any and all liability (whether direct or indirect, in contract, tort or otherwise) in relation to any of such information or any errors or omissions therein. Any views or terms contained herein are preliminary, and are based on financial, economic, market and other conditions prevailing as of the date of this document and are subject to change. We undertake no obligations or responsibility to update any of the information contained in this document. Past performance does not guarantee or predict future performance.
This document does not constitute an offer to sell or the solicitation of an offer to buy any security, nor does it constitute an offer or commitment to lend, syndicate or arrange a financing, underwrite or purchase or act as an agent or advisor or in any other capacity with respect to any transaction, or commit capital, or to participate in any trading strategies, and does not constitute legal, regulatory, accounting or tax advice to the recipient. This document does not constitute and should not be considered as any form of financial opinion or recommendation by us or any of our affiliates. This document is not a research report nor should it be construed as such.
This document includes projections. Any projections reflect various estimates and assumptions concerning anticipated results. No representations or warranties are made by us or any of our affiliates as to the accuracy of any such projections. Whether or not any such projections are in fact achieved will depend upon future events some of which are not within our control. Accordingly, actual results may vary from the projected results and such variations may be material. We undertake no obligation, and do not currently intend, to update our projections.
Forward-Looking Statements
In this presentation, all statements that are not purely historical facts are forward-looking statements within the meaning of Section 27A of the Securities Act of 1933, as amended, and Section 21E of the Securities Exchange Act of 1934, as amended. Forward-looking statements may be identified by the words “believe,” “expect,” “anticipate,” “project,” “plan,”
“estimate,” “intend” and other similar expressions. Forward-looking statements are based on currently available business, economic, financial and other information and reflect the current beliefs, expectations and views of the management team of Verso Corporation (the “Company”) with respect to future developments and their potential effects on the
Company. Actual results could vary materially depending on risks and uncertainties that may affect the Company and its business including for example, our ability to consummate a financing. For a discussion of the risks and uncertainties affecting the Company and its business, please refer to the risks and uncertainties identified elsewhere in this presentation as well as those discussed in the Company’s filings with the Securities and Exchange Commission. Neither the Company nor PJT assume any obligation to update forward-looking statements made in this presentation to reflect subsequent events or circumstances or actual outcomes.
Non-GAAP Measures
In this presentation, “EBITDA,” “Adjusted EBITDA” and “Adjusted EBITDA margin” are financial measures not prepared in accordance with U.S. GAAP. These non-GAAP measures should be considered a supplement to, and not as a substitute for, or superior to, financial measures calculated in accordance with GAAP.
CONFIDENTIAL 2
|
Presenters
Dave Paterson Chief Executive Officer Verso Corp Allen Campbell Chief Financial Officer Verso Corp Rob Anderson Managing Director Barclays
Lee Minor Director Wells Fargo
CONFIDENTIAL 3
|
Table of Contents
1. Introduction
2. Company Overview and Credit Highlights
3. Industry Update and Outlook
4. Recent Financial Performance
5. Financial Projections Overview
6. Transaction Overview
Appendices
CONFIDENTIAL
|
Introduction
CONFIDENTIAL
|
Executive Summary
Verso Corporation (“Verso” or the “Company”) is the largest North American coated paper producer and operates seven mills producing coated paper, specialty paper and pulp
– For the 12 months ended March 31, 2016, Verso had Revenues of $3.0 billion, Adjusted EBITDA of $265 million
– Verso filed for Chapter 11 bankruptcy protection on January 26, 2016 to implement a Restructuring
Support Agreement (“RSA”) amongst certain pre-petition creditors to significantly de-lever and combine the previously separate capital structures of Verso and NewPage
In connection with the Company’s emergence from Chapter 11, Verso is raising
– A new $350mm ABL Revolver (“ABL Facility”), and
– A new $225mm 1st Lien Senior Secured Term Loan (“Term Loan”)
The ABL Facility and Term Loan will be secured by a collateral package including both legacy NewPage and legacy Verso assets
Proceeds from the financings will be used to repay certain DIP financings, pay administrative claims, pay related fees and expenses and for working capital and general corporate purposes after the closing date
– The financing will fund upon emergence, which is currently expected to occur in July (1)
1. Emergence may occur as soon as July 1
CONFIDENTIAL 6
|
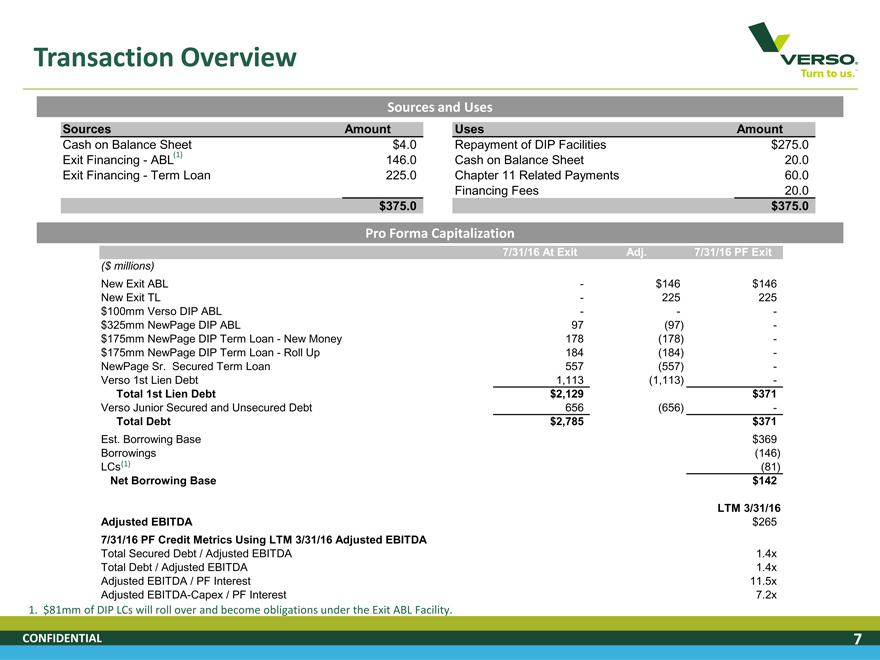
Transaction Overview
Sources and Uses
Sources Amount Uses Amount
Cash on Balance Sheet $4.0 Repayment of DIP Facilities $275.0
Exit Financing—ABL(1) 146.0 Cash on Balance Sheet 20.0
Exit Financing—Term Loan 225.0 Chapter 11 Related Payments 60.0
Financing Fees 20.0
$375.0 $375.0
Pro Forma Capitalization
7/31/16 At Exit Adj. 7/31/16 PF Exit
($ millions)
New Exit ABL—$146 $146
New Exit TL—225 225
$100mm Verso DIP ABL — -
$325mm NewPage DIP ABL 97(97) -
$175mm NewPage DIP Term Loan—New Money 178(178) -
$175mm NewPage DIP Term Loan—Roll Up 184(184) -
NewPage Sr. Secured Term Loan 557(557) -
Verso 1st Lien Debt 1,113(1,113) -
Total 1st Lien Debt $ 2,129 $371
Verso Junior Secured and Unsecured Debt 656(656) -
Total Debt $ 2,785 $371
Est. Borrowing Base $369
Borrowings(146)
LCs(1)(81)
Net Borrowing Base $142
LTM 3/31/16
Adjusted EBITDA $265
7/31/16 PF Credit Metrics Using LTM 3/31/16 Adjusted EBITDA
Total Secured Debt / Adjusted EBITDA 1.4x
Total Debt / Adjusted EBITDA 1.4x
Adjusted EBITDA / PF Interest 11.5x
Adjusted EBITDA-Capex / PF Interest 7.2x
1. $81mm of DIP LCs will roll over and become obligations under the Exit ABL Facility.
CONFIDENTIAL 7
|
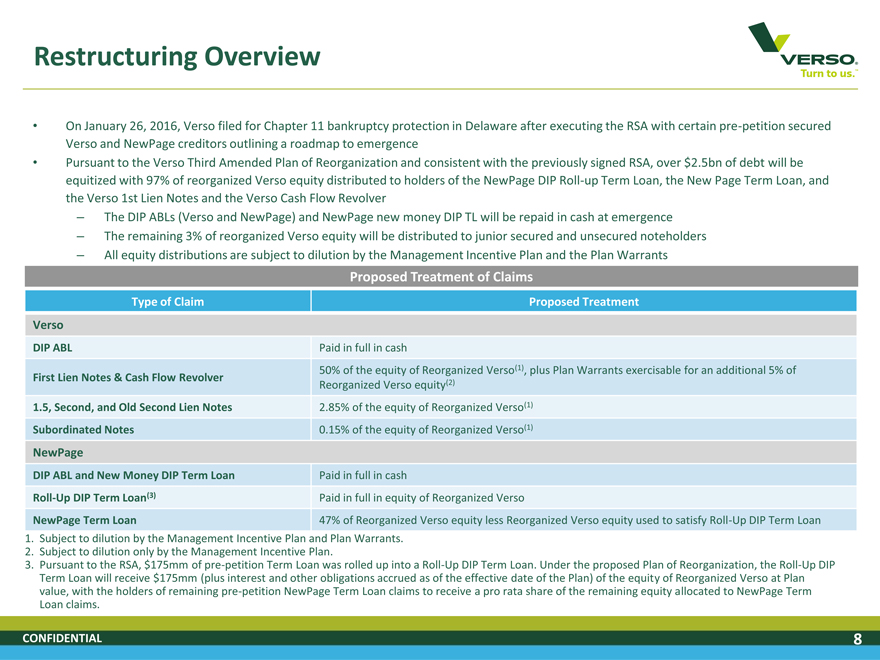
Restructuring Overview
On January 26, 2016, Verso filed for Chapter 11 bankruptcy protection in Delaware after executing the RSA with certain pre-petition secured Verso and NewPage creditors outlining a roadmap to emergence
Pursuant to the Verso Third Amended Plan of Reorganization and consistent with the previously signed RSA, over $2.5bn of debt will be equitized with 97% of reorganized Verso equity distributed to holders of the NewPage DIP Roll-up Term Loan, the New Page Term Loan, and the Verso 1st Lien Notes and the Verso Cash Flow Revolver
– The DIP ABLs (Verso and NewPage) and NewPage new money DIP TL will be repaid in cash at emergence
– The remaining 3% of reorganized Verso equity will be distributed to junior secured and unsecured noteholders
– All equity distributions are subject to dilution by the Management Incentive Plan and the Plan Warrants
Proposed Treatment of Claims
Type of Claim Proposed Treatment
Verso
DIP ABL Paid in full in cash
50% of the equity of Reorganized Verso(1), plus Plan Warrants exercisable for an additional 5% of
First Lien Notes & Cash Flow Revolver
Reorganized Verso equity(2)
1.5, Second, and Old Second Lien Notes 2.85% of the equity of Reorganized Verso(1)
Subordinated Notes 0.15% of the equity of Reorganized Verso(1)
NewPage
DIP ABL and New Money DIP Term Loan Paid in full in cash
Roll-Up DIP Term Loan(3) Paid in full in equity of Reorganized Verso
NewPage Term Loan 47% of Reorganized Verso equity less Reorganized Verso equity used to satisfy Roll-Up DIP Term Loan
1. Subject to dilution by the Management Incentive Plan and Plan Warrants.
2. Subject to dilution only by the Management Incentive Plan.
3. Pursuant to the RSA, $175mm of pre-petition Term Loan was rolled up into a Roll-Up DIP Term Loan. Under the proposed Plan of Reorganization, the Roll-Up DIP Term Loan will receive $175mm (plus interest and other obligations accrued as of the effective date of the Plan) of the equity of Reorganized Verso at Plan value, with the holders of remaining pre-petition NewPage Term Loan claims to receive a pro rata share of the remaining equity allocated to NewPage Term Loan claims.
CONFIDENTIAL 8
|
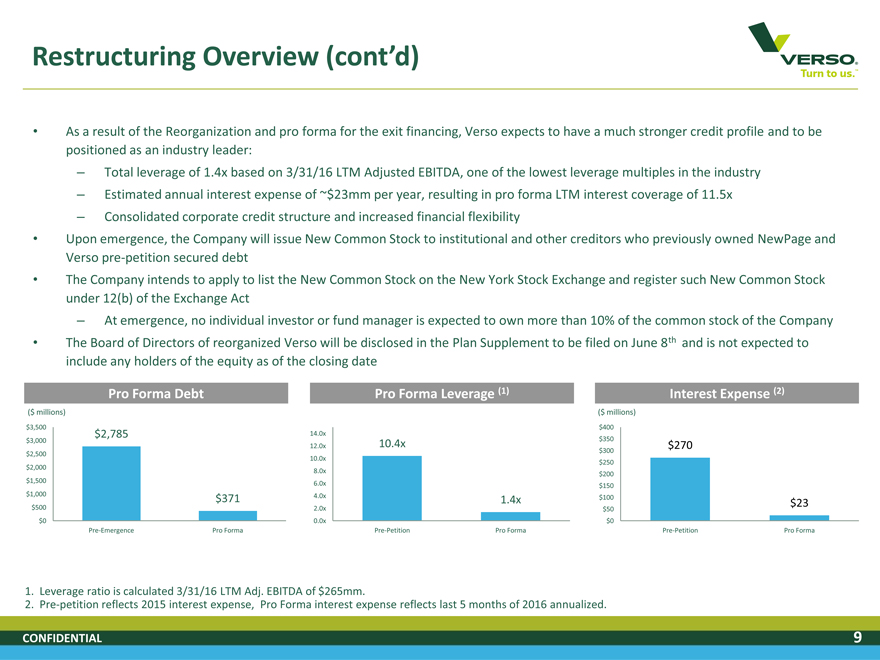
Restructuring Overview (cont’d)
As a result of the Reorganization and pro forma for the exit financing, Verso expects to have a much stronger credit profile and to be positioned as an industry leader:
– Total leverage of 1.4x based on 3/31/16 LTM Adjusted EBITDA, one of the lowest leverage multiples in the industry
– Estimated annual interest expense of ~$23mm per year, resulting in pro forma LTM interest coverage of 11.5x
– Consolidated corporate credit structure and increased financial flexibility
Upon emergence, the Company will issue New Common Stock to institutional and other creditors who previously owned NewPage and Verso pre-petition secured debt
The Company intends to apply to list the New Common Stock on the New York Stock Exchange and register such New Common Stock under 12(b) of the Exchange Act
– At emergence, no individual investor or fund manager is expected to own more than 10% of the common stock of the Company
The Board of Directors of reorganized Verso will be disclosed in the Plan Supplement to be filed on June 8th and is not expected to include any holders of the equity as of the closing date
Pro Forma Debt Pro Forma Leverage (1) Interest Expense (2)
($ millions)($ millions)
$3,500 $400
$2,785 14.0x
$3,000 12.0x 10.4x $350 $270
$2,500 $300
10.0x $250
$2,000
8.0x $200
$1,500
6.0x $150
$1,000
$371 4.0x 1.4x $100 $23
$500 2.0x $50
$0 0.0x $0
Pre-Emergence Pro Forma Pre-Petition Pro Forma Pre-Petition Pro Forma
1. Leverage ratio is calculated 3/31/16 LTM Adj. EBITDA of $265mm.
2. Pre-petition reflects 2015 interest expense, Pro Forma interest expense reflects last 5 months of 2016 annualized.
CONFIDENTIAL 9
|
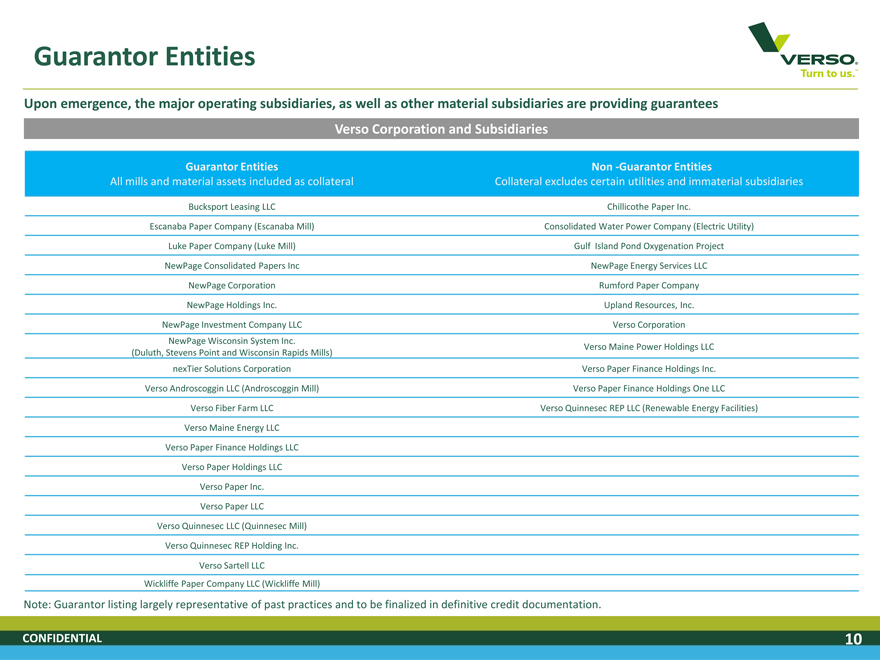
Guarantor Entities
Upon emergence, the major operating subsidiaries, as well as other material subsidiaries are providing guarantees
Verso Corporation and Subsidiaries
Guarantor Entities Non -Guarantor Entities
All mills and material assets included as collateral Collateral excludes certain utilities and immaterial subsidiaries
Bucksport Leasing LLC Chillicothe Paper Inc.
Escanaba Paper Company (Escanaba Mill) Consolidated Water Power Company (Electric Utility)
Luke Paper Company (Luke Mill) Gulf Island Pond Oxygenation Project
NewPage Consolidated Papers Inc NewPage Energy Services LLC
NewPage Corporation Rumford Paper Company
NewPage Holdings Inc. Upland Resources, Inc.
NewPage Investment Company LLC Verso Corporation
NewPage Wisconsin System Inc.
Verso Maine Power Holdings LLC
(Duluth, Stevens Point and Wisconsin Rapids Mills)
nexTier Solutions Corporation Verso Paper Finance Holdings Inc.
Verso Androscoggin LLC (Androscoggin Mill) Verso Paper Finance Holdings One LLC
Verso Fiber Farm LLC Verso Quinnesec REP LLC (Renewable Energy Facilities)
Verso Maine Energy LLC
Verso Paper Finance Holdings LLC
Verso Paper Holdings LLC
Verso Paper Inc.
Verso Paper LLC
Verso Quinnesec LLC (Quinnesec Mill)
Verso Quinnesec REP Holding Inc.
Verso Sartell LLC
Wickliffe Paper Company LLC (Wickliffe Mill)
Note: Guarantor listing largely representative of past practices and to be finalized in definitive credit documentation.
CONFIDENTIAL 10
|
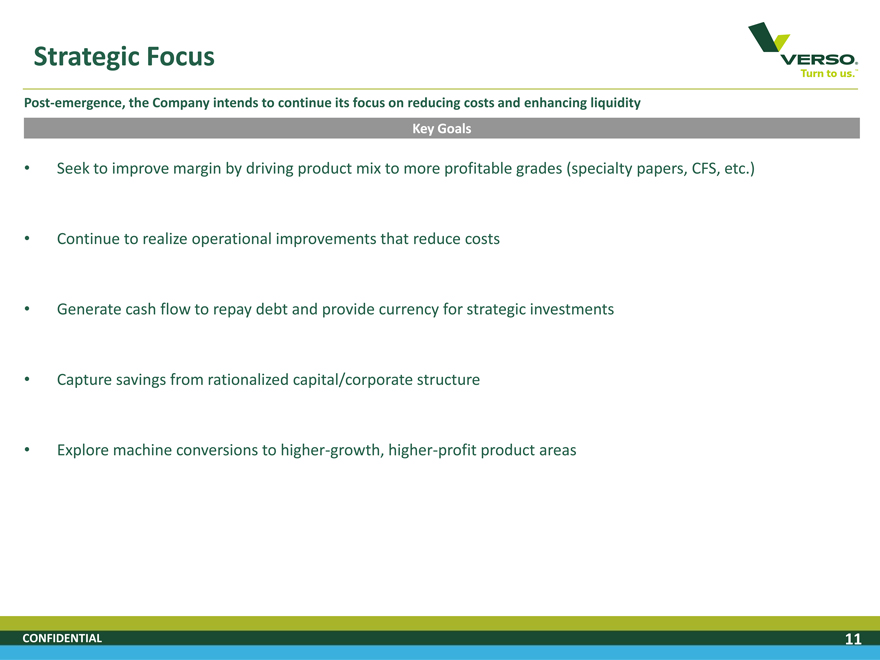
Strategic Focus
Post-emergence, the Company intends to continue its focus on reducing costs and enhancing liquidity
Key Goals
Seek to improve margin by driving product mix to more profitable grades (specialty papers, CFS, etc.)
Continue to realize operational improvements that reduce costs
Generate cash flow to repay debt and provide currency for strategic investments
Capture savings from rationalized capital/corporate structure
Explore machine conversions to higher-growth, higher-profit product areas
CONFIDENTIAL 11
|
Company Overview and Credit Highlights
CONFIDENTIAL
|
Key Credit Highlights
Leading Producer with Significant Share of Manufacturing Capacity
Broad Product Offering
Profitable Low Cost Mill Portfolio
Exposure to Growing Specialty Paper Grades
Substantial Cost Savings Achieved
Significant Collateral Coverage
CONFIDENTIAL 13
|
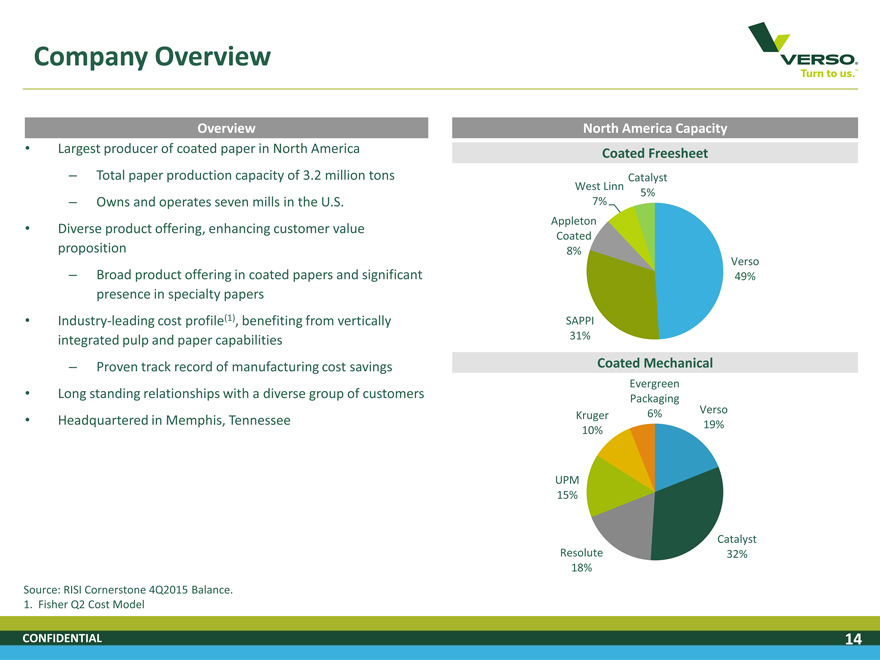
Company Overview
Overview North America Capacity
Largest producer of coated paper in North America Coated Freesheet
– Total paper production capacity of 3.2 million tons Catalyst
West Linn 5%
– Owns and operates seven mills in the U.S. 7%
Diverse product offering, enhancing customer value Appleton
Coated
proposition 8%
Verso
– Broad product offering in coated papers and significant 49%
presence in specialty papers
Industry-leading cost profile(1), benefiting from vertically SAPPI
integrated pulp and paper capabilities 31%
– Proven track record of manufacturing cost savings Coated Mechanical
Evergreen
Long standing relationships with a diverse group of customers Packaging
Verso
Headquartered in Memphis, Tennessee Kruger 6% 19%
10%
UPM
15%
Catalyst
Resolute 32%
18%
Source: RISI Cornerstone 4Q2015 Balance.
1. Fisher Q2 Cost Model
CONFIDENTIAL 14
|
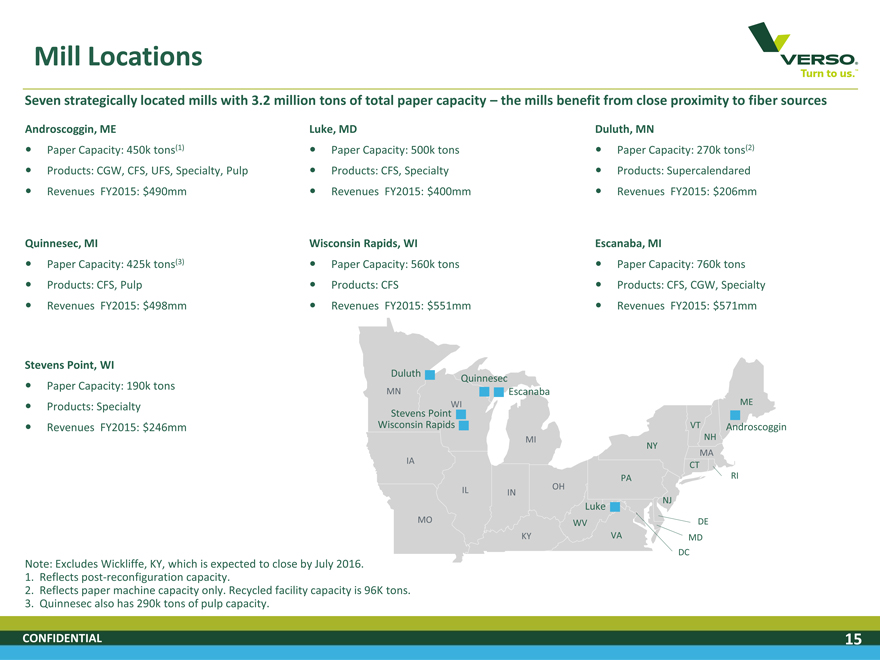
Mill Locations
Seven strategically located mills with 3.2 million tons of total paper capacity – the mills benefit from close proximity to fiber sources
Androscoggin, ME Luke, MD Duluth, MN
Paper Capacity: 450k tons(1) ?Paper Capacity: 500k tons Paper Capacity: 270k tons(2)
Products: CGW, CFS, UFS, Specialty, Pulp ?Products: CFS, Specialty Products: Supercalendared
Revenues FY2015: $490mm ?Revenues FY2015: $400mm Revenues FY2015: $206mm
Quinnesec, MI Wisconsin Rapids, WI Escanaba, MI
Paper Capacity: 425k tons(3) ?Paper Capacity: 560k tons Paper Capacity: 760k tons
Products: CFS, Pulp ?Products: CFS Products: CFS, CGW, Specialty
Revenues FY2015: $498mm ?Revenues FY2015: $551mm Revenues FY2015: $571mm
Stevens Point, WI
Duluth Quinnesec
Paper Capacity: 190k tons MN Escanaba
Products: Specialty WI ME
Stevens Point
Revenues FY2015: $246mm Wisconsin Rapids VT Androscoggin
MI NH
NY
MA
IA CT
PA RI
IL IN OH
NJ
Luke
MO WV DE
KY VA MD
DC
Note: Excludes Wickliffe, KY, which is expected to close by July 2016.
1. Reflects post-reconfiguration capacity.
2. Reflects paper machine capacity only. Recycled facility capacity is 96K tons.
3. Quinnesec also has 290k tons of pulp capacity.
CONFIDENTIAL 15
|
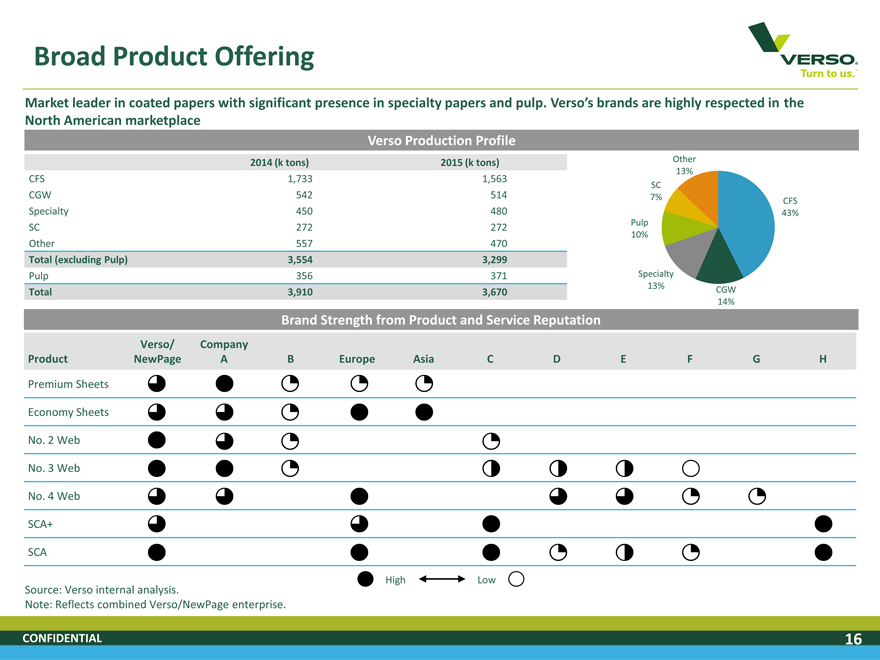
Broad Product Offering
Market leader in coated papers with significant presence in specialty papers and pulp. Verso’s brands are highly respected in the
North American marketplace
Verso Production Profile
2014 (k tons) 2015 (k tons) Other
13%
CFS 1,733 1,563
SC
CGW 542 514 7% CFS
Specialty 450 480 43%
SC 272 272 Pulp
10%
Other 557 470
Total (excluding Pulp) 3,554 3,299
Pulp 356 371 Specialty
13%
Total 3,910 3,670 CGW
14%
Brand Strength from Product and Service Reputation
Verso/ Company
Product NewPage A B Europe Asia C D E F G H
Premium Sheets
Economy Sheets
No. 2 Web
No. 3 Web
No. 4 Web
SCA+
SCA
High Low
Source: Verso internal analysis.
Note: Reflects combined Verso/NewPage enterprise.
CONFIDENTIAL 16
|
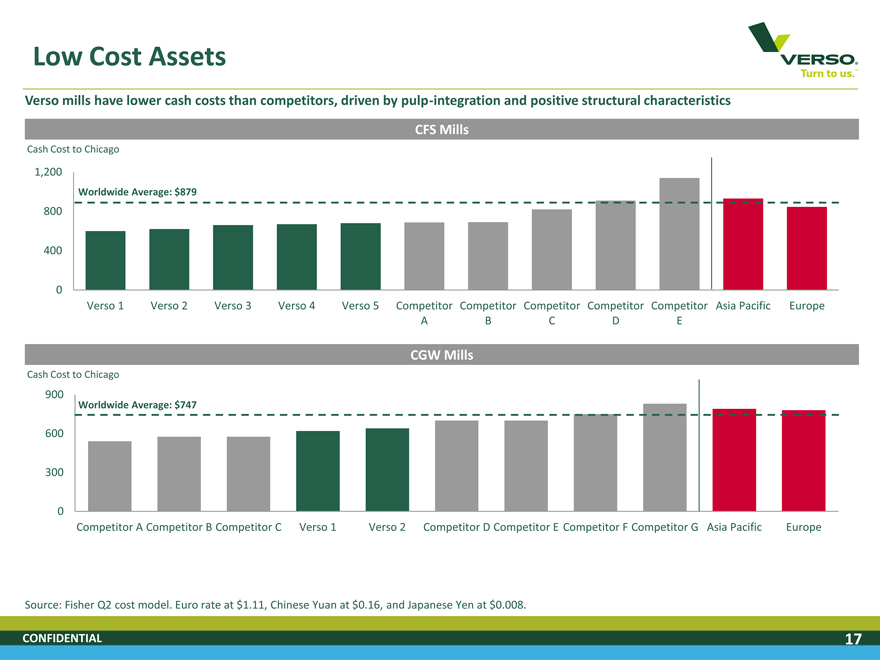
Low Cost Assets
Verso mills have lower cash costs than competitors, driven by pulp-integration and positive structural characteristics
CFS Mills
Cash Cost to Chicago
1,200
Worldwide Average: $879
800
400
0
Verso 1 Verso 2 Verso 3 Verso 4 Verso 5 Competitor Competitor Competitor Competitor Competitor Asia Pacific Europe A B C D E
CGW Mills
Cash Cost to Chicago
900
Worldwide Average: $747
600
300
0
Competitor A Competitor B Competitor C Verso 1 Verso 2 Competitor D Competitor E Competitor F Competitor G Asia Pacific Europe
Source: Fisher Q2 cost model. Euro rate at $1.11, Chinese Yuan at $0.16, and Japanese Yen at $0.008.
CONFIDENTIAL 17
|
Exposure to Growing Specialty Paper Grades
Specialty Paper Market Overview
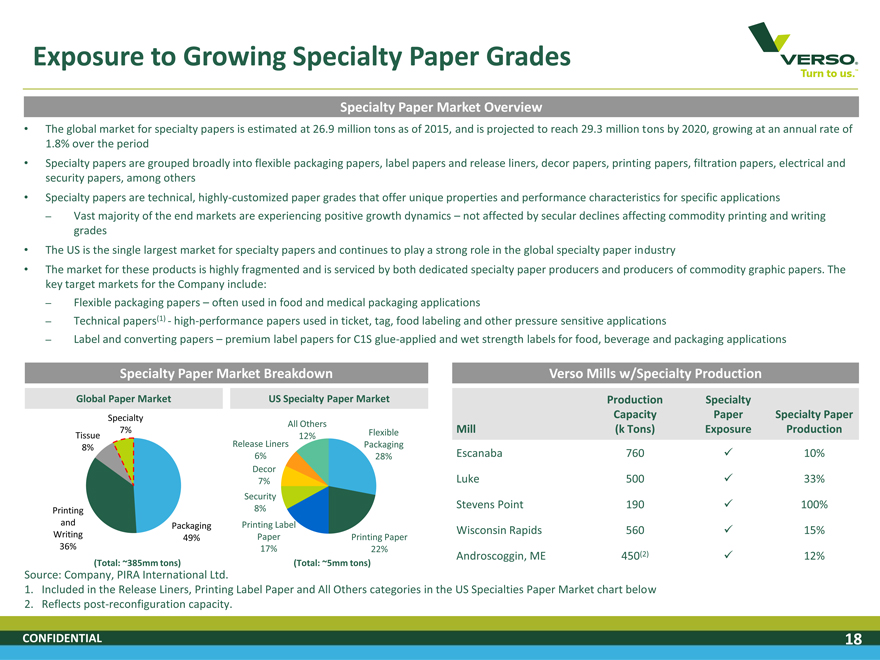
The global market for specialty papers is estimated at 26.9 million tons as of 2015, and is projected to reach 29.3 million tons by 2020, growing at an annual rate of
1.8% over the period
Specialty papers are grouped broadly into flexible packaging papers, label papers and release liners, decor papers, printing papers, filtration papers, electrical and
security papers, among others
Specialty papers are technical, highly-customized paper grades that offer unique properties and performance characteristics for specific applications
– Vast majority of the end markets are experiencing positive growth dynamics – not affected by secular declines affecting commodity printing and writing
grades
The US is the single largest market for specialty papers and continues to play a strong role in the global specialty paper industry
The market for these products is highly fragmented and is serviced by both dedicated specialty paper producers and producers of commodity graphic papers. The
key target markets for the Company include:
– Flexible packaging papers – often used in food and medical packaging applications
– Technical papers(1)—high-performance papers used in ticket, tag, food labeling and other pressure sensitive applications
– Label and converting papers – premium label papers for C1S glue-applied and wet strength labels for food, beverage and packaging applications
Specialty Paper Market Breakdown Verso Mills w/Specialty Production
Global Paper Market US Specialty Paper Market Production Specialty
Specialty Capacity Paper Specialty Paper
All Others
Tissue 7% 12% Flexible Mill(k Tons) Exposure Production
8% Release Liners Packaging
6% 28% Escanaba 760 ? 10%
Decor
7% Luke 500 ? 33%
Security
Printing 8% Stevens Point 190 ? 100%
and Packaging Printing Label Wisconsin Rapids 560 ? 15%
Writing 49% Paper Printing Paper
36% 17% 22% Androscoggin, ME 450(2) ? 12%
(Total: ~385mm tons)(Total: ~5mm tons)
Source: Company, PIRA International Ltd.
1. Included in the Release Liners, Printing Label Paper and All Others categories in the US Specialties Paper Market chart below
2. Reflects post-reconfiguration capacity.
CONFIDENTIAL 18
|
Substantial Cost Savings Achieved
Synergies Achieved to Date
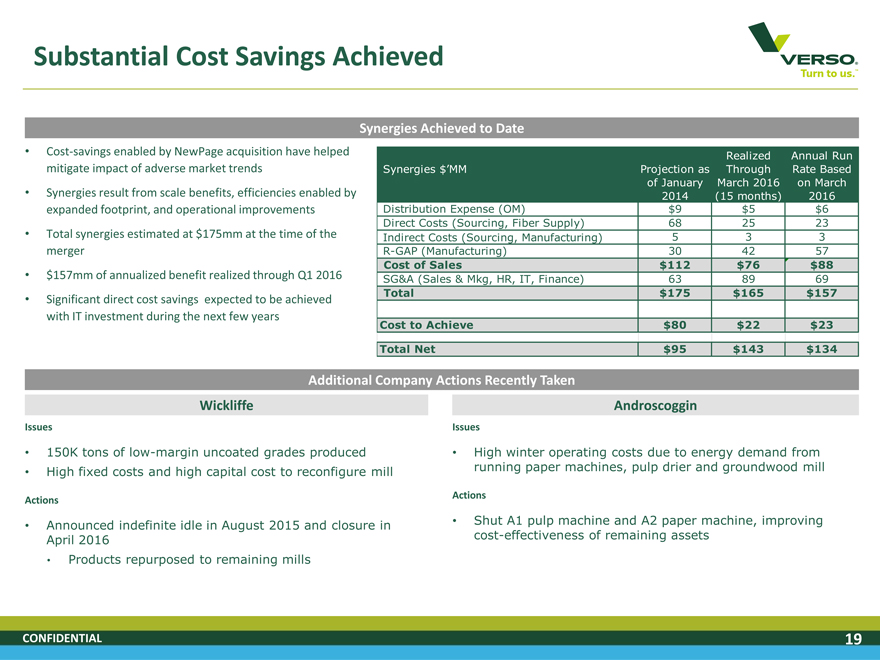
Cost-savings enabled by NewPage acquisition have helped Realized Annual Run
mitigate impact of adverse market trends Synergies $’MM Projection as Through Rate Based
of January March 2016 on March
Synergies result from scale benefits, efficiencies enabled by 2014(15 months) 2016
expanded footprint, and operational improvements Distribution Expense (OM) $9 $5 $6
Direct Costs (Sourcing, Fiber Supply) 68 25 23
Total synergies estimated at $175mm at the time of the Indirect Costs (Sourcing, Manufacturing) 5 3 3
merger R-GAP (Manufacturing) 30 42 57
Cost of Sales $112 $76 $88
$157mm of annualized benefit realized through Q1 2016 SG&A (Sales & Mkg, HR, IT, Finance) 63 89 69
Significant direct cost savings expected to be achieved Total $175 $165 $157
with IT investment during the next few years
Cost to Achieve $80 $22 $23
Total Net $95 $143 $134
Additional Company Actions Recently Taken
Wickliffe Androscoggin
Issues Issues
150K tons of low-margin uncoated grades produced • High winter operating costs due to energy demand from
High fixed costs and high capital cost to reconfigure mill running paper machines, pulp drier and groundwood mill
Actions Actions
Announced indefinite idle in August 2015 and closure in • Shut A1 pulp machine and A2 paper machine, improving
April 2016 cost-effectiveness of remaining assets
Products repurposed to remaining mills
CONFIDENTIAL 19
|
Significant Collateral Coverage
Collateral Overview
Collateral Package:
The ABL Facility will benefit from:
– First priority liens on substantially all the accounts receivable and inventory
– Second priority liens on all fixed assets and other assets not part of the ABL collateral package
The Term Loan will benefit from:
– First priority liens on substantially all fixed assets and other assets not part of the ABL collateral package
– Second priority liens on all current assets that are part of the ABL collateral package
Asset Overview: At exit the Company is expected to have the following assets:
ABL priority assets: $244mm of Accounts Receivable and $550mm of Inventory – ABL borrowings will be limited to 85% of
Eligible Receivables and 85% of the NOLV of Eligible Inventory
TL priority assets: 7 paper mills and related equipment with estimated fair value of PP&E of $1.02bn at emergence based on
preliminary fresh start accounting adjustments
PJT Valuation: PJT Partners conducted a valuation analysis included in the Disclosure Statement, reflecting a Total Enterprise Value
range for the Company of between $1.05bn to $1.10bn
The valuation analysis assumes an Effective Date of July 31, 2016 and is based on the 2016–2020 Financial Projections provided
by the Company as well as comparable company/transaction valuations
The mid-point enterprise valuation of $1.07bn implies collateral coverage on total 1st lien debt of:
– 2.9x projected drawn debt ($371mm) at closing
– 2.4x projected drawn debt plus issued LCs ($452mm) at closing
– 1.9x assuming fully drawn exit facilities ($575mm)
CONFIDENTIAL 20
|
Industry Update and Outlook
CONFIDENTIAL
|
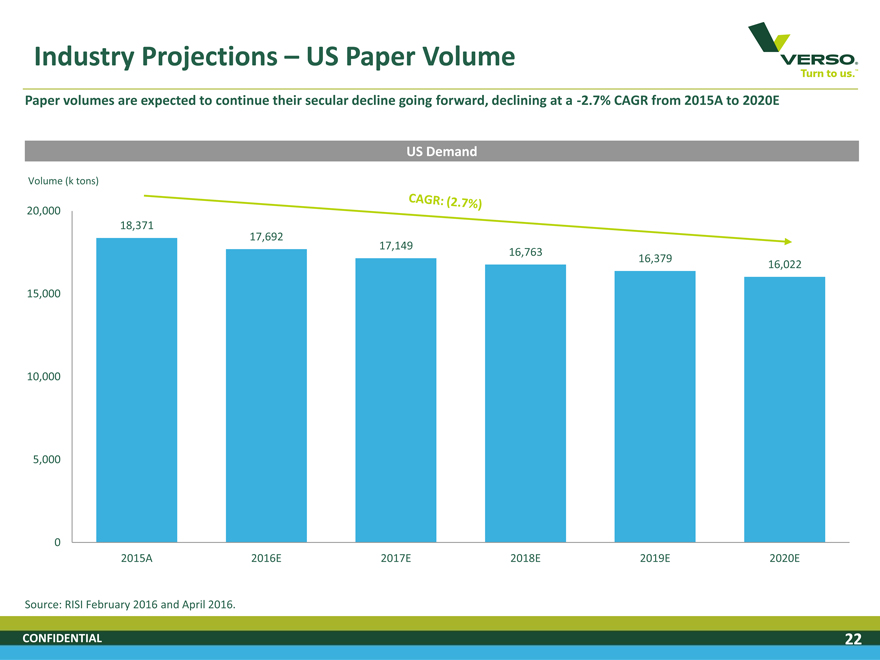
Industry Projections – US Paper Volume
Paper volumes are expected to continue their secular decline going forward, declining at a -2.7% CAGR from 2015A to 2020E
US Demand
Volume (k tons)
20,000
18,371
17,692 17,149
16,763
16,379
16,022
15,000
10,000
5,000
0
2015A 2016E 2017E 2018E 2019E 2020E
Source: RISI February 2016 and April 2016.
CONFIDENTIAL 22
|
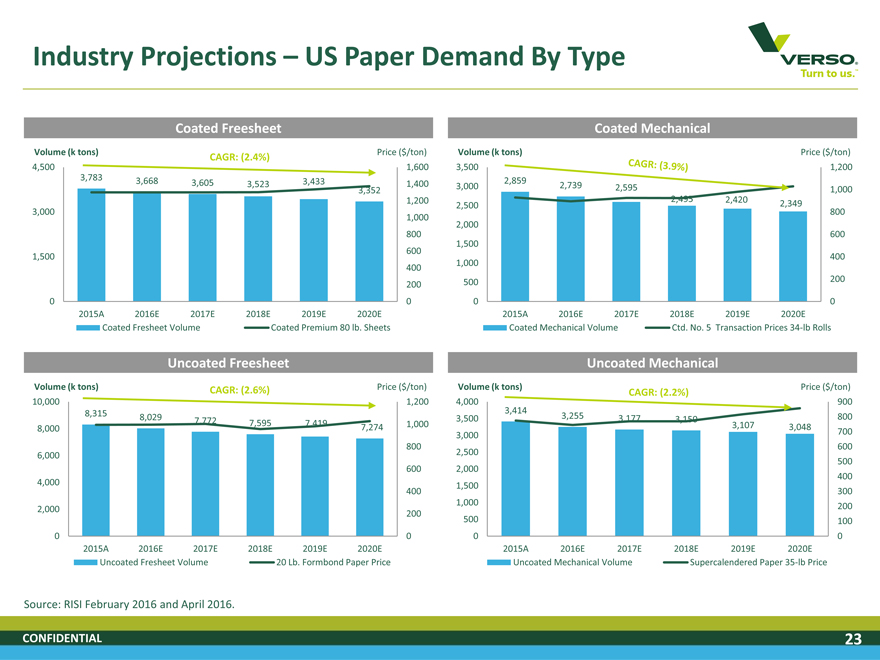
Industry Projections – US Paper Demand By Type
Coated Freesheet Coated Mechanical
Volume (k tons) Price ($/ton) Volume (k tons) Price ($/ton)
CAGR: (2.4%)
4,500 1,600 3,500 1,200 3,783 3,668 2,859 3,605 3,523 3,433 1,400 3,000 2,739 2,595 3,352 1,000 1,200 2,495 2,420 2,500 2,349 3,000 800 1,000 2,000 800 600 600 1,500 1,500 400 1,000 400 500 200 200
0 0 0 0 2015A 2016E 2017E 2018E 2019E 2020E 2015A 2016E 2017E 2018E 2019E 2020E
Coated Fresheet Volume Coated Premium 80 lb. Sheets Coated Mechanical Volume Ctd. No. 5 Transaction Prices 34-lb Rolls
Uncoated Freesheet Uncoated Mechanical
Volume (k tons) CAGR: (2.6%) Price ($/ton) Volume (k tons) Price ($/ton)
CAGR: (2.2%)
10,000 1,200 4,000 900 8,315 3,414 8,029 3,500 3,255 3,177 3,150 800 7,772 7,595 7,419 1,000 8,000 7,274 3,107 3,048 700 3,000 800 600 6,000 2,500 600 2,000 500 400 4,000 1,500 400 300 1,000 2,000 200 200 500 100
0 0 0 0 2015A 2016E 2017E 2018E 2019E 2020E 2015A 2016E 2017E 2018E 2019E 2020E
Uncoated Fresheet Volume 20 Lb. Formbond Paper Price Uncoated Mechanical Volume Supercalendered Paper 35-lb Price
Source: RISI February 2016 and April 2016.
CONFIDENTIAL 23
|
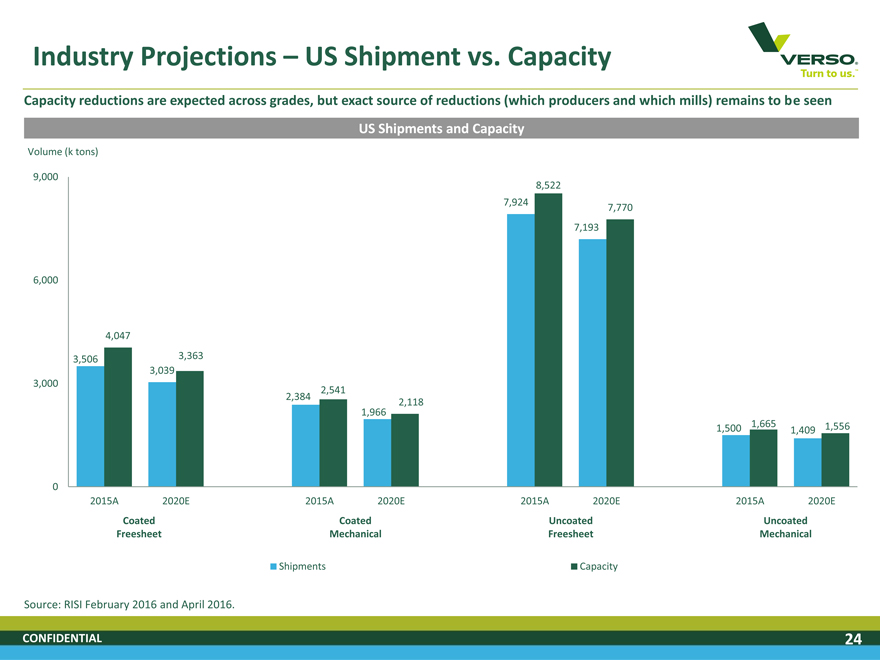
Industry Projections – US Shipment vs. Capacity
Capacity reductions are expected across grades, but exact source of reductions (which producers and which mills) remains to be seen
US Shipments and Capacity
Volume (k tons)
9,000 8,522 7,924
7,770
7,193
6,000
4,047
3,506 3,363 3,039 3,000
2,541 2,384
2,118 1,966
1,665 1,556 1,500 1,409
0
2015A 2020E 2015A 2020E 2015A 2020E 2015A 2020E
Coated Coated Uncoated Uncoated Freesheet Mechanical Freesheet Mechanical
Shipments Capacity
Source: RISI February 2016 and April 2016.
CONFIDENTIAL 24
|
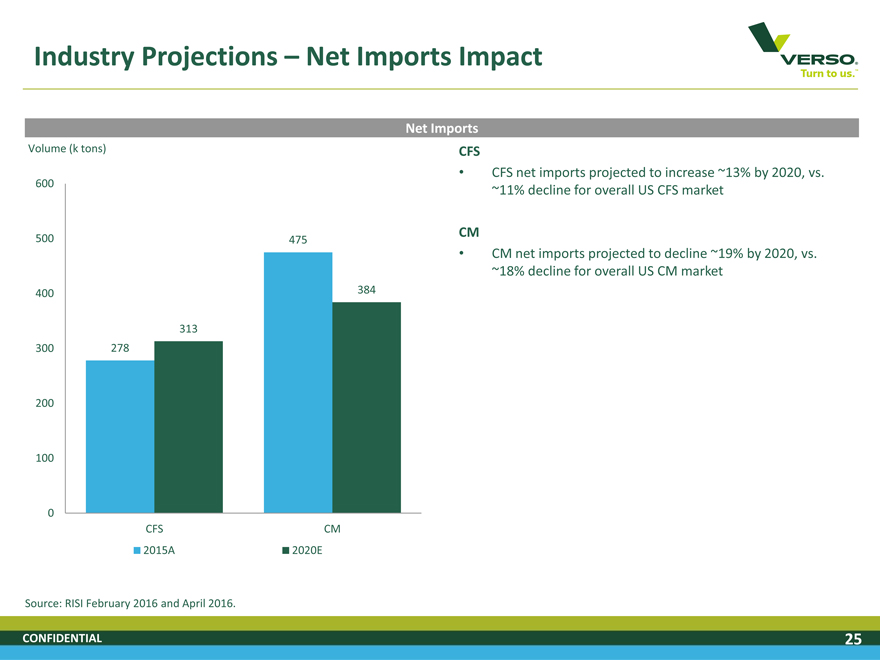
Industry Projections – Net Imports Impact
Net Imports
Volume (k tons) CFS
CFS net imports projected to increase ~13% by 2020, vs.
600
~11% decline for overall US CFS market
CM
500 475
CM net imports projected to decline ~19% by 2020, vs. ~18% decline for overall US CM market
400 384
313 300 278
200
100
0
CFS CM
2015A 2020E
Source: RISI February 2016 and April 2016.
CONFIDENTIAL 25
|
Recent Financial Performance
CONFIDENTIAL
|
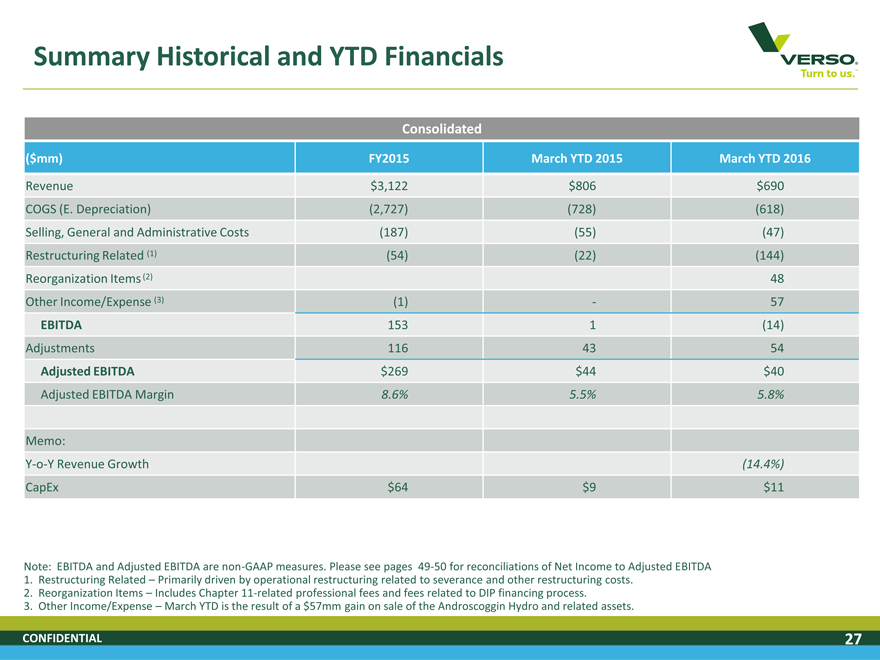
Summary Historical and YTD Financials
Consolidated
($mm) FY2015 March YTD 2015 March YTD 2016
Revenue $3,122 $806 $690 COGS (E. Depreciation) (2,727) (728) (618) Selling, General and Administrative Costs (187) (55) (47) Restructuring Related (1) (54) (22) (144) Reorganization Items (2) 48 Other Income/Expense (3) (1)—57 EBITDA 153 1 (14) Adjustments 116 43 54
Adjusted EBITDA $269 $44 $40
Adjusted EBITDA Margin 8.6% 5.5% 5.8%
Memo:
Y-o-Y Revenue Growth (14.4%)
CapEx $64 $9 $11
Note: EBITDA and Adjusted EBITDA are non-GAAP measures. Please see pages 49-50 for reconciliations of Net Income to Adjusted EBITDA
1. Restructuring Related – Primarily driven by operational restructuring related to severance and other restructuring costs.
2. Reorganization Items – Includes Chapter 11-related professional fees and fees related to DIP financing process.
3. Other Income/Expense – March YTD is the result of a $57mm gain on sale of the Androscoggin Hydro and related assets.
CONFIDENTIAL 27
|
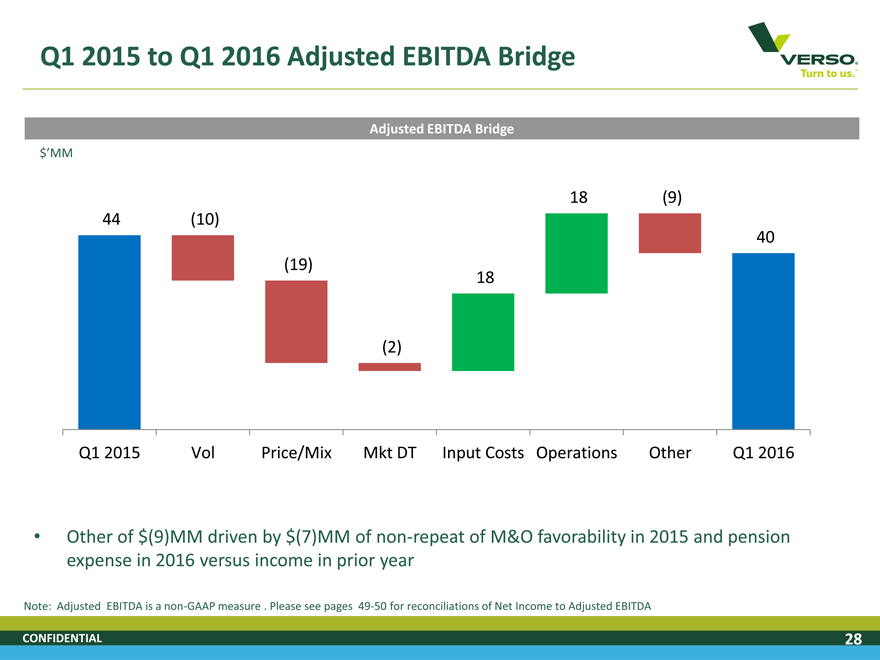
Q1 2015 to Q1 2016 Adjusted EBITDA Bridge
Adjusted EBITDA Bridge $’MM
18 (9)
44 (10)
40 (19) 18
(2)
Q1 2015 Vol Price/Mix Mkt DT Input Costs Operations Other Q1 2016
Other of $(9)MM driven by $(7)MM of non-repeat of M&O favorability in 2015 and pension expense in 2016 versus income in prior year
Note: Adjusted EBITDA is a non-GAAP measure . Please see pages 49-50 for reconciliations of Net Income to Adjusted EBITDA
CONFIDENTIAL 28
|
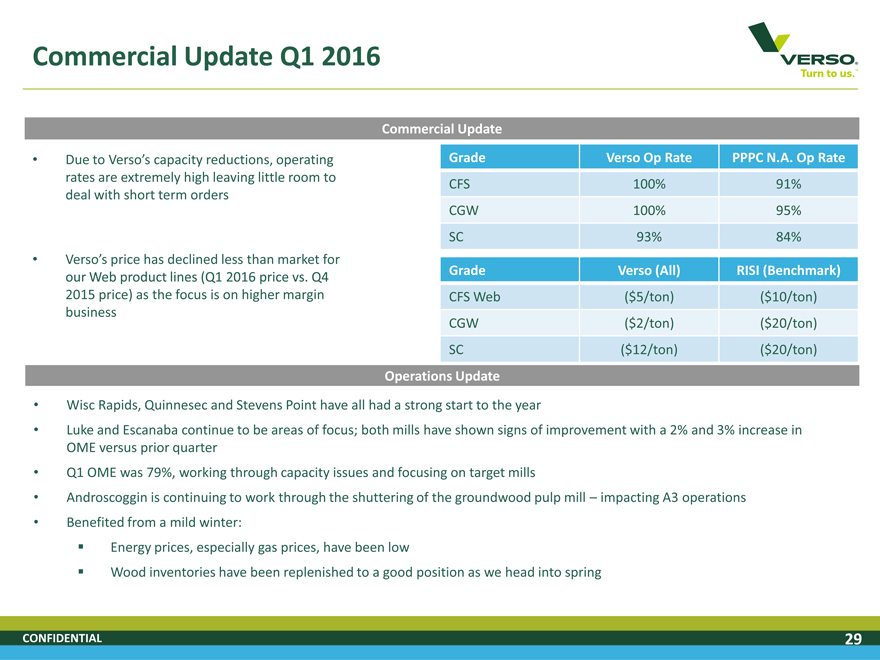
Commercial Update Q1 2016
Commercial Update
Due to Verso’s capacity reductions, operating Grade Verso Op Rate PPPC N.A. Op Rate rates are extremely high leaving little room to deal with short term orders CFS 100% 91% CGW 100% 95%
SC 93% 84%
Verso’s price has declined less than market for Grade Verso (All) RISI (Benchmark) our Web product lines (Q1 2016 price vs. Q4
2015 price) as the focus is on higher margin CFS Web ($5/ton) ($10/ton) business CGW ($2/ton) ($20/ton) SC ($12/ton) ($20/ton)
Operations Update
Wisc Rapids, Quinnesec and Stevens Point have all had a strong start to the year
Luke and Escanaba continue to be areas of focus; both mills have shown signs of improvement with a 2% and 3% increase in OME versus prior quarter
Q1 OME was 79%, working through capacity issues and focusing on target mills
Androscoggin is continuing to work through the shuttering of the groundwood pulp mill – impacting A3 operations
Benefited from a mild winter:
Energy prices, especially gas prices, have been low
Wood inventories have been replenished to a good position as we head into spring
CONFIDENTIAL 29
|
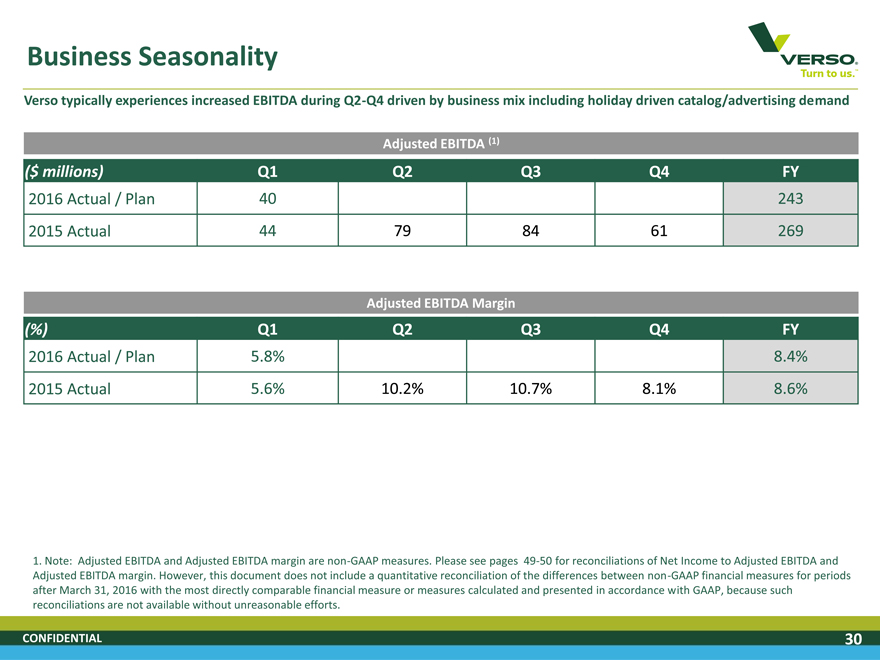
Business Seasonality
Verso typically experiences increased EBITDA during Q2-Q4 driven by business mix including holiday driven catalog/advertising demand
Adjusted EBITDA (1)
($ millions) Q1 Q2 Q3 Q4 FY
2016 Actual / Plan 40 243
2015 Actual 44 79 84 61 269
Adjusted EBITDA Margin
(%) Q1 Q2 Q3 Q4 FY
2016 Actual / Plan 5.8% 8.4%
2015 Actual 5.6% 10.2% 10.7% 8.1% 8.6%
1. Note: Adjusted EBITDA and Adjusted EBITDA margin are non-GAAP measures. Please see pages 49-50 for reconciliations of Net Income to Adjusted EBITDA and Adjusted EBITDA margin. However, this document does not include a quantitative reconciliation of the differences between non-GAAP financial measures for periods after March 31, 2016 with the most directly comparable financial measure or measures calculated and presented in accordance with GAAP, because such reconciliations are not available without unreasonable efforts.
CONFIDENTIAL 30
|
Financial Projections Overview
CONFIDENTIAL
|
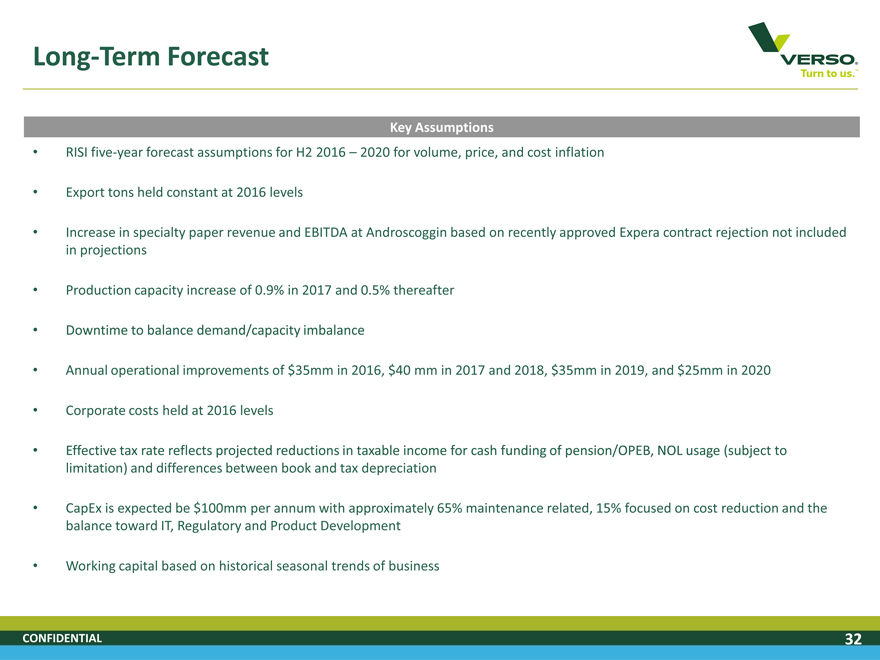
Long-Term Forecast
Key Assumptions
RISI five-year forecast assumptions for H2 2016 – 2020 for volume, price, and cost inflation
Export tons held constant at 2016 levels
Increase in specialty paper revenue and EBITDA at Androscoggin based on recently approved Expera contract rejection not included in projections
Production capacity increase of 0.9% in 2017 and 0.5% thereafter
Downtime to balance demand/capacity imbalance
Annual operational improvements of $35mm in 2016, $40 mm in 2017 and 2018, $35mm in 2019, and $25mm in 2020
Corporate costs held at 2016 levels
Effective tax rate reflects projected reductions in taxable income for cash funding of pension/OPEB, NOL usage (subject to limitation) and differences between book and tax depreciation
CapEx is expected be $100mm per annum with approximately 65% maintenance related, 15% focused on cost reduction and the balance toward IT, Regulatory and Product Development
Working capital based on historical seasonal trends of business
CONFIDENTIAL 32
|
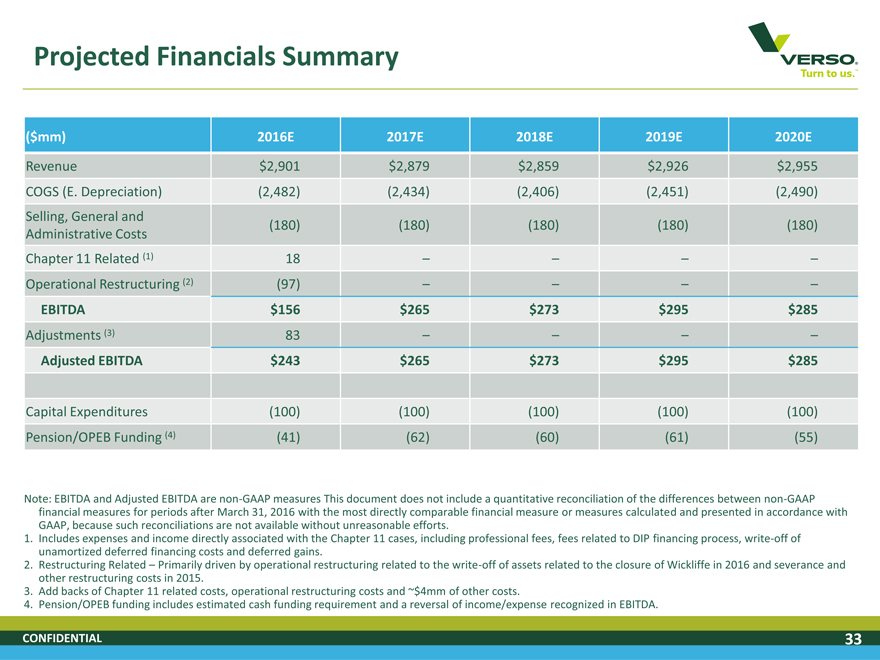
Projected Financials Summary
($mm) 2016E 2017E 2018E 2019E 2020E
Revenue $2,901 $2,879 $2,859 $2,926 $2,955
COGS (E. Depreciation) (2,482) (2,434) (2,406) (2,451) (2,490) Selling, General and (180) (180) (180) (180) (180) Administrative Costs Chapter 11 Related (1) 18 Operational Restructuring (2) (97) EBITDA $156 $265 $273 $295 $285
Adjustments (3) 83
Adjusted EBITDA $243 $265 $273 $295 $285
Capital Expenditures (100) (100) (100) (100) (100)
Pension/OPEB Funding (4) (41) (62) (60) (61) (55)
Note: EBITDA and Adjusted EBITDA are non-GAAP measures This document does not include a quantitative reconciliation of the differences between non-GAAP financial measures for periods after March 31, 2016 with the most directly comparable financial measure or measures calculated and presented in accordance with GAAP, because such reconciliations are not available without unreasonable efforts.
1. Includes expenses and income directly associated with the Chapter 11 cases, including professional fees, fees related to DIP financing process, write-off of unamortized deferred financing costs and deferred gains.
2. Restructuring Related – Primarily driven by operational restructuring related to the write-off of assets related to the closure of Wickliffe in 2016 and severance and other restructuring costs in 2015.
3. Add backs of Chapter 11 related costs, operational restructuring costs and ~$4mm of other costs.
4. Pension/OPEB funding includes estimated cash funding requirement and a reversal of income/expense recognized in EBITDA.
CONFIDENTIAL 33
|
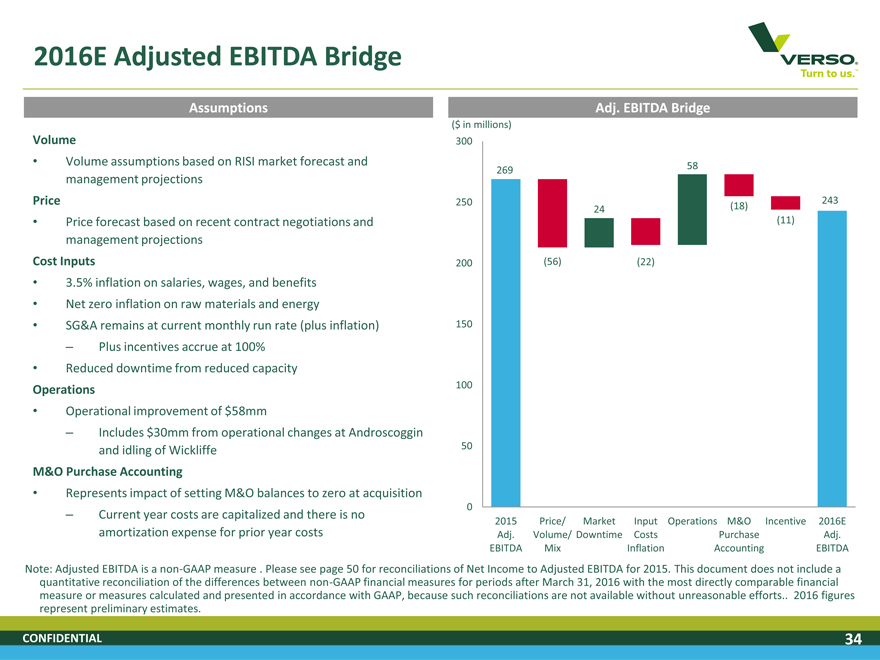
2016E Adjusted EBITDA Bridge
Assumptions Adj. EBITDA Bridge
($ in millions)
Volume 300
Volume assumptions based on RISI market forecast and 269 58 management projections
Price 250 243
24 (18)
Price forecast based on recent contract negotiations and (11) management projections
Cost Inputs 200 (56) (22)
3.5% inflation on salaries, wages, and benefits
Net zero inflation on raw materials and energy
SG&A remains at current monthly run rate (plus inflation) 150
– Plus incentives accrue at 100%
Reduced downtime from reduced capacity
Operations 100
Operational improvement of $58mm
– Includes $30mm from operational changes at Androscoggin and idling of Wickliffe 50
M&O Purchase Accounting
Represents impact of setting M&O balances to zero at acquisition
0
– Current year costs are capitalized and there is no
2015 Price/ Market Input Operations M&O Incentive 2016E
amortization expense for prior year costs Adj. Volume/ Downtime Costs Purchase Adj.
EBITDA Mix Inflation Accounting EBITDA
Note: Adjusted EBITDA is a non-GAAP measure . Please see page 50 for reconciliations of Net Income to Adjusted EBITDA for 2015. This document does not include a quantitative reconciliation of the differences between non-GAAP financial measures for periods after March 31, 2016 with the most directly comparable financial measure or measures calculated and presented in accordance with GAAP, because such reconciliations are not available without unreasonable efforts 2016 figures represent preliminary estimates.
CONFIDENTIAL 34
|
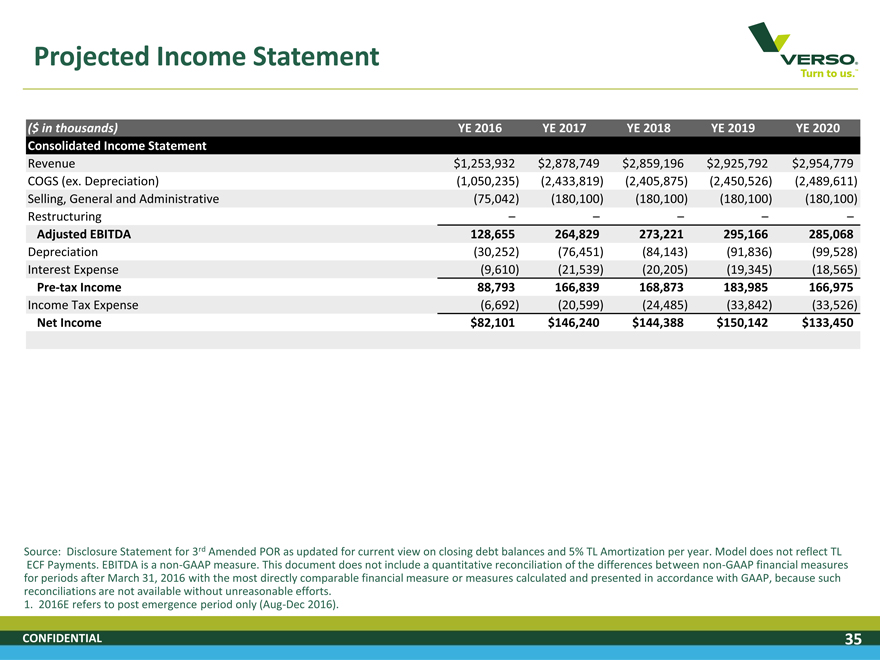
Projected Income Statement
($ in thousands) YE 2016 YE 2017 YE 2018 YE 2019 YE 2020 Consolidated Income Statement
Revenue $1,253,932 $2,878,749 $2,859,196 $2,925,792 $2,954,779 COGS (ex. Depreciation) (1,050,235) (2,433,819) (2,405,875) (2,450,526) (2,489,611) Selling, General and Administrative (75,042) (180,100) (180,100) (180,100) (180,100) Restructuring Adjusted EBITDA 128,655 264,829 273,221 295,166 285,068
Depreciation (30,252) (76,451) (84,143) (91,836) (99,528) Interest Expense (9,610) (21,539) (20,205) (19,345) (18,565)
Pre-tax Income 88,793 166,839 168,873 183,985 166,975
Income Tax Expense (6,692) (20,599) (24,485) (33,842) (33,526)
Net Income $82,101 $146,240 $144,388 $150,142 $133,450
Source: Disclosure Statement for 3rd Amended POR as updated for current view on closing debt balances and 5% TL Amortization per year. Model does not reflect TL ECF Payments. EBITDA is a non-GAAP measure. This document does not include a quantitative reconciliation of the differences between non-GAAP financial measures for periods after March 31, 2016 with the most directly comparable financial measure or measures calculated and presented in accordance with GAAP, because such reconciliations are not available without unreasonable efforts.
1. 2016E refers to post emergence period only (Aug-Dec 2016).
CONFIDENTIAL 35
|
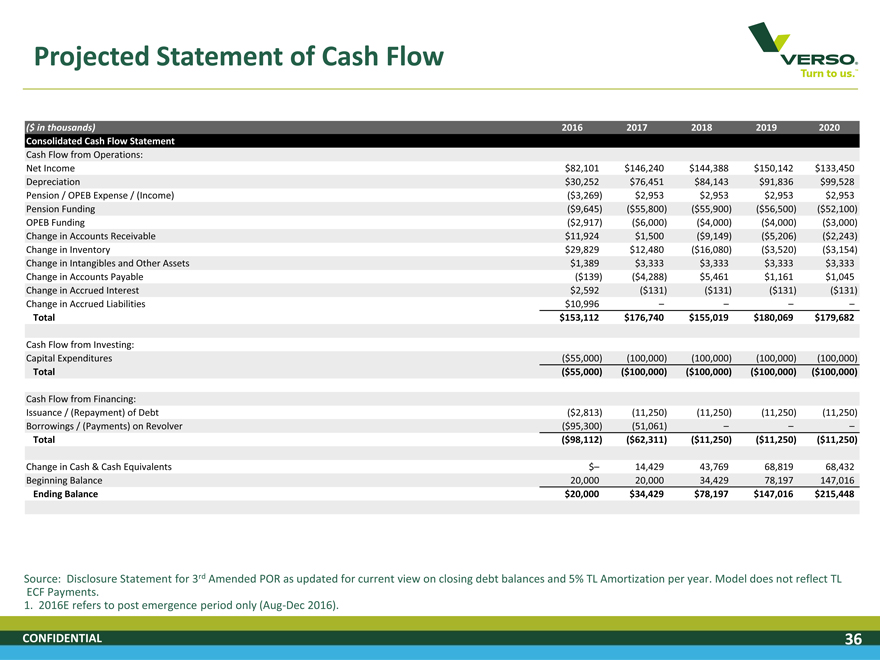
Projected Statement of Cash Flow
($ in thousands) 2016 (1) 2017 2018 2019 2020 Consolidated Cash Flow Statement
Cash Flow from Operations:
Net Income $82,101 $146,240 $144,388 $150,142 $133,450 Depreciation $30,252 $76,451 $84,143 $91,836 $99,528 Pension / OPEB Expense / (Income) ($3,269) $2,953 $2,953 $2,953 $2,953 Pension Funding ($9,645) ($55,800) ($55,900) ($56,500) ($52,100) OPEB Funding ($2,917) ($6,000) ($4,000) ($4,000) ($3,000) Change in Accounts Receivable $11,924 $1,500 ($9,149) ($5,206) ($2,243) Change in Inventory $29,829 $12,480 ($16,080) ($3,520) ($3,154) Change in Intangibles and Other Assets $1,389 $3,333 $3,333 $3,333 $3,333 Change in Accounts Payable ($139) ($4,288) $5,461 $1,161 $1,045 Change in Accrued Interest $2,592 ($131) ($131) ($131) ($131) Change in Accrued Liabilities $10,996 Total $153,112 $176,740 $155,019 $180,069 $179,682
Cash Flow from Investing:
Capital Expenditures ($55,000) (100,000) (100,000) (100,000) (100,000)
Total ($55,000) ($100,000) ($100,000) ($100,000) ($100,000)
Cash Flow from Financing:
Issuance / (Repayment) of Debt ($2,813) (11,250) (11,250) (11,250) (11,250) Borrowings / (Payments) on Revolver ($95,300) (51,061) Total ($98,112) ($62,311) ($11,250) ($11,250) ($11,250)
Change in Cash & Cash Equivalents $– 14,429 43,769 68,819 68,432 Beginning Balance 20,000 20,000 34,429 78,197 147,016
Ending Balance $20,000 $34,429 $78,197 $147,016 $215,448
Source: Disclosure Statement for 3rd Amended POR as updated for current view on closing debt balances and 5% TL Amortization per year. Model does not reflect TL ECF Payments.
1. 2016E refers to post emergence period only (Aug-Dec 2016).
CONFIDENTIAL 36
|
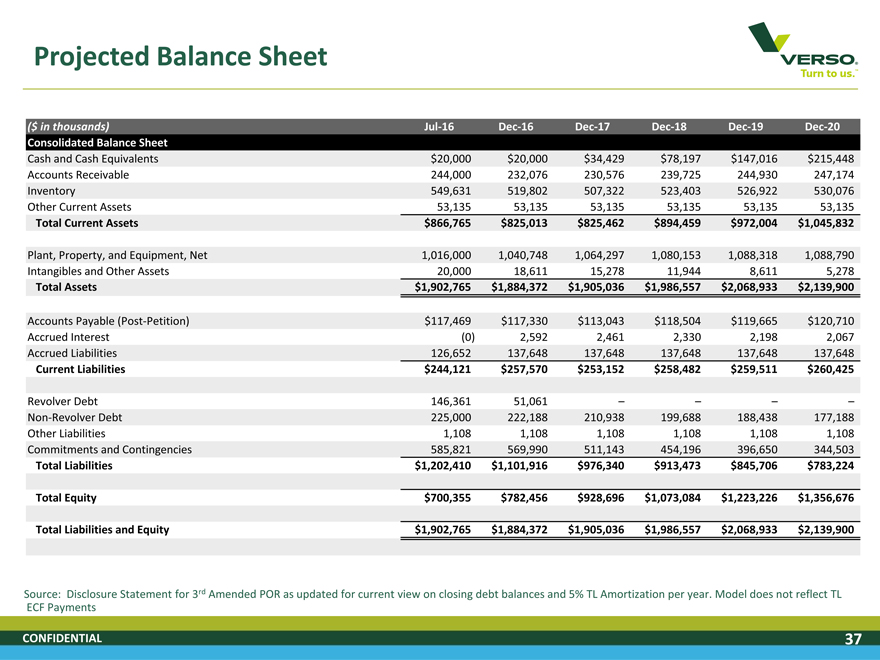
Projected Balance Sheet
($ in thousands) Jul-16 Dec-16 Dec-17 Dec-18 Dec-19 Dec-20 Consolidated Balance Sheet
Cash and Cash Equivalents $20,000 $20,000 $34,429 $78,197 $147,016 $215,448 Accounts Receivable 244,000 232,076 230,576 239,725 244,930 247,174 Inventory 549,631 519,802 507,322 523,403 526,922 530,076 Other Current Assets 53,135 53,135 53,135 53,135 53,135 53,135
Total Current Assets $866,765 $825,013 $825,462 $894,459 $972,004 $1,045,832
Plant, Property, and Equipment, Net 1,016,000 1,040,748 1,064,297 1,080,153 1,088,318 1,088,790 Intangibles and Other Assets 20,000 18,611 15,278 11,944 8,611 5,278
Total Assets $1,902,765 $1,884,372 $1,905,036 $1,986,557 $2,068,933 $2,139,900
Accounts Payable (Post-Petition) $117,469 $117,330 $113,043 $118,504 $119,665 $120,710 Accrued Interest (0) 2,592 2,461 2,330 2,198 2,067 Accrued Liabilities 126,652 137,648 137,648 137,648 137,648 137,648
Current Liabilities $244,121 $257,570 $253,152 $258,482 $259,511 $260,425
Revolver Debt 146,361 51,061–Non-Revolver Debt 225,000 222,188 210,938 199,688 188,438 177,188 Other Liabilities 1,108 1,108 1,108 1,108 1,108 1,108 Commitments and Contingencies 585,821 569,990 511,143 454,196 396,650 344,503
Total Liabilities $1,202,410 $1,101,916 $976,340 $913,473 $845,706 $783,224 Total Equity $700,355 $782,456 $928,696 $1,073,084 $1,223,226 $1,356,676 Total Liabilities and Equity $1,902,765 $1,884,372 $1,905,036 $1,986,557 $2,068,933 $2,139,900
Source: Disclosure Statement for 3rd Amended POR as updated for current view on closing debt balances and 5% TL Amortization per year. Model does not reflect TL ECF Payments
CONFIDENTIAL 37
|
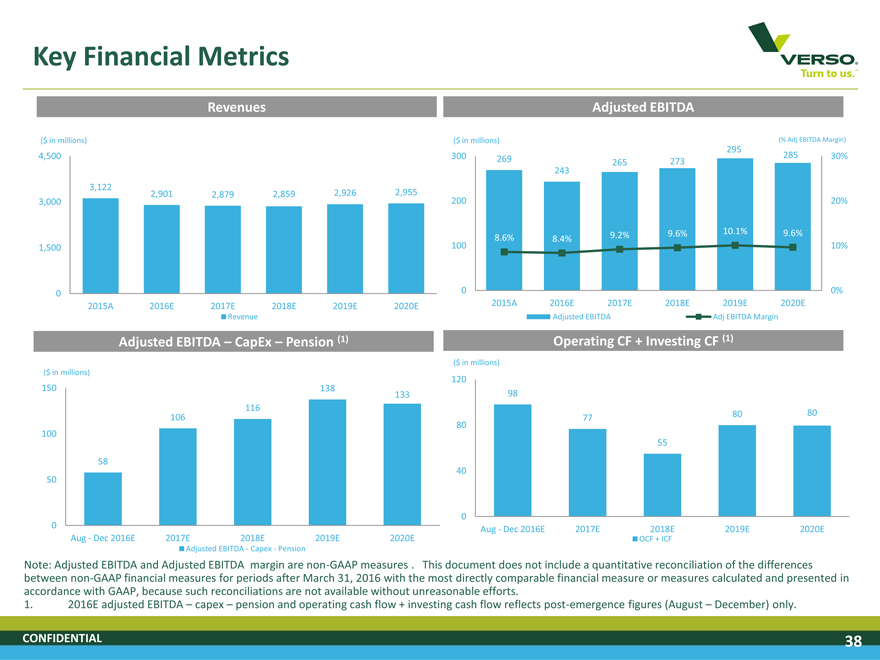
Key Financial Metrics
Revenues Adjusted EBITDA
($ in millions) ($ in millions) (% Adj EBITDA Margin)
295
4,500 300 285 30% 269 265 273 243 3,122 2,901 2,879 2,859 2,926 2,955 3,000 200 20%
9.6% 10.1% 9.6%
8.6% 9.2%
8.4%
1,500 100 10%
0 0 0% 2015A 2016E 2017E 2018E 2019E 2020E 2015A 2016E 2017E 2018E 2019E 2020E
Revenue Adjusted EBITDA Adj EBITDA Margin
Adjusted EBITDA – CapEx – Pension (1) Operating CF + Investing CF (1)
($ in millions) ($ in millions) 120
150 138
133 98 116
80 80 106 80 77 100 55
58
40 50
0 0
Aug—Dec 2016E 2017E 2018E 2019E 2020E Aug—Dec 2016E 2017E 2018E 2019E 2020E OCF + ICF
Adjusted EBITDA—Capex—Pension
Note: Adjusted EBITDA and Adjusted EBITDA margin are non-GAAP measures . This document does not include a quantitative reconciliation of the differences between non-GAAP financial measures for periods after March 31, 2016 with the most directly comparable financial measure or measures calculated and presented in accordance with GAAP, because such reconciliations are not available without unreasonable efforts.
1. 2016E adjusted EBITDA – capex – pension and operating cash flow + investing cash flow reflects post-emergence figures (August – December) only.
CONFIDENTIAL 38
|
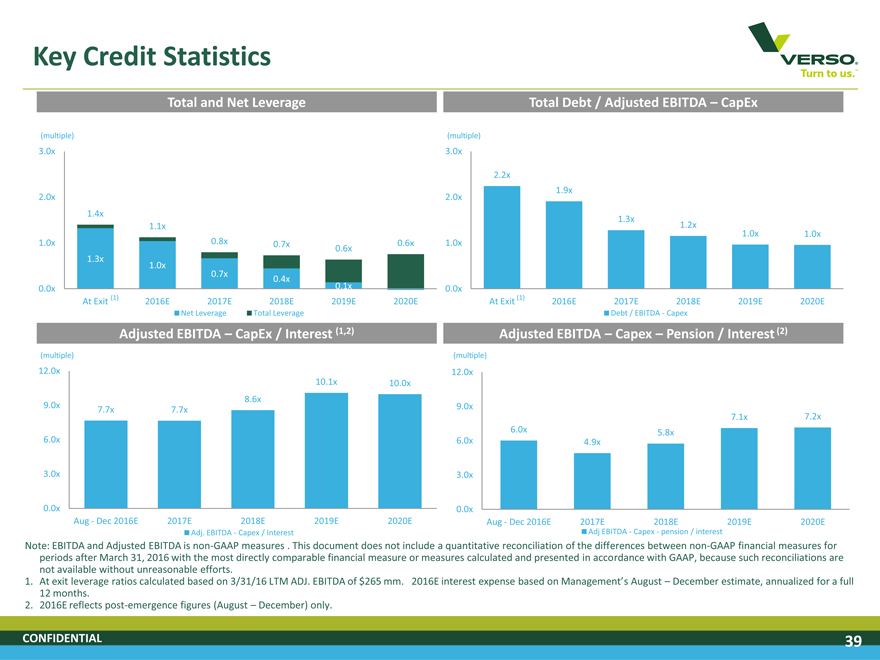
Key Credit Statistics
Total and Net Leverage Total Debt / Adjusted EBITDA – CapEx
(multiple) (multiple)
3.0x 3.0x
10.7x 14. 2.2x 0x
2.0x 2.0x 1.9x
1.4x 1.3x
1.1x 1.2x
0.8x 1.0x 1.0x
1.0x 0.7x 0.6x 1.0x
0.6x
1.3x 1.0x
0.7x 0.4x 0.1x
0.0x 0.0x
At Exit (1) 2016E 2017E 2018E 2019E 2020E At Exit (1) 2016E 2017E 2018E 2019E 2020E
Net Leverage Total Leverage Debt / EBITDA—Capex
Adjusted EBITDA – CapEx / Interest (1,2) Adjusted EBITDA – Capex – Pension / Interest (2)
(multiple) (multiple) 12.0x 12.0x 10.1x 10.0x 8.6x
9.0x 9.0x
7.7x 7.7x 7.1x 7.2x 6.0x 5.8x
6.0x 6.0x 4.9x 3.0x 3.0x
0.0x 0.0x
Aug—Dec 2016E 2017E 2018E 2019E 2020E Aug—Dec 2016E 2017E 2018E 2019E 2020E
Adj. EBITDA—Capex / Interest Adj EBITDA—Capex—pension / interest
Note: EBITDA and Adjusted EBITDA is non-GAAP measures . This document does not include a quantitative reconciliation of the differences between non-GAAP financial measures for periods after March 31, 2016 with the most directly comparable financial measure or measures calculated and presented in accordance with GAAP, because such reconciliations are not available without unreasonable efforts.
1. At exit leverage ratios calculated based on 3/31/16 LTM ADJ. EBITDA of $265 mm. 2016E interest expense based on Management’s August – December estimate, annualized for a full
12 months.
2. 2016E reflects post-emergence figures (August – December) only.
CONFIDENTIAL 39
|
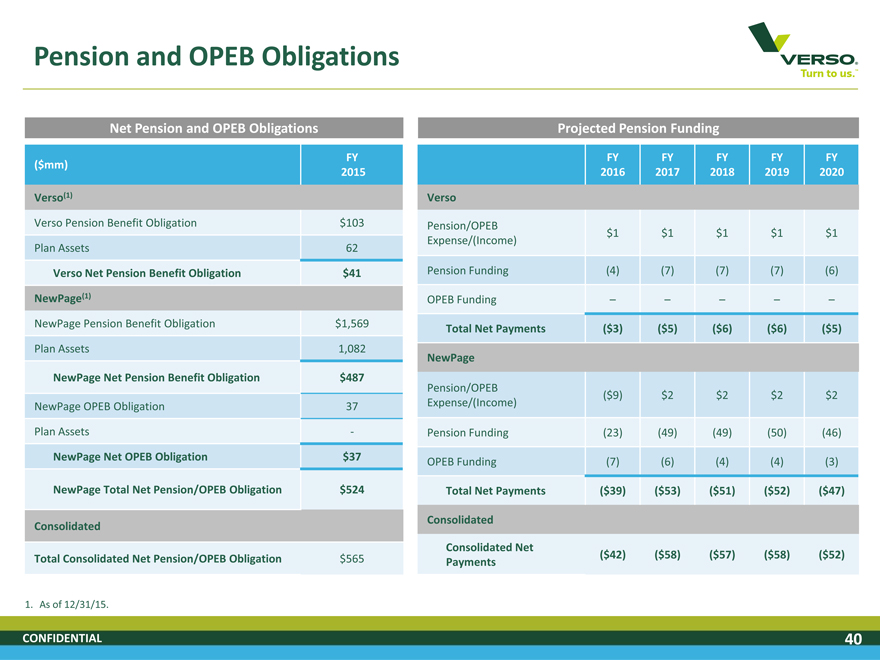
Pension and OPEB Obligations
Net Pension and OPEB Obligations Projected Pension Funding
FY FY FY FY FY FY ($mm) 2015 2016 2017 2018 2019 2020
Verso(1) Verso
Verso Pension Benefit Obligation $103 Pension/OPEB
$1 $1 $1 $1 $1 Expense/(Income) Plan Assets 62
Verso Net Pension Benefit Obligation $41 Pension Funding (4) (7) (7) (7) (6)
NewPage(1) OPEB Funding – – – – –
NewPage Pension Benefit Obligation $1,569
Total Net Payments ($3) ($5) ($6) ($6) ($5)
Plan Assets 1,082
NewPage NewPage Net Pension Benefit Obligation $487
Pension/OPEB
($9) $2 $2 $2 $2 NewPage OPEB Obligation 37 Expense/(Income) Plan Assets—Pension Funding (23) (49) (49) (50) (46)
NewPage Net OPEB Obligation $37
OPEB Funding (7) (6) (4) (4) (3)
NewPage Total Net Pension/OPEB Obligation $524 Total Net Payments ($39) ($53) ($51) ($52) ($47)
Consolidated Consolidated
Consolidated Net
Total Consolidated Net Pension/OPEB Obligation $565 ($42) ($58) ($57) ($58) ($52) Payments
1. As of 12/31/15.
CONFIDENTIAL 40
|
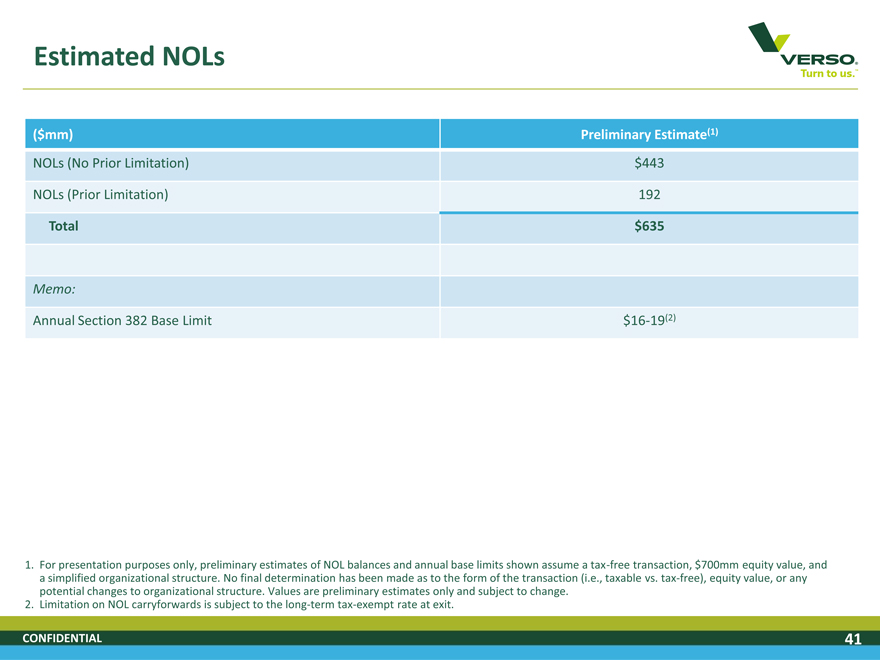
Estimated NOLs
VERSO Turn to us.
($mm) Preliminary Estimate(1)
NOLs (No Prior Limitation) $443
NOLs (Prior Limitation) 192
Total $635
Memo:
Annual Section 382 Base Limit $16-19(2)
1. For presentation purposes only, preliminary estimates of NOL balances and annual base limits shown assume a tax-free transaction, $700mm equity value, and a simplified organizational structure. No final determination has been made as to the form of the transaction (i.e., taxable vs. tax-free), equity value, or any potential changes to organizational structure. Values are preliminary estimates only and subject to change.
2. Limitation on NOL carryforwards is subject to the long-term tax-exempt rate at exit.
CONFIDENTIAL 41
|

VERSO Turn to us.
Transaction Overview
CONFIDENTIAL
|
ABL Revolving Credit Facility – Term Sheet
VERSO Turn to us.
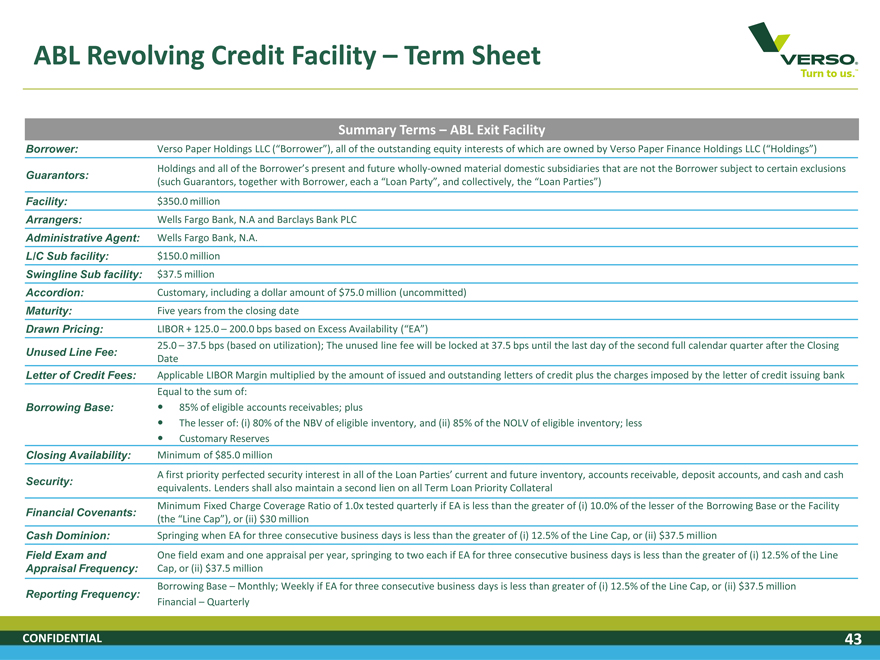
Summary Terms – ABL Exit Facility
Borrower: Verso Paper Holdings LLC (“Borrower”), all of the outstanding equity interests of which are owned by Verso Paper Finance Holdings LLC (“Holdings”)
Guarantors: Holdings and all of the Borrower’s present and future wholly-owned material domestic subsidiaries that are not the Borrower subject to certain exclusions
(such Guarantors, together with Borrower, each a “Loan Party”, and collectively, the “Loan Parties”) Facility: $350.0 million
Arrangers: Wells Fargo Bank, N.A and Barclays Bank PLC
Administrative Agent: Wells Fargo Bank, N.A.
L/C Sub facility: $150.0 million
Swingline Sub facility: $37.5 million
Accordion: Customary, including a dollar amount of $75.0 million (uncommitted)
Maturity: Five years from the closing date
Drawn Pricing: LIBOR + 125.0 – 200.0 bps based on Excess Availability (“EA”)
Unused Line Fee: 25.0 – 37.5 bps (based on utilization); The unused line fee will be locked at 37.5 bps until the last day of the second full calendar quarter after the Closing Date
Letter of Credit Fees: Applicable LIBOR Margin multiplied by the amount of issued and outstanding letters of credit plus the charges imposed by the letter of credit issuing bank
Equal to the sum of: Borrowing Base: 85% of eligible accounts receivables; plus
The lesser of: (i) 80% of the NBV of eligible inventory, and (ii) 85% of the NOLV of eligible inventory; less
Customary Reserves
Closing Availability: Minimum of $85.0 million
Security: A first priority perfected security interest in all of the Loan Parties’ current and future inventory, accounts receivable, deposit accounts, and cash and cash equivalents. Lenders shall also maintain a second lien on all Term Loan Priority Collateral
Financial Covenants: Minimum Fixed Charge Coverage Ratio of 1.0x tested quarterly if EA is less than the greater of (i) 10.0% of the lesser of the Borrowing Base or the Facility (the “Line Cap”), or (ii) $30 million
Cash Dominion: Springing when EA for three consecutive business days is less than the greater of (i) 12.5% of the Line Cap, or (ii) $37.5 million
Field Exam and One field exam and one appraisal per year, springing to two each if EA for three consecutive business days is less than the greater of (i) 12.5% of the Line
Appraisal Frequency: Cap, or (ii) $37.5 million
Borrowing Base – Monthly; Weekly if EA for three consecutive business days is less than greater of (i) 12.5% of the Line Cap, or (ii) $37.5 million
Reporting Frequency:
Financial – Quarterly
CONFIDENTIAL 43
|
Significant ABL Collateral Coverage
VERSO Turn to us.
Significant Collateral Coverage
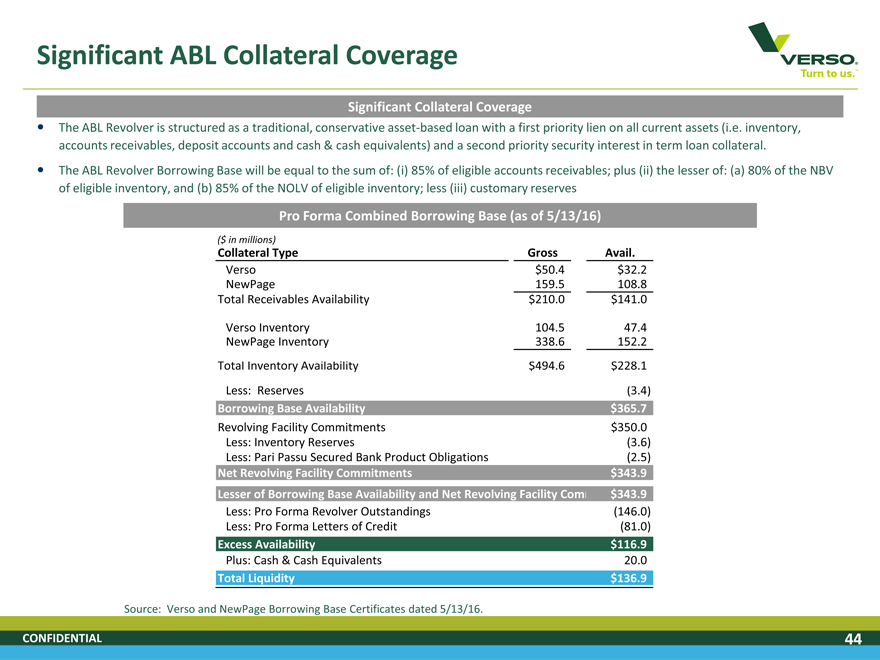
The ABL Revolver is structured as a traditional, conservative asset-based loan with a first priority lien on all current assets (i.e. inventory, accounts receivables, deposit accounts and cash & cash equivalents) and a second priority security interest in term loan collateral.
The ABL Revolver Borrowing Base will be equal to the sum of: (i) 85% of eligible accounts receivables; plus (ii) the lesser of: (a) 80% of the NBV of eligible inventory, and (b) 85% of the NOLV of eligible inventory; less (iii) customary reserves
Pro Forma Combined Borrowing Base (as of 5/13/16)
($ in millions)
Collateral Type Gross Avail.
Verso $50.4 $32.2
NewPage 159.5 108.8
Total Receivables Availability $210.0 $141.0
Verso Inventory 104.5 47.4
NewPage Inventory 338.6 152.2
Total Inventory Availability $494.6 $228.1
Less: Reserves (3.4)
Borrowing Base Availability $365.7
Revolving Facility Commitments $350.0
Less: Inventory Reserves (3.6)
Less: Pari Passu Secured Bank Product Obligations (2.5)
Net Revolving Facility Commitments $343.9
Lesser of Borrowing Base Availability and Net Revolving Facility Com $343.9
Less: Pro Forma Revolver Outstandings (146.0)
Less: Pro Forma Letters of Credit (81.0)
Excess Availability $116.9
Plus: Cash & Cash Equivalents 20.0
Total Liquidity $136.9
Source: Verso and NewPage Borrowing Base Certificates dated 5/13/16.
CONFIDENTIAL 44
|
Term Loan – Term Sheet
VERSO Turn to us.
Summary Terms – Term Loan Exit Facility
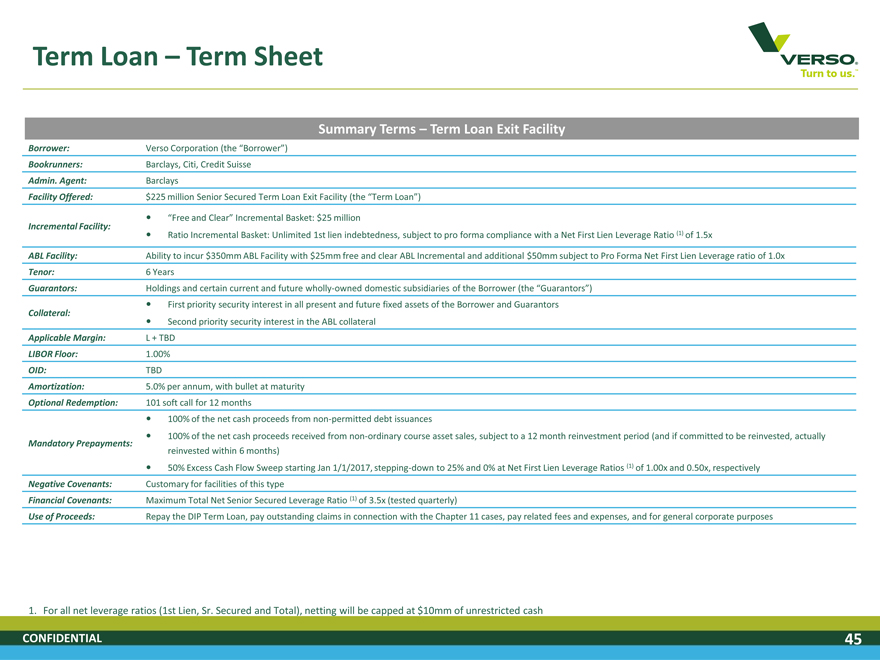
Borrower: Verso Corporation (the “Borrower”)
Bookrunners: Barclays, Citi, Credit Suisse
Admin. Agent: Barclays
Facility Offered: $225 million Senior Secured Term Loan Exit Facility (the “Term Loan”)
“Free and Clear” Incremental Basket: $25 million
Incremental Facility:
Ratio Incremental Basket: Unlimited 1st lien indebtedness, subject to pro forma compliance with a Net First Lien Leverage Ratio (1) of 1.5x
ABL Facility: Ability to incur $350mm ABL Facility with $25mm free and clear ABL Incremental and additional $50mm subject to Pro Forma Net First Lien Leverage ratio of 1.0x
Tenor: 6 Years
Guarantors: Holdings and certain current and future wholly-owned domestic subsidiaries of the Borrower (the “Guarantors”)
First priority security interest in all present and future fixed assets of the Borrower and Guarantors
Collateral:
Second priority security interest in the ABL collateral
Applicable Margin: L + TBD
LIBOR Floor: 1.00%
OID: TBD
Amortization: 5.0% per annum, with bullet at maturity
Optional Redemption: 101 soft call for 12 months
100% of the net cash proceeds from non-permitted debt issuances
100% of the net cash proceeds received from non-ordinary course asset sales, subject to a 12 month reinvestment period (and if committed to be reinvested, actually reinvested within 6 months)
Mandatory Prepayments:
50% Excess Cash Flow Sweep starting Jan 1/1/2017, stepping-down to 25% and 0% at Net First Lien Leverage Ratios (1) of 1.00x and 0.50x, respectively
Negative Covenants: Customary for facilities of this type
Financial Covenants: Maximum Total Net Senior Secured Leverage Ratio (1) of 3.5x (tested quarterly)
Use of Proceeds: Repay the DIP Term Loan, pay outstanding claims in connection with the Chapter 11 cases, pay related fees and expenses, and for general corporate purposes
1. For all net leverage ratios (1st Lien, Sr. Secured and Total), netting will be capped at $10mm of unrestricted cash
CONFIDENTIAL 45
|
Financing Timeline
VERSO Turn to us.
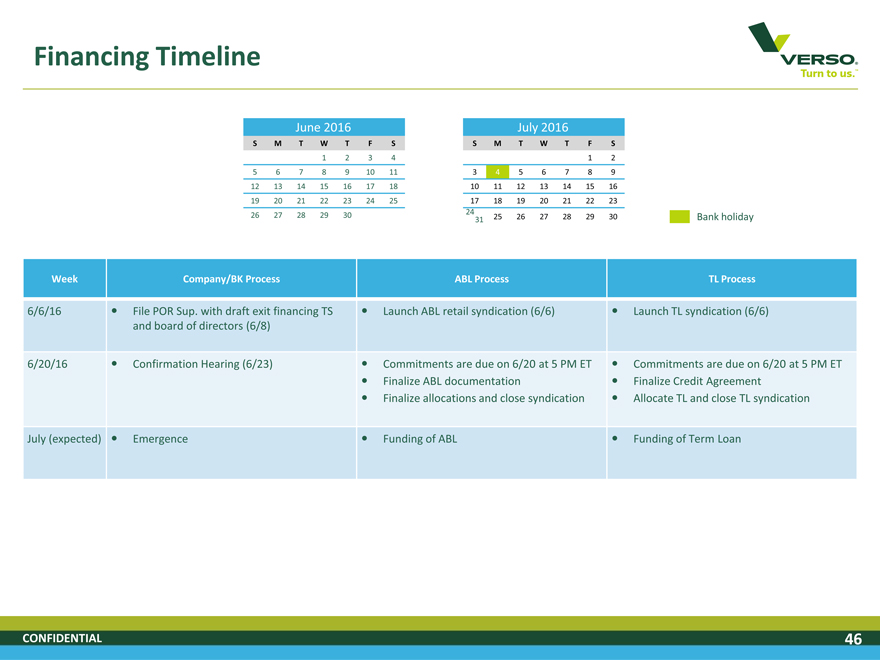
June 2016 July 2016
S M T W T F S S M T W T F S
1 2 3 4 1 2
5 6 7 8 9 10 11 3 4 5 6 7 8 9
12 13 14 15 16 17 18 10 11 12 13 14 15 16
19 20 21 22 23 24 25 17 18 19 20 21 22 23 24
26 27 28 29 30 25 26 27 28 29 30 Bank holiday 31
Week Company/BK Process ABL Process TL Process
6/6/16 File POR Sup. with draft exit financing TS Launch ABL retail syndication (6/6) Launch TL syndication (6/6) and board of directors (6/8)
6/20/16 Confirmation Hearing (6/23) Commitments are due on 6/20 at 5 PM ET Commitments are due on 6/20 at 5 PM ET
Finalize ABL documentation Finalize Credit Agreement
Finalize allocations and close syndication Allocate TL and close TL syndication
July (expected) Emergence Funding of ABL Funding of Term Loan
CONFIDENTIAL 46
|
Public-Side Q&A
VERSO Turn to us.
Leading Producer with Significant Share of Manufacturing Capacity
Profitable Low Cost Mill Portfolio
Broad Product Offering
Exposure to Growing Specialty Paper Grades
Substantial Cost Savings Achieved
Significant Collateral Coverage
CONFIDENTIAL 47
|
Appendices
VERSO Turn to us.
CONFIDENTIAL
|
Historical Financials
VERSO Turn to us.
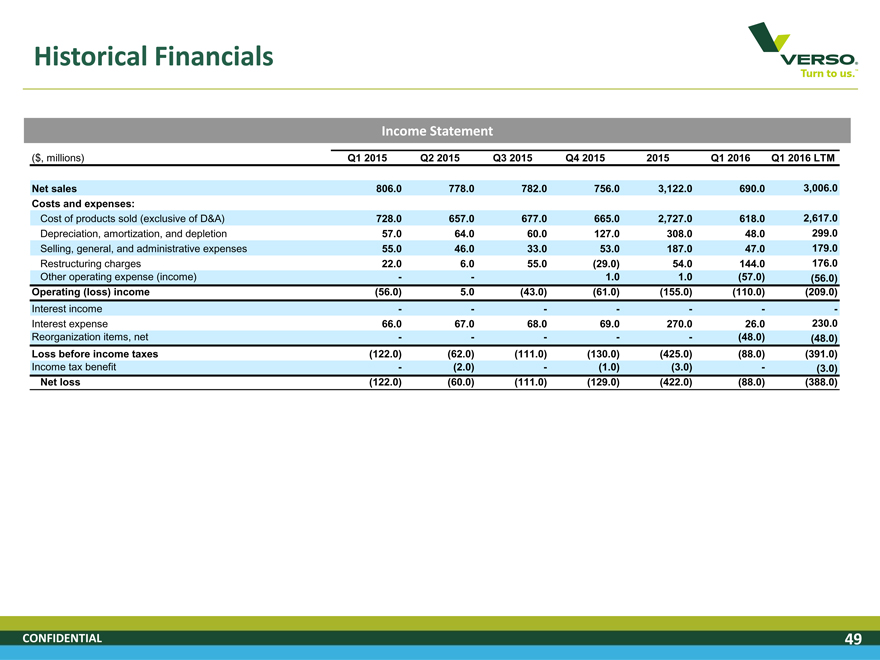
Income Statement
($, millions) Q1 2015 Q2 2015 Q3 2015 Q4 2015 2015 Q1 2016 Q1 2016 LTM
Net sales 806.0 778.0 782.0 756.0 3,122.0 690.0 3,006.0
Costs and expenses:
Cost of products sold (exclusive of D&A) 728.0 657.0 677.0 665.0 2,727.0 618.0 2,617.0
Depreciation, amortization, and depletion 57.0 64.0 60.0 127.0 308.0 48.0 299.0
Selling, general, and administrative expenses 55.0 46.0 33.0 53.0 187.0 47.0 179.0
Restructuring charges 22.0 6.0 55.0 (29.0) 54.0 144.0 176.0
Other operating expense (income) — 1.0 1.0 (57.0) (56.0)
Operating (loss) income (56.0) 5.0 (43.0) (61.0) (155.0) (110.0) (209.0)
Interest income — — — -
Interest expense 66.0 67.0 68.0 69.0 270.0 26.0 230.0
Reorganization items, net — ——(48.0) (48.0)
Loss before income taxes (122.0) (62.0) (111.0) (130.0) (425.0) (88.0) (391.0)
Income tax benefit—(2.0)—(1.0) (3.0)—(3.0)
Net loss (122.0) (60.0) (111.0) (129.0) (422.0) (88.0) (388.0)
CONFIDENTIAL 49
|
Historical Financials
VERSO Turn to us.
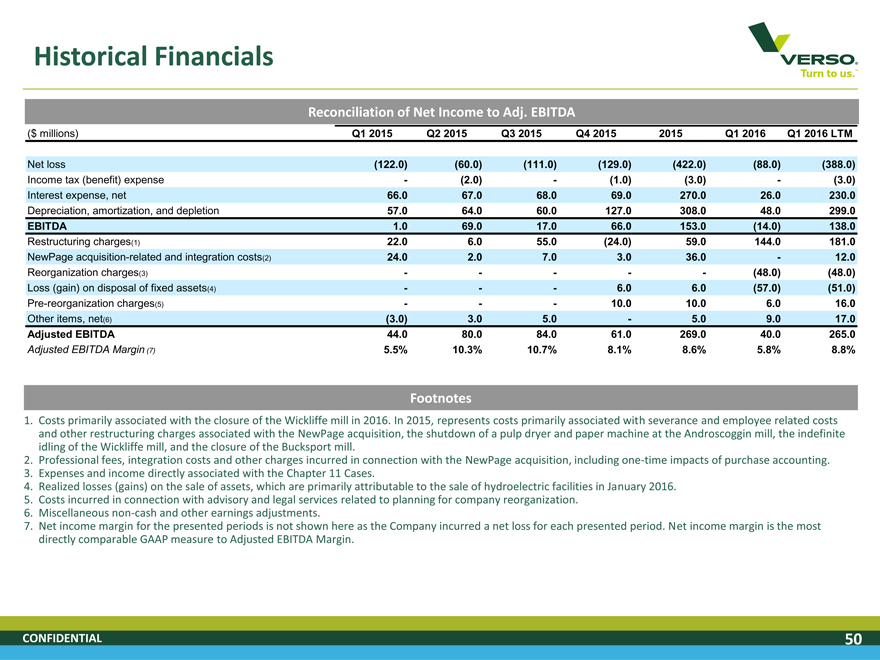
Reconciliation of Net Income to Adj. EBITDA
($ millions) Q1 2015 Q2 2015 Q3 2015 Q4 2015 2015 Q1 2016 Q1 2016 LTM
Net loss (122.0) (60.0) (111.0) (129.0) (422.0) (88.0) (388.0)
Income tax (benefit) expense—(2.0)—(1.0) (3.0)—(3.0)
Interest expense, net 66.0 67.0 68.0 69.0 270.0 26.0 230.0
Depreciation, amortization, and depletion 57.0 64.0 60.0 127.0 308.0 48.0 299.0
EBITDA 1.0 69.0 17.0 66.0 153.0 (14.0) 138.0
Restructuring charges(1) 22.0 6.0 55.0 (24.0) 59.0 144.0 181.0
NewPage acquisition-related and integration costs(2) 24.0 2.0 7.0 3.0 36.0—12.0
Reorganization charges(3) — ——(48.0) (48.0)
Loss (gain) on disposal of fixed assets(4) ——6.0 6.0 (57.0) (51.0)
Pre-reorganization charges(5) ——10.0 10.0 6.0 16.0
Other items, net(6) (3.0) 3.0 5.0—5.0 9.0 17.0
Adjusted EBITDA 44.0 80.0 84.0 61.0 269.0 40.0 265.0
Adjusted EBITDA Margin (7) 5.5% 10.3% 10.7% 8.1% 8.6% 5.8% 8.8%
Footnotes
1. Costs primarily associated with the closure of the Wickliffe mill in 2016. In 2015, represents costs primarily associated with severance and employee related costs and other restructuring charges associated with the NewPage acquisition, the shutdown of a pulp dryer and paper machine at the Androscoggin mill, the indefinite idling of the Wickliffe mill, and the closure of the Bucksport mill.
2. Professional fees, integration costs and other charges incurred in connection with the NewPage acquisition, including one-time impacts of purchase accounting.
3. Expenses and income directly associated with the Chapter 11 Cases.
4. Realized losses (gains) on the sale of assets, which are primarily attributable to the sale of hydroelectric facilities in January 2016.
5. Costs incurred in connection with advisory and legal services related to planning for company reorganization.
6. Miscellaneous non-cash and other earnings adjustments.
7. Net income margin for the presented periods is not shown here as the Company incurred a net loss for each presented period. Net income margin is the most directly comparable GAAP measure to Adjusted EBITDA Margin.
CONFIDENTIAL 50
|
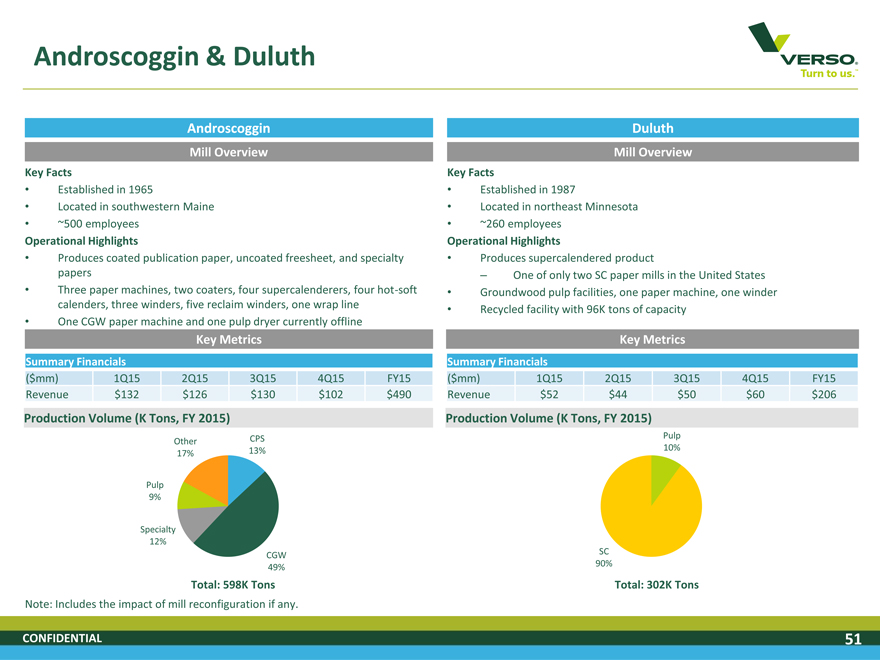
Androscoggin & Duluth
VERSO Turn to us.
Androscoggin
Mill Overview
Key Facts
Established in 1965
Located in southwestern Maine
~500 employees
Operational Highlights
Produces coated publication paper, uncoated freesheet, and specialty papers
Three paper machines, two coaters, four supercalenderers, four hot-soft calenders, three winders, five reclaim winders, one wrap line
One CGW paper machine and one pulp dryer currently offline
Key Metrics
Summary Financials
($mm) 1Q15 2Q15 3Q15 4Q15 FY15 Revenue $132 $126 $130 $102 $490
Production Volume (K Tons, FY 2015)
Other CPS 17% 13%
Pulp 9%
Specialty 12%
CGW 49%
Total: 598K Tons
Note: Includes the impact of mill reconfiguration if any.
Duluth
Mill Overview
Key Facts
Established in 1987
Located in northeast Minnesota
~260 employees
Operational Highlights
Produces supercalendered product
– One of only two SC paper mills in the United States
Groundwood pulp facilities, one paper machine, one winder
Recycled facility with 96K tons of capacity
Key Metrics
Summary Financials
($mm) 1Q15 2Q15 3Q15 4Q15 FY15 Revenue $52 $44 $50 $60 $206
Production Volume (K Tons, FY 2015)
Pulp 10%
SC 90%
Total: 302K Tons
CONFIDENTIAL 51
|
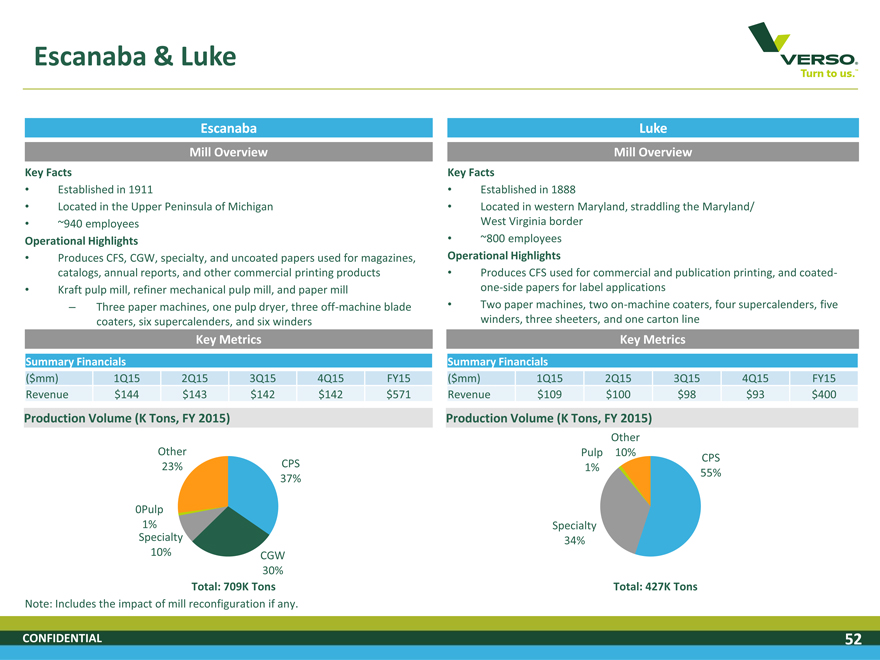
Escanaba & Luke
VERSO Turn to us.
Escanaba
Mill Overview
Key Facts
Established in 1911
Located in the Upper Peninsula of Michigan
~940 employees
Operational Highlights
Produces CFS, CGW, specialty, and uncoated papers used for magazines, catalogs, annual reports, and other commercial printing products
Kraft pulp mill, refiner mechanical pulp mill, and paper mill
– Three paper machines, one pulp dryer, three off-machine blade coaters, six supercalenders, and six winders
Key Metrics
Summary Financials
($mm) 1Q15 2Q15 3Q15 4Q15 FY15 Revenue $144 $143 $142 $142 $571
Production Volume (K Tons, FY 2015)
Other
23% CPS 37%
0Pulp 1% Specialty
10% CGW 30%
Total: 709K Tons
Note: Includes the impact of mill reconfiguration if any. Luke
Mill Overview
Key Facts
Established in 1888
Located in western Maryland, straddling the Maryland/ West Virginia border
~800 employees
Operational Highlights
Produces CFS used for commercial and publication printing, and coated-one-side papers for label applications
Two paper machines, two on-machine coaters, four supercalenders, five winders, three sheeters, and one carton line
Key Metrics
Summary Financials
($mm) 1Q15 2Q15 3Q15 4Q15 FY15 Revenue $109 $100 $98 $93 $400
Production Volume (K Tons, FY 2015)
Other Pulp 10%
1% CPS 55%
Specialty 34%
Total: 427K Tons
CONFIDENTIAL 52
|
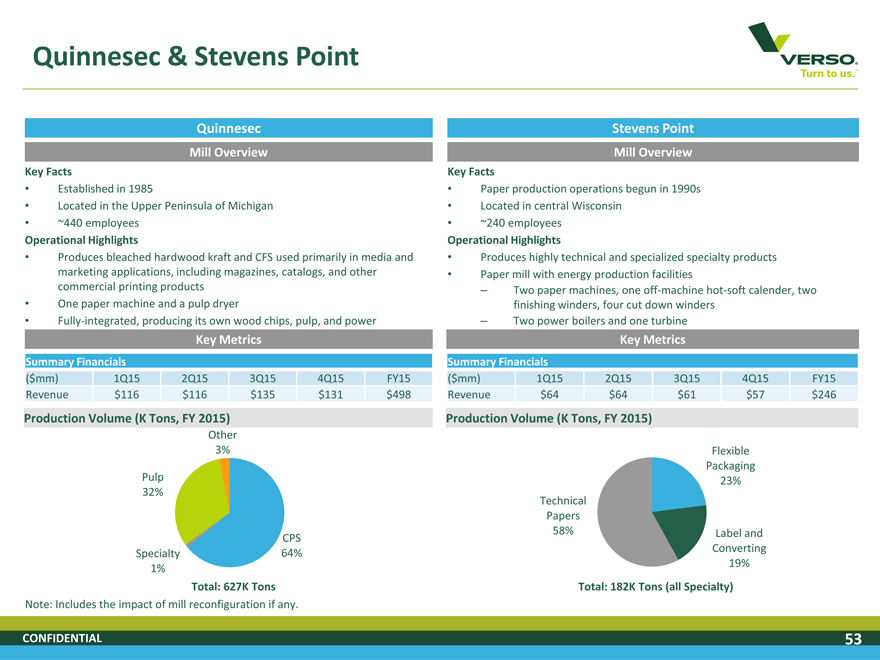
Quinnesec & Stevens Point
VERSO Turn to us.
Quinnesec
Mill Overview
Key Facts
Established in 1985
Located in the Upper Peninsula of Michigan
~440 employees
Operational Highlights
Produces bleached hardwood kraft and CFS used primarily in media and marketing applications, including magazines, catalogs, and other commercial printing products
One paper machine and a pulp dryer
Fully-integrated, producing its own wood chips, pulp, and power
Key Metrics
Summary Financials
($mm) 1Q15 2Q15 3Q15 4Q15 FY15 Revenue $116 $116 $135 $131 $498
Production Volume (K Tons, FY 2015)
Other 3%
Pulp 32%
CPS Specialty 64% 1%
Total: 627K Tons
Note: Includes the impact of mill reconfiguration if any.
Stevens Point
Mill Overview
Key Facts
Paper production operations begun in 1990s
Located in central Wisconsin
~240 employees
Operational Highlights
Produces highly technical and specialized specialty products
Paper mill with energy production facilities
– Two paper machines, one off-machine hot-soft calender, two finishing winders, four cut down winders
– Two power boilers and one turbine
Key Metrics
Summary Financials
($mm) 1Q15 2Q15 3Q15 4Q15 FY15 Revenue $64 $64 $61 $57 $246
Production Volume (K Tons, FY 2015)
Flexible Packaging 23% Technical Papers 58% Label and Converting 19%
Total: 182K Tons (all Specialty)
CONFIDENTIAL 53
|
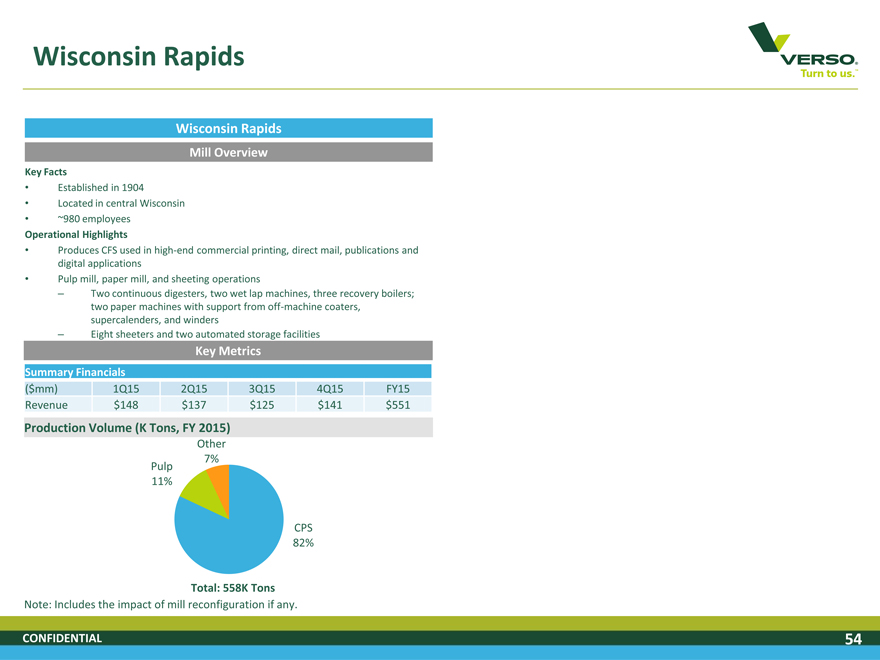
Wisconsin Rapids
VERSO Turn to us.
Wisconsin Rapids
Mill Overview
Key Facts
Established in 1904
Located in central Wisconsin
~980 employees
Operational Highlights
Produces CFS used in high-end commercial printing, direct mail, publications and digital applications
Pulp mill, paper mill, and sheeting operations
– Two continuous digesters, two wet lap machines, three recovery boilers; two paper machines with support from off-machine coaters, supercalenders, and winders
– Eight sheeters and two automated storage facilities
Key Metrics
Summary Financials
($mm) 1Q15 2Q15 3Q15 4Q15 FY15 Revenue $148 $137 $125 $141 $551
Production Volume (K Tons, FY 2015)
Other 7% Pulp 11%
CPS 82%
Total: 558K Tons
Note: Includes the impact of mill reconfiguration if any.
CONFIDENTIAL 54