Exhibit 99.1
Analyst Day February 19, 2008 KAR Holdings, Inc. |
2 Forward-Looking Statements This presentation includes forward-looking statements within the meaning of the Private Securities Litigation Reform Act of 1995. Such statements are subject to certain risks, trends, and uncertainties that could cause actual results to differ materially from those projected, expressed or implied by such forward- looking statements. Many of these risk factors are outside of the company’s control, and as such, they involve risks which are not currently known to the company that could cause actual results to differ materially from forecasted results. The forward-looking statements in this document are made as of the date hereof and the company does not undertake to update its forward-looking statements. |
3 AGENDA • Industry Update - Tom Kontos • Corporate Update - Eric Loughmiller • Q&A |
Copyright 2007 ADESA, Inc. Used Vehicle Market Conditions and Outlook Tom Kontos Executive Vice-President Customer Strategies and Analytics ADESA February 2008 Copyright 2007 ADESA, Inc. All rights reserved. The information provided here was compiled by and is proprietary to ADESA, Inc. It is for informational purposes only and its accuracy is not warranted. It is intended for the benefit of the named recipient, and may not be relied upon or utilized for any other purpose or by any other person and may not be made available to any other person without the express written permission of ADESA, Inc. |
 5 ADESA Analytical Services Reports Plus monthly postings on: www.adesa.com/kontoskorner Contact Tom Kontos tkontos@adesa.com 317/249-4235 |
 6 Customer Strategies and Analytics Analytical Services CRM/ Salesforce.com Dealer Relations Insight and Trusted Business Advice • Market and Peer Group Benchmarking Studies • Impact of Reconditioning • Dealer Surveys • Analysis of Vehicles Resold • Comparative Analysis • GVR, Pulse, Market Trends • Utilize robust database of dealer preferences and demographics • Design target marketing campaigns • Train inside and outside auction personnel • Monitor use and results • Strengthen relationships with major automotive retailers • Provide custom studies, analytics, and strategies to dealer groups • Share auction "best practices" for optimal inventory management • Helping national accounts make better remarketing decisions • Helping large dealer groups achieve economies of scale and optimize their used vehicle inventory management. |
General Economy |
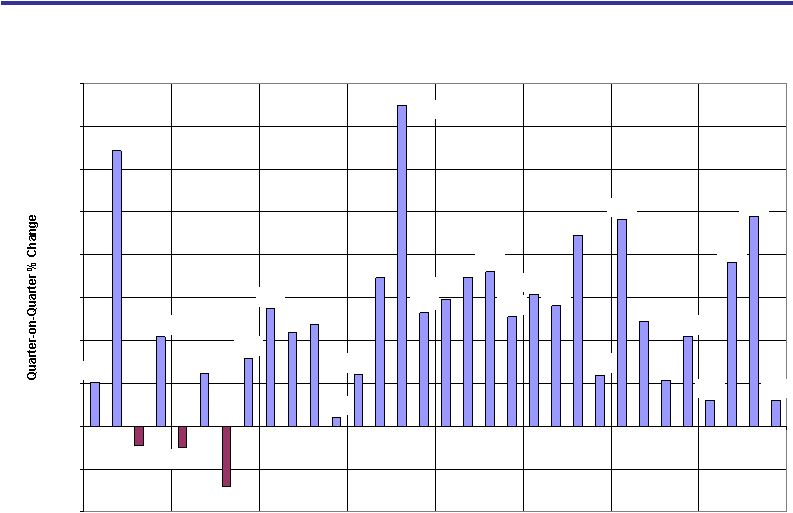 8 GDP growth rates are expected to slow to below 1.0% from year-end 2007 into early 2008. Real GDP Growth Rates 1.0% 6.4% -0.5% 2.1% -0.5% -1.4% 1.6% 2.7% 2.2% 2.4% 0.2% 1.2% 3.5% 2.7% 3.5% 3.6% 2.6% 3.1% 2.8% 4.5% 1.2% 4.8% 2.4% 1.1% 2.1% 0.6% 3.8% 4.9% 0.6% 7.5% 3.0% 1.2% -2.0% -1.0% 0.0% 1.0% 2.0% 3.0% 4.0% 5.0% 6.0% 7.0% 8.0% Q1 Q2 Q3 Q4 Q1 Q2 Q3 Q4 Q1 Q2 Q3 Q4 Q1 Q2 Q3 Q4 Q1 Q2 Q3 Q4 Q1 Q2 Q3 Q4 Q1 Q2 Q3 Q4 Q1 Q2 Q3 Q4 2000 2001 2002 2003 2004 2005 2006 2007 |
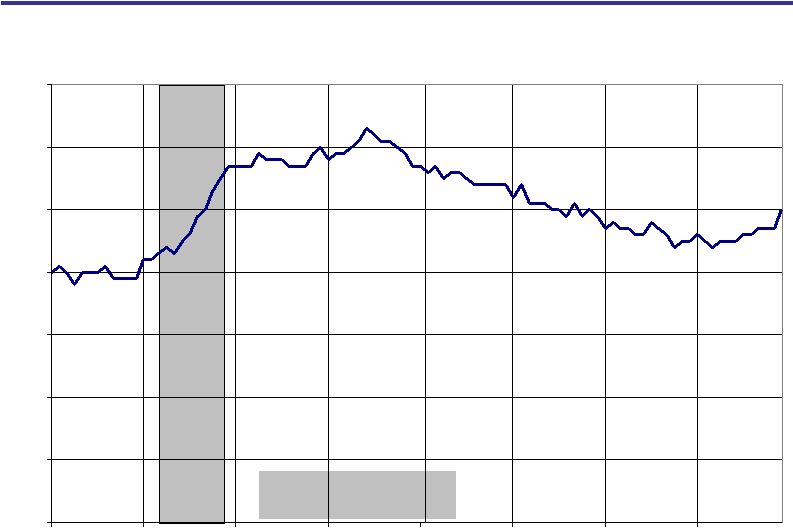 9 Unemployment is creeping up as employment growth has slowed somewhat this year. Recession: March - November 2001 Unemployment Rate 5.0% 0% 1% 2% 3% 4% 5% 6% 7% Jan-00 Jan-01 Jan-02 Jan-03 Jan-04 Jan-05 Jan-06 Jan-07 |
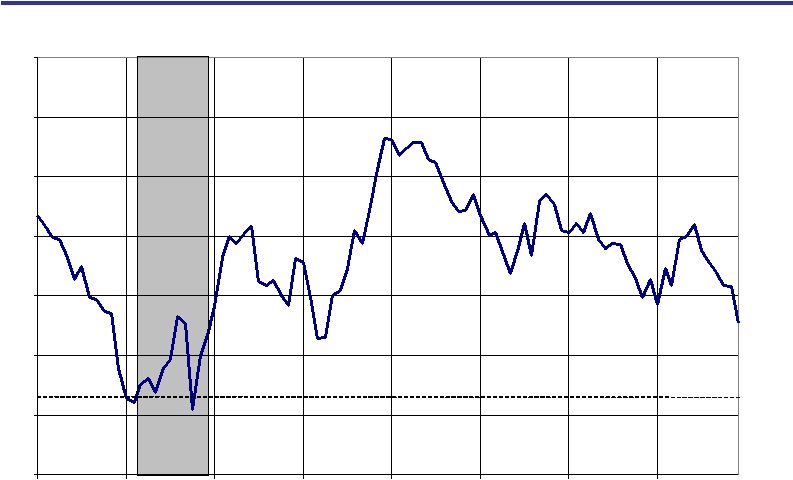 10 Manufacturing has slowed and may be contracting. ISM/Purchasing Managers' Index 47.7 35 40 45 50 55 60 65 70 Jan-00 Jan-01 Jan-02 Jan-03 Jan-04 Jan-05 Jan-06 Jan-07 Recession Warning Level (41.9) Manufacturing Sector Breakeven Level (50.0) |
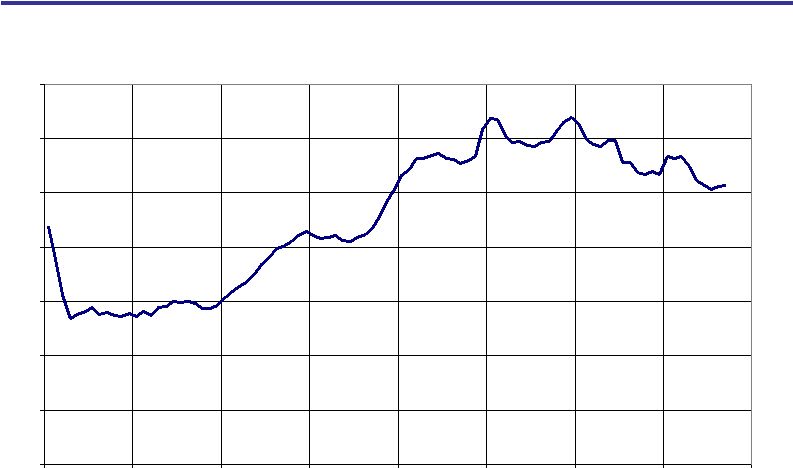 11 Freight volumes have decreased significantly from their peak volumes in 2005. Truck Tonnage Index * (2000 = 100) 110.7 85.0 90.0 95.0 100.0 105.0 110.0 115.0 120.0 Jan-00 Jan-01 Jan-02 Jan-03 Jan-04 Jan-05 Jan-06 Jan-07 *Seasonally adjusted. Three-month moving average. |
 12 Low savings rates indicate that consumers are “spent-up, not pent-up.” Personal Saving as a Percent of Disposable Income -3% -2% -1% 0% 1% 2% 3% 4% 5% Jan-00 Jan-01 Jan-02 Jan-03 Jan-04 Jan-05 Jan-06 Jan-07 |
    13 Business investment is supplementing consumer spending nicely. Investment vs. Consumption ($Millions) $1,000,000 $1,050,000 $1,100,000 $1,150,000 $1,200,000 $1,250,000 $1,300,000 $1,350,000 $1,400,000 $1,450,000 Jan-00 Jan-01 Jan-02 Jan-03 Jan-04 Jan-05 Jan-06 Jan-07 $5,000,000 $5,500,000 $6,000,000 $6,500,000 $7,000,000 $7,500,000 $8,000,000 $8,500,000 $9,000,000 Non-residential Fixed Investment (Real) Personal Consumption Expenditures (Real) |
 14 Low residential construction is costing the economy around 100 basis points of growth, but this is necessary to reduce unsold home inventories. Housing Starts 1,006 1,000 1,200 1,400 1,600 1,800 2,000 2,200 2,400 Jan-00 Jan-01 Jan-02 Jan-03 Jan-04 Jan-05 Jan-06 Jan-07 000s |
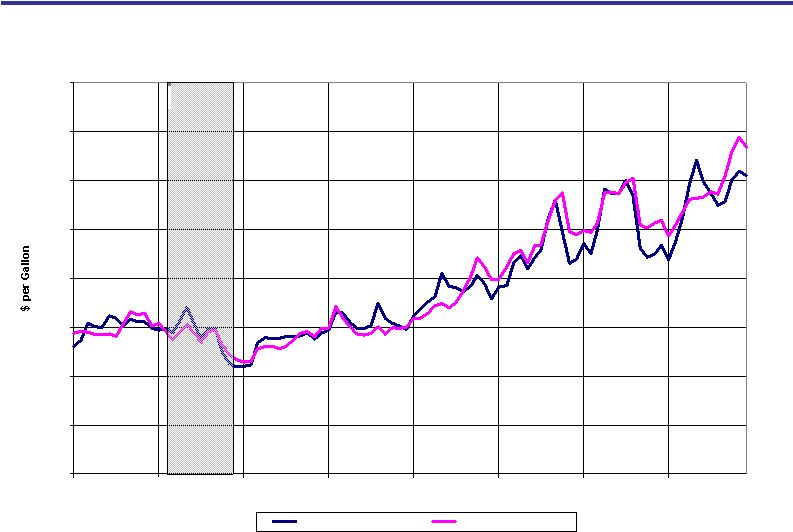    15 Supply and demand conditions suggest high fuel prices for the foreseeable future. Fuel Prices - National Average - $3.053 $3.345 $0.00 $0.50 $1.00 $1.50 $2.00 $2.50 $3.00 $3.50 $4.00 Jan-00 Jan-01 Jan-02 Jan-03 Jan-04 Jan-05 Jan-06 Jan-07 Gasoline (Reg Unld) Diesel (On-Highway) |
Remarketing Industry Supply |
 17 Fleet sales grew by 500,000 units between 2003 and 2005 and were steady in 2006. Fleet Sales by Manufacturers (Millions of Units) 0.92 0.83 0.77 0.83 0.96 1.01 1.68 1.71 1.77 1.94 2.08 2.05 2.59 2.54 2.54 2.77 3.04 3.06 0.0 0.5 1.0 1.5 2.0 2.5 3.0 3.5 2001 2002 2003 2004 2005 2006 Commercial Fleet Rental Total (Commercial Fleet figures include government units.) Units % Commercial Fleet 51,809 5.4% Rental -25,302 -1.2% Total 26,507 0.9% '06 vs '05 Variance |
 18 Rental fleet sales dropped in 2007. Commercial fleet sales were up a bit. Domestics down ~269K; Japanese & Koreans up ~112K Fleet Sales by Manufacturers - YTD Through December - 1,010,512 1,015,625 2,054,373 1,897,486 3,064,885 2,913,111 0 500,000 1,000,000 1,500,000 2,000,000 2,500,000 3,000,000 3,500,000 2006 2007 Sales Volume Commercial Fleet Rental Total Units % Commercial Fleet 5,113 0.5% Rental -156,887 -7.6% Total -151,774 -5.0% '07 vs '06 Variance |
 19 Lease penetration is now above the 25% level we anticipated when interest rates started to rise. Lease Penetration (Personal Use* Leases as a Percent of Total New Vehicle Sales) 26.7% 30.5% 19.3% 0.0% 5.0% 10.0% 15.0% 20.0% 25.0% 30.0% 35.0% *"Personal use" leases are leases on vehicles used by businesses that are also used at least 20% of the time for personal use. |
 20 PIN data corroborates that lease penetration has grown since 2004. PIN and CNW Lease Penetration Data 28.7% 26.7% 0.0% 5.0% 10.0% 15.0% 20.0% 25.0% 30.0% 35.0% PIN CNW |
 21 Lease origination volume began growing in 2004 and has grown strongly since. New Lease Volume (Percent Change from Prior Year) -5.6% -16.7% -11.8% 1.6% 7.3% 7.7% 5.6% -20% -15% -10% -5% 0% 5% 10% 2001 2002 2003 2004 2005 2006 2007 |
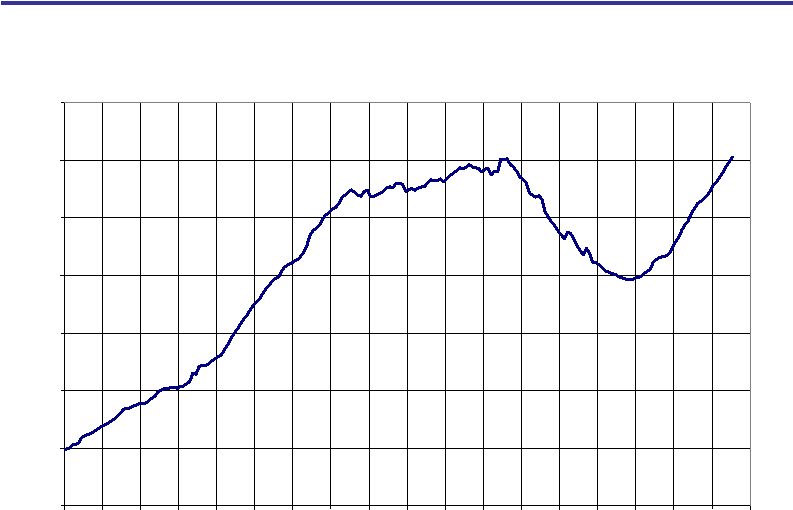 22 Fed data corroborates that leasing is increasing. Federal Reserve Board Consumer Leases Outstanding ($Millions) $0 $20,000 $40,000 $60,000 $80,000 $100,000 $120,000 $140,000 Jan-90 Jan-91 Jan-92 Jan-93 Jan-94 Jan-95 Jan-96 Jan-97 Jan-98 Jan-99 Jan-00 Jan-01 Jan-02 Jan-03 Jan-04 Jan-05 Jan-06 Jan-07 |
 23 The Consumer Price Index for lease payments has come down over the last few years. Lease Payment Consumer Price Index (Dec 2001=100) 86.0 88.0 90.0 92.0 94.0 96.0 98.0 100.0 102.0 Jan-02 Jan-03 Jan-04 Jan-05 Jan-06 Jan-07 Source: U.S. Bureau of Labor Statistics. Data series began in January 2002. |
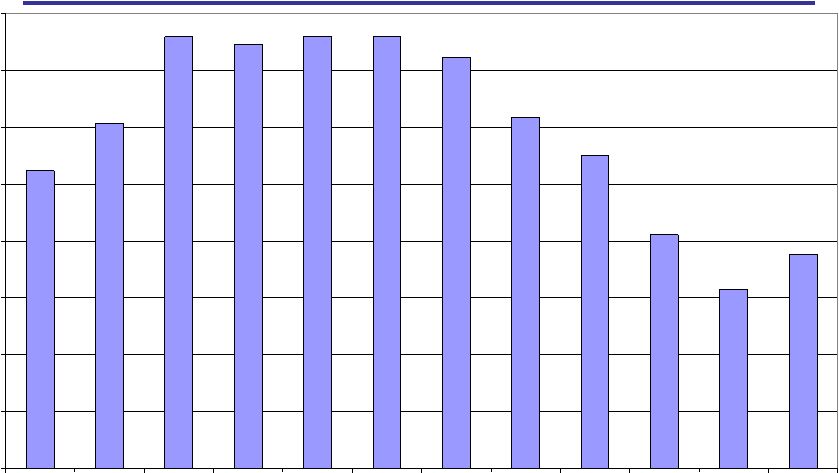
 24 More off-lease units entered the market in 2007. Consumer Leases and Off-Lease Volumes Returning for Wholesale Remarketing (Millions) 4.16 3.61 3.17 3.05 3.26 3.40 3.50 3.67 4.00 4.17 4.21 4.25 1.68 1.81 1.89 1.93 1.48 1.26 1.25 1.33 1.39 1.43 1.50 1.64 0.0 0.5 1.0 1.5 2.0 2.5 3.0 3.5 4.0 4.5 5.0 2000 2001 2002 2003 2004 2005 2006 2007 2008 2009 2010 2011 Consumer Leases Off-Lease Volume Returning for Wholesale Remarketing History Projections |
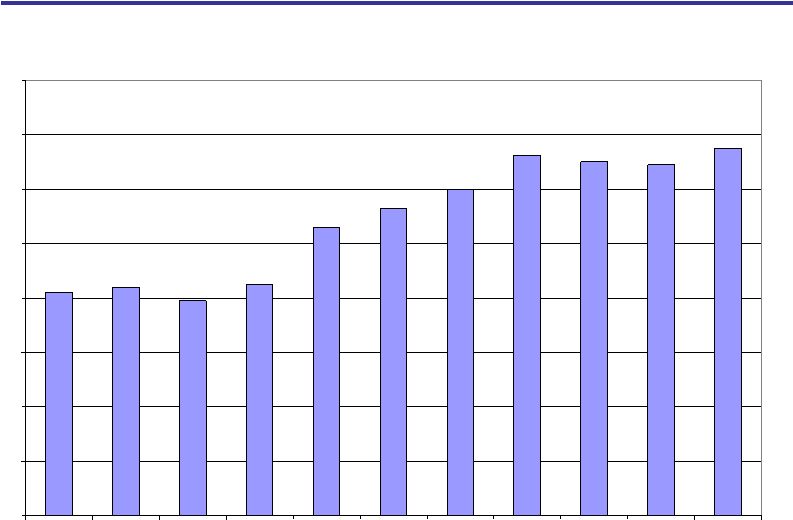 25 The percentage of claims resulting in total losses continues at all-time-high levels. Percentage of Insurance Claims Resulting in Total Loss 8.2% 8.4% 7.9% 8.5% 10.6% 11.3% 12.0% 13.3% 13.0% 12.9% 13.5% 0% 2% 4% 6% 8% 10% 12% 14% 16% 1997 1998 1999 2000 2001 2002 2003 2004 2005 2006 2007 |
Retail Vehicle Markets |
 27 Retail sales have been weak. 2007 2006 Amount % New Vehicle Sales 16,154 16,561 (407) -2.5% Used Vehicle Sales 41,419 42,566 (1,147) -2.7% Franchised Dealers 14,285 14,319 (34) -0.2% Independent Dealers 13,077 13,710 (633) -4.6% Private Individuals 14,056 14,536 (480) -3.3% Total Vehicle Sales 57,573 59,127 (1,554) -2.6% Source: Automotive News Data Center, CNW Marketing/Research, and ADESA Analytical Services. YTD Through Dec Increase/(Decrease) New and Used Vehicle Sales - U.S. (000s of Units Sold) |
28 Reasons for weak retail used vehicle sales: • Used cars priced high relative to discounted new vehicles. More price adjustment is necessary to jump start used vehicle sales. • Maturation of economic cycle/slower economic growth. • More folks are upside down on their longer term vehicle loans. • Vehicle longevity has improved and more people own longer lasting and lightly challenged trucks and SUVs. • Lots of used vehicles were bought in 2005 during the employee discount period, which brought lots of young trade-ins to franchised dealerships. This brought forward sales that would have otherwise occurred in 2006 or 2007. • Hurricane-replacement vehicles were bought in late 2005 as well. |
 29 A recovery in used vehicle sales for franchised dealers may be underway. Retail Used Vehicle Sales Trends -40.0% -30.0% -20.0% -10.0% 0.0% 10.0% 20.0% 30.0% Ja n- 06 Fe b- 06 Ma r- 06 Ap r- 06 Ma y- 06 Ju n- 06 J ul- 06 Au g- 06 Se p- 06 Oc t- 06 No v- 06 De c- 06 Ja n- 07 Fe b- 07 Ma r- 07 Ap r- 07 Ma y- 07 Ju n- 07 J ul- 07 Au g- 07 Se p- 07 Oc t- 07 No v- 07 De c- 07 Franchised Independent Total Retail |
 30 New vehicle incentives have been relatively stable after dropping in 2006. This is good news for vehicle remarketers. Average New Vehicle Incentives According to Edmunds $2,458 $0 $500 $1,000 $1,500 $2,000 $2,500 $3,000 $3,500 Jan-02 Jan-03 Jan-04 Jan-05 Jan-06 Jan-07 |
 31 Used car prices are becoming more competitive relative to new car prices. Used Vehicle Price as a % of New Vehicle Price* 52.9% 50.0% 55.0% 60.0% 65.0% 70.0% Jan-00 Jan-01 Jan-02 Jan-03 Jan-04 Jan-05 Jan-06 Jan-07 *Based on vehicles financed by domestic captive finance companies. |
 32 Retail used vehicle prices are coming down faster than new vehicle prices. Both look like they’re leveling off. Comparison of New and Used Vehicle Consumer Price Indices -0.4% -0.5% -5% -4% -3% -2% -1% 0% 1% 2% New Vehicle CPI Used Vehicle CPI |
Wholesale Vehicle Markets |
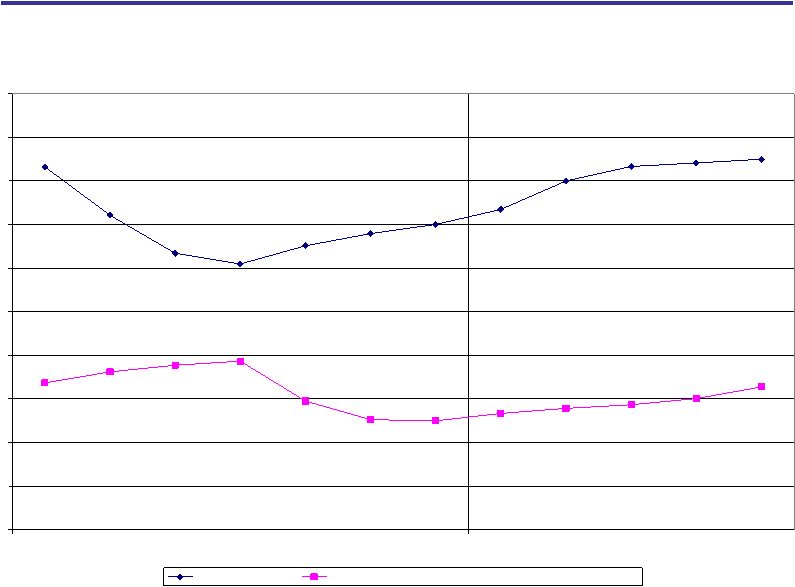
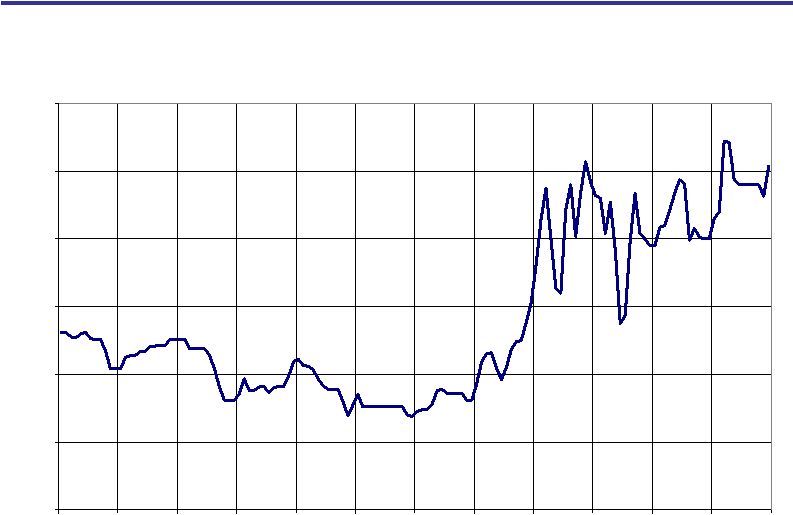
 34 As wholesale used vehicle prices rose from 2004-07, so did salvage prices and recoveries. 2001 2000 Comparison of Wholesale Prices and Assessed Values for Wholecar and Salvage Units $0 $2,000 $4,000 $6,000 $8,000 $10,000 $12,000 Avg Wholesale Price - All Vehicles Avg Wholesale Price - Salvage Vehicles Sold at Wholesale Auto Auctions ACV 2002 2003 2004 2005 2006 2007 |
 35 Maintenance and repair costs have been rising faster than used vehicle values leading to more total losses. Comparison of Consumer Price Indexes for Maintenance/Repairs to Used Vehicle Prices 0 50 100 150 200 250 Jan-90 Jan-91Jan-92 Jan-93 Jan-94 Jan-95Jan-96 Jan-97 Jan-98Jan-99 Jan-00 Jan-01 Jan-02Jan-03 Jan-04 Jan-05 Jan-06Jan-07 Motor vehicle maintenance and repair Used Vehicles |
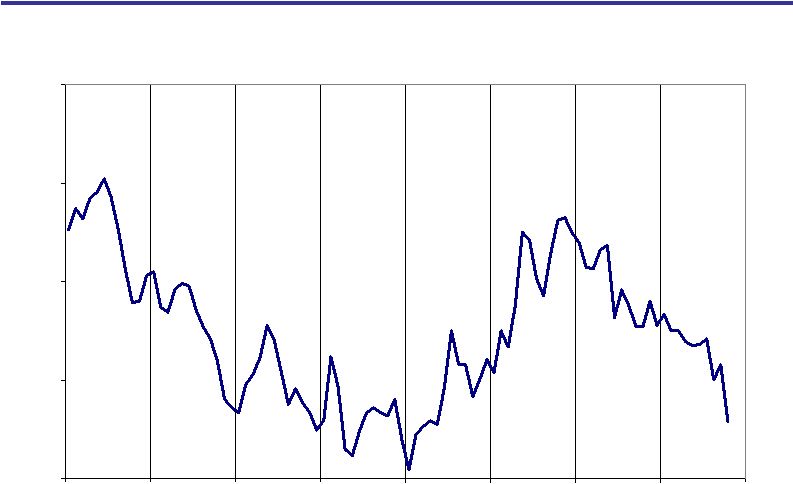
 36 Scrap metal prices have fallen from peak levels, but remain high by historical standards. Scrap Metal Price Trends (Broker Prices for Shredded Auto Scrap) - Boston ($/Ton) $254 $0 $50 $100 $150 $200 $250 $300 Jan-96 Jan-97 Jan-98 Jan-99 Jan-00 Jan-01 Jan-02 Jan-03 Jan-04 Jan-05 Jan-06 Jan-07 |
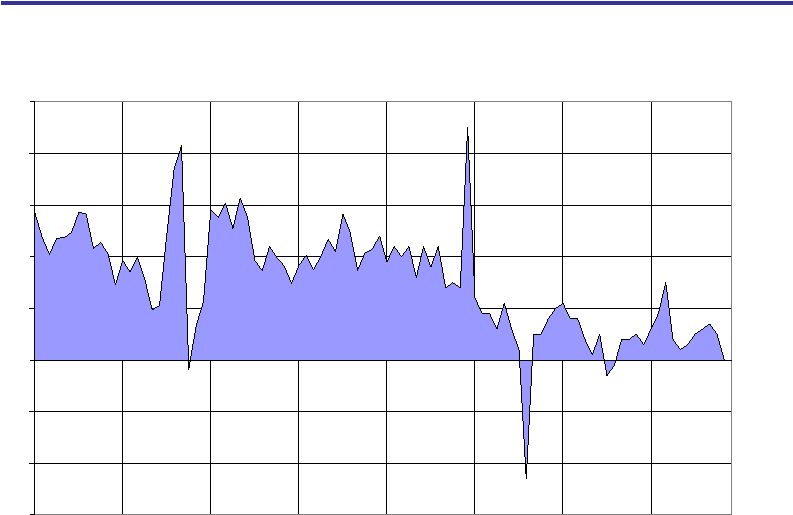
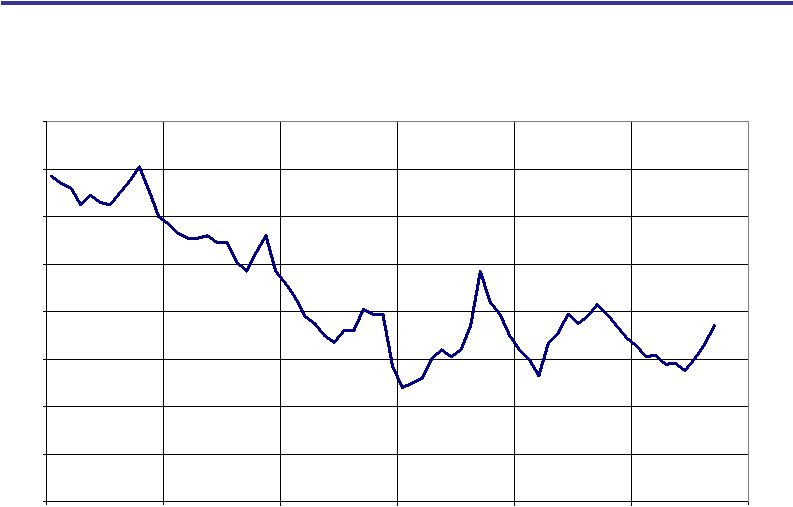
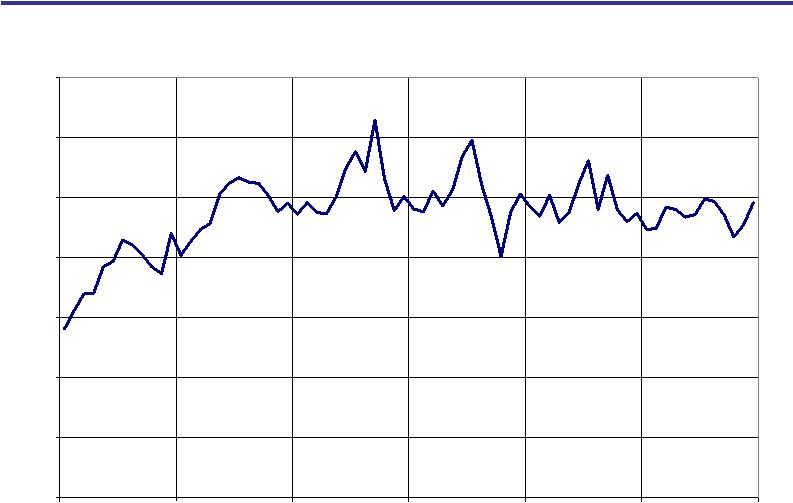
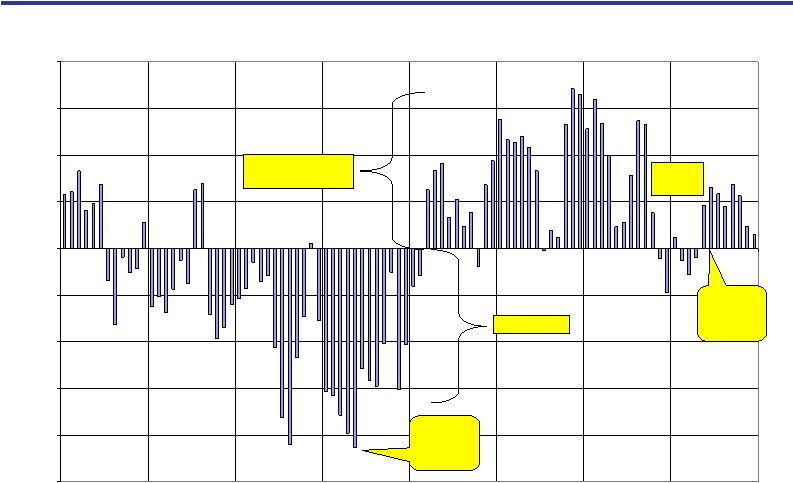 37 Prices are up in recent months primarily due to low supply of program units this year. Year-on-Year Percent Change in Average Auction Prices -10.0% -8.0% -6.0% -4.0% -2.0% 0.0% 2.0% 4.0% 6.0% 8.0% 2000 2001 2002 2003 2004 2005 2006 2007 Inflection Point - May 2003 Price firming Continued firming/recovery Price softening Supply- driven recovery |
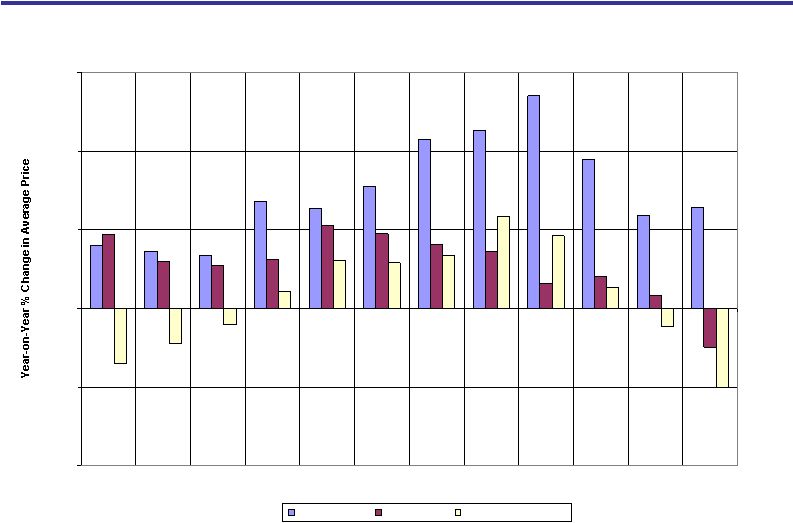 38 Prices are strongest for the off-rental units sold by manufacturers that are in short supply. AuctionNet Price Trends by Sale Type 4.0% 3.6% 3.3% 6.8% 6.3% 7.7% 10.7% 11.3% 13.5% 9.5% 5.9% 6.4% 4.7% 3.0% 2.7% 3.1% 5.3% 4.7% 4.0% 3.6% 1.6% 2.0% 0.8% -2.5% -3.5% -2.2% -1.0% 1.1% 3.1% 2.9% 3.4% 5.8% 4.6% 1.3% -1.2% -5.0% -10.0% -5.0% 0.0% 5.0% 10.0% 15.0% Jan-07 Feb-07 Mar-07 Apr-07 May-07 Jun-07 Jul-07 Aug-07 Sep-07 Oct-07 Nov-07 Dec-07 Manufacturer Fleet/Lease Dealer Consignment |
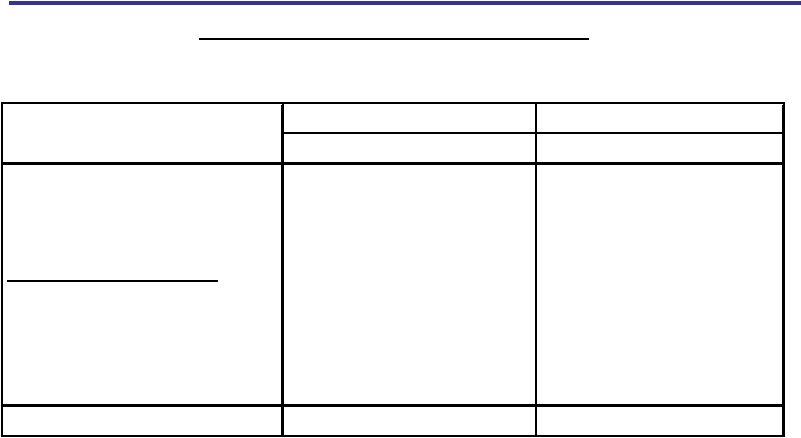
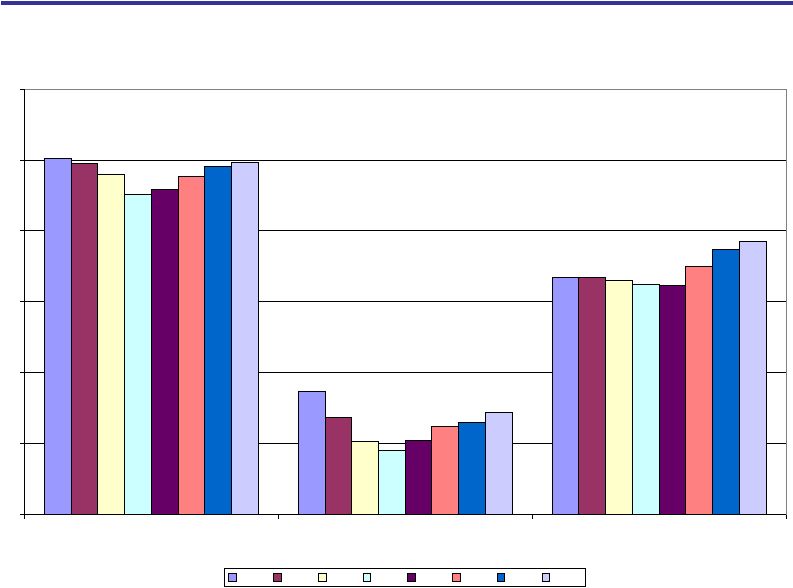
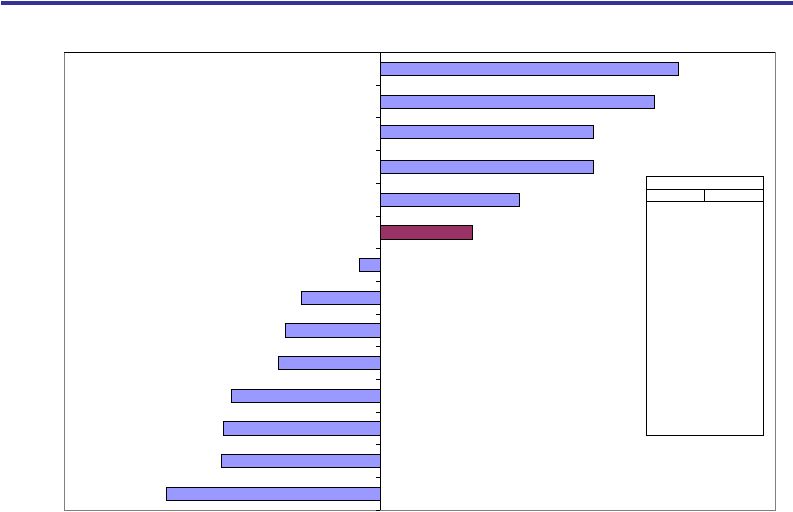 39 “Performance may vary” based on model class as well. 2007 2006 Total All Vehicles $9,939 $9,825 Total Cars $8,924 $9,000 Compact Car $6,203 $6,278 Midsize Car $7,414 $7,566 Fullsize Car $10,811 $10,418 Luxury Car $13,647 $13,785 Sporty Car $12,298 $12,534 Total Trucks $10,979 $10,734 Mini Van $8,204 $8,311 Fullsize Van $8,224 $8,008 Mini SUV $10,324 $10,611 Midsize SUV $10,623 $10,344 Fullsize SUV $13,368 $13,405 Luxury SUV $20,687 $21,105 Compact Pickup $7,539 $7,409 Fullsize Pickup $11,615 $11,226 Wholesale Used Vehicle Price Trends Average Prices ($/Unit) Percent Change in Average AuctionNet Price by Model Class - 2007 vs. 2006 (YTD Dec) 3.8% 3.5% 2.7% 2.7% 1.8% -1.0% -1.2% -1.3% -1.9% -2.0% -2.0% -2.7% 1.2% -0.3% -4% -3% -2% -1% 0% 1% 2% 3% 4% 5% Fullsize Car Fullsize Pickup Midsize SUV Fullsize Van Compact Pickup All Vehicles Fullsize SUV Luxury Car Compact Car Mini Van Sporty Car Luxury SUV Midsize Car Mini SUV |
 40 High inventory levels will exert downward pressure on prices. Estimated Auction Industry Inventory Days* 55 38 19 44 28 23 45 43 17 18 19 21 40 39 0 10 20 30 40 50 60 * Based on estimated auction industry inventory and sales levels for manufacturer and captive finance units only. |
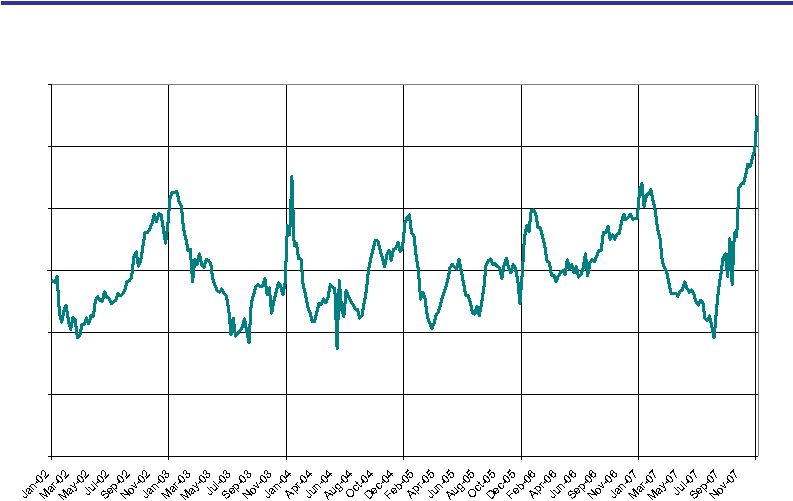
 41 Luxury SUV prices have trended down compared to market of late; Luxury car prices have trended up. Price Trends in Luxury Segments Compared to Total Market $5,000 $7,000 $9,000 $11,000 $13,000 $15,000 $17,000 $19,000 $21,000 $23,000 $25,000 Luxury Car Luxury SUV All Segments |
 42 Monthly Prices as a % of Annual Average Price Based on 1993-2006 AuctionNet Data* 99.24% 100.08% 101.60% 101.46% 101.61% 101.60% 101.23% 100.18% 99.51% 98.11% 97.15% 97.77% 94% 95% 96% 97% 98% 99% 100% 101% 102% Jan Feb Mar Apr May Jun Jul Aug Sep Oct Nov Dec *On vehicles seven model years old or less. |
 43 In Summary: • The macro economy is still in slow-growth mode. • Wholesale vehicle supply will increase. • Retail demand is weak. • Anticipate softer wholesale prices for first half of 2008. |
44 AGENDA • Industry Update - Tom Kontos • Corporate Update - Eric Loughmiller • Q&A |
 45 KAR Holdings, Inc. Total 2007 Revenue: $1,588.9 Total 2007 PF Adjusted EBITDA: $405.2 ADESA Whole Car 2007 Revenue: $965.5 IAAI Salvage 2007 Revenue: $482.5 Used vehicle auctioneer Remarkets used vehicles from large institutions and dealers Salvage vehicle auctioneer Remarkets vehicles deemed a total-loss by insurance companies Provides short-term inventory-secured financing, known as floorplan financing, for independent used vehicle dealers in North America Auction Sites: 59 Market Position: #2 Market Share: 18% Auction Sites: 145 Market Position: #2 Market Share: 35% Offices: 91 Market Position: Leader Market Share: NA Automotive Finance Corp. (AFC) 2007 Revenue: $140.9 Note: Pro forma to give effect to full year impact of recent acquisitions, buyer fee increases at IAAI standalone and certain cost savings from salvage combination. Company Overview ($ in millions) |
 46 Experienced and Committed Management Team Name Position Years in Industry Brian Clingen Chairman and CEO 8 Jim Hallett President and CEO – ADESA Whole Car 32 Tom O’Brien President and CEO – IAAI Salvage 16 Curt Phillips President and CEO – AFC 9 John Nordin EVP and CIO 5 Eric Loughmiller EVP and CFO 2 Becca Polak EVP, General Counsel & Secretary 3 |
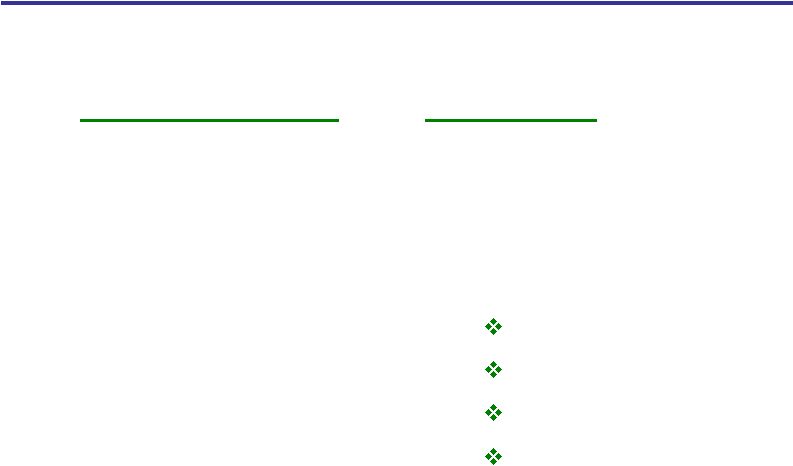
 47 Leading Market Positions The Company operates the largest network of used and salvage vehicle auctions in North America and is a leader in the independent dealer floorplan financing market. North American Whole Car Auction Market North American Salvage Auction Market Manheim 51% Independents 31% ADESA 18% Copart 37% IAAI Salvage Independents / Other 28% Source: GVR Report and Company estimates 35% |
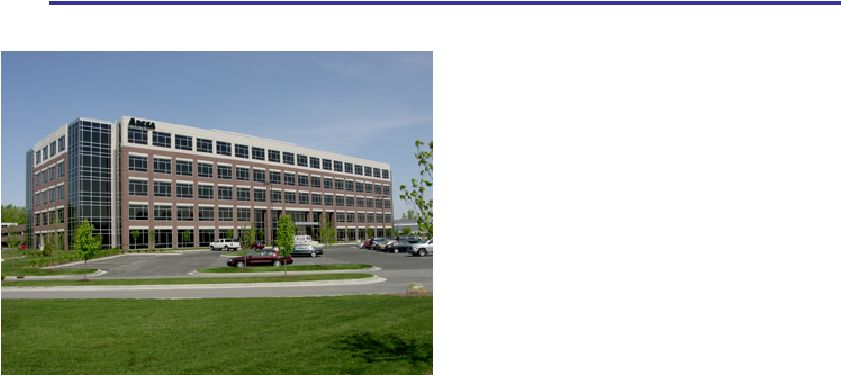
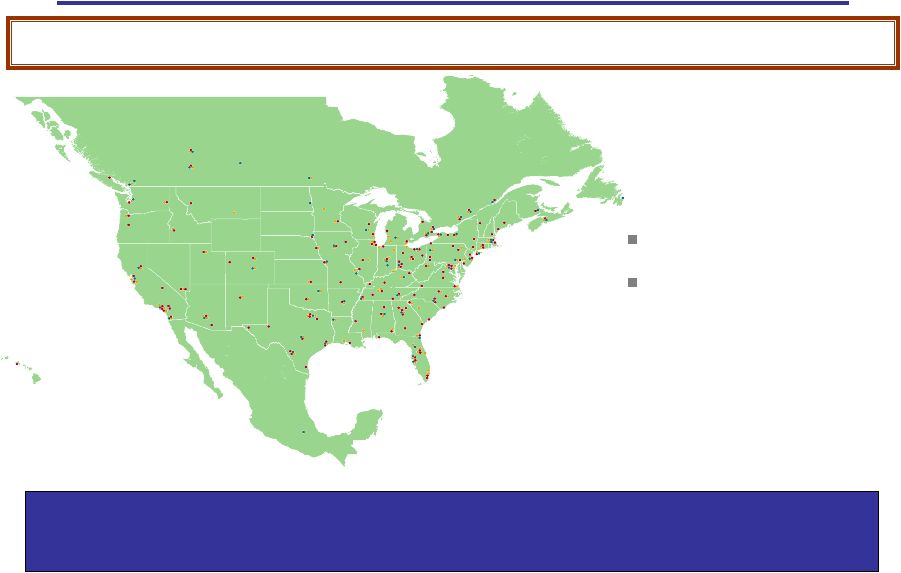 Broad Geographic Footprint Broad geographic footprint positions the Company as the preferred auction & floorplan financing provider for its customers. The Company is 1 of 2 whole car & salvage providers that has a broad N.A. footprint •ADESA Whole Car—59 auction sites •IAAI Salvage—145 auction sites •AFC —91 loan production offices Own 46 whole car and 13 salvage sites Operate 10 shared sites (whole car and salvage) |
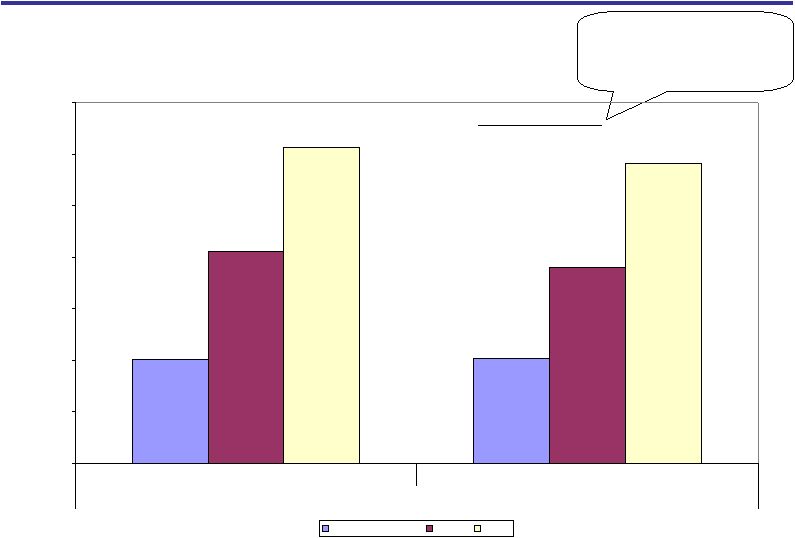
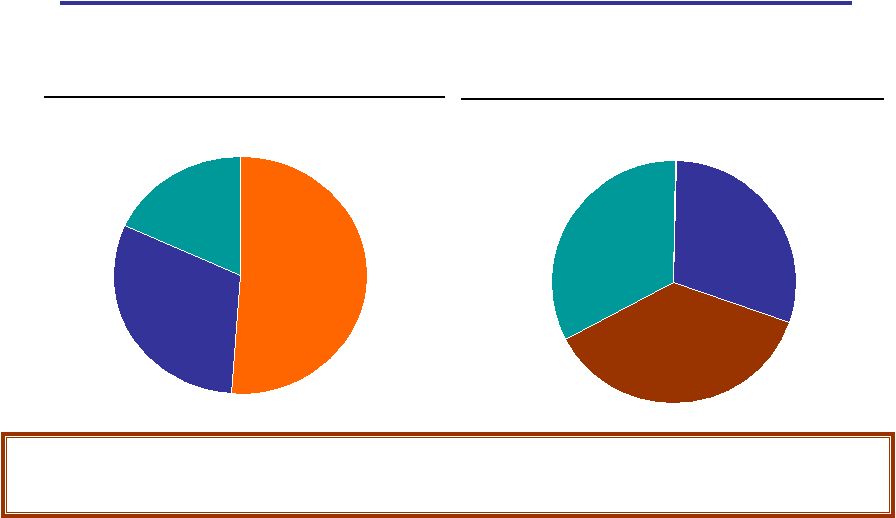
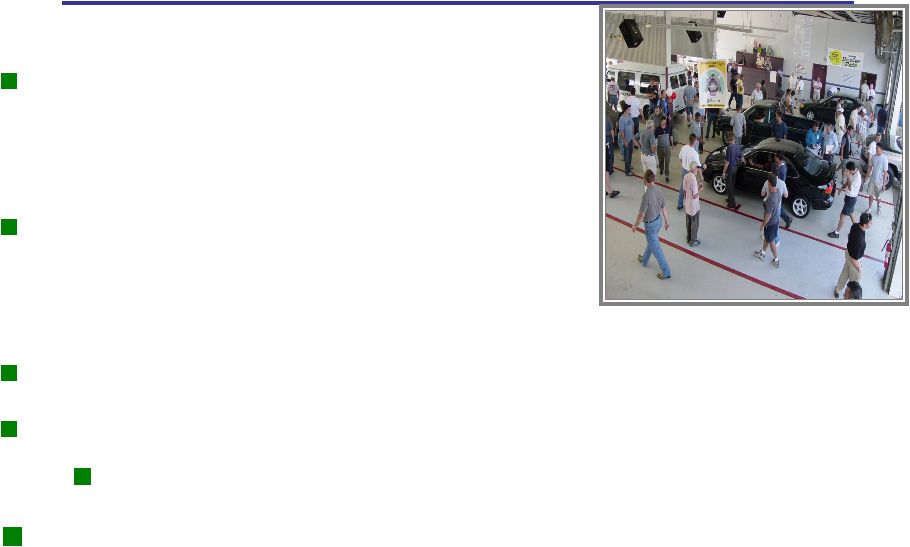
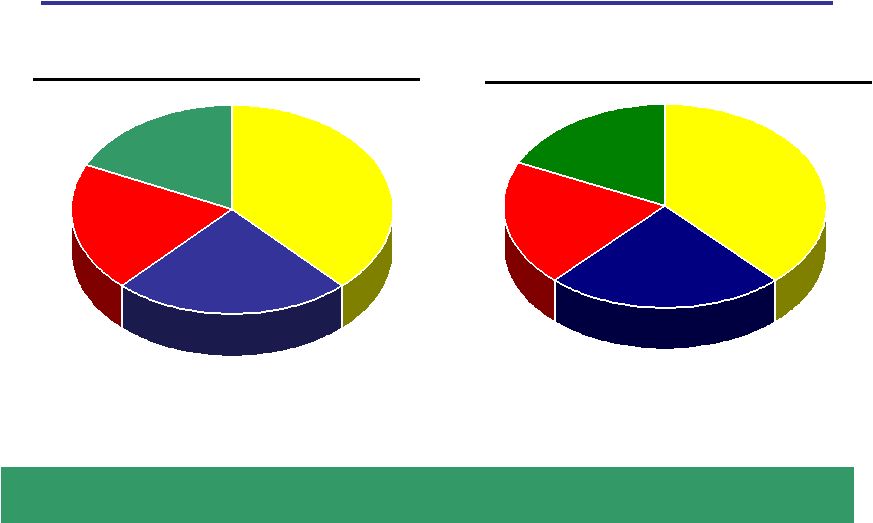 49 ADESA Whole Car Auctions strive to maximize the auction sales price for sellers by effectively and efficiently transferring the vehicles, paperwork and funds as quickly as possible. 2006 Whole Car Suppliers OEM Captive Finance 22% OEM 15% Dealer 37% Fleet/Lease 26% 2007 Whole Car Suppliers OEM 18% Dealer 38% Fleet/Lease 24% OEM Captive Finance 20% |
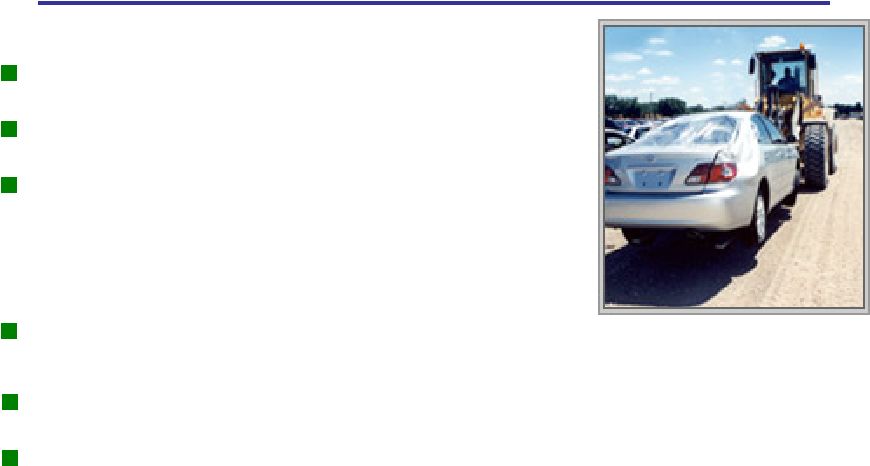
 50 IAAI Salvage • One of only two salvage auctioneers with a national footprint: - Operates 145 facilities in 44 states and 6 provinces in Canada - Serves 74 of top 75 U.S. metropolitan markets • Hybrid auction format, combining Internet and live auctions: - Leads to higher proceeds for suppliers - Increases international buyers • Provides wide array of value-added total-loss services that drive efficient vehicle remarketing: Auctions strive to maximize the auction sales price for insurance company sellers and reduce their administrative costs and claim recovery cycle time. - Tracking systems and real-time status reports through CSA Today - Vehicle inspection centers operated by insurance companies at salvage auction sites Dismantlers 65%–70% Rebuilders/ Resellers 25%–30% Recyclers 5% 2007 Salvage Buyers |
 51 AFC • Specializes in providing floorplan financing to independent dealers – Typical loan terms are 30 to 60 days and are secured by vehicle – Significant portion of revenue from fees • Network of 91 loan production offices services over 600 auctions • Diverse customer base with no significant concentration – Approximately 9,000 customers • Low credit risk – Centralized credit decisions using proprietary scoring model with additional corporate oversight – Perfected security interest and personal guaranty from principals of independent dealers • Low-cost, reliable funding through bankruptcy-remote, off-balance sheet securitization conduit – Utilized to finance over 60% of receivables Facilitates growth of vehicle sales at auction and allows ADESA and IAAI to have larger role in entire vehicle redistribution industry. $802.6 $736.2 $619.0 $552.9 Total A/R (principal) 2007 2006 2005 2004 3.1% $17.2 1.1% 2.9% 2.2% 2.8% Net Write-offs to Total A/R $23.0 $16.5 $17.3 Net Write-offs 1.2% 0.6% 1.0% >60 days to Total A/R Dollars in millions |
 52 Major Initiatives Project Pride Salvage Integration Acquisitions & Relocations Whole Car Market Share Gains |
 53 Project Pride Whole car initiative led by management in tandem with Synergetics 3 regionally focused teams implementing the “MAP” at all locations Roll-out commenced Q4 6 sites completed to date 30 additional sites scheduled for 2008 Cost savings of $4.6M achieved |
 54 Salvage Integration All U.S. Impact sites integrated Canada integration in 2008 Integration of recently acquired branches to be completed in 2008 Redundant overhead eliminated Developing shared sites with ADESA Auctions Now offering AFC financing to qualified buyers |
 55 Acquisitions 2007 2008 *Syracuse, NY *Las Vegas, NV *Fargo, ND *York, PA *Sioux Falls, SD *Verastar *Quebec City *Dent Demon, LLC North Carolina (5 sites) Tennessee (3 sites) Georgia (2 sites) Alabama (1 site) |
 56 Relocations Kansas City, KS Toronto, CA (Salvage) Dallas, TX Phoenix, AZ |
 57 Significant institutional customer wins Substantial improvement of e-business systems Site expansions & improvements in meeting customer needs Improved business information systems to enhance customer reporting Increased dealer consignment sales Whole Car Market Share Gains |
58 Investor Update Financial Review |
 59 Long-Term Debt Structure $ in Millions Description Amount Rate Maturity Term B Loan - Hedged* 800.0 $ 5.34% + 225 Term B Loan - Unhedged 757.2 Libor + 225 Senior Credit Facility 1,557.2 $ 2013 Floating Rate Senior Notes 150.0 $ Libor + 400 2014 Fixed Rate Senior Notes 450.0 8.75% 2014 Senior Subordinated Notes 425.0 10.00% 2015 Senior Notes 1,025.0 $ Total Long-Term Debt** 2,582.2 $ Net Available Cash (81.6) Net Debt 2,500.6 $ LTM PF Adjusted EBITDA at Dec. 31, 2007 405.2 $ *** Total Leverage Ratio (Net Debt) 6.17x * 2-year hedge ** Excludes $34.5M capital lease obligation *** As deemed per the Company's credit agreement |
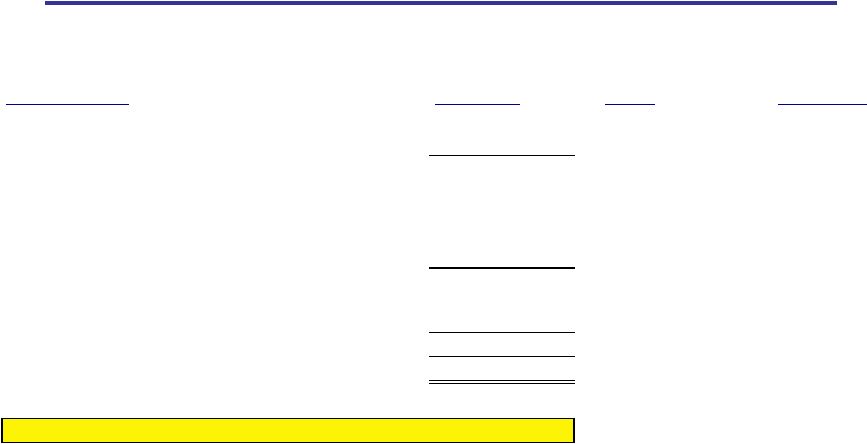
 60 Q4 Adjusted EBITDA ¹ KAR Holdings, Inc. Financial Highlights - Consolidated 1 As defined in the Company’s senior credit facility; however, results have been adjusted to eliminate pro forma adjustments. $362 $398 $0 $100 $200 $300 $400 $500 Q4 2006 Q4 2007 10% Q4 Revenue $80 $88 $0 $20 $40 $60 $80 $100 $120 Q4 2006 Q4 2007 $1,589 $1,436 $0 $200 $400 $600 $800 $1,000 $1,200 $1,400 $1,600 $1,800 2006 2007 Annual Revenue Annual Adjusted EBITDA ¹ $353 $396 $0 $150 $300 $450 2006 2007 10% 11% 12% |
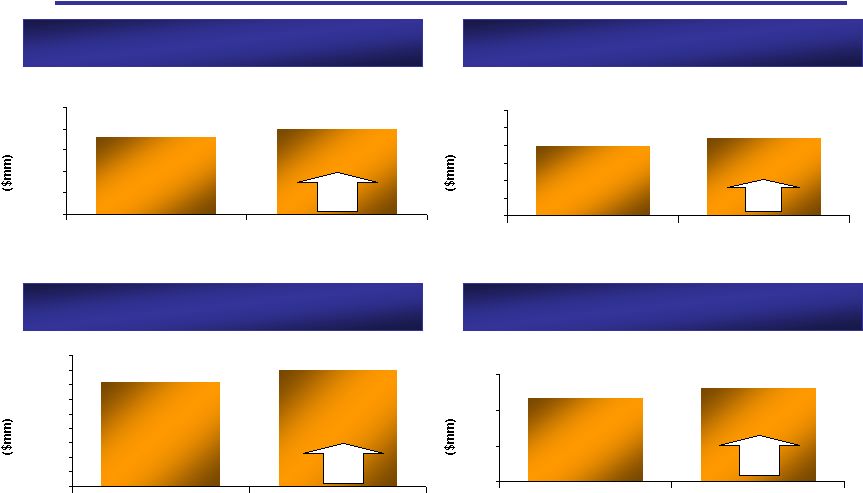
 61 KAR Holdings, Inc. Financial Highlights - Whole Car Annual Revenue Annual Adjusted EBITDA ¹ 8% 13% 1 As defined in the Company’s senior credit facility; however, results have been adjusted to eliminate pro forma adjustments. $965 $854 $0 $400 $800 $1,200 2006 2007 $213 $231 $0 $50 $100 $150 $200 $250 2006 2007 |
 62 KAR Holdings, Inc. Financial Highlights - IAAI Annual Revenue Annual Adjusted EBITDA ¹ 10% 1 As defined in the Company’s senior credit facility; however, results have been adjusted to eliminate pro forma adjustments. $438 $483 $0 $200 $400 $600 2006 2007 $85 $112 $0 $50 $100 $150 2006 2007 32% |
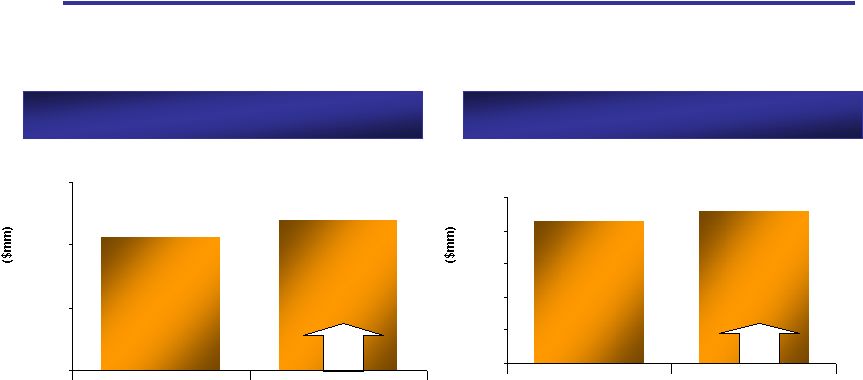
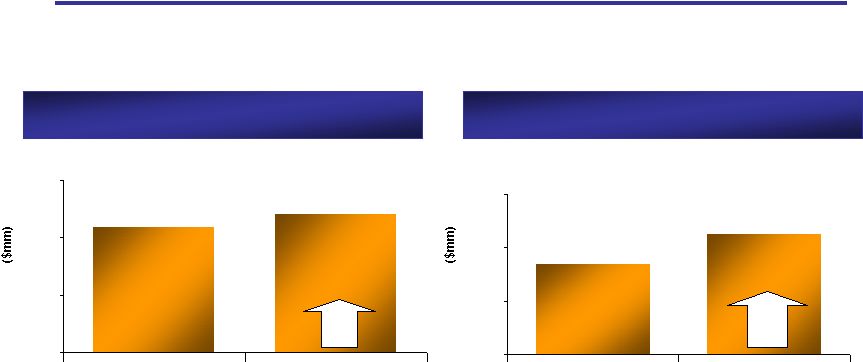
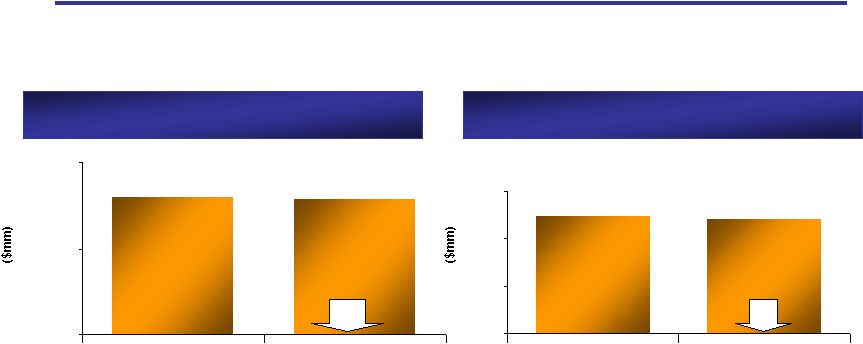 63 KAR Holdings, Inc. Financial Highlights - AFC 1 As defined in the Company’s senior credit facility Annual Revenue Annual Adjusted EBITDA ¹ 2% 4% $144 $141 $0 $90 $180 2006 2007 $100 $96 $0 $40 $80 $120 2006 2007 |
64 Investment Highlights • Stable Industry Fundamentals • Recurring Revenue Stream • Leading Market Positions with Broad Geographic Footprint • Strong Competitive Position • Consistent Historical Financial Performance • Established Relationships with Vehicle Suppliers & Buyers • Increasing Market Share via Organic Growth & Acquisitions • Experienced and Committed Management Team • Strong Cash Flow Generation |
65 AGENDA • Industry Update - Tom Kontos • Corporate Update - Eric Loughmiller • Q&A |
 66 Appendix Discussion of Non-GAAP Measures: Pro forma combined presentation of segment results – This appendix includes pro forma combined presentations of the Company’s segment results for the fiscal years ended December 31, 2007 and 2006 as well as for the fourth quarter of 2006. The pro forma segment results for the year ended December 31, 2007 are based on ADESA and IAAI’s unaudited financial statements for the periods from January 1, 2007 to April 19, 2007 and KAR Holdings’ unaudited financial statements for the period from January 1, 2007 to December 31, 2007, as adjusted to combine the financial statements of ADESA Impact and IAAI on a historical basis. The unaudited pro forma combined segment results of operations for the quarter and year ended December 31, 2006 are representative of the results of ADESA and IAAI. KAR Holdings had no operations during the period of January 1, 2007 to April 19, 2007. The Company's management believes that presenting pro forma segment results is important for comparing results between reporting periods. The pro forma information can assist in making meaningful period- over-period comparisons and in identifying operating trends that might otherwise be masked or distorted. The most directly comparable financial measure calculated and presented in accordance with GAAP is net income (loss). EBITDA, Adjusted EBITDA and Adjusted EBITDA per the Credit Agreement – The Company’s management believes that EBITDA is a useful supplement and meaningful indicator of earnings performance to be used by its investors, financial analysts and others to analyze the Company’s financial performance and results of operations over time. Management believes that the inclusion of supplementary adjustments to EBITDA applied in presenting Adjusted EBITDA is appropriate to provide additional information to investors about one of the principal internal measures of performance used by the Company. Management uses the Adjusted EBITDA measure to evaluate the performance of the Company and to evaluate results relative to incentive compensation targets. Adjusted EBITDA per the Credit Agreement adds the pro forma impact of recent acquisitions and the pro forma cost savings per the credit agreement to Adjusted EBITDA. This measure is used by the Company’s creditors in assessing debt covenant compliance and management believes its inclusion is appropriate to provide additional information to investors about certain covenants required pursuant to the Company’s senior secured credit facility and notes. The most directly comparable financial performance measure calculated and presented in accordance with GAAP is net income (loss). A reconciliation of net income (loss) to EBITDA, Adjusted EBITDA and Adjusted EBITDA per the Credit Agreement is contained in this appendix. |
 67 KAR Holdings, Inc. Adjusted EBITDA Reconciliation For the Quarters Ended December 31, 2007 and 2006 EBITDA and Adjusted EBITDA, as presented herein, are supplemental measures of the Company’s performance that are not required by, or presented in accordance with, generally accepted accounting principles in the United States (“GAAP”). They are not measurements of the Company’s financial performance under GAAP and should not be considered as alternatives to revenues, net income (loss) or any other performance measures derived in accordance with GAAP or as alternatives to cash flow from operating activities as measures of the Company’s liquidity. EBITDA and Adjusted EBITDA measures have limitations as analytical tools, and should not be considered in isolation, or as a substitute for analysis of the results as reported under GAAP. These measures may not be comparable to similarly titled measures reported by other companies. Three Months Ended December 31, 2007 KAR ADESA IAAI Total Net income (loss) (40.2) $ 15.9 $ 1.6 $ 17.5 $ Add back: discontinued operations 0.1 0.1 - 0.1 Income from continuing operations (40.1) 16.0 1.6 17.6 Add back: Income taxes (12.1) 12.5 2.5 15.0 Interest expense, net of interest income 56.0 4.7 9.1 13.8 Depreciation and amortization 61.3 11.3 8.1 19.4 EBITDA 65.1 44.5 21.3 65.8 Nonrecurring charges 12.3 4.0 1.2 5.2 Nonrecurring transaction charges - 6.1 - 6.1 Noncash charges 9.5 2.0 0.5 2.5 Advisory services 0.8 - 0.2 0.2 Adjusted EBITDA 87.7 $ 56.6 $ 23.2 $ 79.8 $ Pro Forma Combined Three Months Ended December 31, 2006 |
 68 KAR Holdings, Inc. Adjusted EBITDA Reconciliation For the Year Ended December 31, 2007 EBITDA, Adjusted EBITDA and Adjusted EBITDA per the Credit Agreement, as presented herein, are supplemental measures of the Company’s performance that are not required by, or presented in accordance with, generally accepted accounting principles in the United States (“GAAP”). They are not measurements of the Company’s financial performance under GAAP and should not be considered as alternatives to revenues, net income (loss) or any other performance measures derived in accordance with GAAP or as alternatives to cash flow from operating activities as measures of the Company’s liquidity. EBITDA, Adjusted EBITDA and Adjusted EBITDA per the Credit Agreement measures have limitations as analytical tools, and should not be considered in isolation, or as a substitute for analysis of the results as reported under GAAP. These measures may not be comparable to similarly titled measures reported by other companies. ADESA IAAI AFC Holding Company Consolidated Net income (loss) 64.8 $ 7.1 $ 42.7 $ (132.3) $ (17.7) $ Add back: discontinued operations 0.3 - - - 0.3 Income from continuing operations 65.1 7.1 42.7 (132.3) (17.4) Add back: Income taxes 53.1 6.9 28.0 (67.2) 20.8 Interest expense, net of interest income (0.5) 9.6 - 163.1 172.2 Depreciation and amortization 80.2 49.4 17.8 4.5 151.9 Intercompany 19.2 22.1 1.8 (43.1) - EBITDA 217.1 95.1 90.3 (75.0) 327.5 Nonrecurring charges 7.3 11.3 4.0 1.4 24.0 Nonrecurring transaction charges 3.5 0.7 0.7 19.9 24.8 Noncash charges 2.6 5.2 0.8 8.0 16.6 Advisory services - 0.1 - 2.5 2.6 Adjusted EBITDA 230.5 $ 112.4 $ 95.8 $ (43.2) $ 395.5 $ Pro forma impact of recent acquisitions 4.7 Pro forma cost savings per the credit agreement 5.0 Adjusted EBITDA per the credit agreement 405.2 $ |
 69 KAR Holdings, Inc. Adjusted EBITDA Reconciliation For the Year Ended December 31, 2006 EBITDA and Adjusted EBITDA, as presented herein, are supplemental measures of the Company’s performance that are not required by, or presented in accordance with, generally accepted accounting principles in the United States (“GAAP”). They are not measurements of the Company’s financial performance under GAAP and should not be considered as alternatives to revenues, net income (loss) or any other performance measures derived in accordance with GAAP or as alternatives to cash flow from operating activities as measures of the Company’s liquidity. EBITDA and Adjusted EBITDA measures have limitations as analytical tools, and should not be considered in isolation, or as a substitute for analysis of the results as reported under GAAP. These measures may not be comparable to similarly titled measures reported by other companies. ADESA IAAI AFC Holding Company Consolidated Net income (loss) 89.7 $ 5.8 $ 57.2 $ (33.6) $ 119.1 $ Add back: discontinued operations 0.5 - - - 0.5 Income from continuing operations 90.2 5.8 57.2 (33.6) 119.6 Add back: Income taxes 56.4 6.3 32.7 (19.4) 76.0 Interest expense, net of interest income (0.3) 30.2 - 21.2 51.1 Depreciation and amortization 37.8 28.3 3.5 0.8 70.4 Intercompany reallocations 21.5 3.4 4.7 (29.6) - EBITDA 205.6 74.0 98.1 (60.6) 317.1 Nonrecurring charges 3.5 6.1 0.5 7.3 17.4 Nonrecurring transaction charges - - - 6.1 6.1 Noncash charges 4.0 4.2 0.9 2.5 11.6 Advisory services - 0.6 - - 0.6 Adjusted EBITDA 213.1 $ 84.9 $ 99.5 $ (44.7) $ 352.8 $ The intercompany reallocations represent certain human resources and information technology costs that ADESA had historically allocated to its segments and certain professional fees historically recorded at the segments. These reallocations are necessary to make 2006 results comparable to 2007 results. |