
Q2 2017 & Year-to-Date Earnings Slides August 8, 2017
Forward-Looking Statements This presentation includes forward-looking statements as that term is defined in the Private Securities Litigation Reform Act of 1995. Such forward looking statements are subject to certain risks, trends, and uncertainties that could cause actual results to differ materially from those projected, expressed or implied by such forward-looking statements. Many of these risk factors are outside of the company’s control, and as such, they involve risks which are not currently known to the company that could cause actual results to differ materially from forecasted results. Factors that could cause or contribute to such differences include those matters disclosed in the company’s Securities and Exchange Commission filings. The forward-looking statements in this document are made as of the date hereof and the company does not undertake to update its forward-looking statements. 2
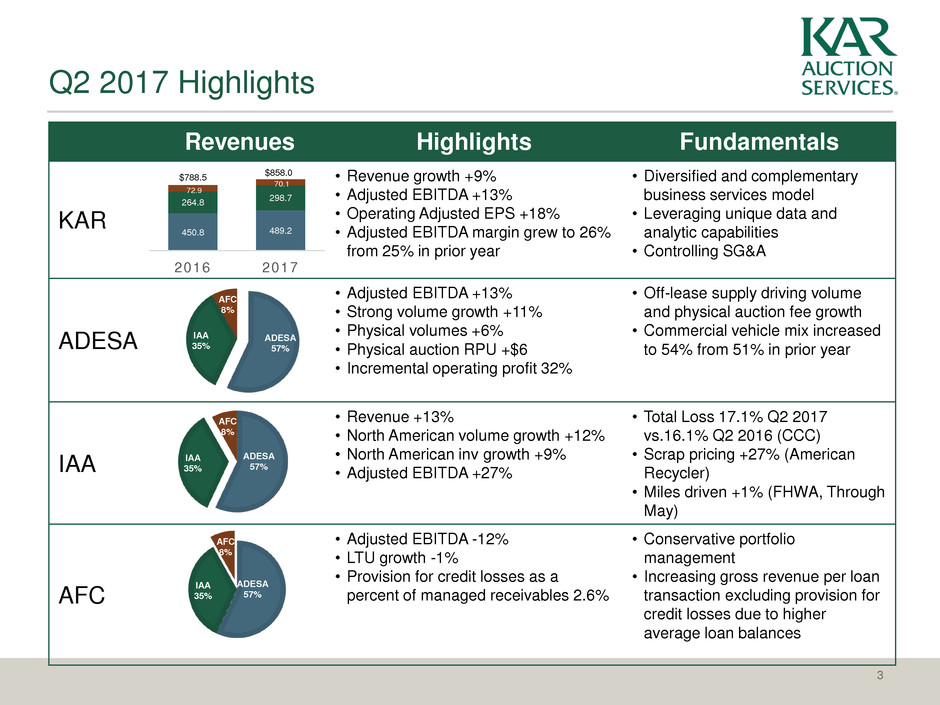
Q2 2017 Highlights 3 Revenues Highlights Fundamentals KAR • Revenue growth +9% • Adjusted EBITDA +13% • Operating Adjusted EPS +18% • Adjusted EBITDA margin grew to 26% from 25% in prior year • Diversified and complementary business services model • Leveraging unique data and analytic capabilities • Controlling SG&A ADESA • Adjusted EBITDA +13% • Strong volume growth +11% • Physical volumes +6% • Physical auction RPU +$6 • Incremental operating profit 32% • Off-lease supply driving volume and physical auction fee growth • Commercial vehicle mix increased to 54% from 51% in prior year IAA • Revenue +13% • North American volume growth +12% • North American inv growth +9% • Adjusted EBITDA +27% • Total Loss 17.1% Q2 2017 vs.16.1% Q2 2016 (CCC) • Scrap pricing +27% (American Recycler) • Miles driven +1% (FHWA, Through May) AFC • Adjusted EBITDA -12% • LTU growth -1% • Provision for credit losses as a percent of managed receivables 2.6% • Conservative portfolio management • Increasing gross revenue per loan transaction excluding provision for credit losses due to higher average loan balances ADESA 57% IAA 35% AFC 8% ADESA 57% IAA 35% AFC 8% ADESA 57% IAA 35% AFC 8% 450.8 489.2 264.8 298.7 72.9 70.1 2016 2017 $788.5 $858.0
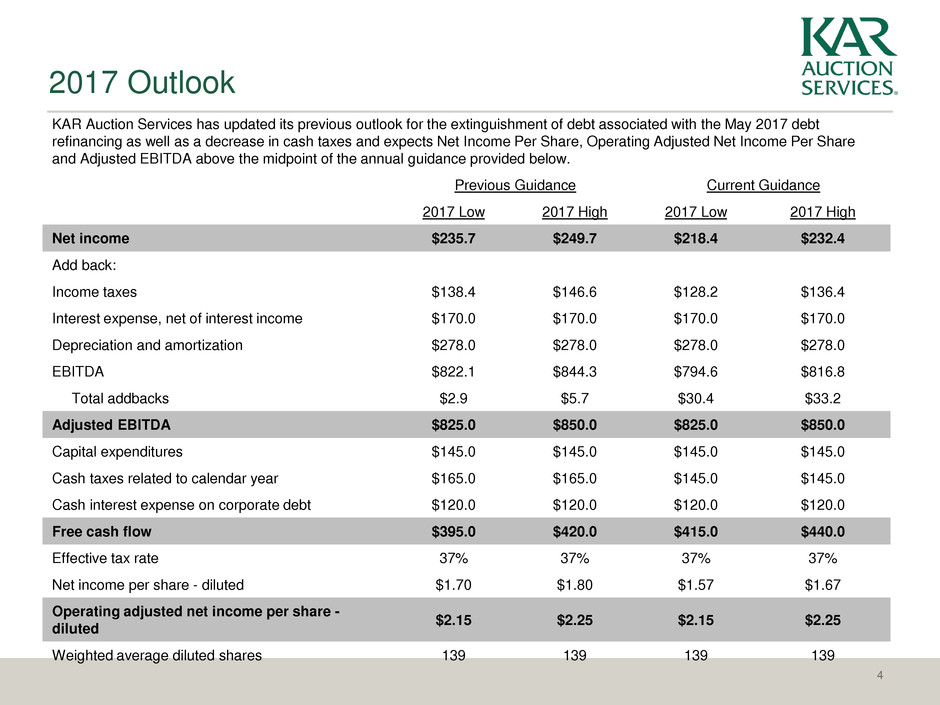
2017 Outlook 4 KAR Auction Services has updated its previous outlook for the extinguishment of debt associated with the May 2017 debt refinancing as well as a decrease in cash taxes and expects Net Income Per Share, Operating Adjusted Net Income Per Share and Adjusted EBITDA above the midpoint of the annual guidance provided below. Previous Guidance Current Guidance 2017 Low 2017 High 2017 Low 2017 High Net income $235.7 $249.7 $218.4 $232.4 Add back: Income taxes $138.4 $146.6 $128.2 $136.4 Interest expense, net of interest income $170.0 $170.0 $170.0 $170.0 Depreciation and amortization $278.0 $278.0 $278.0 $278.0 EBITDA $822.1 $844.3 $794.6 $816.8 Total addbacks $2.9 $5.7 $30.4 $33.2 Adjusted EBITDA $825.0 $850.0 $825.0 $850.0 Capital expenditures $145.0 $145.0 $145.0 $145.0 Cash taxes related to calendar year $165.0 $165.0 $145.0 $145.0 Cash interest expense on corporate debt $120.0 $120.0 $120.0 $120.0 Free cash flow $395.0 $420.0 $415.0 $440.0 Effective tax rate 37% 37% 37% 37% Net income per share - diluted $1.70 $1.80 $1.57 $1.67 Operating adjusted net income per share - diluted $2.15 $2.25 $2.15 $2.25 Weighted average diluted shares 139 139 139 139

Key Operating Metrics 5 2Q17 2Q16 ADESA Physical Vehicles Sold Growth1 1% 3% Online Only Vehicles Sold Growth 24% 29% Physical RPU Growth 1% 8% IAA Vehicles Sold Growth (includes HBC) 11% 6% Inventory Growth (excludes HBC) 9% 11% RPU Growth (includes HBC) 2% 1% AFC LTU Growth -1% 10% Provision for Credit Losses 2.6% 1.3% Revenue per loan transaction excluding “Other service revenue” $148 $154 Revenue per loan transaction before provision for credit losses $175 $167 1 Excluding acquisitions
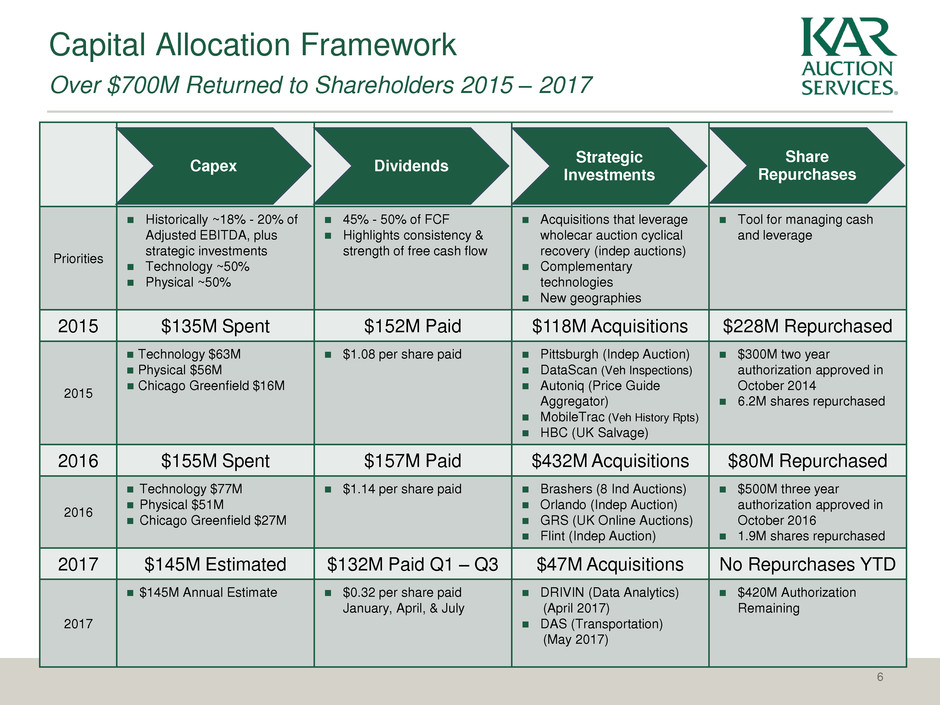
Capital Allocation Framework Over $700M Returned to Shareholders 2015 – 2017 6 Priorities Historically ~18% - 20% of Adjusted EBITDA, plus strategic investments Technology ~50% Physical ~50% 45% - 50% of FCF Highlights consistency & strength of free cash flow Acquisitions that leverage wholecar auction cyclical recovery (indep auctions) Complementary technologies New geographies Tool for managing cash and leverage 2015 $135M Spent $152M Paid $118M Acquisitions $228M Repurchased 2015 Technology $63M Physical $56M Chicago Greenfield $16M $1.08 per share paid Pittsburgh (Indep Auction) DataScan (Veh Inspections) Autoniq (Price Guide Aggregator) MobileTrac (Veh History Rpts) HBC (UK Salvage) $300M two year authorization approved in October 2014 6.2M shares repurchased 2016 $155M Spent $157M Paid $432M Acquisitions $80M Repurchased 2016 Technology $77M Physical $51M Chicago Greenfield $27M $1.14 per share paid Brashers (8 Ind Auctions) Orlando (Indep Auction) GRS (UK Online Auctions) Flint (Indep Auction) $500M three year authorization approved in October 2016 1.9M shares repurchased 2017 $145M Estimated $132M Paid Q1 – Q3 $47M Acquisitions No Repurchases YTD 2017 $145M Annual Estimate $0.32 per share paid January, April, & July DRIVIN (Data Analytics) (April 2017) DAS (Transportation) (May 2017) $420M Authorization Remaining Dividends Strategic Investments Share Repurchases Capex
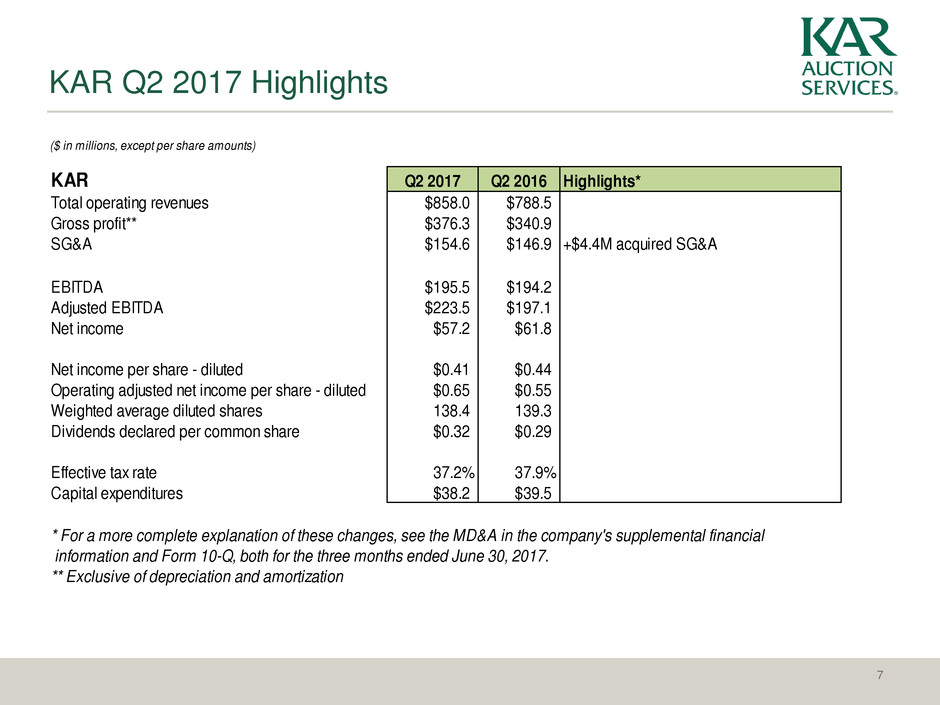
KAR Q2 2017 Highlights 7 ($ in millions, except per share amounts) KAR Q2 2017 Q2 2016 Highlights* Total operating revenues $858.0 $788.5 Gross profit** $376.3 $340.9 SG&A $154.6 $146.9 +$4.4M acquired SG&A EBITDA $195.5 $194.2 Adjusted EBITDA $223.5 $197.1 Net income $57.2 $61.8 Net income per share - diluted $0.41 $0.44 Operating adjusted net income per share - diluted $0.65 $0.55 Weighted average diluted shares 138.4 139.3 Dividends declared per common share $0.32 $0.29 Effective tax rate 37.2% 37.9% Cap tal expenditures $38.2 $39.5 * For a more complete explanation of these changes, see the MD&A in the company's supplemental financial information and Form 10-Q, both for the three months ended June 30, 2017. ** Exclusive of depreciation and amortization
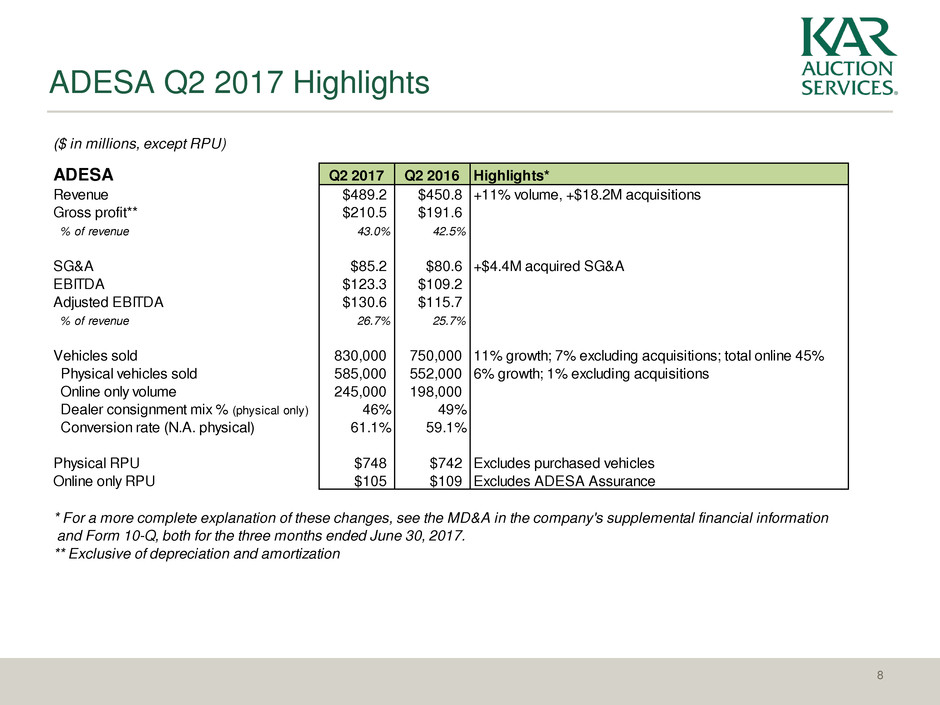
ADESA Q2 2017 Highlights 8 ($ in millions, except RPU) ADESA Q2 2017 Q2 2016 Highlights* Revenue $489.2 $450.8 +11% volume, +$18.2M acquisitions Gross profit** $210.5 $191.6 % of revenue 43.0% 42.5% SG&A $85.2 $80.6 +$4.4M acquired SG&A EBITDA $123.3 $109.2 Adjusted EBITDA $130.6 $115.7 % of revenue 26.7% 25.7% Vehicles sold 830,000 750,000 11% growth; 7% excluding acquisitions; total online 45% Physical vehicles sold 585,000 552,000 6% growth; 1% excluding acquisitions Online only volume 245,000 198,000 Dealer consignment mix % (physical only) 46% 49% Conversion rate (N.A. physical) 61.1% 59.1% Physical RPU $748 $742 Excludes purchased vehicles Online only RPU $105 $109 Excludes ADESA Assurance * For a more complete explanation of these changes, see the MD&A in the company's supplemental financial information and Form 10-Q, both for the three months ended June 30, 2017. ** Exclusive of depreciation and amortization
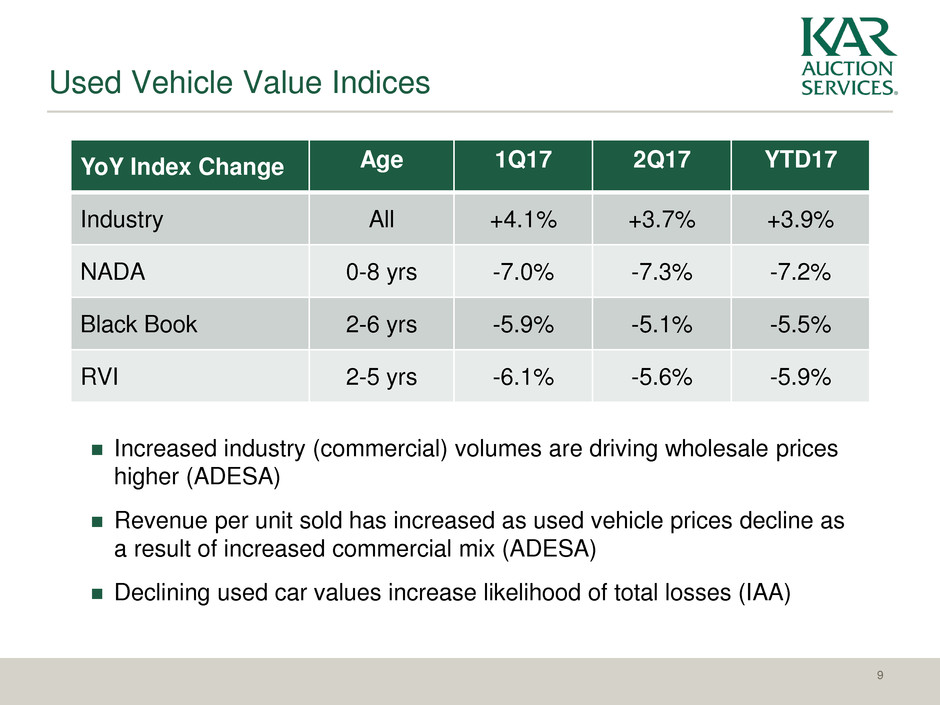
Increased industry (commercial) volumes are driving wholesale prices higher (ADESA) Revenue per unit sold has increased as used vehicle prices decline as a result of increased commercial mix (ADESA) Declining used car values increase likelihood of total losses (IAA) YoY Index Change Age 1Q17 2Q17 YTD17 Industry All +4.1% +3.7% +3.9% NADA 0-8 yrs -7.0% -7.3% -7.2% Black Book 2-6 yrs -5.9% -5.1% -5.5% RVI 2-5 yrs -6.1% -5.6% -5.9% 9 Used Vehicle Value Indices

IAA Q2 2017 Highlights 10 ($ in millions) IAA Q2 2017 Q2 2016 Highlights* Revenue $298.7 $264.8 +11% volume, -$3.2M HBC, -$1.2M GBP currency Gross profit** $117.2 $97.5 % of revenue 39.2% 36.8% SG&A $27.5 $26.5 EBITDA $90.2 $71.0 Adjusted EBITDA $90.5 $71.4 % of revenue 30.3% 27.0% Vehicles sold 580,000 523,000 Inventory growth (N.A.) 9% 11% % Purchased contract vehicles 5% 6% * For a more complete explanation of these changes, see the MD&A in the company's supplemental financial information and Form 10-Q, both for the three months ended June 30, 2017. ** Exclusive of depreciation and amortization
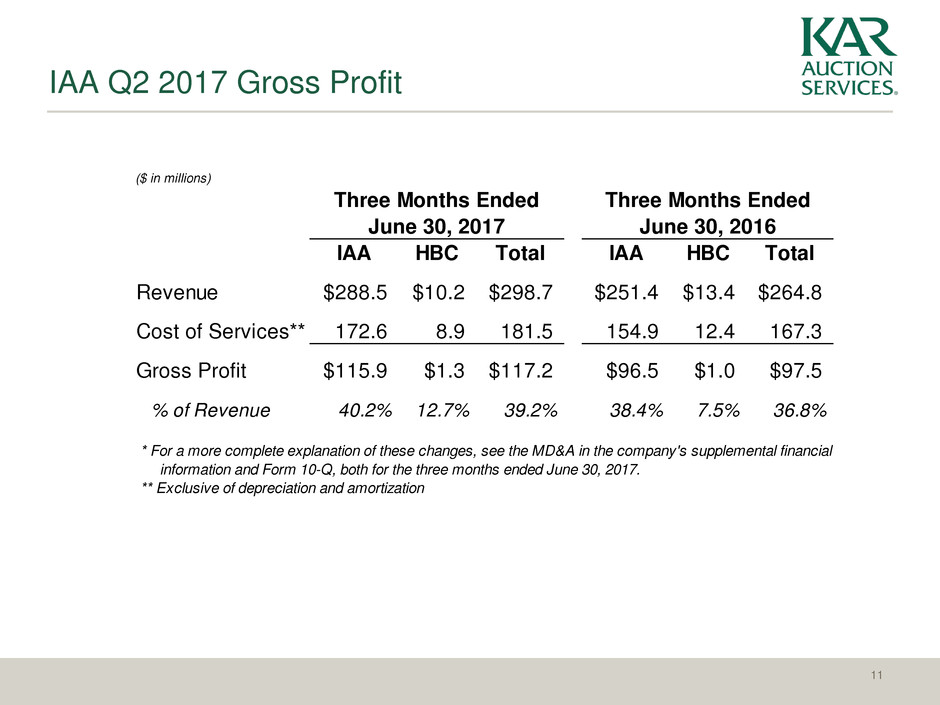
IAA Q2 2017 Gross Profit 11 ($ in millions) IAA HBC Total IAA HBC Total Revenue $288.5 $10.2 $298.7 $251.4 $13.4 $264.8 Cost of Services** 172.6 8.9 181.5 154.9 12.4 167.3 Gross Profit $115.9 $1.3 $117.2 $96.5 $1.0 $97.5 % of Revenue 40.2% 12.7% 39.2% 38.4% 7.5% 36.8% * For a more complete explanation of these changes, see the MD&A in the company's supplemental financial information and Form 10-Q, both for the three months ended June 30, 2017. ** Exclusive of depreciation and amortization Three Months Ended June 30, 2017 Three Months Ended June 30, 2016
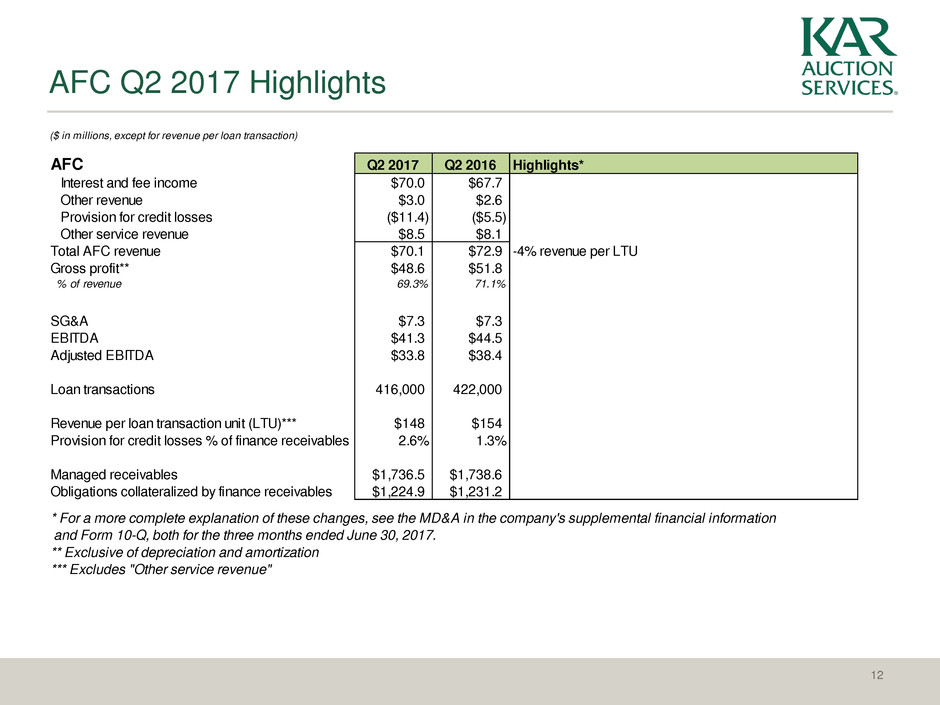
($ in millions, except for revenue per loan transaction) AFC Q2 2017 Q2 2016 Highlights* Interest and fee income $70.0 $67.7 Other revenue $3.0 $2.6 Provision for credit losses ($11.4) ($5.5) Other service revenue $8.5 $8.1 Total AFC revenue $70.1 $72.9 -4% revenue per LTU Gross profit** $48.6 $51.8 % of revenue 69.3% 71.1% SG&A $7.3 $7.3 EBITDA $41.3 $44.5 Adjusted EBITDA $33.8 $38.4 Loan transactions 416,000 422,000 Revenue per loan transaction unit (LTU)*** $148 $154 Provision for credit losses % of finance receivables 2.6% 1.3% Managed receivables $1,736.5 $1,738.6 Obligations collateralized by finance receivables $1,224.9 $1,231.2 * For a more complete explanation of these changes, see the MD&A in the company's supplemental financial information and Form 10-Q, both for the three months ended June 30, 2017. ** Exclusive of depreciation and amortization *** Excludes "Other service revenue" AFC Q2 2017 Highlights 12
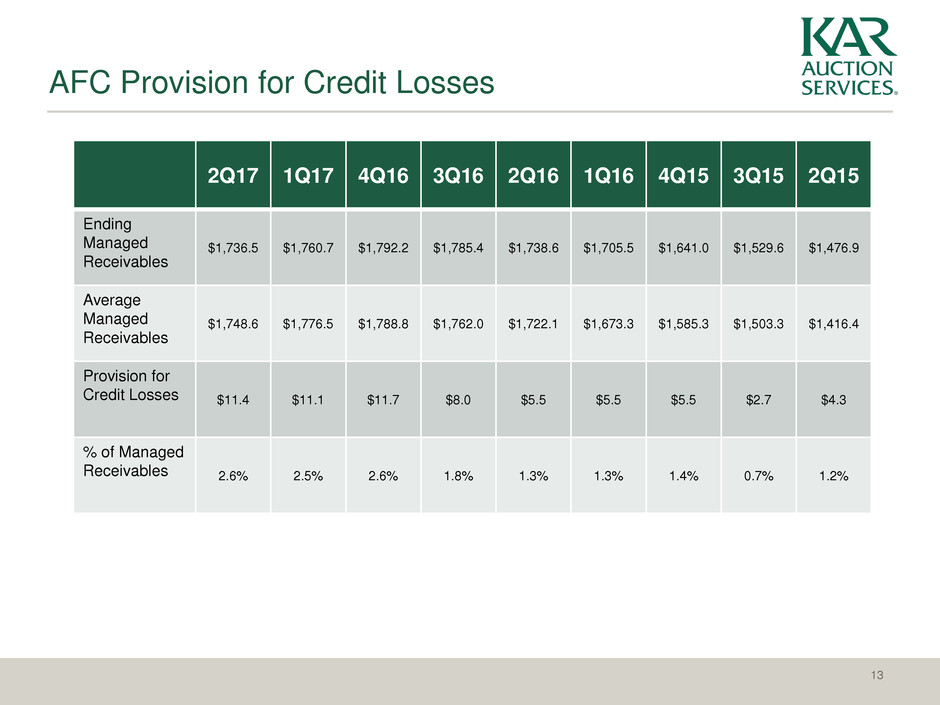
AFC Provision for Credit Losses 13 2Q17 1Q17 4Q16 3Q16 2Q16 1Q16 4Q15 3Q15 2Q15 Ending Managed Receivables $1,736.5 $1,760.7 $1,792.2 $1,785.4 $1,738.6 $1,705.5 $1,641.0 $1,529.6 $1,476.9 Average Managed Receivables $1,748.6 $1,776.5 $1,788.8 $1,762.0 $1,722.1 $1,673.3 $1,585.3 $1,503.3 $1,416.4 Provision for Credit Losses $11.4 $11.1 $11.7 $8.0 $5.5 $5.5 $5.5 $2.7 $4.3 % of Managed Receivables 2.6% 2.5% 2.6% 1.8% 1.3% 1.3% 1.4% 0.7% 1.2%

Year-to-Date Slides
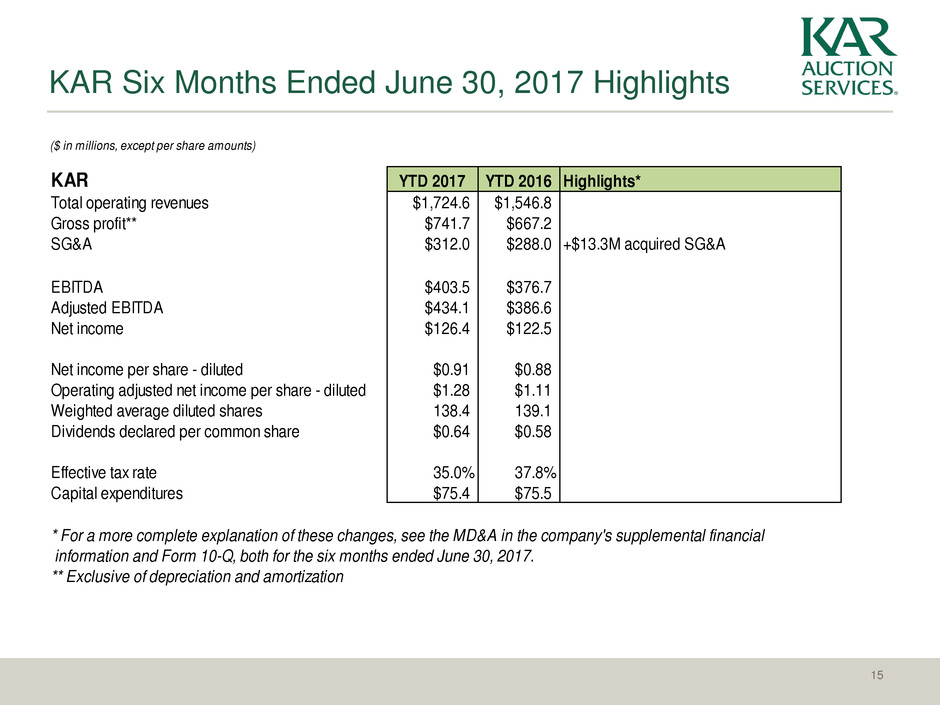
KAR Six Months Ended June 30, 2017 Highlights 15 ($ in millions, except per share amounts) KAR YTD 2017 YTD 2016 Highlights* Total operating revenues $1,724.6 $1,546.8 Gross profit** $741.7 $667.2 SG&A $312.0 $288.0 +$13.3M acquired SG&A EBITDA $403.5 $376.7 Adjusted EBITDA $434.1 $386.6 Net income $126.4 $122.5 Net income per share - diluted $0.91 $0.88 Operating adjusted net income per share - diluted $1.28 $1.11 Weighted average diluted shares 138.4 139.1 Dividends declared per common share $0.64 $0.58 Effective tax rate 35.0% 37.8% Capital expenditures $75.4 $75.5 * For a more complete explanation of these changes, see the MD&A in the company's supplemental financial information and Form 10-Q, both for the six months ended June 30, 2017. ** Exclusive of depreciation and amortization
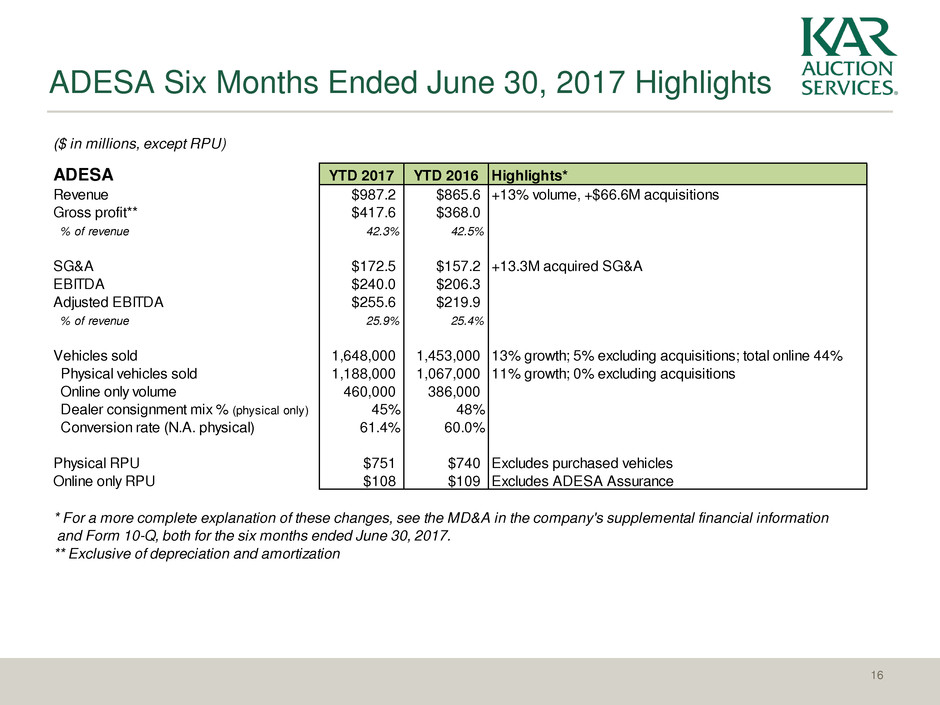
ADESA Six Months Ended June 30, 2017 Highlights 16 ($ in millions, except RPU) ADESA YTD 2017 YTD 2016 Highlights* Revenue $987.2 $865.6 +13% volume, +$66.6M acquisitions Gross profit** $417.6 $368.0 % of revenue 42.3% 42.5% SG&A $172.5 $157.2 +13.3M acquired SG&A EBITDA $240.0 $206.3 Adjusted EBITDA $255.6 $219.9 % of revenue 25.9% 25.4% Vehicles sold 1,648,000 1,453,000 13% growth; 5% excluding acquisitions; total online 44% Physical vehicles sold 1,188,000 1,067,000 11% growth; 0% excluding acquisitions Online only volume 460,000 386,000 Dealer consignment mix % (physical only) 45% 48% Conversion rate (N.A. physical) 61.4% 60.0% Physical RPU $751 $740 Excludes purchased vehicles Online only RPU $108 $109 Excludes ADESA Assurance * For a more complete explanation of these changes, see the MD&A in the company's supplemental financial information and Form 10-Q, both for the six months ended June 30, 2017. ** Exclusive of depreciation and amortization
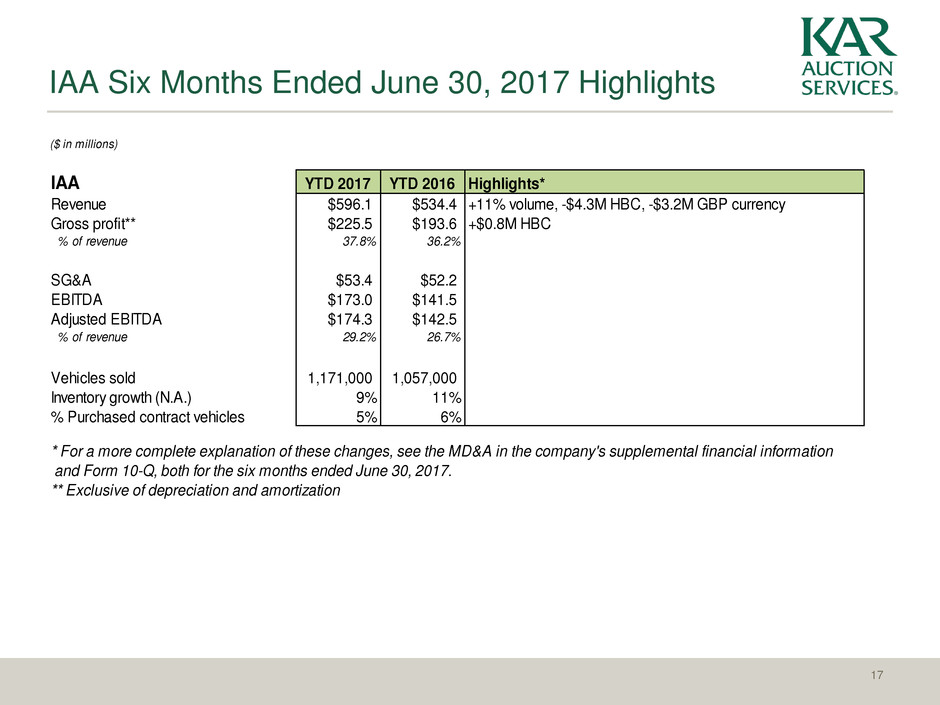
IAA Six Months Ended June 30, 2017 Highlights 17 ($ in millions) IAA YTD 2017 YTD 2016 Highlights* Revenue $596.1 $534.4 +11% volume, -$4.3M HBC, -$3.2M GBP currency Gross profit** $225.5 $193.6 +$0.8M HBC % of revenue 37.8% 36.2% SG&A $53.4 $52.2 EBITDA $173.0 $141.5 Adjusted EBITDA $174.3 $142.5 % of revenue 29.2% 26.7% Vehicles sold 1,171,000 1,057,000 Inventory growth (N.A.) 9% 11% % Purchased contract vehicles 5% 6% * For a more complete explanation of these changes, see the MD&A in the company's supplemental financial information and Form 10-Q, both for the six months ended June 30, 2017. ** Exclusive of depreciation and amortization

IAA Six Months Ended June 30, 2017 Gross Profit 18 ($ in millions) IAA HBC Total IAA HBC Total Revenue $573.1 $23.0 $596.1 $507.1 $27.3 $534.4 Cost of Services** 350.8 19.8 370.6 315.9 24.9 340.8 Gross Profit $222.3 $3.2 $225.5 $191.2 $2.4 $193.6 % of Revenue 38.8% 13.9% 37.8% 37.7% 8.8% 36.2% * For a more complete explanation of these changes, see the MD&A in the company's supplemental financial information and Form 10-Q, both for the six months ended June 30, 2017. ** Exclusive of depreciation and amortization Six Months Ended June 30, 2017 Six Months Ended June 30, 2016
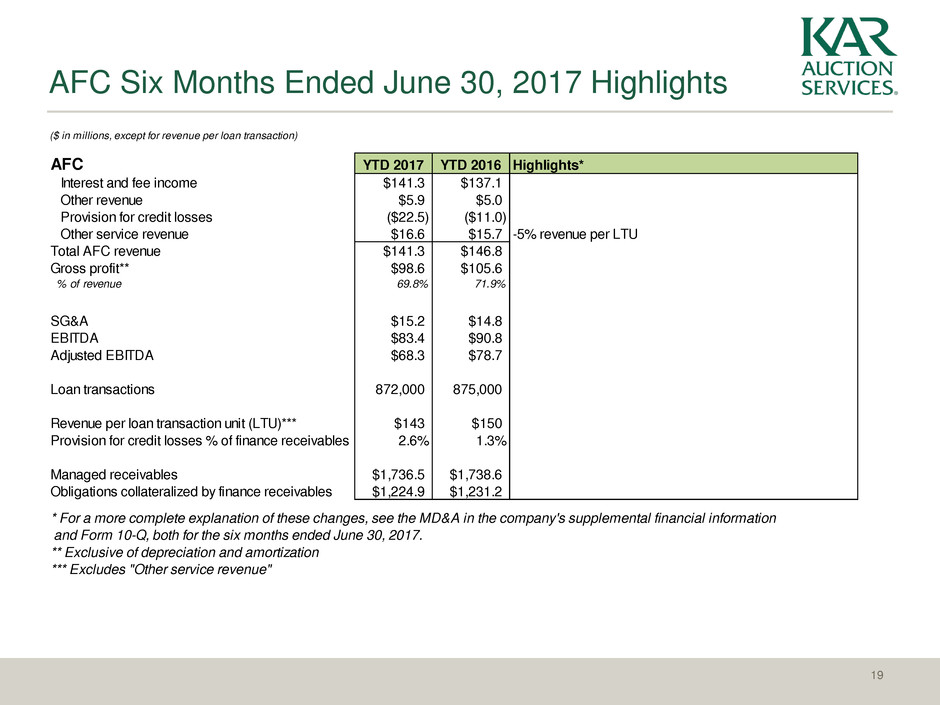
($ in millions, except for revenue per loan transaction) AFC YTD 2017 YTD 2016 Highlights* Interest and fee income $141.3 $137.1 Other revenue $5.9 $5.0 Provision for credit losses ($22.5) ($11.0) Other service revenue $16.6 $15.7 -5% revenue per LTU Total AFC revenue $141.3 $146.8 Gross profit** $98.6 $105.6 % of revenue 69.8% 71.9% SG&A $15.2 $14.8 EBITDA $83.4 $90.8 Adjusted EBITDA $68.3 $78.7 Loan transactions 872,000 875,000 Revenue per loan transaction unit (LTU)*** $143 $150 Provision for credit losses % of finance receivables 2.6% 1.3% Managed receivables $1,736.5 $1,738.6 Obligations collateralized by finance receivables $1,224.9 $1,231.2 * For a more complete explanation of these changes, see the MD&A in the company's supplemental financial information and Form 10-Q, both for the six months ended June 30, 2017. ** Exclusive of depreciation and amortization *** Excludes "Other service revenue" AFC Six Months Ended June 30, 2017 Highlights 19

Appendix
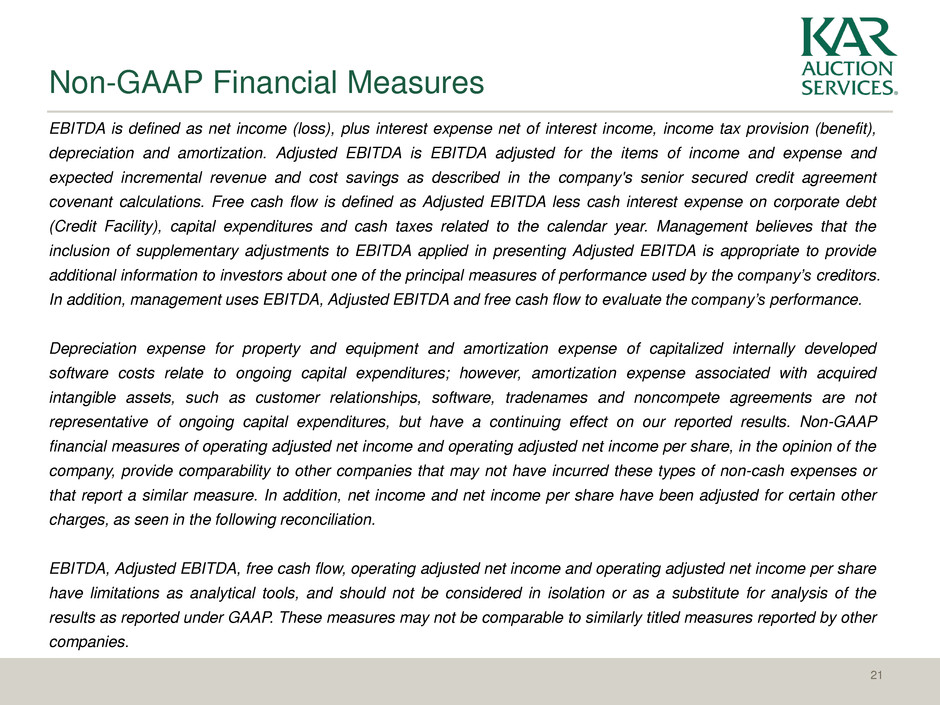
EBITDA is defined as net income (loss), plus interest expense net of interest income, income tax provision (benefit), depreciation and amortization. Adjusted EBITDA is EBITDA adjusted for the items of income and expense and expected incremental revenue and cost savings as described in the company's senior secured credit agreement covenant calculations. Free cash flow is defined as Adjusted EBITDA less cash interest expense on corporate debt (Credit Facility), capital expenditures and cash taxes related to the calendar year. Management believes that the inclusion of supplementary adjustments to EBITDA applied in presenting Adjusted EBITDA is appropriate to provide additional information to investors about one of the principal measures of performance used by the company’s creditors. In addition, management uses EBITDA, Adjusted EBITDA and free cash flow to evaluate the company’s performance. Depreciation expense for property and equipment and amortization expense of capitalized internally developed software costs relate to ongoing capital expenditures; however, amortization expense associated with acquired intangible assets, such as customer relationships, software, tradenames and noncompete agreements are not representative of ongoing capital expenditures, but have a continuing effect on our reported results. Non-GAAP financial measures of operating adjusted net income and operating adjusted net income per share, in the opinion of the company, provide comparability to other companies that may not have incurred these types of non-cash expenses or that report a similar measure. In addition, net income and net income per share have been adjusted for certain other charges, as seen in the following reconciliation. EBITDA, Adjusted EBITDA, free cash flow, operating adjusted net income and operating adjusted net income per share have limitations as analytical tools, and should not be considered in isolation or as a substitute for analysis of the results as reported under GAAP. These measures may not be comparable to similarly titled measures reported by other companies. Non-GAAP Financial Measures 21
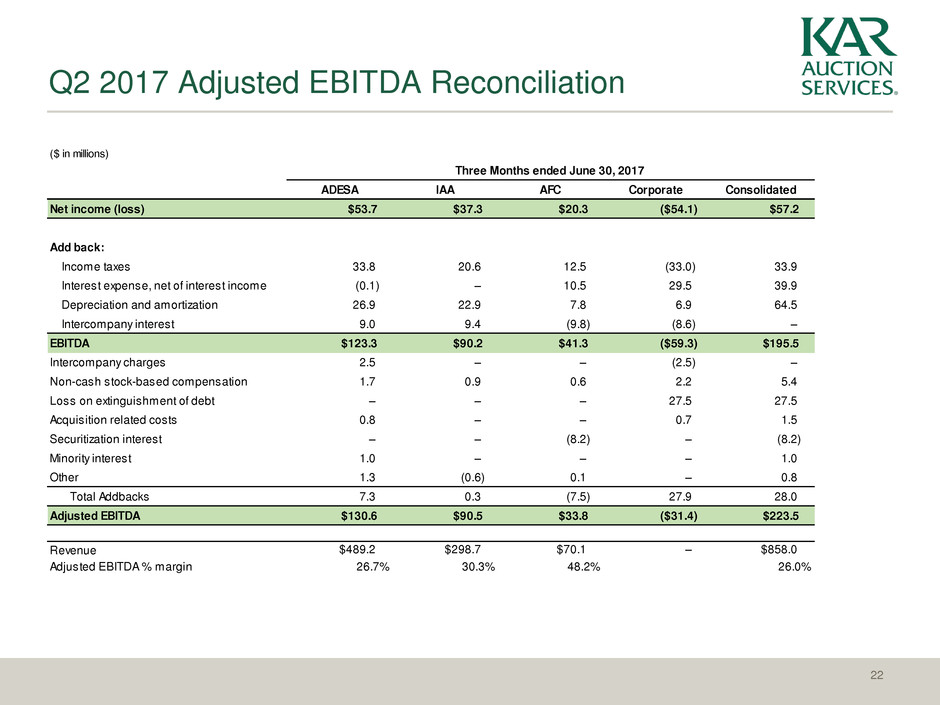
22 Q2 2017 Adjusted EBITDA Reconciliation ($ in millions) Three Months ended June 30, 2017 ADESA IAA AFC Corporate Consolidated Net income (loss) $53.7 $37.3 $20.3 ($54.1) $57.2 Add back: Income taxes 33.8 20.6 12.5 (33.0) 33.9 Interest expense, net of interest income (0.1) – 10.5 29.5 39.9 Depreciation and amortization 26.9 22.9 7.8 6.9 64.5 Intercompany interest 9.0 9.4 (9.8) (8.6) – EBITDA $123.3 $90.2 $41.3 ($59.3) $195.5 Intercompany charges 2.5 – – (2.5) – Non-cash stock-based compensation 1.7 0.9 0.6 2.2 5.4 Loss on extinguishment of debt – – – 27.5 27.5 Acquisition related costs 0.8 – – 0.7 1.5 Securitization interest – – (8.2) – (8.2) Minority interest 1.0 – – – 1.0 Other 1.3 (0.6) 0.1 – 0.8 Total Addbacks 7.3 0.3 (7.5) 27.9 28.0 Adjusted EBITDA $130.6 $90.5 $33.8 ($31.4) $223.5 Revenue $489.2 $298.7 $70.1 – $858.0 Adjusted EBITDA % margin 26.7% 30.3% 48.2% 26.0%
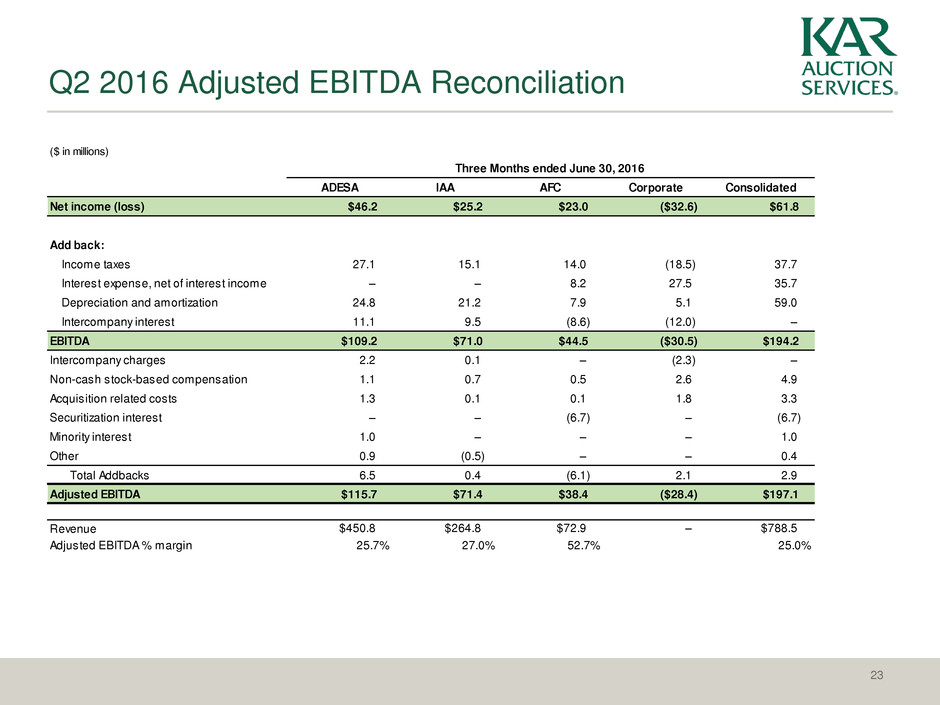
23 Q2 2016 Adjusted EBITDA Reconciliation ($ in millions) Three Months ended June 30, 2016 ADESA IAA AFC Corporate Consolidated Net income (loss) $46.2 $25.2 $23.0 ($32.6) $61.8 Add back: Income taxes 27.1 15.1 14.0 (18.5) 37.7 Interest expense, net of interest income – – 8.2 27.5 35.7 Depreciation and amortization 24.8 21.2 7.9 5.1 59.0 Intercompany interest 11.1 9.5 (8.6) (12.0) – EBITDA $109.2 $71.0 $44.5 ($30.5) $194.2 Intercompany charges 2.2 0.1 – (2.3) – Non-cash stock-based compensation 1.1 0.7 0.5 2.6 4.9 Acquisition related costs 1.3 0.1 0.1 1.8 3.3 Securitization interest – – (6.7) – (6.7) Minority interest 1.0 – – – 1.0 Other 0.9 (0.5) – – 0.4 Total Addbacks 6.5 0.4 (6.1) 2.1 2.9 Adjusted EBITDA $115.7 $71.4 $38.4 ($28.4) $197.1 Revenue $450.8 $264.8 $72.9 – $788.5 Adjusted EBITDA % margin 25.7% 27.0% 52.7% 25.0%
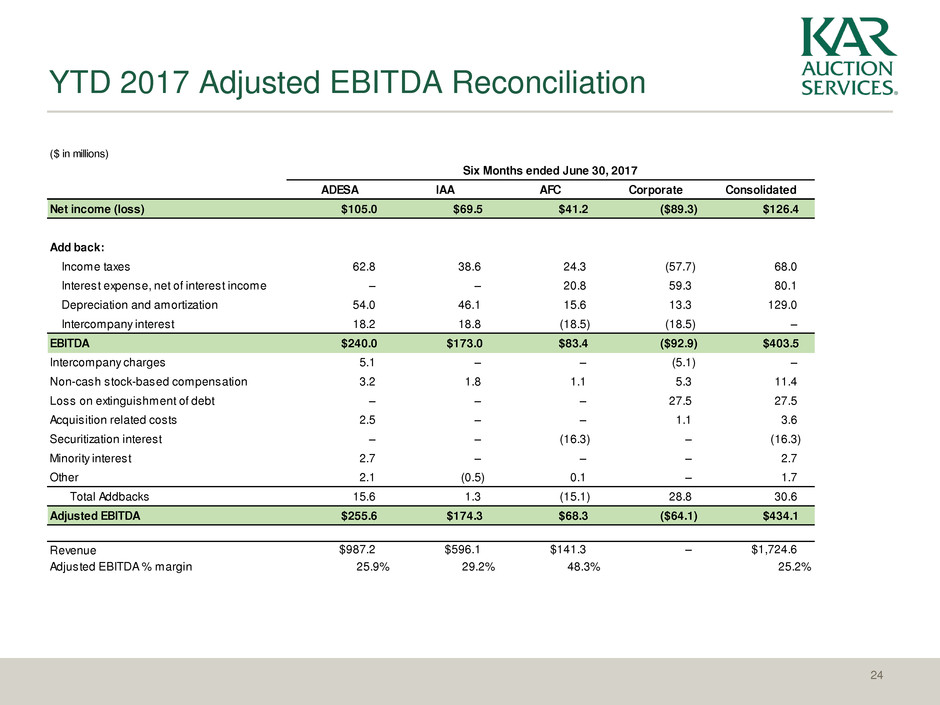
24 YTD 2017 Adjusted EBITDA Reconciliation ($ in millions) Six Months ended June 30, 2017 ADESA IAA AFC Corporate Consolidated Net income (loss) $105.0 $69.5 $41.2 ($89.3) $126.4 Add back: Income taxes 62.8 38.6 24.3 (57.7) 68.0 Interest expense, net of interest income – – 20.8 59.3 80.1 Depreciation and amortization 54.0 46.1 15.6 13.3 129.0 Intercompany interest 18.2 18.8 (18.5) (18.5) – EBITDA $240.0 $173.0 $83.4 ($92.9) $403.5 Intercompany charges 5.1 – – (5.1) – Non-cash stock-based compensation 3.2 1.8 1.1 5.3 11.4 Loss on extinguishment of debt – – – 27.5 27.5 Acquisition related costs 2.5 – – 1.1 3.6 Securitization interest – – (16.3) – (16.3) Minority interest 2.7 – – – 2.7 Other 2.1 (0.5) 0.1 – 1.7 Total Addbacks 15.6 1.3 (15.1) 28.8 30.6 Adjusted EBITDA $255.6 $174.3 $68.3 ($64.1) $434.1 Revenue $987.2 $596.1 $141.3 – $1,724.6 Adjusted EBITDA % margin 25.9% 29.2% 48.3% 25.2%
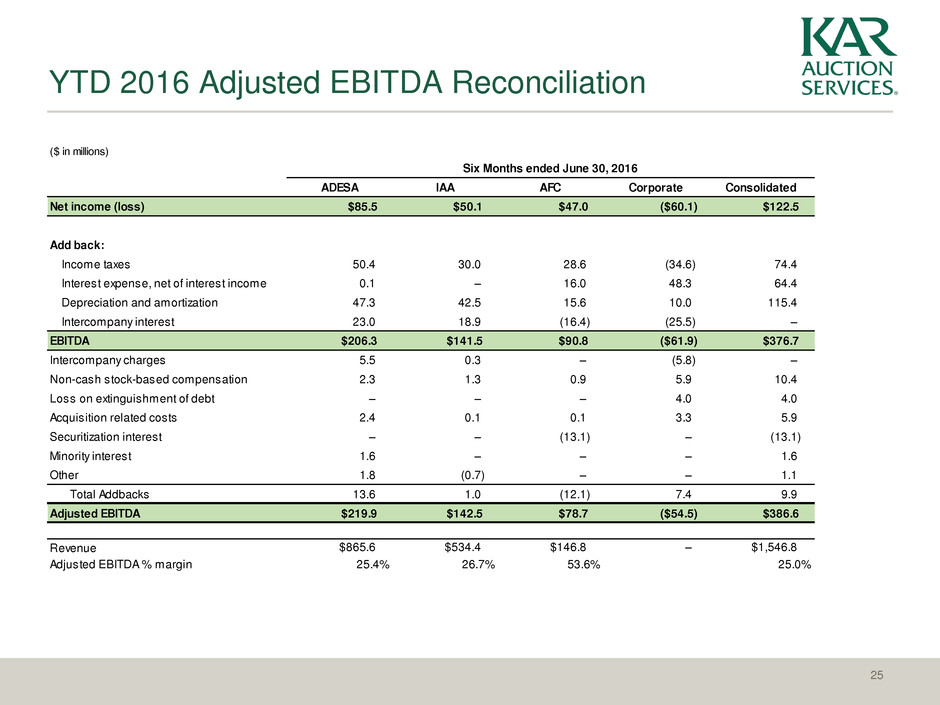
25 YTD 2016 Adjusted EBITDA Reconciliation ($ in millions) Six Months ended June 30, 2016 ADESA IAA AFC Corporate Consolidated Net income (loss) $85.5 $50.1 $47.0 ($60.1) $122.5 Add back: Income taxes 50.4 30.0 28.6 (34.6) 74.4 Interest expense, net of interest income 0.1 – 16.0 48.3 64.4 Depreciation and amortization 47.3 42.5 15.6 10.0 115.4 Intercompany interest 23.0 18.9 (16.4) (25.5) – EBITDA $206.3 $141.5 $90.8 ($61.9) $376.7 Intercompany charges 5.5 0.3 – (5.8) – Non-cash stock-based compensation 2.3 1.3 0.9 5.9 10.4 Loss on extinguishment of debt – – – 4.0 4.0 Acquisition related costs 2.4 0.1 0.1 3.3 5.9 Securitization interest – – (13.1) – (13.1) Minority interest 1.6 – – – 1.6 Other 1.8 (0.7) – – 1.1 Total Addbacks 13.6 1.0 (12.1) 7.4 9.9 Adjusted EBITDA $219.9 $142.5 $78.7 ($54.5) $386.6 Revenue $865.6 $534.4 $146.8 – $1,546.8 Adjusted EBITDA % margin 25.4% 26.7% 53.6% 25.0%
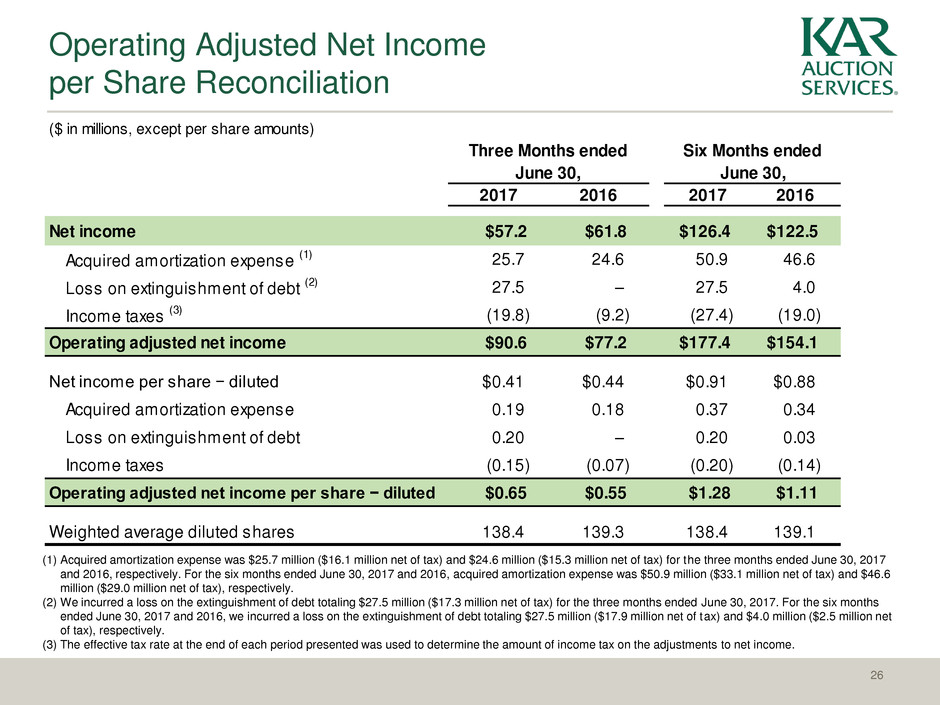
26 Operating Adjusted Net Income per Share Reconciliation ($ in millions, except per share amounts) 2017 2016 2017 2016 Net income $57.2 $61.8 $126.4 $122.5 Acquired amortization expense (1) 25.7 24.6 50.9 46.6 Loss on extinguishment of debt (2) 27.5 – 27.5 4.0 Income taxes (3) (19.8) (9.2) (27.4) (19.0) Operating adjusted net income $90.6 $77.2 $177.4 $154.1 Net income per share − diluted $0.41 $0.44 $0.91 $0.88 Acquired amortization expense 0.19 0.18 0.37 0.34 Loss on extinguishment of debt 0.20 – 0.20 0.03 Income taxes (0.15) (0.07) (0.20) (0.14) Operating adjusted net income per share − diluted $0.65 $0.55 $1.28 $1.11 Weighted average diluted shares 138.4 139.3 138.4 139.1 Three Months ended June 30, Six Months ended June 30, (1) Acquired amortization expense was $25.7 million ($16.1 million net of tax) and $24.6 million ($15.3 million net of tax) for the three months ended June 30, 2017 and 2016, respectively. For the six months ended June 30, 2017 and 2016, acquired amortization expense was $50.9 million ($33.1 million net of tax) and $46.6 million ($29.0 million net of tax), respectively. (2) We incurred a loss on the extinguishment of debt totaling $27.5 million ($17.3 million net of tax) for the three months ended June 30, 2017. For the six months ended June 30, 2017 and 2016, we incurred a loss on the extinguishment of debt totaling $27.5 million ($17.9 million net of tax) and $4.0 million ($2.5 million net of tax), respectively. (3) The effective tax rate at the end of each period presented was used to determine the amount of income tax on the adjustments to net income.


