
KAR Auction Services, Inc. February 28, 2018 KAR Auction Services, Inc. Pursues Separation of IAA Salvage Auction Business Unit
Forward-Looking Statements Certain statements contained in this presentation, including the statements regarding the anticipated separation of KAR into two independent companies, the expected timetable for completing the transaction and any other statements regarding events or developments that we believe or anticipate will or may occur in the future, are “forward-looking statements” within the meaning of the Private Securities Litigation Reform Act of 1995 and are subject to certain risks, trends and uncertainties. Consummation of the separation is subject to a number of factors, many of which are not within KAR’s control. Accordingly, no assurance can be given that the separation will be consummated within the time frame specified or at all. These forward-looking statements speak only as of the date of this presentation and KAR does not assume any obligation to update or revise any forward-looking statement, whether as a result of new information, future events and developments or otherwise. 1
Today’s Presenters and Agenda Jim Hallett KAR Auction Services, Inc. Chief Executive Officer and Chairman of the Board of Directors Eric Loughmiller KAR Auction Services, Inc. Executive Vice President and Chief Financial Officer Agenda Opening Remarks Overview of Separation Questions and Answers 2

Rationale for Separation Create two independent companies with distinct strengths well positioned for market leadership and continued growth Allow independent decisions on investments, acquisitions and capital expenditures to advance respective strategic priorities Enhance ability to address needs of unique customers and respond to changing market and competitive conditions Simplify financial reporting for investors to more accurately assess and value performance of individual businesses Create distinct and compelling investment opportunities based on track records of successful performance and streamlined operating models Two Distinct Companies with Greater Financial Flexibility and Focused Strategies 3

Transaction Details Separation to create two independent, publicly traded companies Tax-free spin-off expected to close within the next twelve months Separation subject to final approval by KAR Board of Directors and market, regulatory, financing and other customary closing conditions Insurance Auto Auctions, Inc. to retain North American salvage vehicle operations and HBC Vehicle Services business in the UK All other current KAR businesses to remain part of KAR Auction Services, Inc. Expectation that capital structure of KAR and IAA will include debt level and corporate credit ratings generally consistent with current KAR rating of BB- Additional details to be included in initial Form 10 registration statement expected later this year 4

Leading provider of whole car auction services and technology-enabled solutions $2.2bn 2017 Revenue ~14,200 Employees $499mm Adjusted EBITDA $1.2bn 2017 Revenue ~3,300 Employees $340mm Adjusted EBITDA 186 Locations 28% ADESA’s Share of North American Market 3.2mm Vehicles Sold Two Independent and Highly Attractive Businesses Leading provider of salvage vehicle auction services ___________________________ Note: Represents 2017A statistics. Chief Executive Officer and Chairman of the Board of Directors: Jim Hallett Chief Executive Officer: John Kett 2.4mm Vehicles Sold IAA (SpinCo) KAR (RemainCo) ~40% Share of North American Market 75 ADESA Locations 128 AFC Locations 5
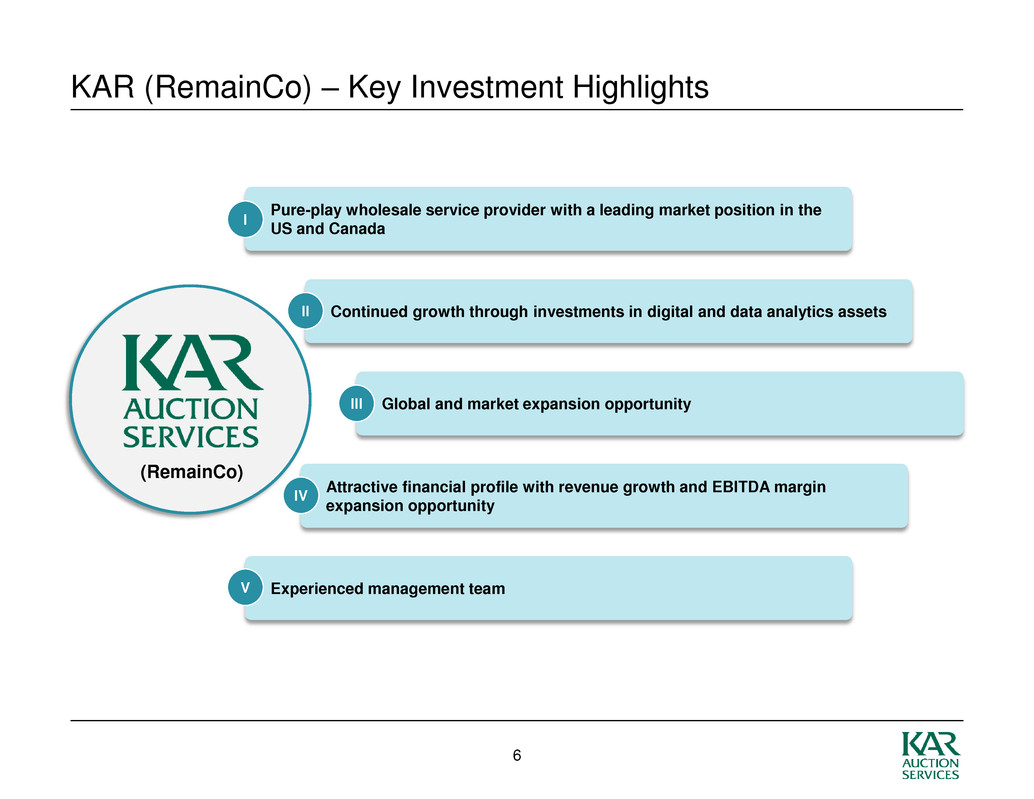
KAR (RemainCo) – Key Investment Highlights Pure-play wholesale service provider with a leading market position in the US and Canada I Continued growth through investments in digital and data analytics assets II Global and market expansion opportunity III Attractive financial profile with revenue growth and EBITDA margin expansion opportunity IV Experienced management team V (RemainCo) 6
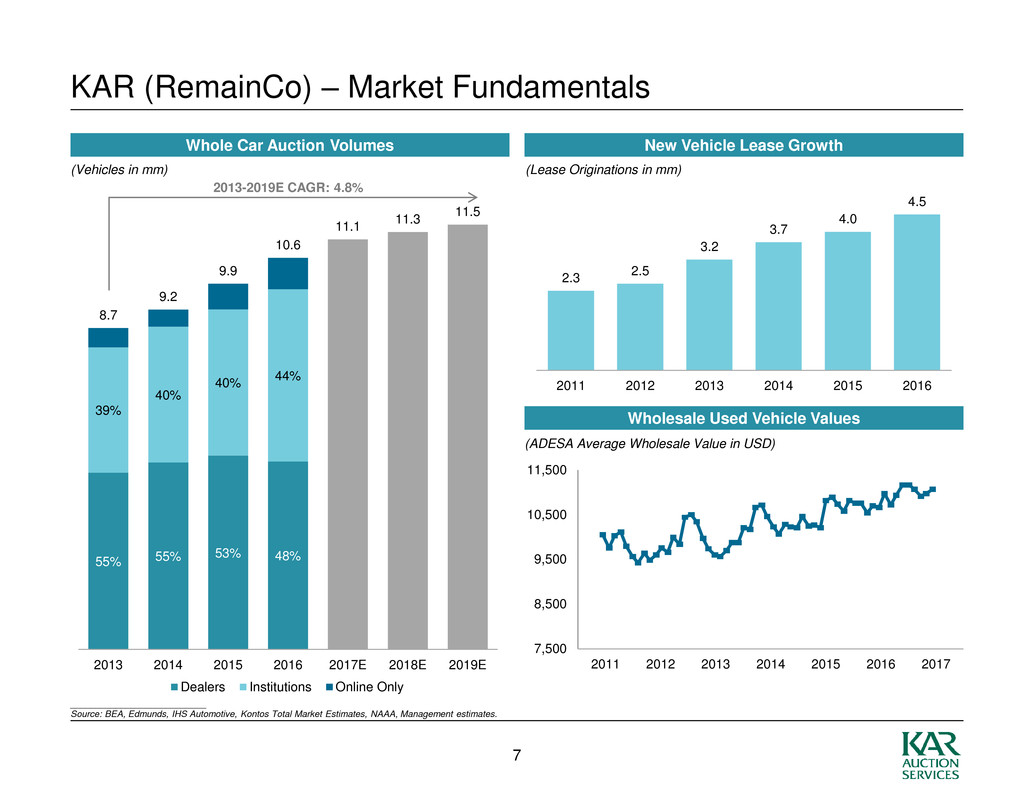
55% 55% 53% 48% 39% 40% 40% 44% 8.7 9.2 9.9 10.6 11.1 11.3 11.5 2013 2014 2015 2016 2017E 2018E 2019E Dealers Institutions Online Only KAR (RemainCo) – Market Fundamentals Whole Car Auction Volumes (Vehicles in mm) 2013-2019E CAGR: 4.8% ___________________________ Source: BEA, Edmunds, IHS Automotive, Kontos Total Market Estimates, NAAA, Management estimates. 2.3 2.5 3.2 3.7 4.0 4.5 2011 2012 2013 2014 2015 2016 New Vehicle Lease Growth Wholesale Used Vehicle Values (ADESA Average Wholesale Value in USD) (Lease Originations in mm) 7,500 8,500 9,500 10,500 11,500 2011 2012 2013 2014 2015 2016 2017 7

KAR (RemainCo) – Financial Profile $1,696 $2,052 $2,239 2015A 2016A 2017A $385 $459 $499 2015A 2016A 2017A Adj. EBITDA ($ in mm) ($ in mm) Highlights Revenue Visible and predictable top- line growth History of strong free cash flow generation Proven ability to expand operating margins Revenue Growth: 11.5% 21.0% 9.1% Adj. EBITDA Growth: 9.5% 19.3% 8.6% Adj. EBITDA Margin: 22.7% 22.4% 22.3% 8
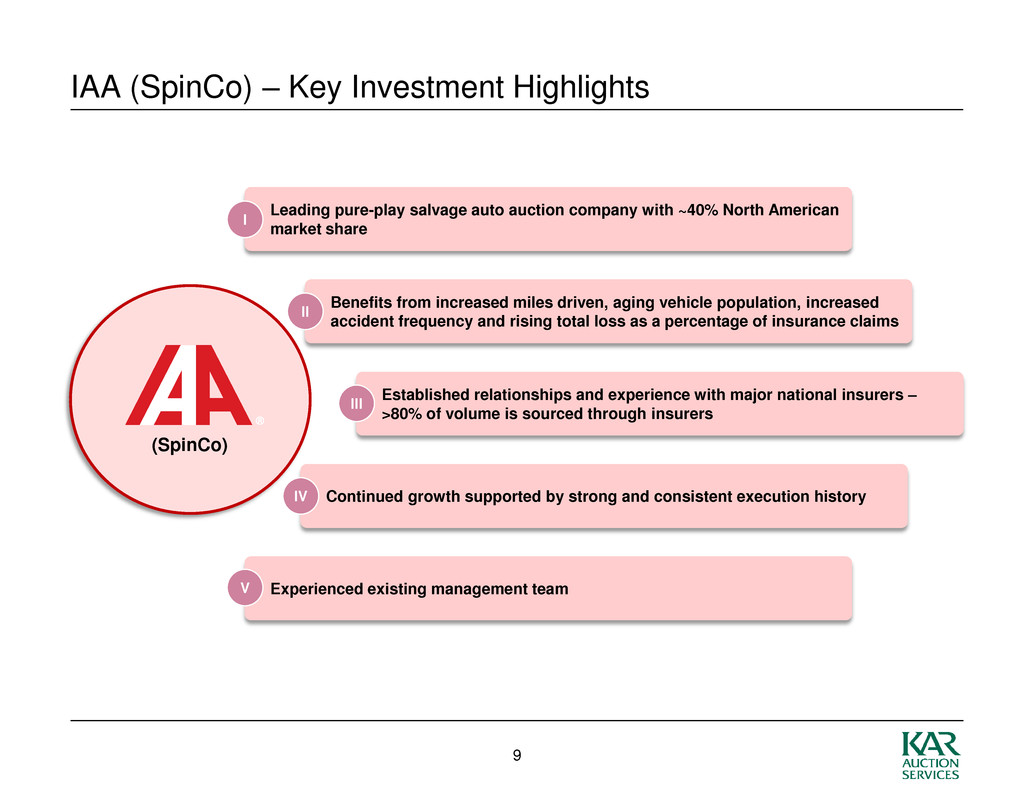
IAA (SpinCo) – Key Investment Highlights Leading pure-play salvage auto auction company with ~40% North American market share I Benefits from increased miles driven, aging vehicle population, increased accident frequency and rising total loss as a percentage of insurance claims II Established relationships and experience with major national insurers – >80% of volume is sourced through insurers III Continued growth supported by strong and consistent execution history IV Experienced existing management team V (SpinCo) 9

IAA (SpinCo) – Market Fundamentals Positive Industry Drivers Miles Driven Total Loss % of Total Claims 14.0% 14.2% 13.9% 13.9% 14.3% 14.1% 14.1% 15.6% 16.9% 18.0% 2008 2009 2010 2011 2012 2013 2014 2015 2016 2017 ___________________________ Source: CCC Information Services, Polk and ADESA Analytical Services, Federal Reserve St. Louis. Growing and Aging North American Car Parc Accident frequency benefits from rising miles driven, aging vehicle fleet and increasing driver distractions Accident severity increasing due to vehicle complexity and technology content, resulting in a higher frequency of total losses 244 251 262 266 270 273 274 271 272 271 272 277 283 290 8.0 9.0 10.0 11.0 12.0 Vehicles in Operation Average Vehicle Age (Average Vehicle Age in years) 2,600 2,700 2,800 2,900 3,000 3,100 3,200 (Vehicles in Operation in mm) (LTM in billions) 10
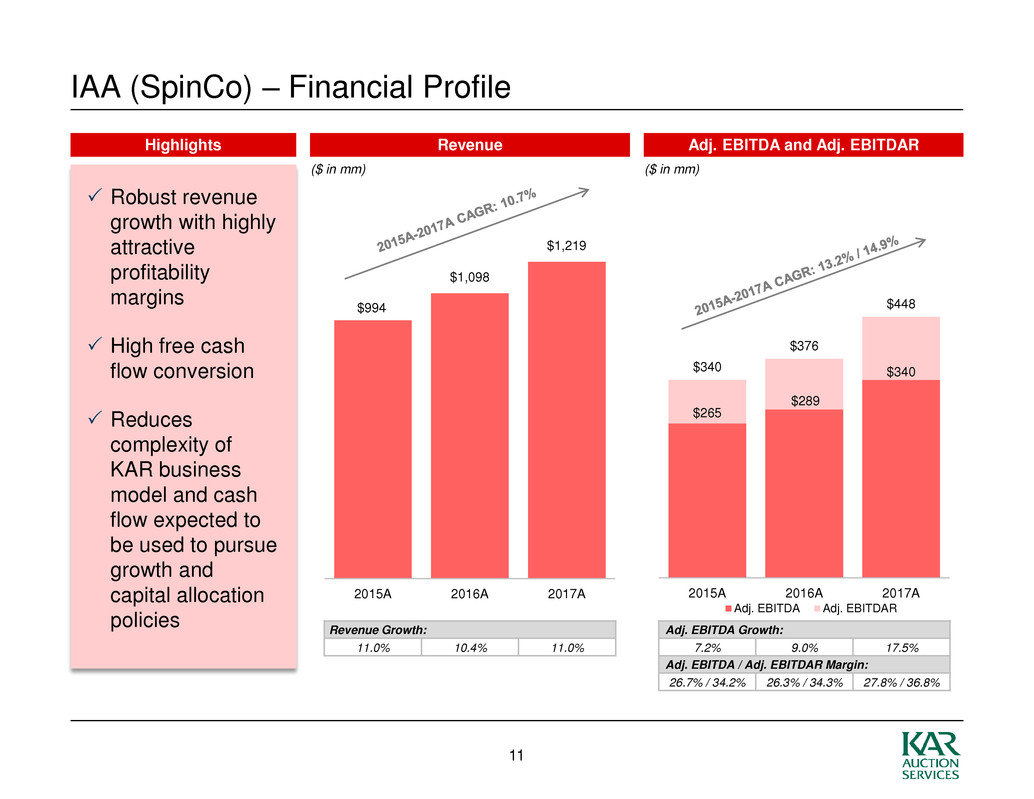
IAA (SpinCo) – Financial Profile $994 $1,098 $1,219 2015A 2016A 2017A Revenue Adj. EBITDA and Adj. EBITDAR ($ in mm) ($ in mm) Highlights Robust revenue growth with highly attractive profitability margins High free cash flow conversion Reduces complexity of KAR business model and cash flow expected to be used to pursue growth and capital allocation policies Revenue Growth: 11.0% 10.4% 11.0% Adj. EBITDA Growth: 7.2% 9.0% 17.5% Adj. EBITDA / Adj. EBITDAR Margin: 26.7% / 34.2% 26.3% / 34.3% 27.8% / 36.8% $265 $289 $340 $340 $376 $448 2015A 2016A 2017A Adj. EBITDA Adj. EBITDAR 11
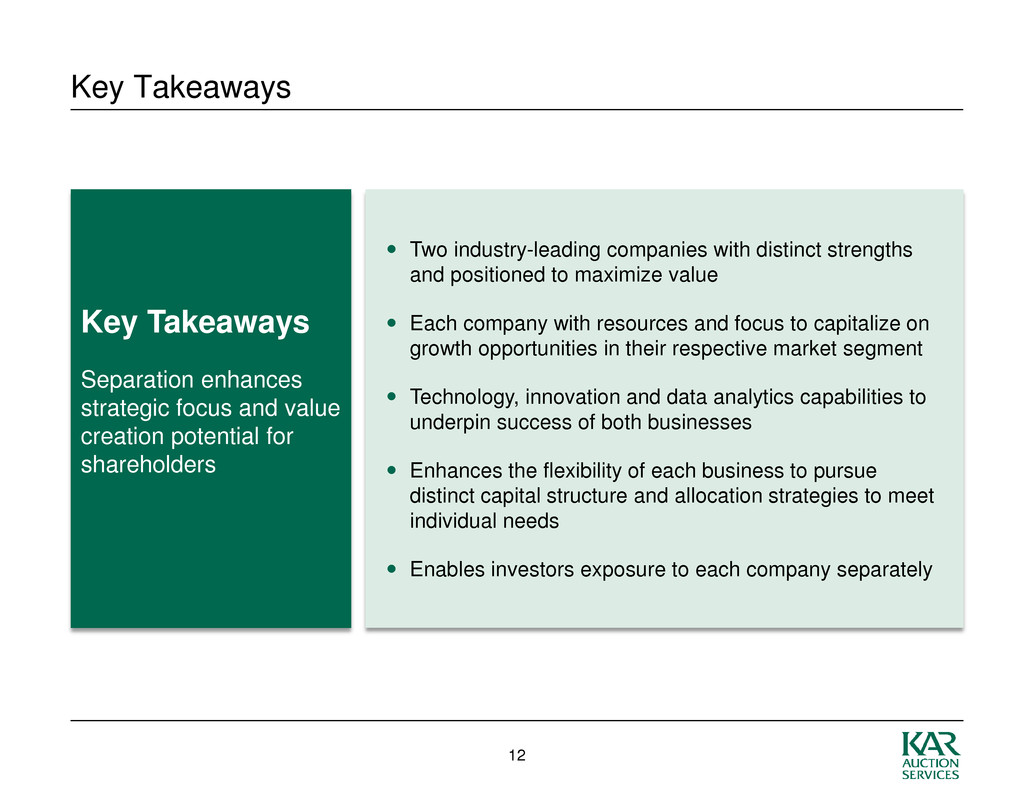
Key Takeaways Two industry-leading companies with distinct strengths and positioned to maximize value Each company with resources and focus to capitalize on growth opportunities in their respective market segment Technology, innovation and data analytics capabilities to underpin success of both businesses Enhances the flexibility of each business to pursue distinct capital structure and allocation strategies to meet individual needs Enables investors exposure to each company separately Separation enhances strategic focus and value creation potential for shareholders Key Takeaways 12
Appendix
Non-GAAP Financial Measures EBITDA, EBITDAR, Adjusted EBITDA and Adjusted EBITDAR, as presented in the following reconciliations, are supplemental measures of performance that are not required by, or presented in accordance with, generally accepted accounting principles in the United States, or GAAP. They are not measurements of financial performance under GAAP and should not be considered as substitutes for net income (loss) or any other performance measures derived in accordance with GAAP. EBITDA is defined as net income (loss), plus interest expense net of interest income, income tax provision (benefit), depreciation and amortization. EBITDAR is defined as net income (loss), plus interest expense net of interest income, income tax provision (benefit), depreciation and amortization and lease expense. Adjusted EBITDA and Adjusted EBITDAR are EBITDA and EBITDAR adjusted for the items of income and expense and expected incremental revenue and cost savings as described in the company’s senior secured credit agreement covenant calculations. Management believes that the inclusion of supplementary adjustments to EBITDA and EBITDAR applied in presenting Adjusted EBITDA and Adjusted EBITDAR is appropriate to provide additional information to investors about the principal measures of performance used by the company’s creditors and by the company’s management. EBITDA, EBITDAR, Adjusted EBITDA and Adjusted EBITDAR have limitations as analytical tools, and should not be considered in isolation, or as a substitute for analysis of the results as reported under GAAP. These measures may not be comparable to similarly titled measures reported by other companies. 13

KAR (RemainCo) – Adjusted EBITDA Reconciliations ($ in millions) 2015 2016 2017 Net income (loss) $121.8 $121.3 $196.0 Add back: Income taxes $73.5 $73.6 ($2.0) Interest expense, net of interest income $90.8 $138.4 $162.6 Depreciation and amortization $132.0 $152.7 $171.5 Intercompany interest ($37.7) ($37.8) ($37.8) EBITDA $380.4 $448.2 $490.3 Addbacks, net $4.3 $10.8 $8.2 Adjusted EBITDA $384.7 $459.0 $498.5 Revenue $1,696.2 $2,052.1 $2,238.8 Adjusted EBITDA % margin 22.7% 22.4% 22.3% 14

IAA (SpinCo) – Adjusted EBITDA Reconciliations ($ in millions) 2015 2016 2017 Net income (loss) $92.8 $101.1 $166.0 Add back: Income taxes $52.4 $59.3 $38.0 Interest expense, net of interest income – – – Depreciation and amortization $80.8 $87.9 $93.1 Intercompany interest $37.7 $37.8 $37.8 EBITDA $263.7 $286.1 $334.9 Addbacks, net $1.4 $2.8 $4.6 Adjusted EBITDA $265.1 $288.9 $339.5 Revenue $994.4 $1,098.0 $1,219.2 Adjusted EBITDA % margin 26.7% 26.3% 27.8% 15
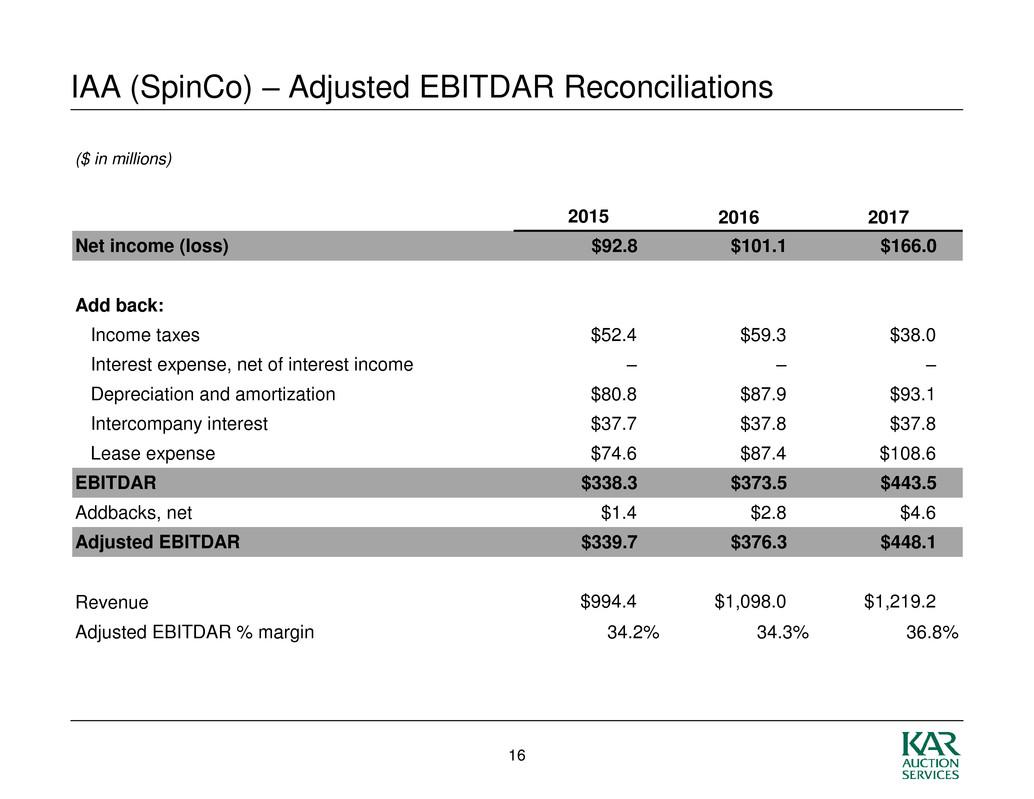
IAA (SpinCo) – Adjusted EBITDAR Reconciliations ($ in millions) 2015 2016 2017 Net income (loss) $92.8 $101.1 $166.0 Add back: Income taxes $52.4 $59.3 $38.0 Interest expense, net of interest income – – – Depreciation and amortization $80.8 $87.9 $93.1 Intercompany interest $37.7 $37.8 $37.8 Lease expense $74.6 $87.4 $108.6 EBITDA $338.3 $373.5 $443.5 Addbacks, net $1.4 $2.8 $4.6 Adjusted EBITDAR $339.7 $376.3 $448.1 Revenue $994.4 $1,098.0 $1,219.2 Adjusted EBITDAR % margin 34.2% 34.3% 36.8% 16


