
// September 20, 2021 Conference Call K A R A U C T I O N S E R V I C E S , I N C .

2 Forward-Looking Statements This document includes forward-looking statements as that term is defined in the Private Securities Litigation Reform Act of 1995. In particular, statements made in this document that are not historical facts (including but not limited to expectations, estimates, assumptions and/or projections regarding 2021 guidance, industry volumes, the impact of the semiconductor shortage and the impact of the COVID-19 pandemic) may be forward- looking statements. Words such as “should,” “may,” “will,” “anticipate,” “expect,” “project,” “target,” “intend,” “plan,” “believe,” “seek,” “estimate” and similar expressions identify forward-looking statements. The forward-looking statements contained in this document are based on management’s current assumptions, expectations and/or beliefs, are not guarantees of future performance and are subject to substantial risks, uncertainties and changes that could cause actual results to differ materially from the results projected, expressed or implied by these forward-looking statements. Factors that could cause or contribute to such differences include, but are not limited to, those discussed in the section entitled "Risk Factors" in our Annual Report on Form 10-K for the year ended December 31, 2020, filed on February 18, 2021, and those described from time to time in our reports filed with the Securities and Exchange Commission. Many of these risk factors are outside of our control, and as such, they involve risks which are not currently known that could cause actual results to differ materially from those discussed or implied herein. The forward-looking statements in this document are made as of the date on which they are made and we do not undertake to update any forward-looking statements. Non-GAAP Financial Measures Adjusted EBITDA as presented herein is a supplemental measure of our performance that is not required by, or presented in accordance with, generally accepted accounting principles in the United States (“GAAP”). This is not a measurement of our financial performance under GAAP and should not be considered as a substitute for net income (loss) or any other performance measures derived in accordance with GAAP. Management believes that this measure provides investors additional meaningful methods to evaluate certain aspects of the company’s results period over period and for the other reasons set forth below. EBITDA is defined as net income (loss), plus interest expense net of interest income, income tax provision (benefit), depreciation and amortization. Adjusted EBITDA is EBITDA adjusted for the items of income and expense and expected incremental revenue and cost savings as described in our senior secured credit agreement covenant calculations. Management believes that the inclusion of supplementary adjustments to EBITDA applied in presenting Adjusted EBITDA is appropriate to provide additional information to investors about one of the principal measures of performance used by our creditors. In addition, management uses EBITDA and Adjusted EBITDA to evaluate our performance. Adjusted EBITDA has limitations as an analytical tool, and should not be considered in isolation or as a substitute for analysis of the results as reported under GAAP. These measures may not be comparable to similarly titled measures reported by other companies. The third quarter 2021 expectation for Adjusted EBITDA is a forward-looking non-GAAP financial measure. We have not reconciled this non-GAAP financial measure to its most directly comparable GAAP measure of net income (loss) due to the inherent difficulty and impracticability of predicting certain amounts required by GAAP with a reasonable degree of accuracy. Accordingly, a reconciliation is not available without unreasonable effort.
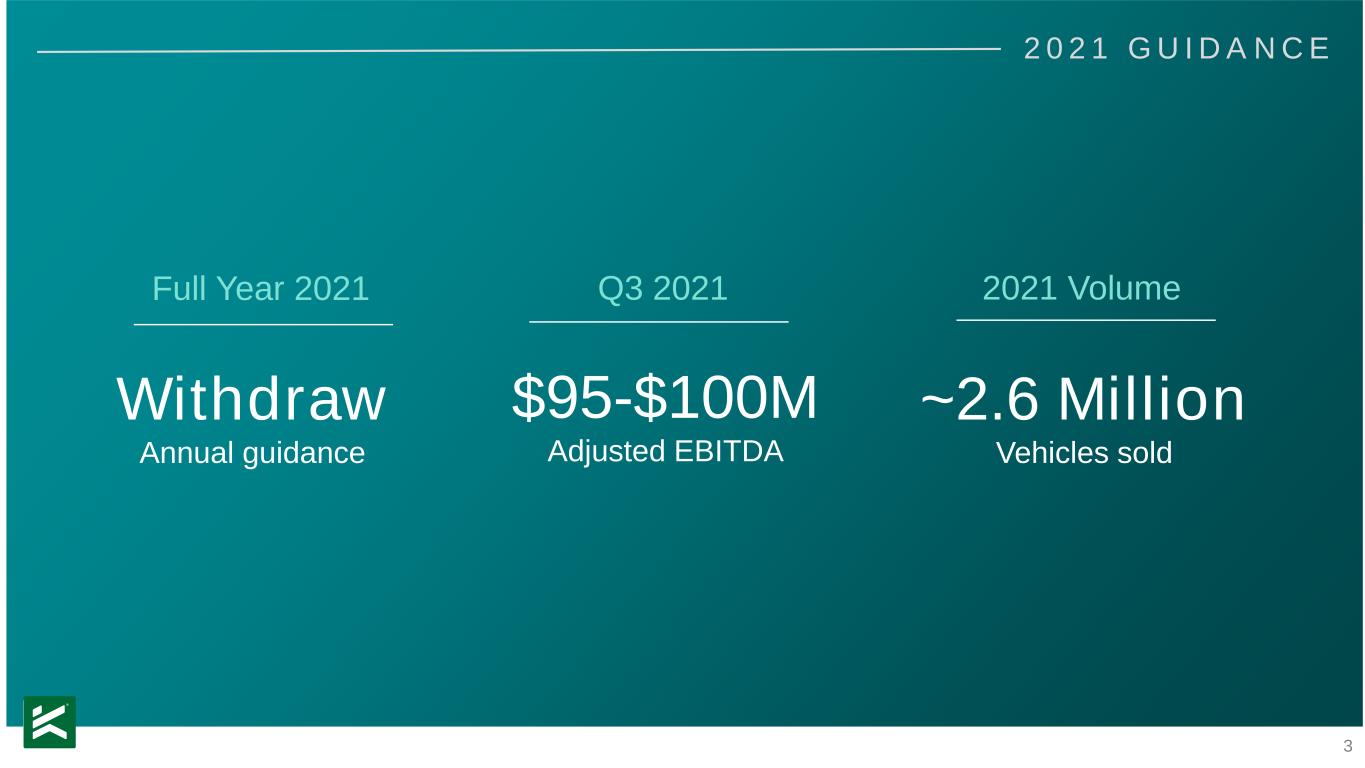
3 2 0 2 1 G U I D A N C E $95-$100M Adjusted EBITDA ~2.6 Million Vehicles sold Withdraw Annual guidance Q3 2021Full Year 2021 2021 Volume
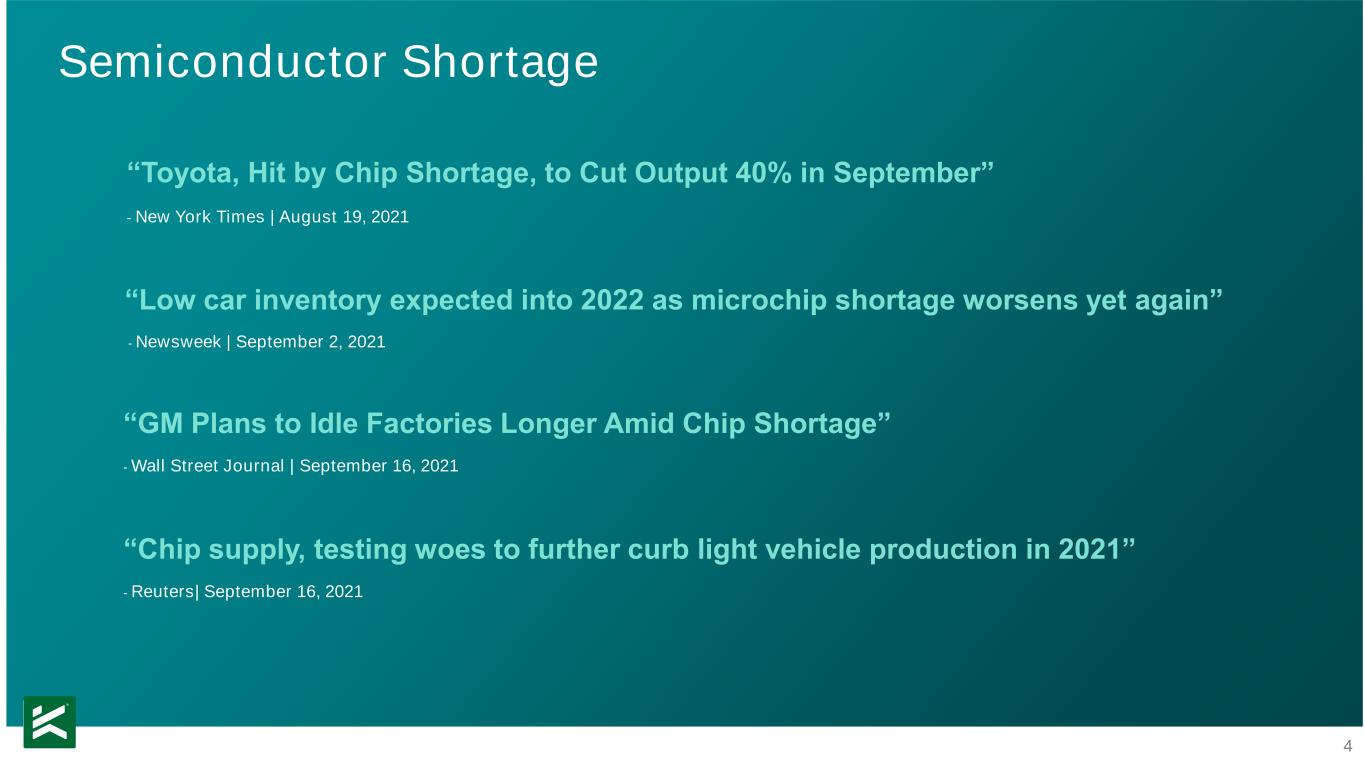
4 “GM Plans to Idle Factories Longer Amid Chip Shortage” - Wall Street Journal | September 16, 2021 Semiconductor Shortage “Toyota, Hit by Chip Shortage, to Cut Output 40% in September” - New York Times | August 19, 2021 “Chip supply, testing woes to further curb light vehicle production in 2021” - Reuters| September 16, 2021 “Low car inventory expected into 2022 as microchip shortage worsens yet again” - Newsweek | September 2, 2021
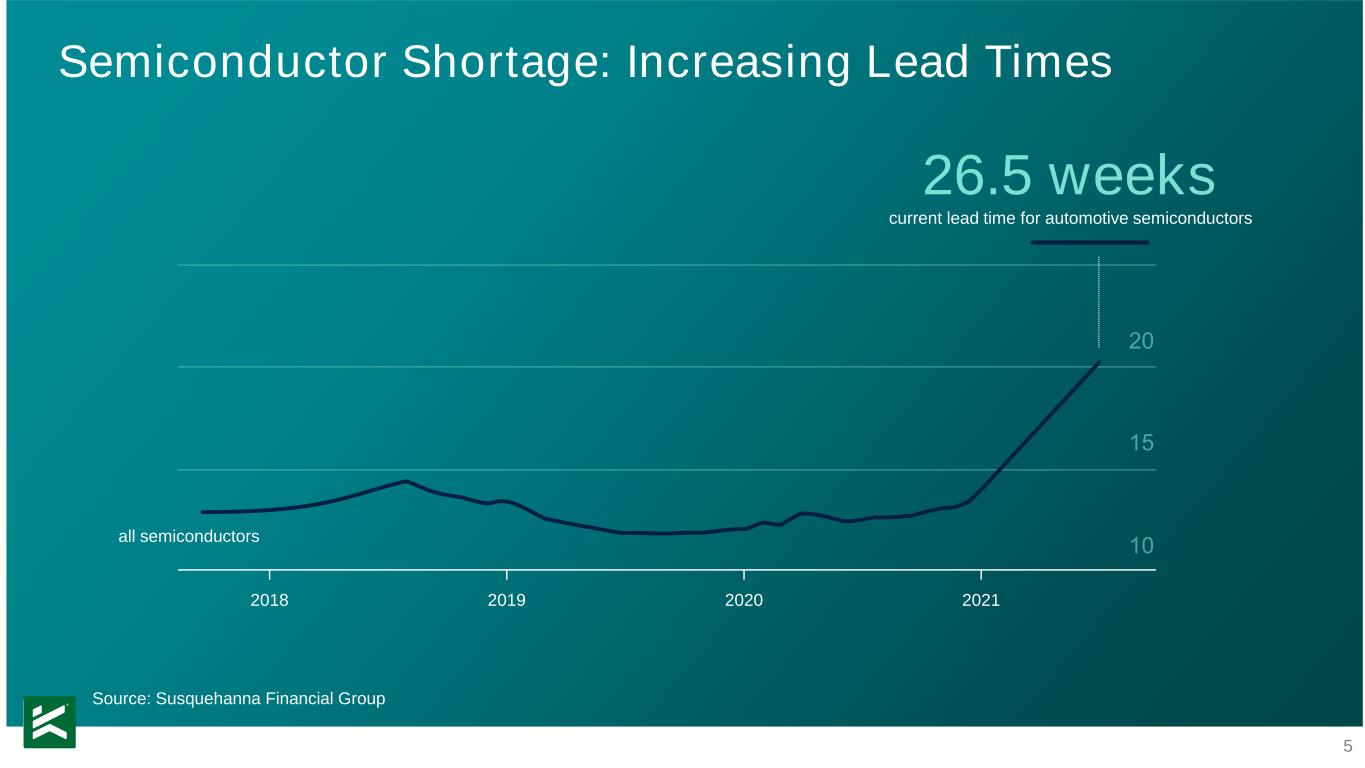
5 Semiconductor Shortage: Increasing Lead Times Source: Susquehanna Financial Group 26.5 weeks current lead time for automotive semiconductors 2018 2019 2020 2021 all semiconductors
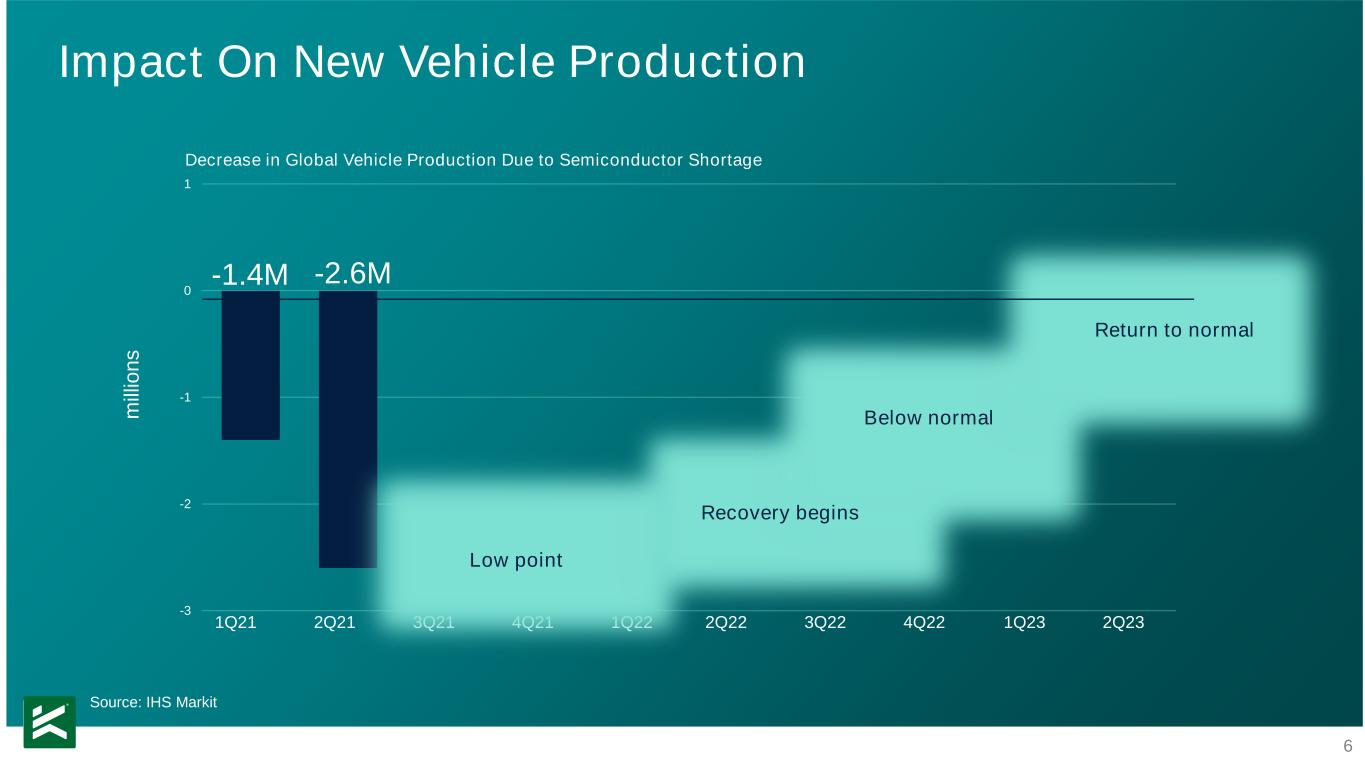
6 Impact On New Vehicle Production -3 -2 -1 0 1 Decrease in Global Vehicle Production Due to Semiconductor Shortage -1.4M -2.6M 1Q21 2Q21 3Q21 4Q21 1Q22 2Q22 3Q22 4Q22 1Q23 2Q23 Low point Recovery begins Below normal Return to normal Source: IHS Markit m ill io n s

7 ~24% decrease from 2019 Impact On New Vehicle Sales Source: BEA; Light Weight Vehicle Sales: Autos and Light Trucks m ill io n s 1Q19 2Q19 3Q19 4Q19 1Q20 2Q20 3Q20 4Q20 1Q21 2Q21 3Q21 COVID-19 Chip Shortage ~48% decrease from 2019 ~8% avg. MoM decrease since 5/21 U.S. New Car SAAR 0 5 10 15 20
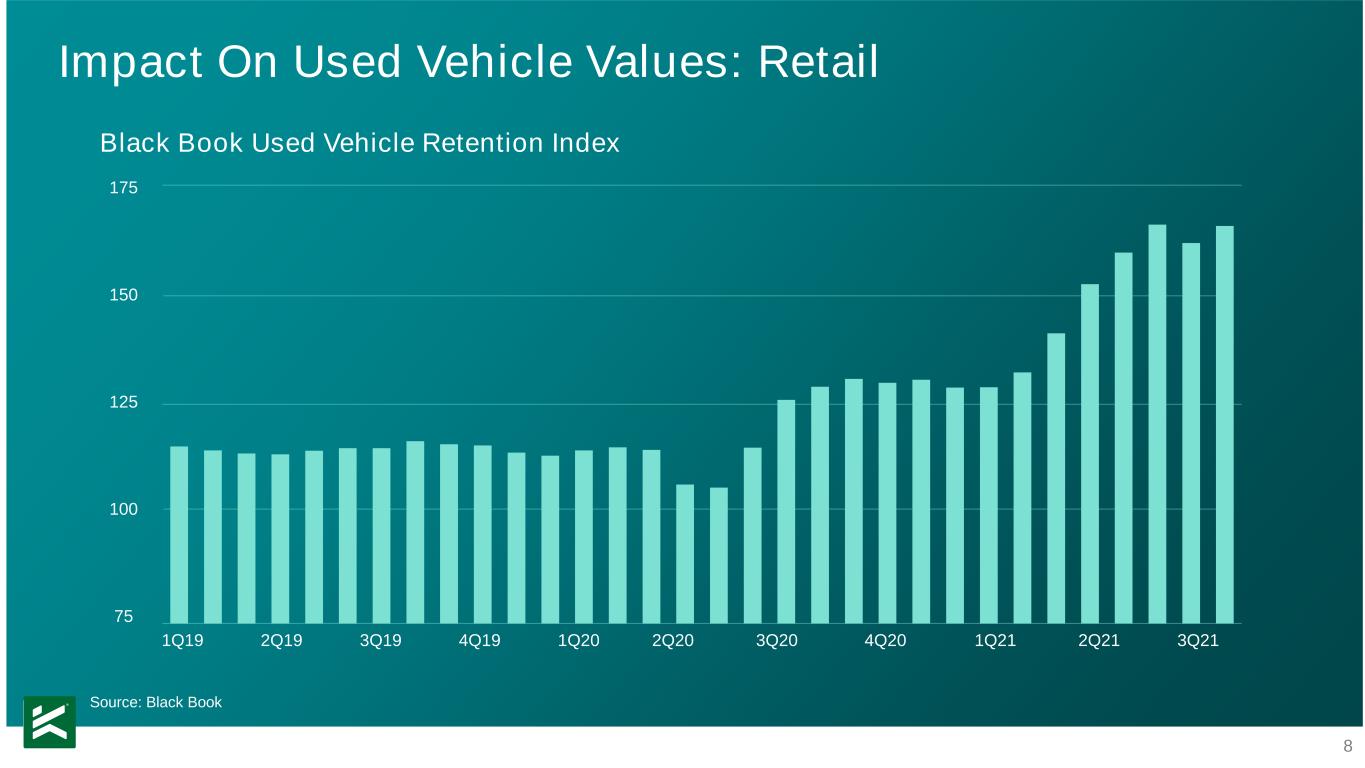
8 Impact On Used Vehicle Values: Retail Black Book Used Vehicle Retention Index 75 125 175 1Q19 2Q19 3Q19 4Q19 1Q20 2Q20 3Q20 4Q20 1Q21 2Q21 3Q21 Source: Black Book 100 150
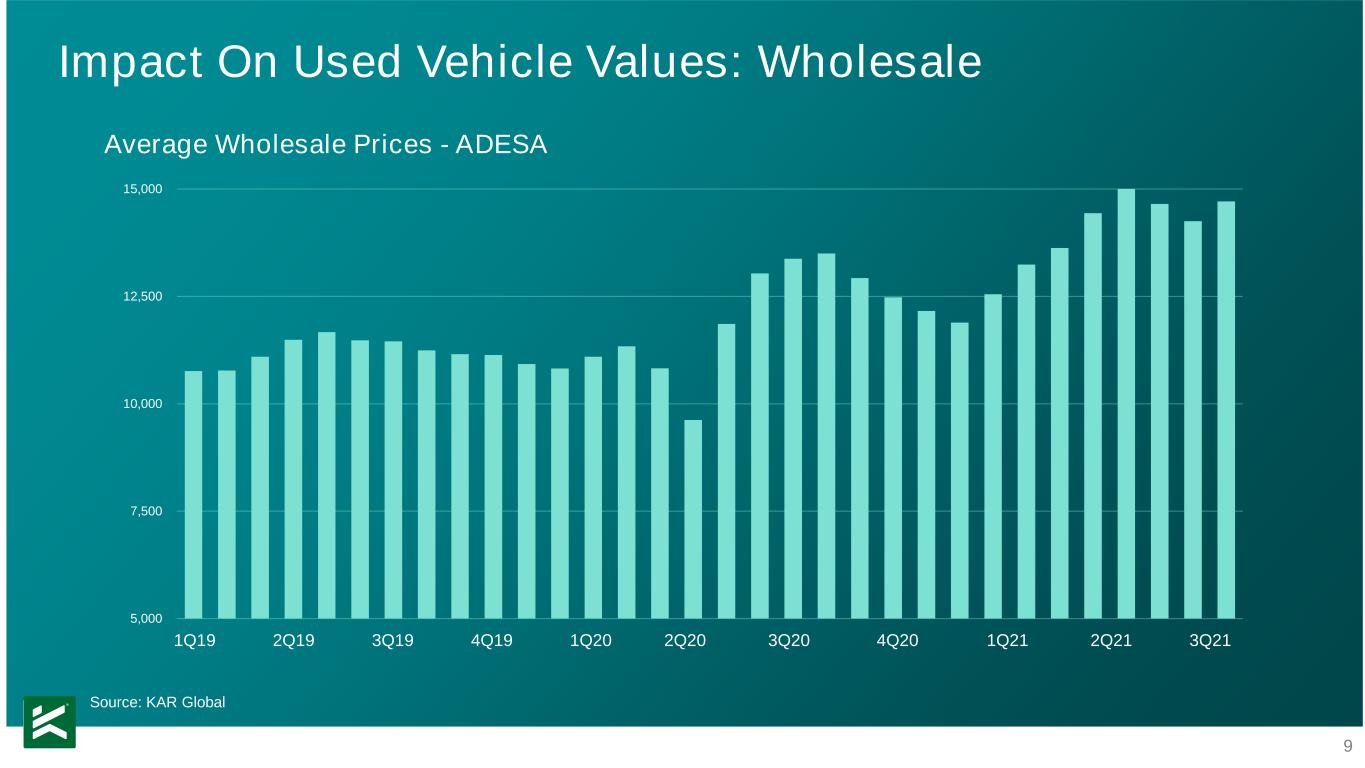
9 Impact On Used Vehicle Values: Wholesale Average Wholesale Prices - ADESA 1Q19 2Q19 3Q19 4Q19 1Q20 2Q20 3Q20 4Q20 1Q21 2Q21 3Q21 5,000 7,500 10,000 12,500 15,000 Source: KAR Global
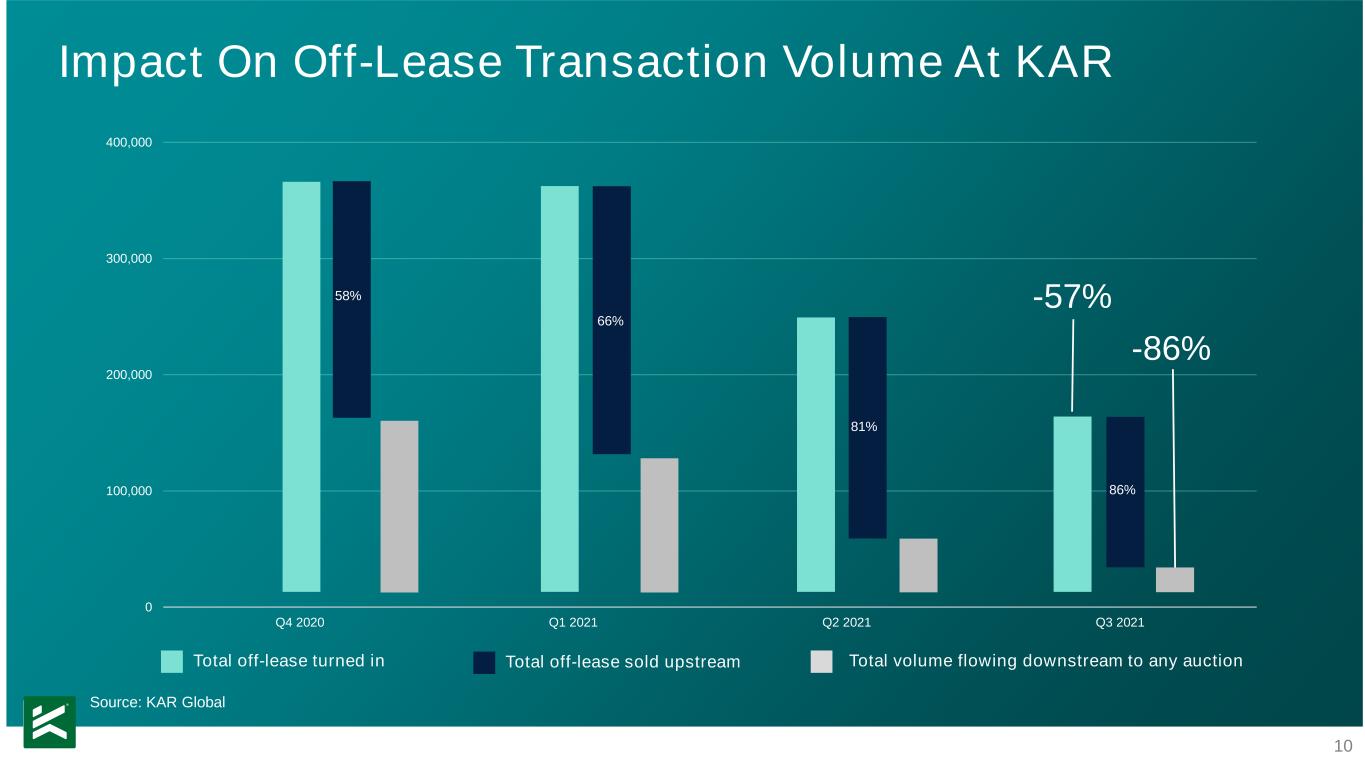
10 Impact On Off-Lease Transaction Volume At KAR Total off-lease turned in Total off-lease sold upstream Total volume flowing downstream to any auction 0 100,000 200,000 300,000 400,000 Q4 2020 Q1 2021 Q2 2021 Q3 2021 -86% -57%58% 66% 81% 86% Source: KAR Global
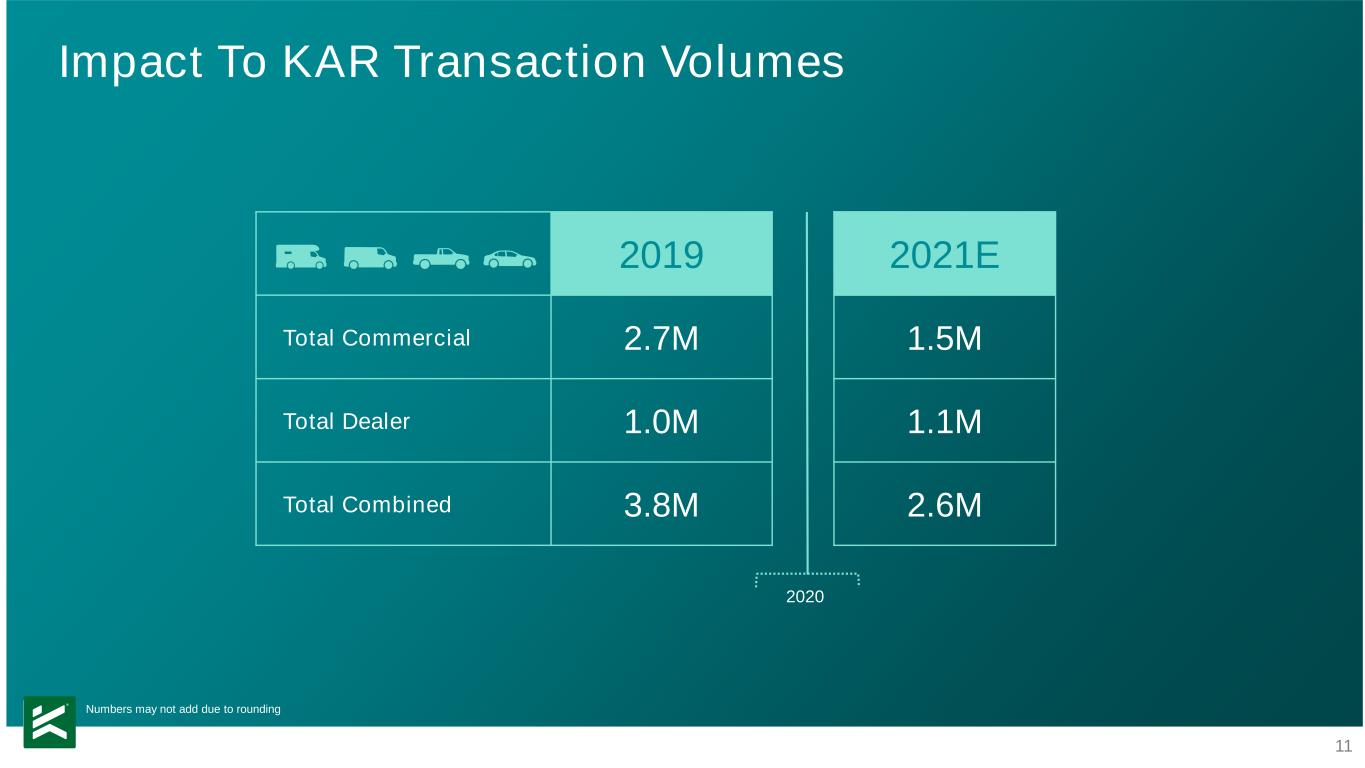
11 2019 2021E Total Commercial 2.7M 1.5M Total Dealer 1.0M 1.1M Total Combined 3.8M 2.6M 2020 Impact To KAR Transaction Volumes Numbers may not add due to rounding
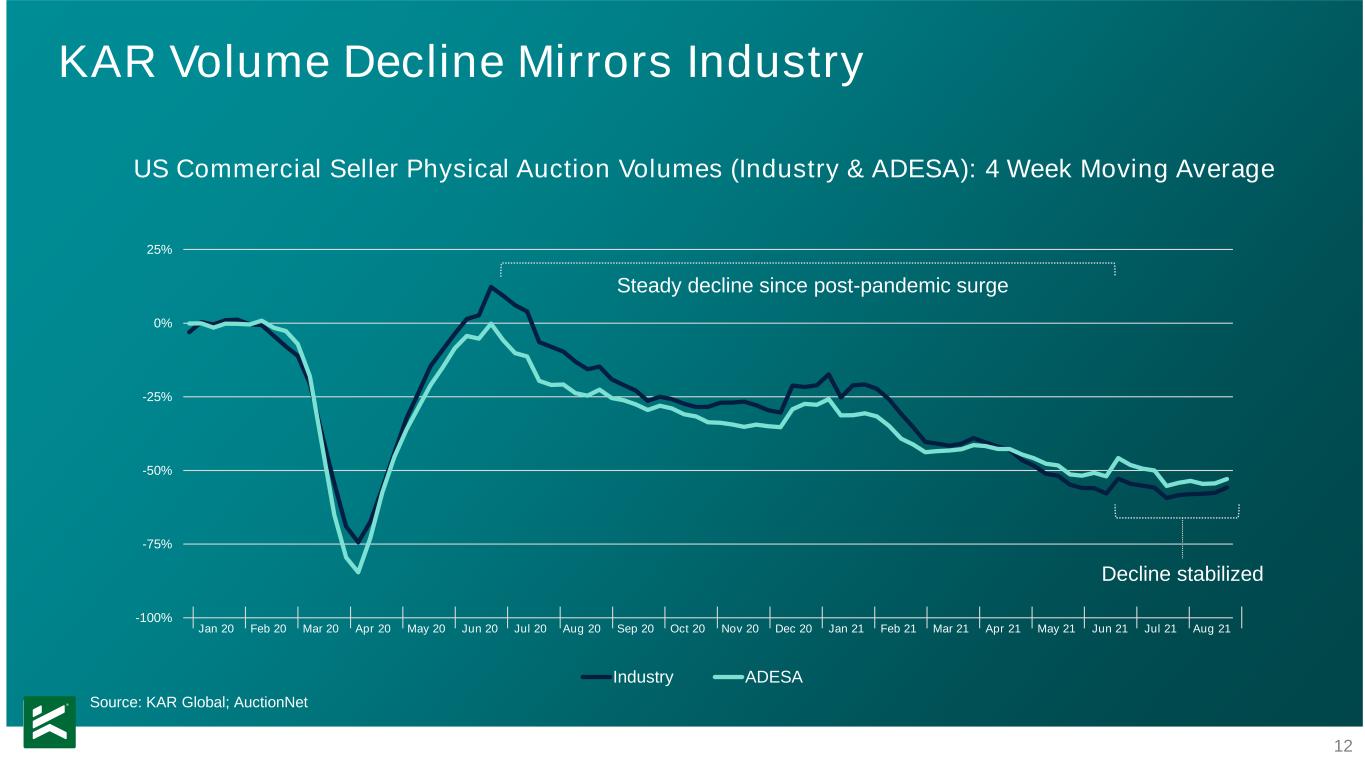
12 -100% -75% -50% -25% 0% 25% Industry ADESA Jan 20 Feb 20 Mar 20 Apr 20 May 20 Jun 20 Jul 20 Aug 20 Sep 20 Oct 20 Nov 20 Dec 20 Jan 21 Feb 21 Mar 21 Apr 21 May 21 Jun 21 Jul 21 Aug 21 KAR Volume Decline Mirrors Industry US Commercial Seller Physical Auction Volumes (Industry & ADESA): 4 Week Moving Average Steady decline since post-pandemic surge Decline stabilized Source: KAR Global; AuctionNet


