Investor Update K A R G L O B A L // June 14, 2022
2 K A R G L O B A L | I N V E S T O R U P D A T E Forward-Looking Statements This presentation includes forward-looking statements as that term is defined in the Private Securities Litigation Reform Act of 1995. In particular, statements made in this presentation that are not historical facts (including but not limited to expectations, estimates, assumptions and/or projections regarding our growth opportunities and strategies, addressable markets, industry volumes, industry outlook, competitive position, operational and product strategies, cost savings, projected growth, 2022 financial guidance and 2025 financial targets) may be forward-looking statements. Words such as “should,” “may,” “will,” “anticipate,” “expect,” “project,” “target,” “intend,” “plan,” “believe,” “seek,” “estimate,” “assume,” “could,” “continue” and similar expressions identify forward- looking statements. The forward-looking statements contained in this presentation are based on management’s current assumptions, expectations and/or beliefs, are not guarantees of future performance and are subject to substantial risks, uncertainties and changes that could cause actual results to differ materially from the results projected, expressed or implied by these forward-looking statements. Factors that could cause or contribute to such differences include, but are not limited to, those discussed in the section entitled "Risk Factors" in our Annual Report on Form 10-K for the year ended December 31, 2021 and Quarterly Report on Form 10-Q for the quarter ended March 31, 2022, and those described from time to time in our reports filed with the Securities and Exchange Commission. Many of these risk factors are outside of our control, and as such, they involve risks which are not currently known that could cause actual results to differ materially from those discussed or implied herein. The forward-looking statements in this presentation are made as of the date on which they are made and we do not undertake to update any forward-looking statements. Non-GAAP Financial Measures EBITDA and Adjusted EBITDA as presented herein are supplemental measures of our performance that are not required by, or presented in accordance with, generally accepted accounting principles in the United States (“GAAP”). These are not measurements of our financial performance under GAAP and should not be considered as substitutes for net income (loss) or any other performance measures derived in accordance with GAAP. Management believes that these measures provide investors additional meaningful methods to evaluate certain aspects of the company’s results period over period and for the other reasons set forth below. EBITDA is defined as net income (loss), plus interest expense net of interest income, income tax provision (benefit), depreciation and amortization. Adjusted EBITDA is EBITDA adjusted for the items of income and expense and expected incremental revenue and cost savings as described in our senior secured credit agreement covenant calculations. Management believes that the inclusion of supplementary adjustments to EBITDA applied in presenting Adjusted EBITDA is appropriate to provide additional information to investors about one of the principal measures of performance used by our creditors. In addition, management uses EBITDA and Adjusted EBITDA to evaluate our performance. EBITDA and Adjusted EBITDA have limitations as analytical tools, and should not be considered in isolation or as a substitute for analysis of the results as reported under GAAP. These measures may not be comparable to similarly titled measures reported by other companies. Please see the last page of this presentation for the reconciliation of GAAP and non-GAAP measures.
Investor Update K A R G L O B A L // June 14, 2022
4 K A R G L O B A L | I N V E S T O R U P D A T E Transformation

5 K A R G L O B A L | I N V E S T O R U P D A T E Simplifies business and enables faster, more nimble operations How Does 2022 Divestiture Help Transform KAR? Accelerates digital marketplace strategy Sharpens focus and investments on highest growth customer solutions Enhances financial profile and enables higher margin, accelerated growth
6 K A R G L O B A L | I N V E S T O R U P D A T E The New KAR: A Simplified Business Model Marketplace business Floorplan business
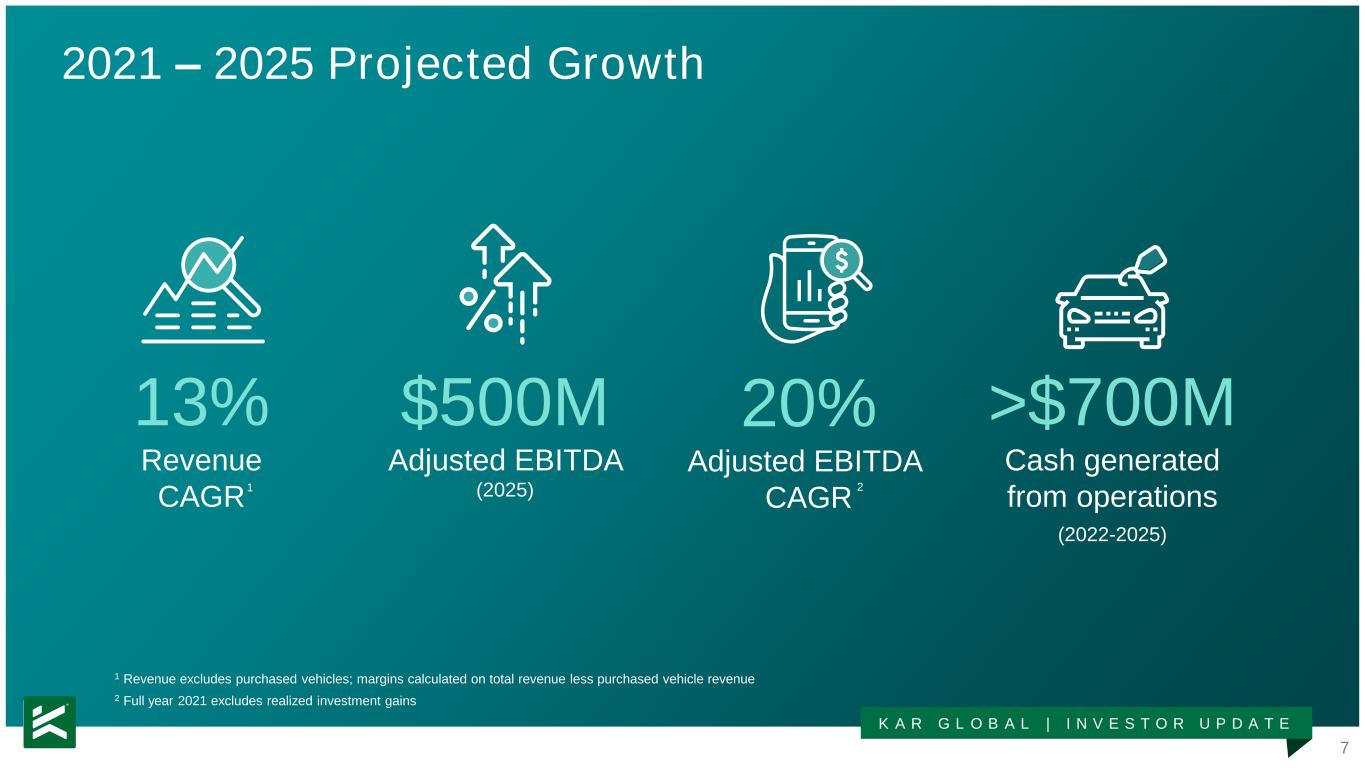
7 K A R G L O B A L | I N V E S T O R U P D A T E $500M Adjusted EBITDA (2025) >$700M Cash generated from operations 2021 – 2025 Projected Growth (2022-2025) 20% Adjusted EBITDA CAGR 13% Revenue CAGR 2 Full year 2021 excludes realized investment gains 1 Revenue excludes purchased vehicles; margins calculated on total revenue less purchased vehicle revenue 1 2
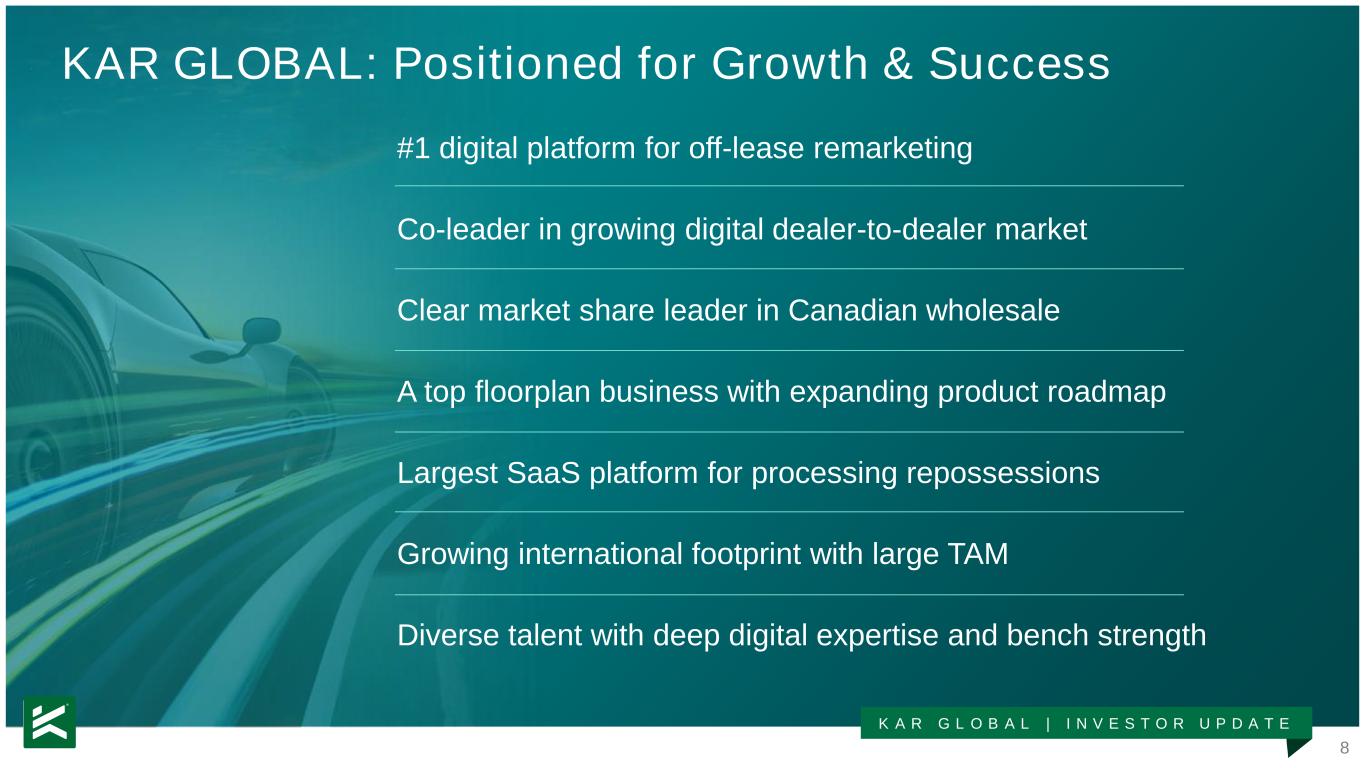
8 K A R G L O B A L | I N V E S T O R U P D A T E KAR GLOBAL: Positioned for Growth & Success #1 digital platform for off-lease remarketing Co-leader in growing digital dealer-to-dealer market Clear market share leader in Canadian wholesale A top floorplan business with expanding product roadmap Largest SaaS platform for processing repossessions Growing international footprint with large TAM Diverse talent with deep digital expertise and bench strength
9 K A R G L O B A L | I N V E S T O R U P D A T E Opportunity Innovation Growth
10 K A R G L O B A L | I N V E S T O R U P D A T E Opportunity

11 K A R G L O B A L | I N V E S T O R U P D A T E - O U R V I S I O N I S TO B U I L D - The world’s greatest digital marketplace for used vehicles
12 K A R G L O B A L | I N V E S T O R U P D A T E Opportunity for Growth: Medium & Long-Term Drivers A large addressable market in North America and abroad Increasing digital adoption across the industry Deep digital talent with track record of innovation and growth
13 K A R G L O B A L | I N V E S T O R U P D A T E Opportunity for Growth: Near-Term Challenges Persist Production shortages caused by supply chain disruption Volume may be slower than originally anticipated Economic uncertainty and inflation create additional risk
K A R G L O B A L | I N V E S T O R U P D A T E 14 A Large Addressable Market Exists 60M 100K Retail used (40M) and wholesale (20M) vehicle transactions annually Industry marketplace participants: dealers and other commercial sellers and buyers Source: VIO and Retail amounts: Experian, IHS, National Automobile Dealer’s Association, DesRosiers Automotive Consultants and management estimates. Wholesale amounts: National Auto Auction Association and management estimates ~ >
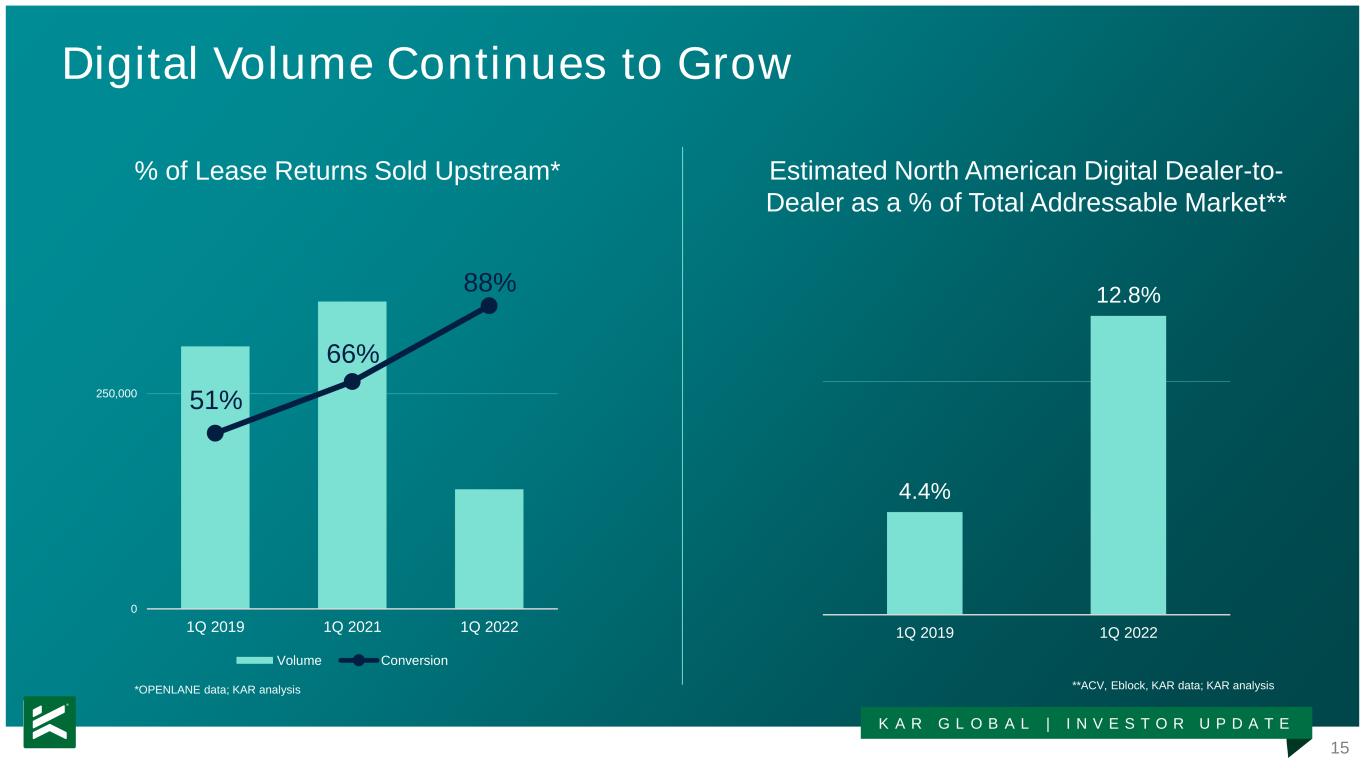
15 K A R G L O B A L | I N V E S T O R U P D A T E 51% 66% 88% 0 250,000 1Q 2019 1Q 2021 1Q 2022 Volume Conversion Digital Volume Continues to Grow % of Lease Returns Sold Upstream* Estimated North American Digital Dealer-to- Dealer as a % of Total Addressable Market** *OPENLANE data; KAR analysis **ACV, Eblock, KAR data; KAR analysis 4.4% 12.8% 1Q 2019 1Q 2022
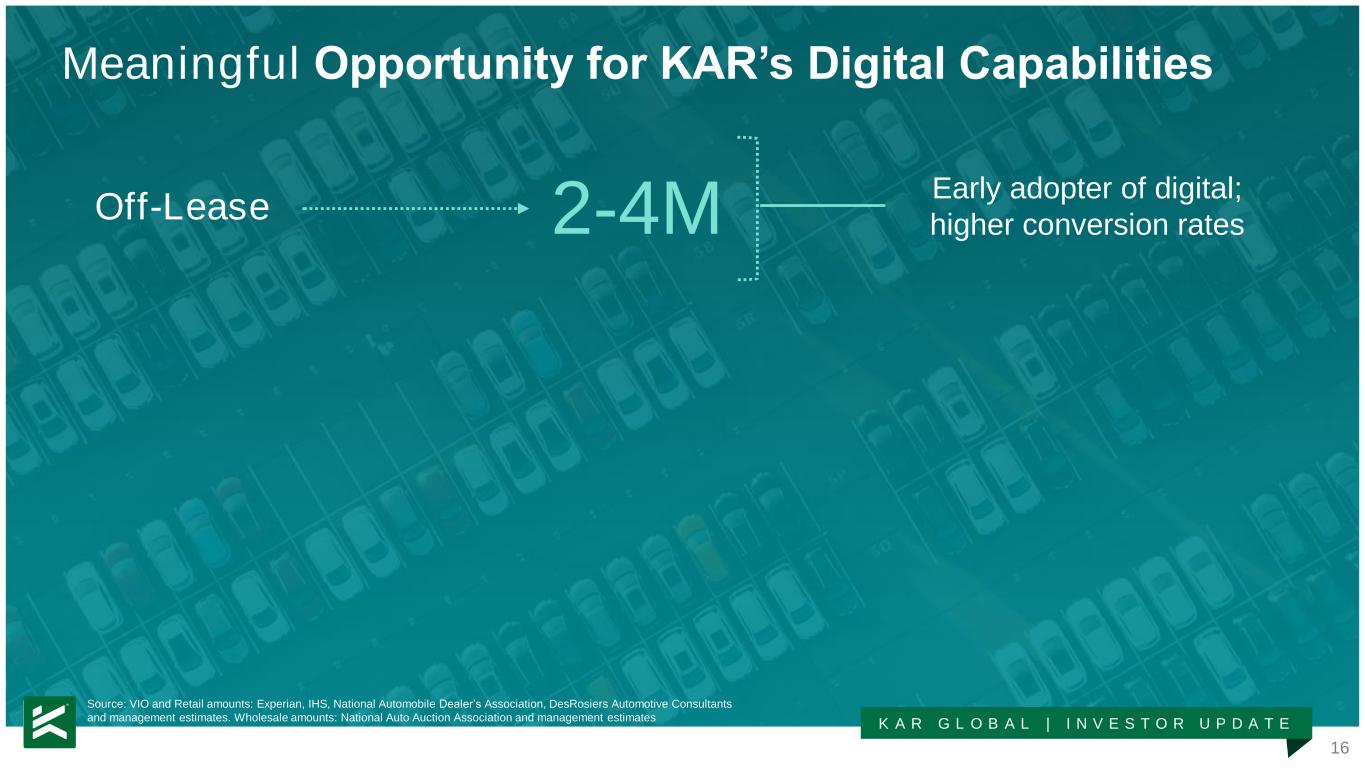
K A R G L O B A L | I N V E S T O R U P D A T E 16 Meaningful Opportunity for KAR’s Digital Capabilities 2-4M Off-Lease Early adopter of digital; higher conversion rates Source: VIO and Retail amounts: Experian, IHS, National Automobile Dealer’s Association, DesRosiers Automotive Consultants and management estimates. Wholesale amounts: National Auto Auction Association and management estimates

K A R G L O B A L | I N V E S T O R U P D A T E 17 ~10M Dealer-to-Dealer Largest wholesale segment; still in early stages of digital evolution Meaningful Opportunity for KAR’s Digital Capabilities Source: VIO and Retail amounts: Experian, IHS, National Automobile Dealer’s Association, DesRosiers Automotive Consultants and management estimates. Wholesale amounts: National Auto Auction Association and management estimates
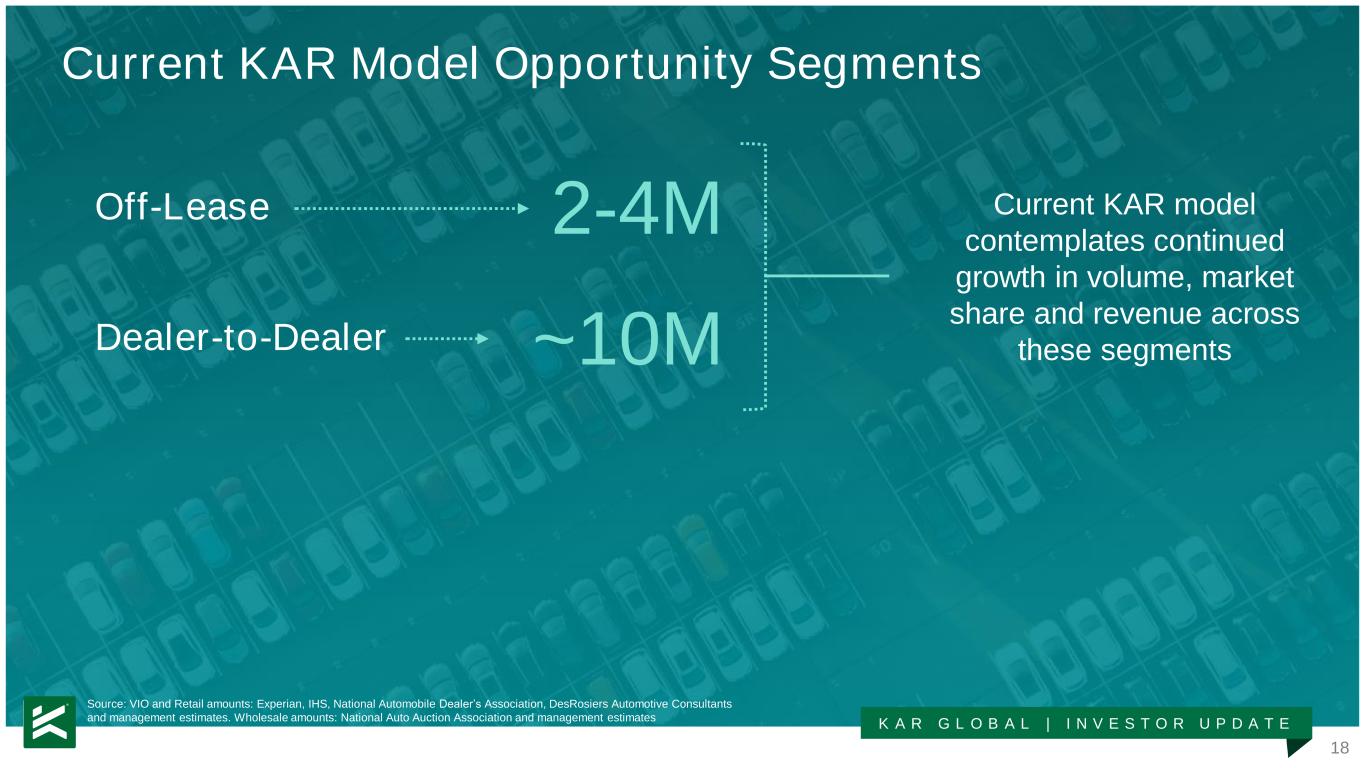
K A R G L O B A L | I N V E S T O R U P D A T E 18 Current KAR Model Opportunity Segments 2-4M ~10M Off-Lease Dealer-to-Dealer Current KAR model contemplates continued growth in volume, market share and revenue across these segments Source: VIO and Retail amounts: Experian, IHS, National Automobile Dealer’s Association, DesRosiers Automotive Consultants and management estimates. Wholesale amounts: National Auto Auction Association and management estimates
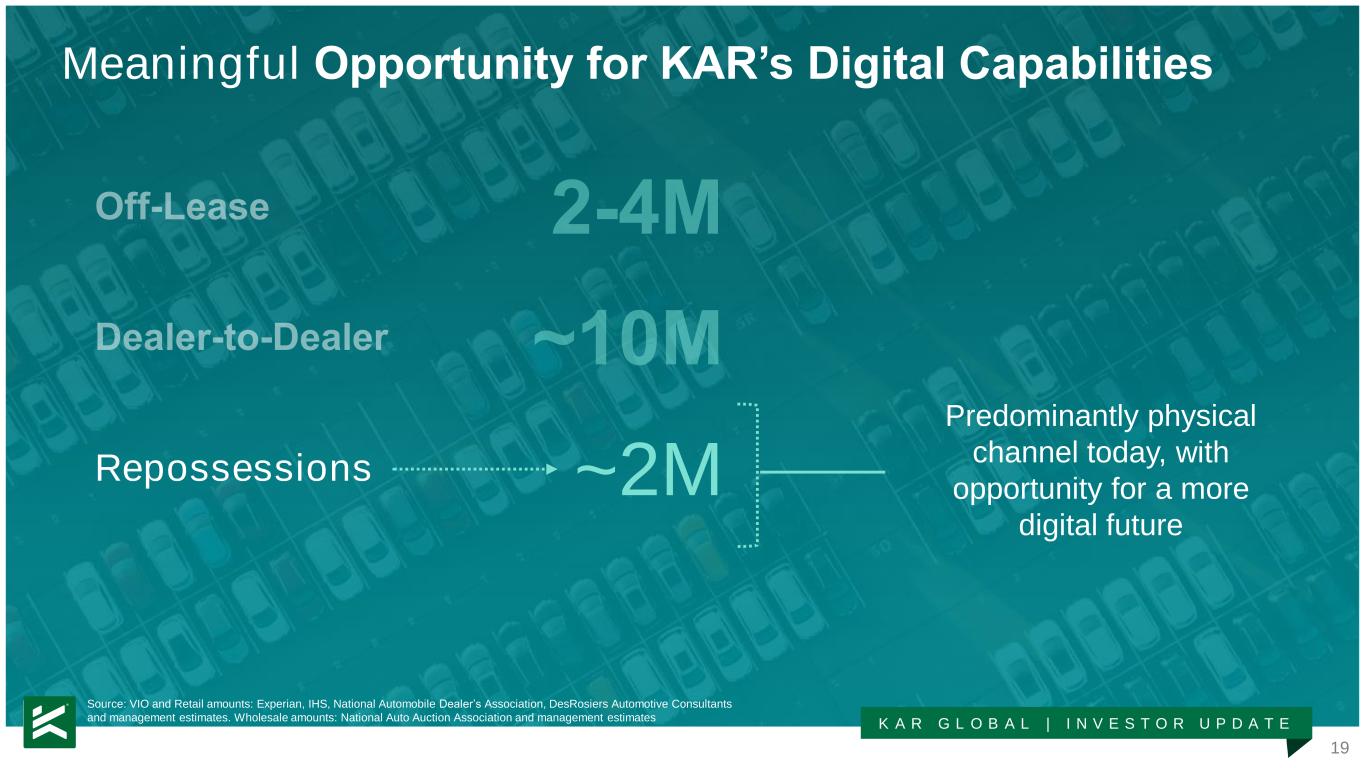
K A R G L O B A L | I N V E S T O R U P D A T E 19 ~2M Repossessions Predominantly physical channel today, with opportunity for a more digital future Meaningful Opportunity for KAR’s Digital Capabilities Source: VIO and Retail amounts: Experian, IHS, National Automobile Dealer’s Association, DesRosiers Automotive Consultants and management estimates. Wholesale amounts: National Auto Auction Association and management estimates
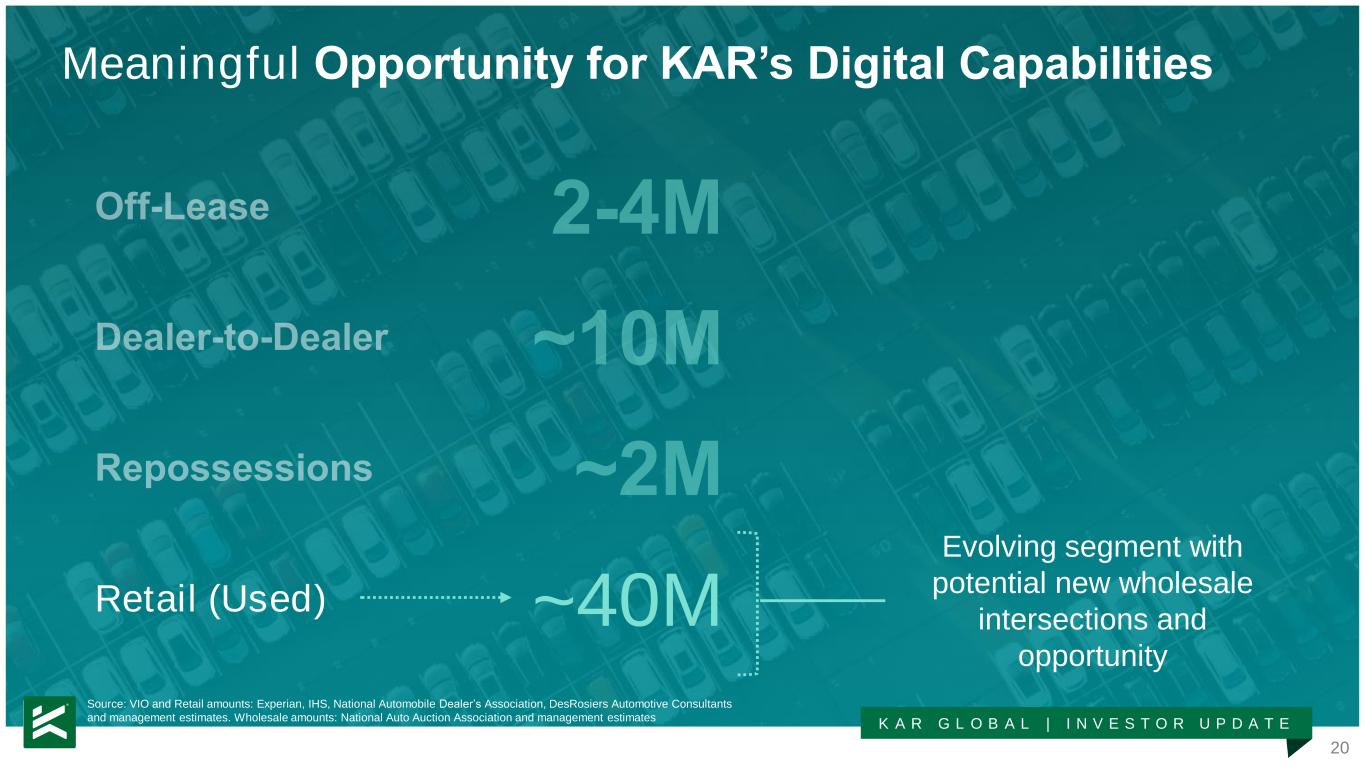
K A R G L O B A L | I N V E S T O R U P D A T E 20 ~40MRetail (Used) Evolving segment with potential new wholesale intersections and opportunity Meaningful Opportunity for KAR’s Digital Capabilities Source: VIO and Retail amounts: Experian, IHS, National Automobile Dealer’s Association, DesRosiers Automotive Consultants and management estimates. Wholesale amounts: National Auto Auction Association and management estimates
21 K A R G L O B A L | I N V E S T O R U P D A T E Innovation

22 K A R G L O B A L | I N V E S T O R U P D A T E “Make wholesale easy so our customers can be more successful” - O U R P U R P O S E I S TO -
23 K A R G L O B A L | I N V E S T O R U P D A T E KAR’s Digital Platforms Deliver Better Outcomes *core inventory <$10,000 Digital Sales are Faster Digital Sales are More Profitable
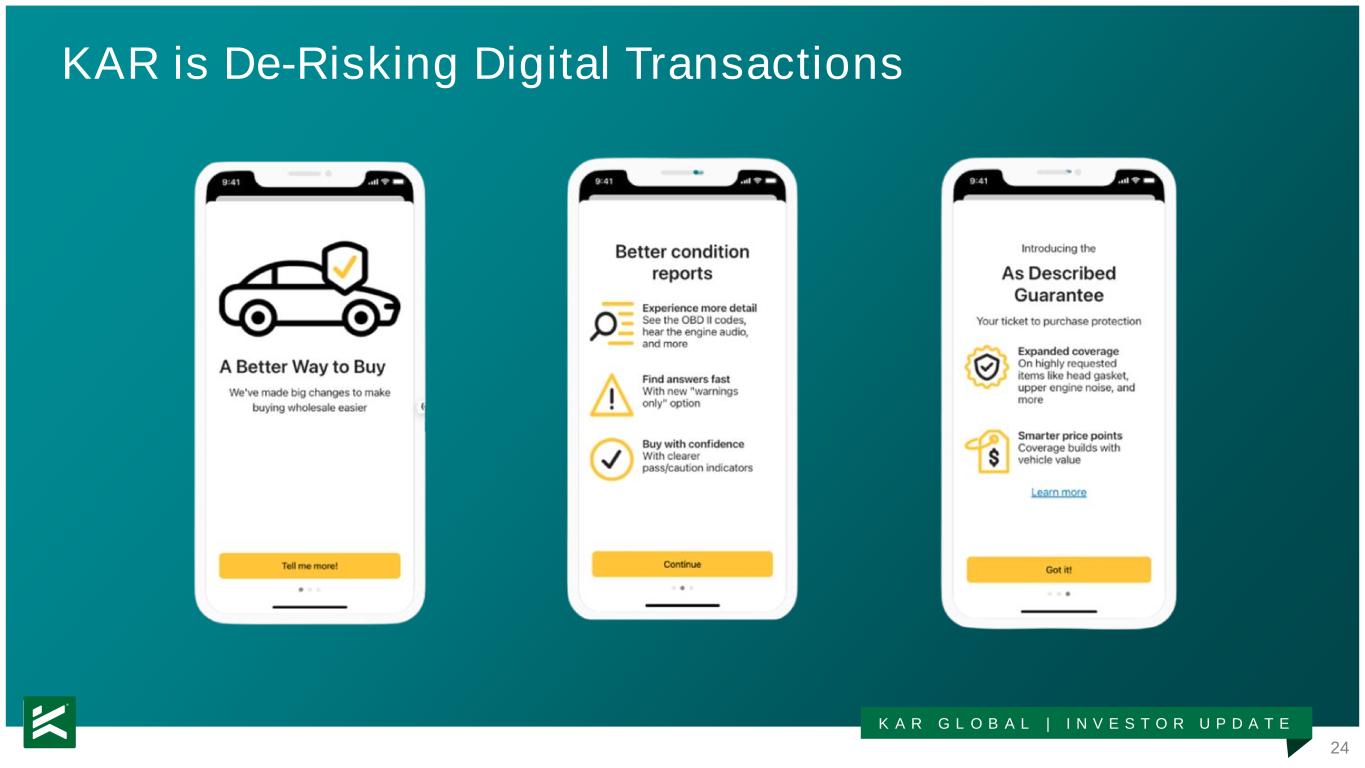
24 K A R G L O B A L | I N V E S T O R U P D A T E KAR is De-Risking Digital Transactions
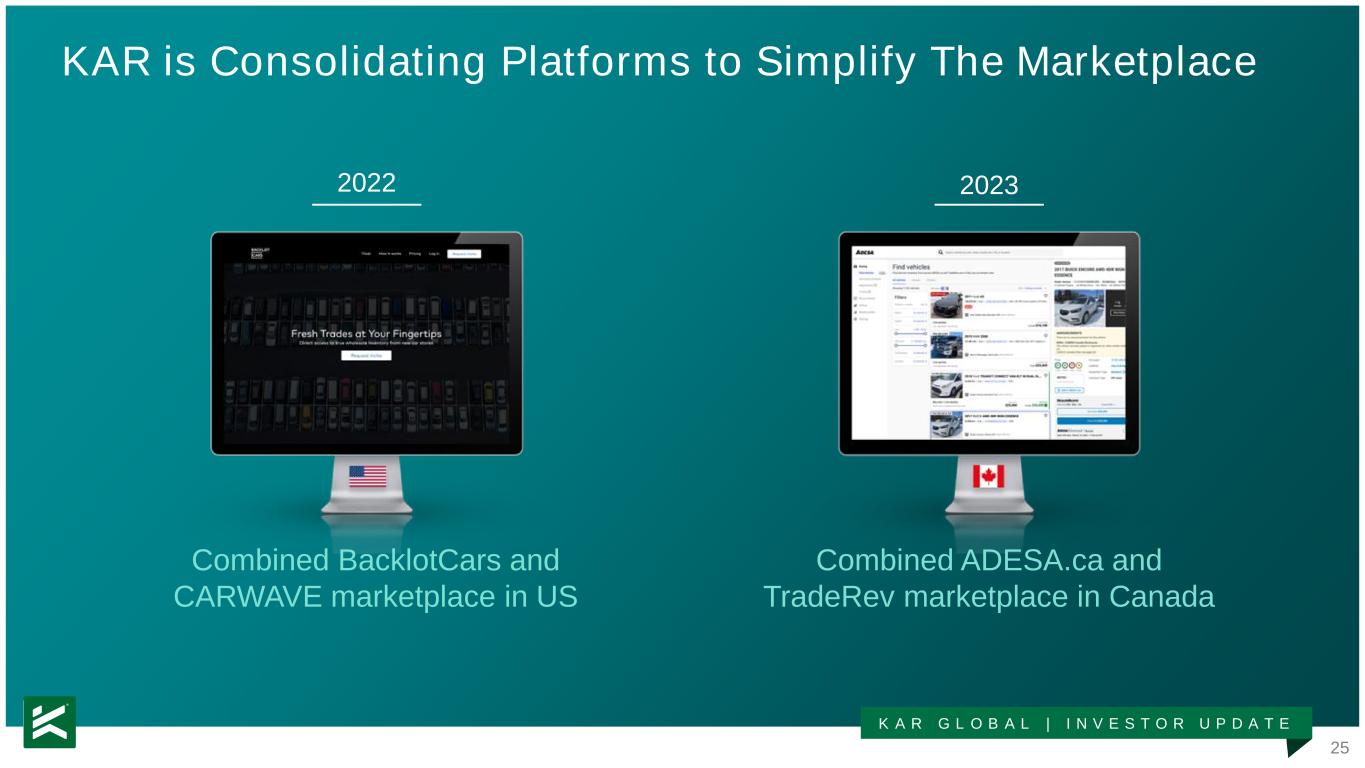
25 K A R G L O B A L | I N V E S T O R U P D A T E KAR is Consolidating Platforms to Simplify The Marketplace Combined BacklotCars and CARWAVE marketplace in US 2022 2023 Combined ADESA.ca and TradeRev marketplace in Canada
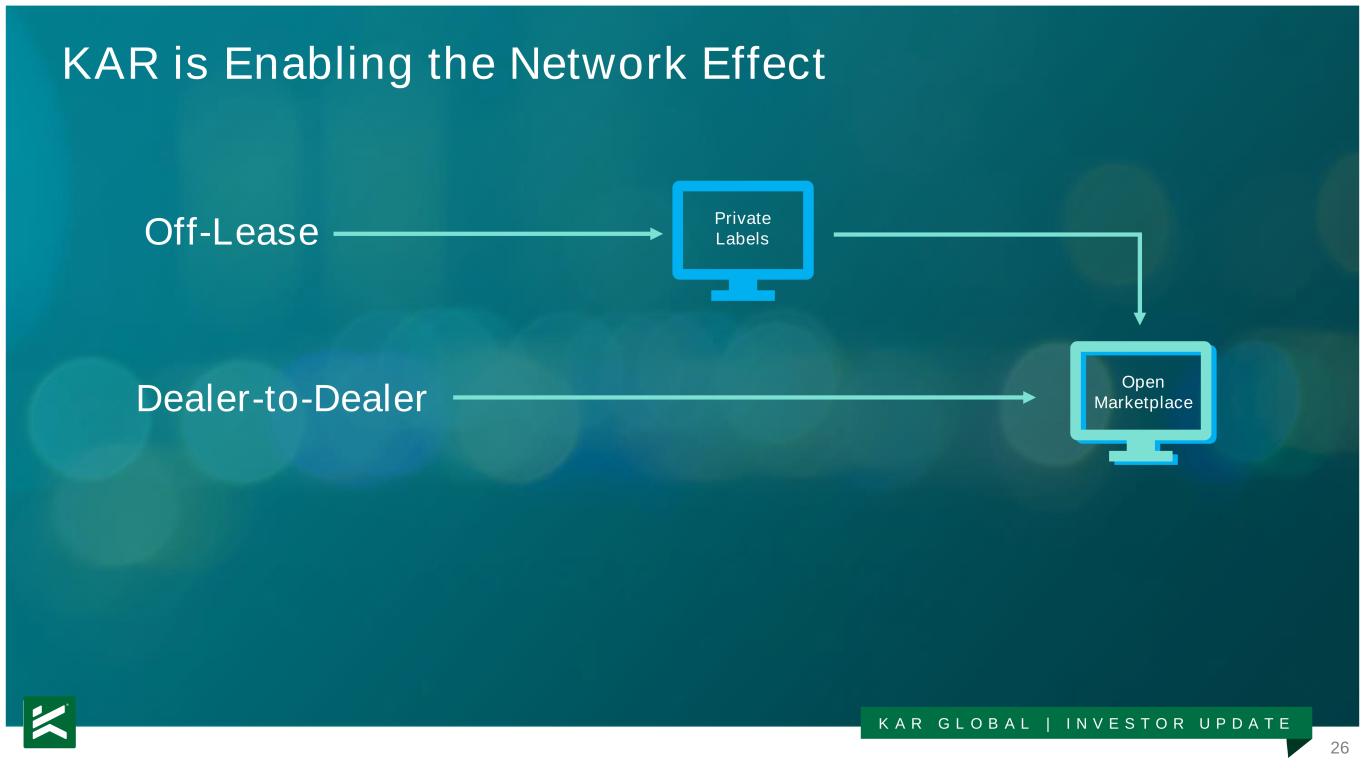
26 K A R G L O B A L | I N V E S T O R U P D A T E Off-Lease Dealer-to-Dealer Open Marketplace KAR is Enabling the Network Effect Private Labels
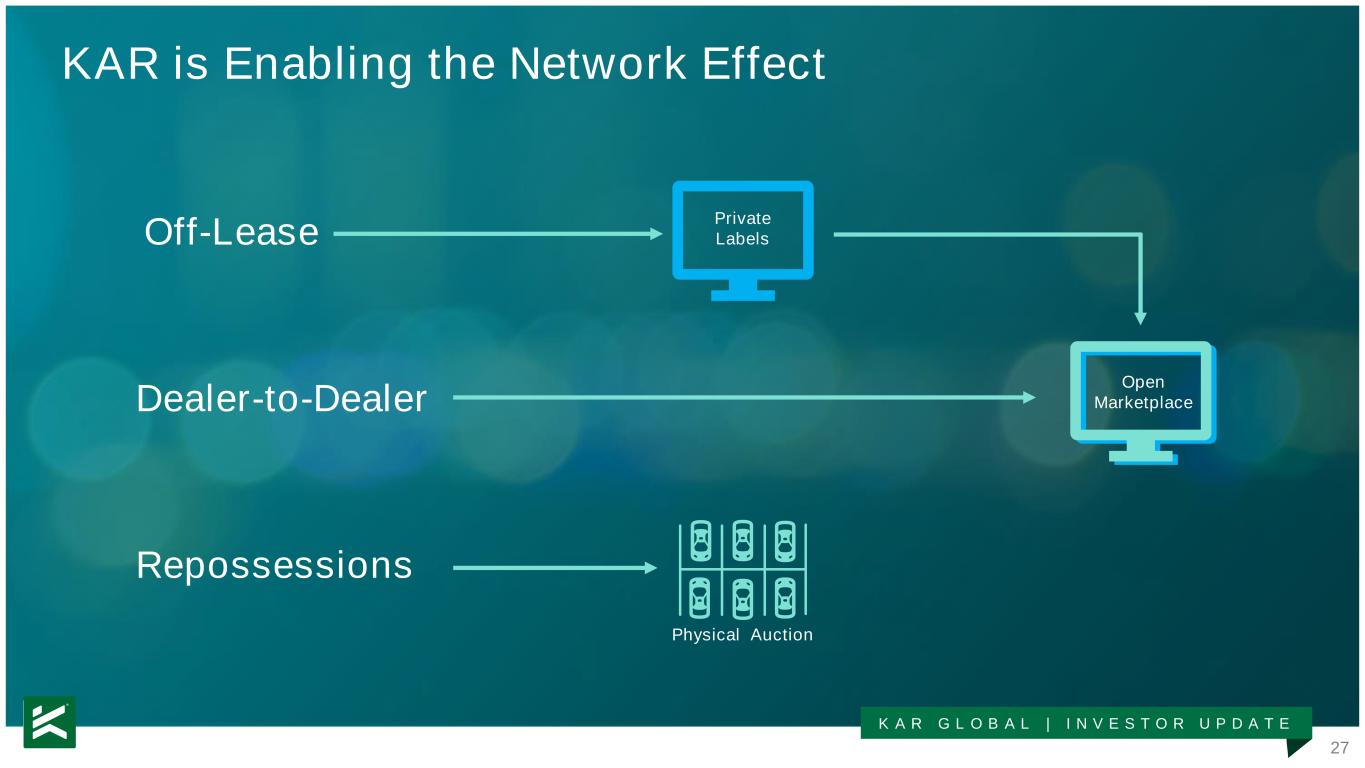
27 K A R G L O B A L | I N V E S T O R U P D A T E Off-Lease Dealer-to-Dealer Repossessions Open Marketplace KAR is Enabling the Network Effect Private Labels Physical Auction
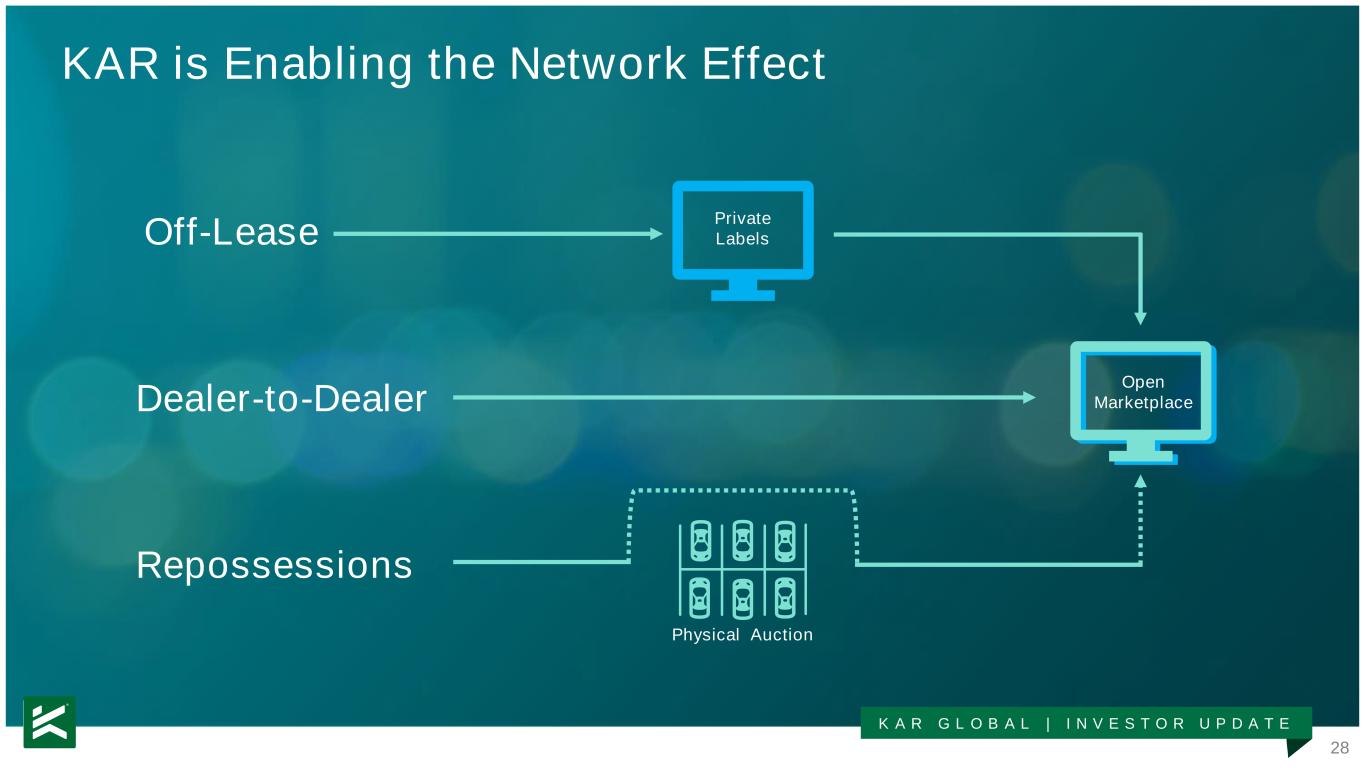
28 K A R G L O B A L | I N V E S T O R U P D A T E Off-Lease Dealer-to-Dealer Repossessions Private Labels Open Marketplace Physical Auction KAR is Enabling the Network Effect

29 K A R G L O B A L | I N V E S T O R U P D A T E KAR is Helping Dealers Compete in a Digital Retail World Guaranteed OfferTrade-in at Home Ongoing partnership providing pricing and trade-in remarketing solutions Suite of dealer tools to assist with lead gen, pricing and trade-in remarketing
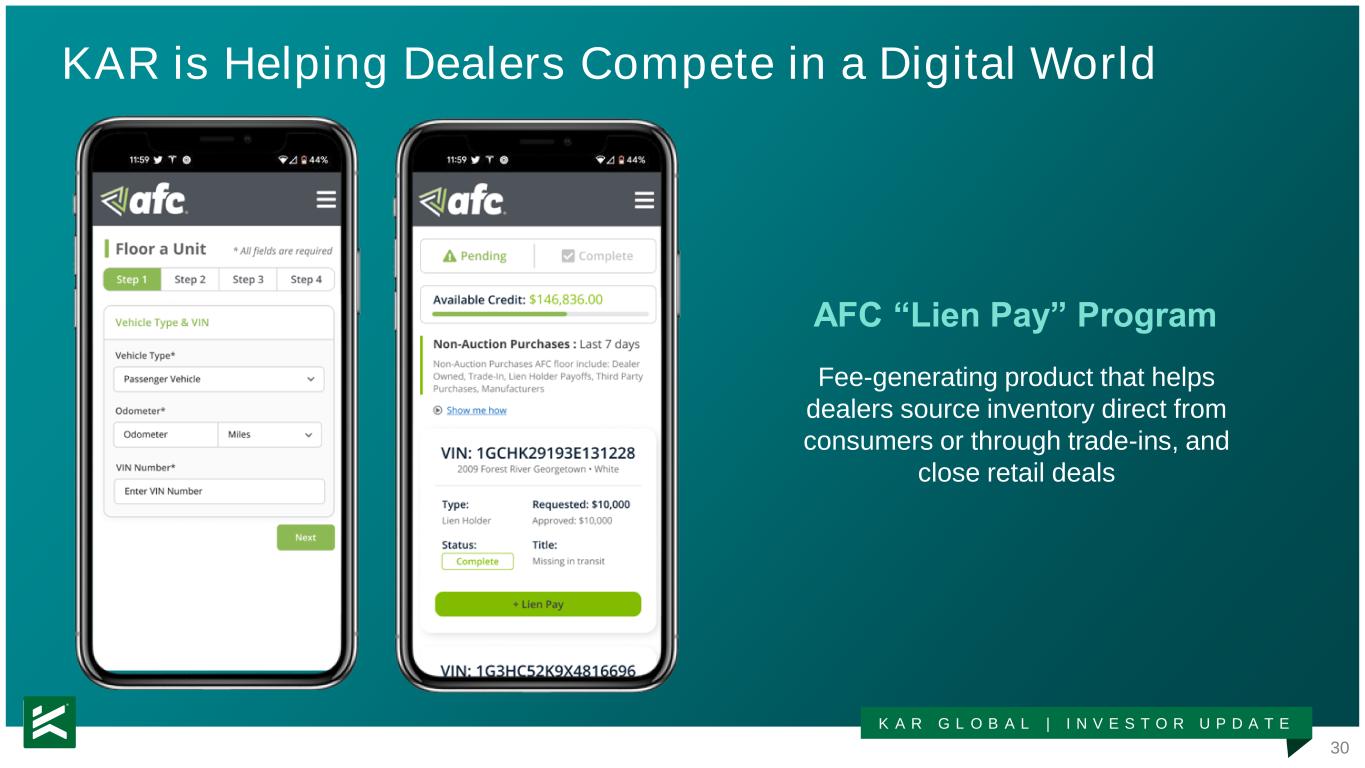
30 K A R G L O B A L | I N V E S T O R U P D A T E KAR is Helping Dealers Compete in a Digital World AFC “Lien Pay” Program Fee-generating product that helps dealers source inventory direct from consumers or through trade-ins, and close retail deals
31 K A R G L O B A L | I N V E S T O R U P D A T E Innovation
32 K A R G L O B A L | I N V E S T O R U P D A T E Growth
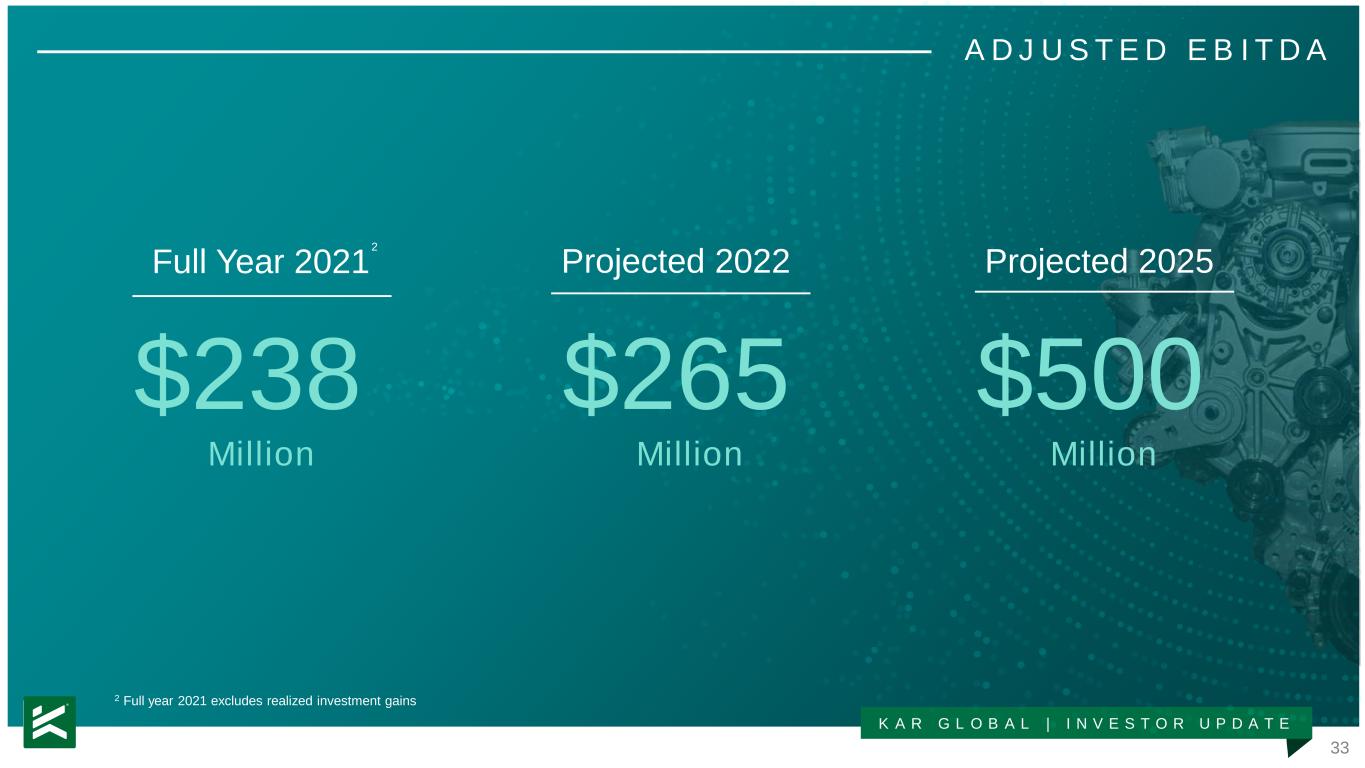
33 K A R G L O B A L | I N V E S T O R U P D A T E A D J U S T E D E B I T D A $265 Million $500 Million $238 Million Projected 2022Full Year 2021 Projected 2025 2 2 Full year 2021 excludes realized investment gains
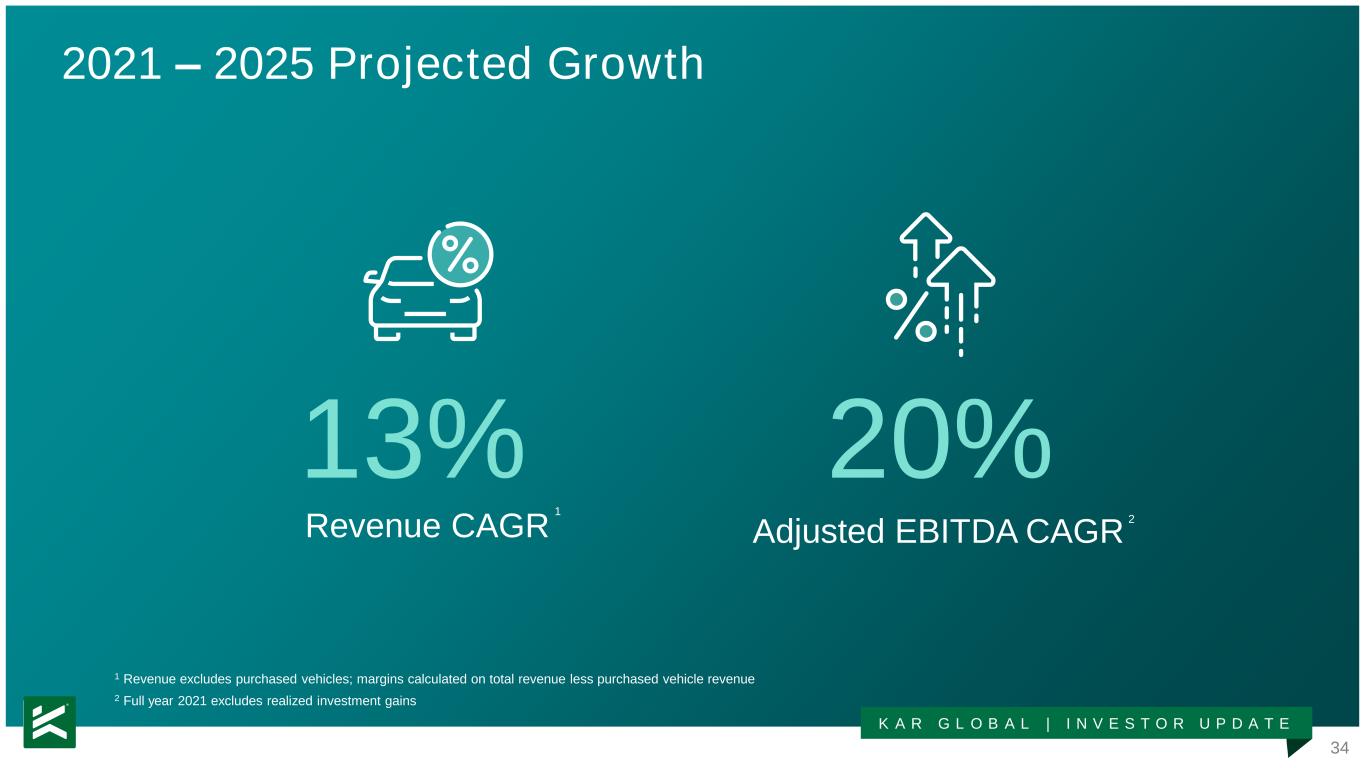
34 K A R G L O B A L | I N V E S T O R U P D A T E 2021 – 2025 Projected Growth 13% Revenue CAGR 20% Adjusted EBITDA CAGR 1 2 2 Full year 2021 excludes realized investment gains 1 Revenue excludes purchased vehicles; margins calculated on total revenue less purchased vehicle revenue
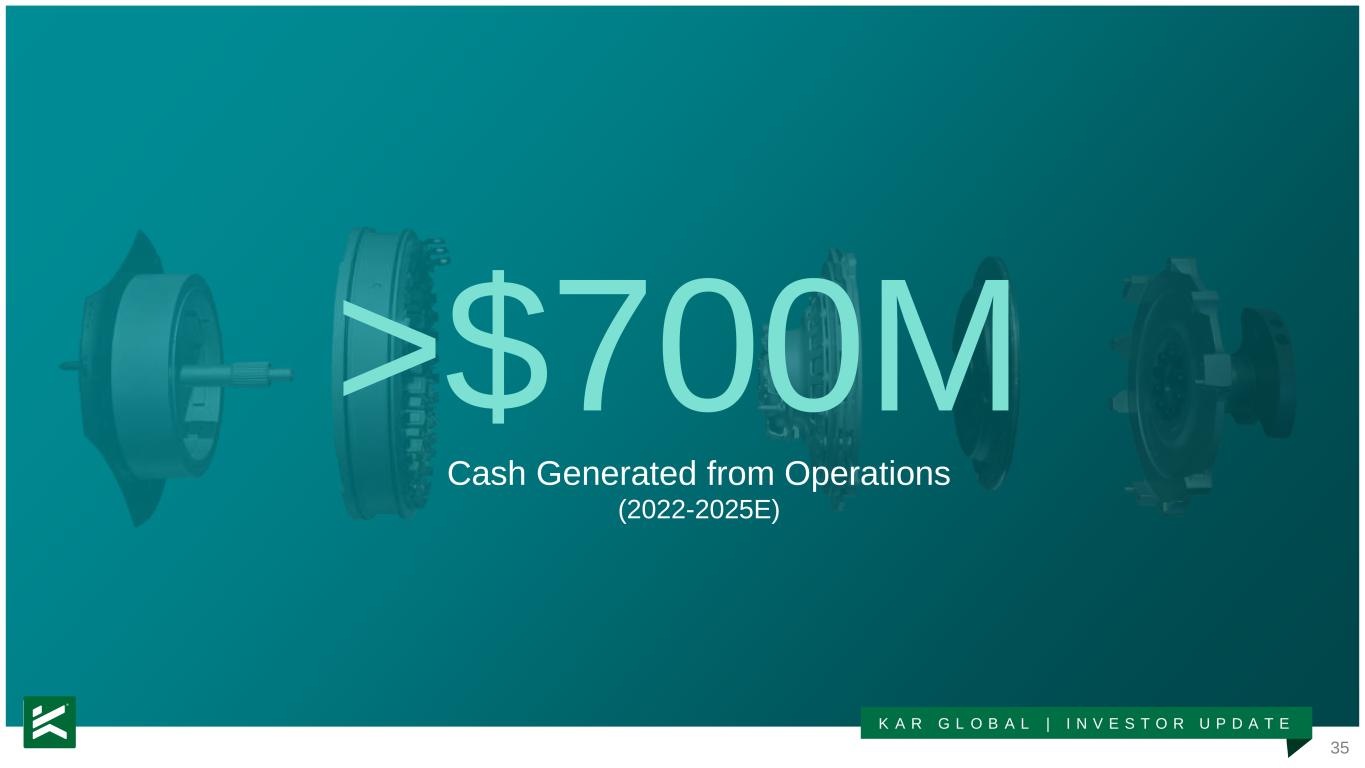
35 K A R G L O B A L | I N V E S T O R U P D A T E >$700M Cash Generated from Operations (2022-2025E)
36 K A R G L O B A L | I N V E S T O R U P D A T E Financial Model Highlights Attractive cash flows High-growth digital marketplace business Growth & improved profitability Lower cost operating model
37 K A R G L O B A L | I N V E S T O R U P D A T E Financial Model Highlights High-growth digital marketplace business

38 K A R G L O B A L | I N V E S T O R U P D A T E $101M 2021 Revenue 94% 2021 Gross Profit % of Revenue 13% 2021-2025E Revenue CAGR Marketplace Business: Off-lease 1 1 1The top industry platform supporting ~80% of North America’s off-lease inventory 1 Revenue excludes purchased vehicles; margins calculated on total revenue less purchased vehicle revenue
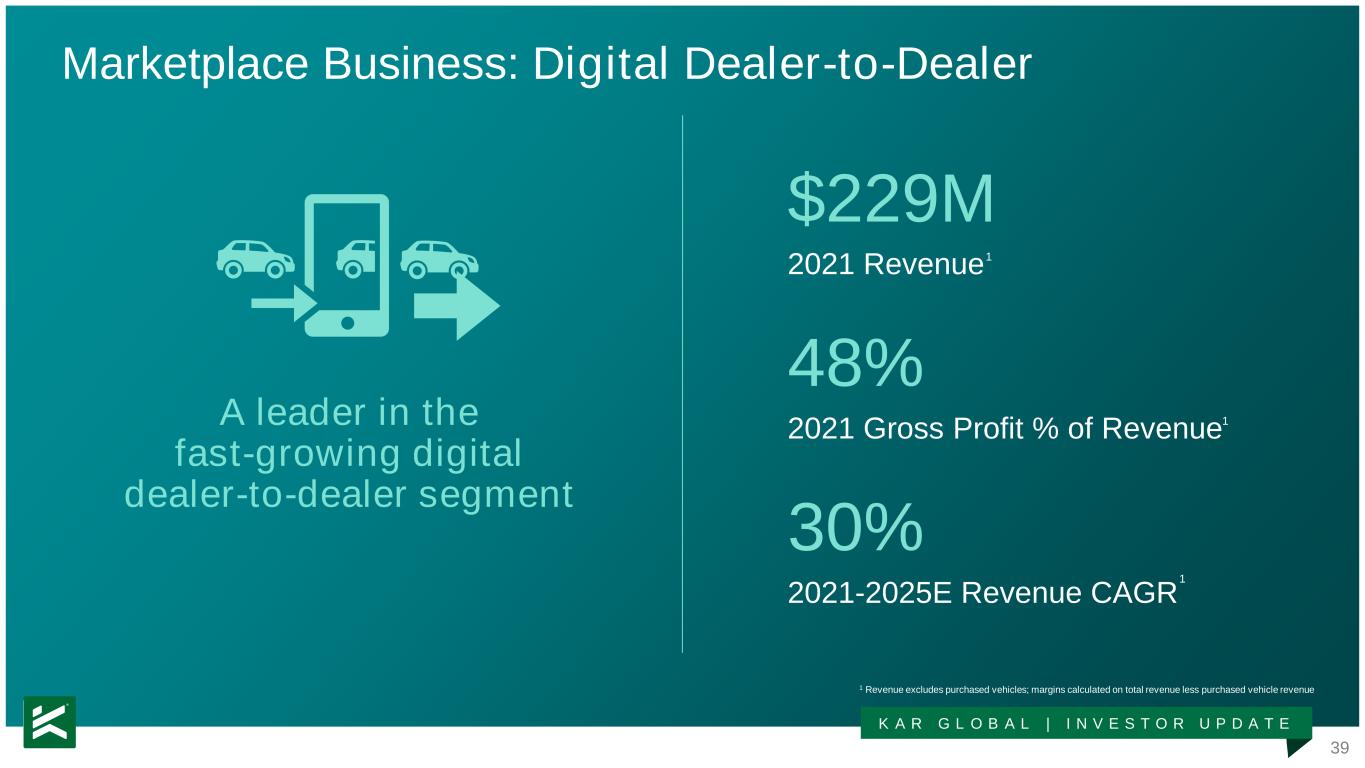
39 K A R G L O B A L | I N V E S T O R U P D A T E $229M 2021 Revenue 48% 2021 Gross Profit % of Revenue 30% 2021-2025E Revenue CAGR Marketplace Business: Digital Dealer-to-Dealer 1 1 1A leader in the fast-growing digital dealer-to-dealer segment 1 Revenue excludes purchased vehicles; margins calculated on total revenue less purchased vehicle revenue
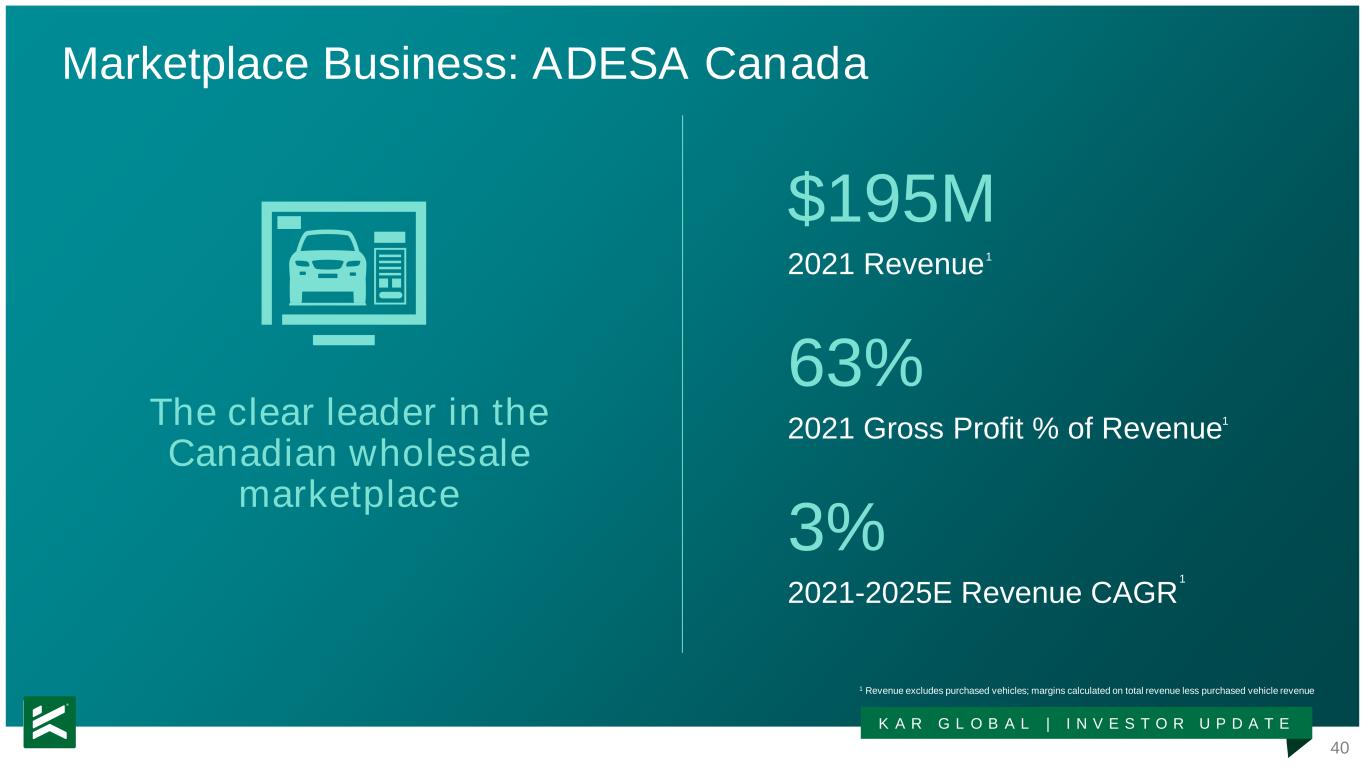
40 K A R G L O B A L | I N V E S T O R U P D A T E $195M 2021 Revenue 63% 2021 Gross Profit % of Revenue 3% 2021-2025E Revenue CAGR Marketplace Business: ADESA Canada 1 1 1The clear leader in the Canadian wholesale marketplace 1 Revenue excludes purchased vehicles; margins calculated on total revenue less purchased vehicle revenue

41 K A R G L O B A L | I N V E S T O R U P D A T E $336M 2021 Revenue 15% 2021 Gross Profit % of Revenue 7% 2021-2025E Revenue CAGR Marketplace Business: Services 1 1 1Comprehensive service offerings that support our marketplaces and deliver an easier customer experience 1 Revenue excludes purchased vehicles; margins calculated on total revenue less purchased vehicle revenue

42 K A R G L O B A L | I N V E S T O R U P D A T E $79M 2021 Revenue 60% 2021 Gross Profit % of Revenue 7% 2021-2025E Revenue CAGR Marketplace Business: International - Europe 1 1 1Growing UK & EU digital footprint with large addressable market 1 Revenue excludes purchased vehicles; margins calculated on total revenue less purchased vehicle revenue
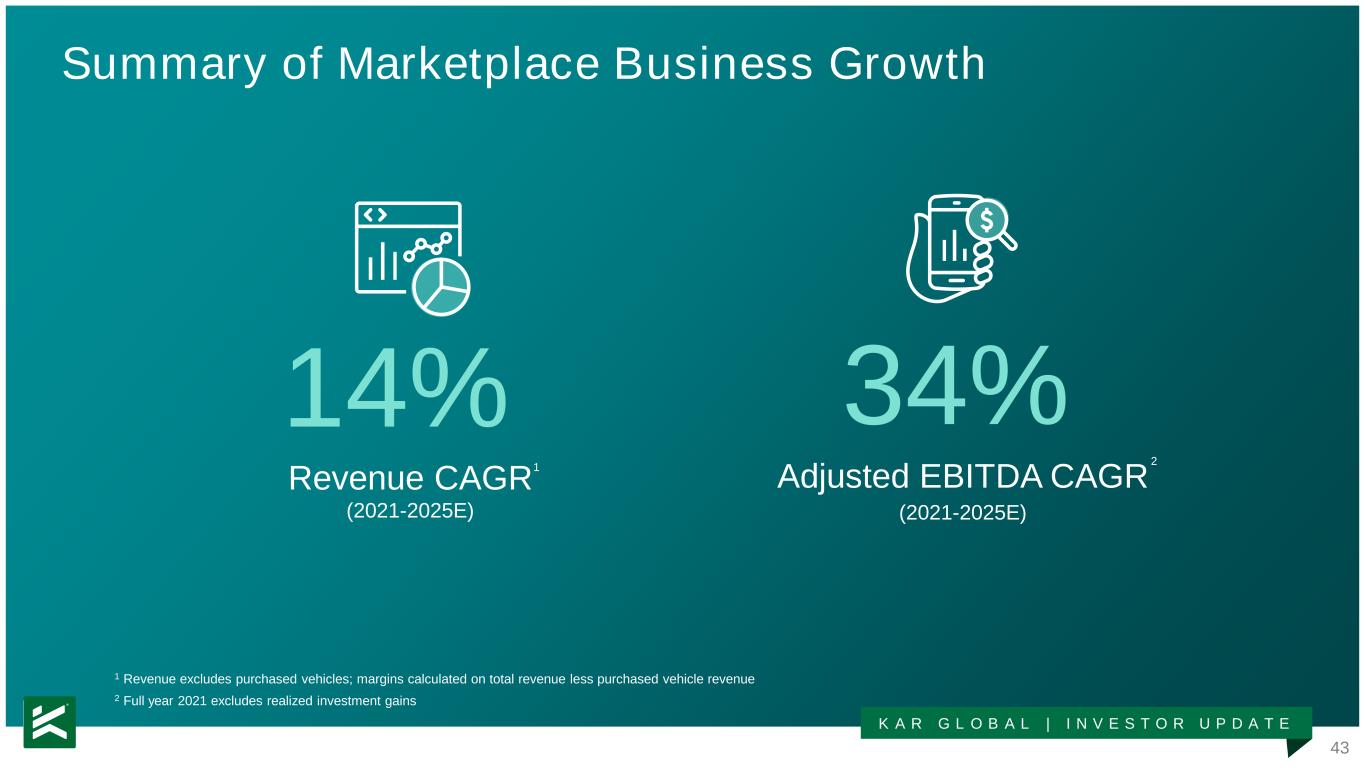
43 K A R G L O B A L | I N V E S T O R U P D A T E Summary of Marketplace Business Growth 14% 34% Revenue CAGR (2021-2025E) 1 Adjusted EBITDA CAGR (2021-2025E) 2 2 Full year 2021 excludes realized investment gains 1 Revenue excludes purchased vehicles; margins calculated on total revenue less purchased vehicle revenue
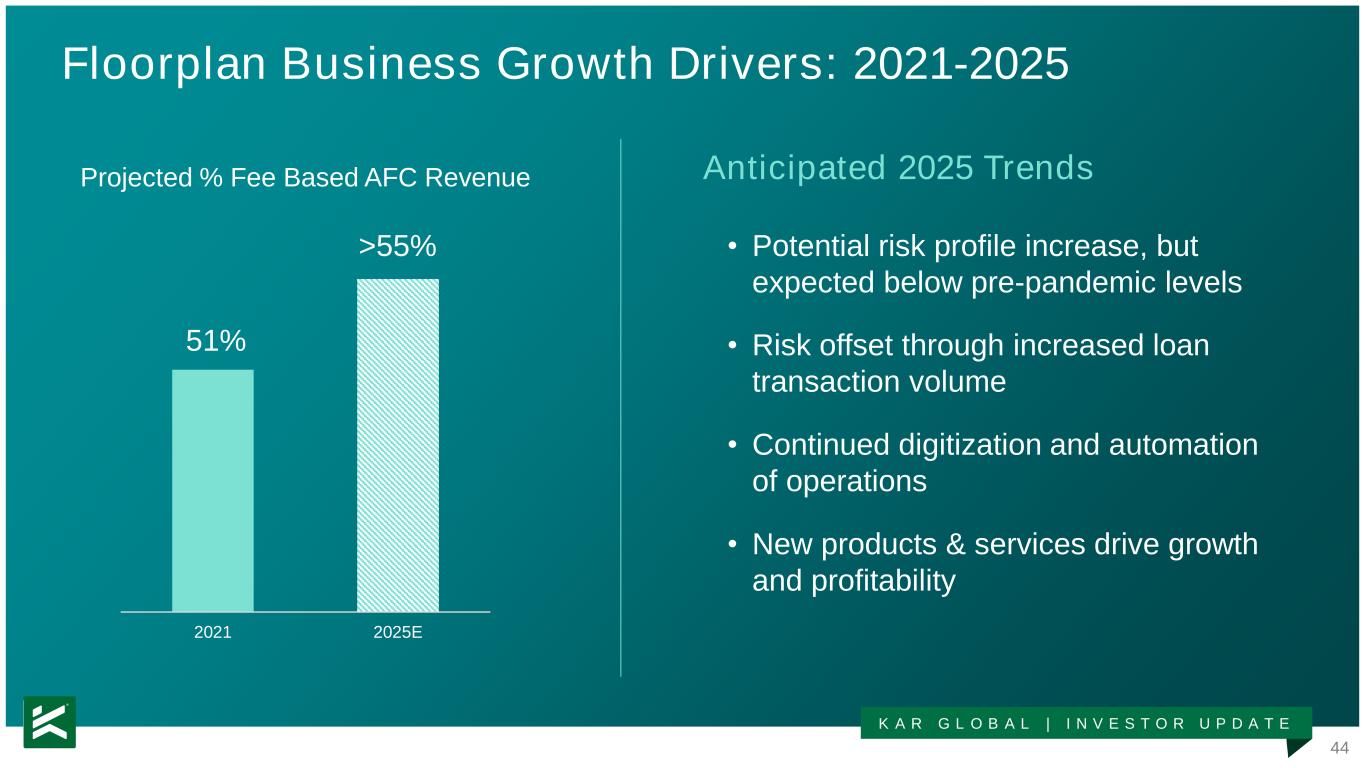
44 K A R G L O B A L | I N V E S T O R U P D A T E 2021 2025E 51% Floorplan Business Growth Drivers: 2021-2025 • Potential risk profile increase, but expected below pre-pandemic levels • Risk offset through increased loan transaction volume • Continued digitization and automation of operations • New products & services drive growth and profitability Projected % Fee Based AFC Revenue Anticipated 2025 Trends >55%
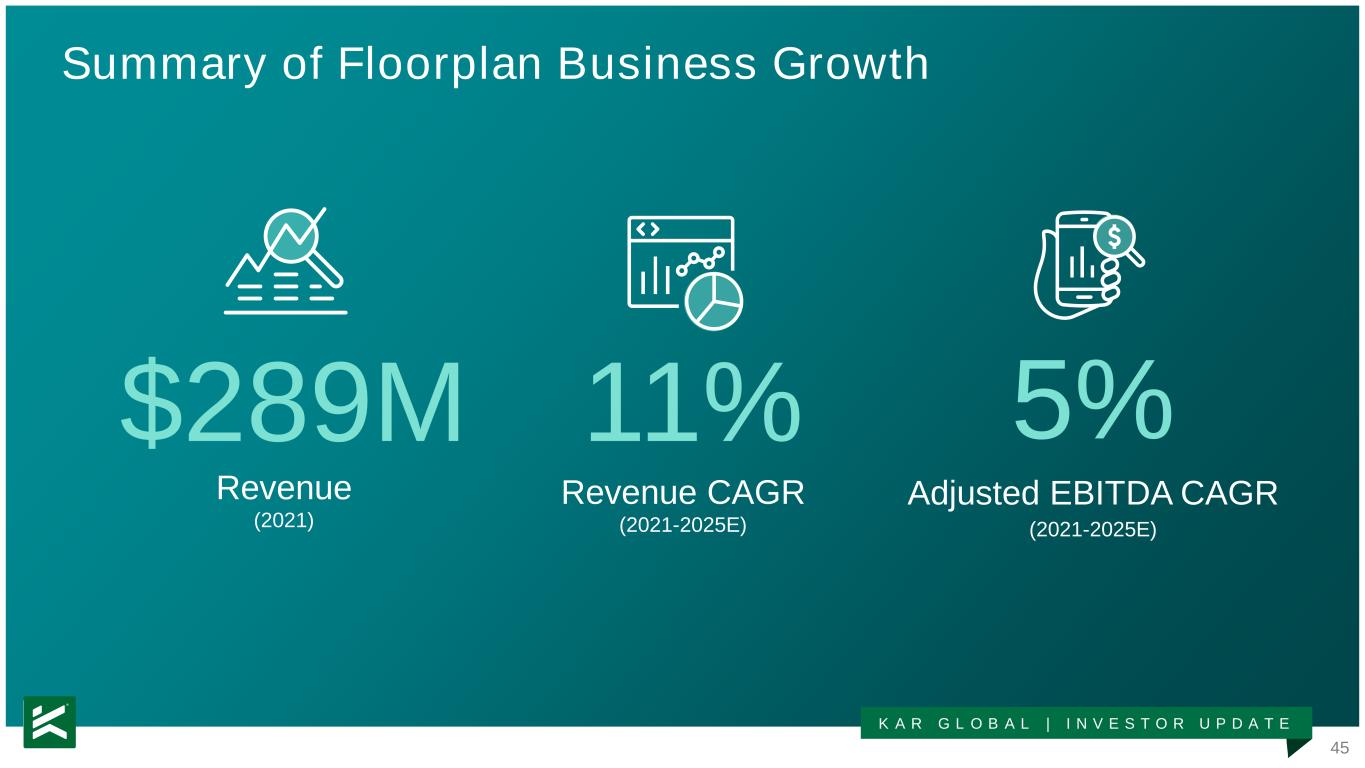
45 K A R G L O B A L | I N V E S T O R U P D A T E $289M Summary of Floorplan Business Growth 11% 5% Revenue (2021) Revenue CAGR (2021-2025E) Adjusted EBITDA CAGR (2021-2025E)
46 K A R G L O B A L | I N V E S T O R U P D A T E Financial Model Highlights Lower cost operating model
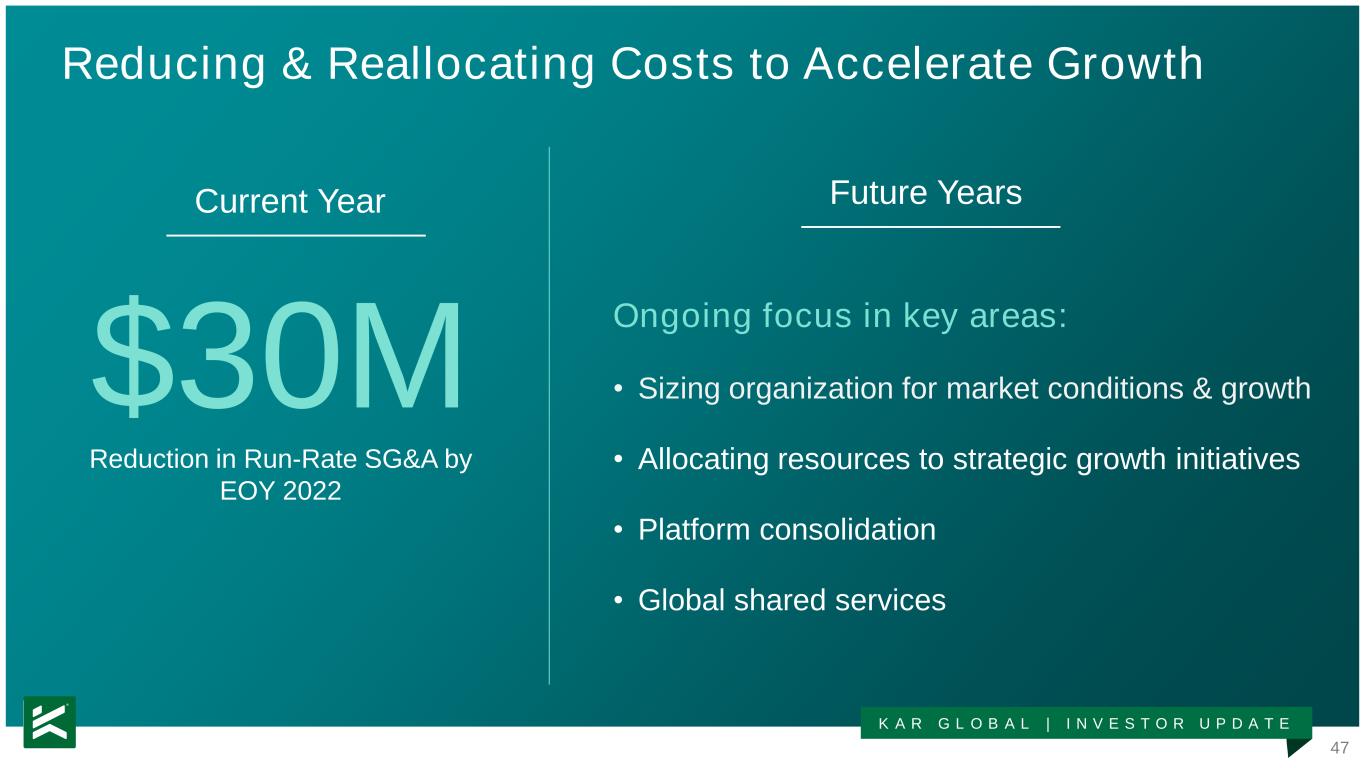
47 K A R G L O B A L | I N V E S T O R U P D A T E Reducing & Reallocating Costs to Accelerate Growth $30M Reduction in Run-Rate SG&A by EOY 2022 Ongoing focus in key areas: • Sizing organization for market conditions & growth • Allocating resources to strategic growth initiatives • Platform consolidation • Global shared services Current Year Future Years
48 K A R G L O B A L | I N V E S T O R U P D A T E Financial Model Highlights Growth & improved profitability
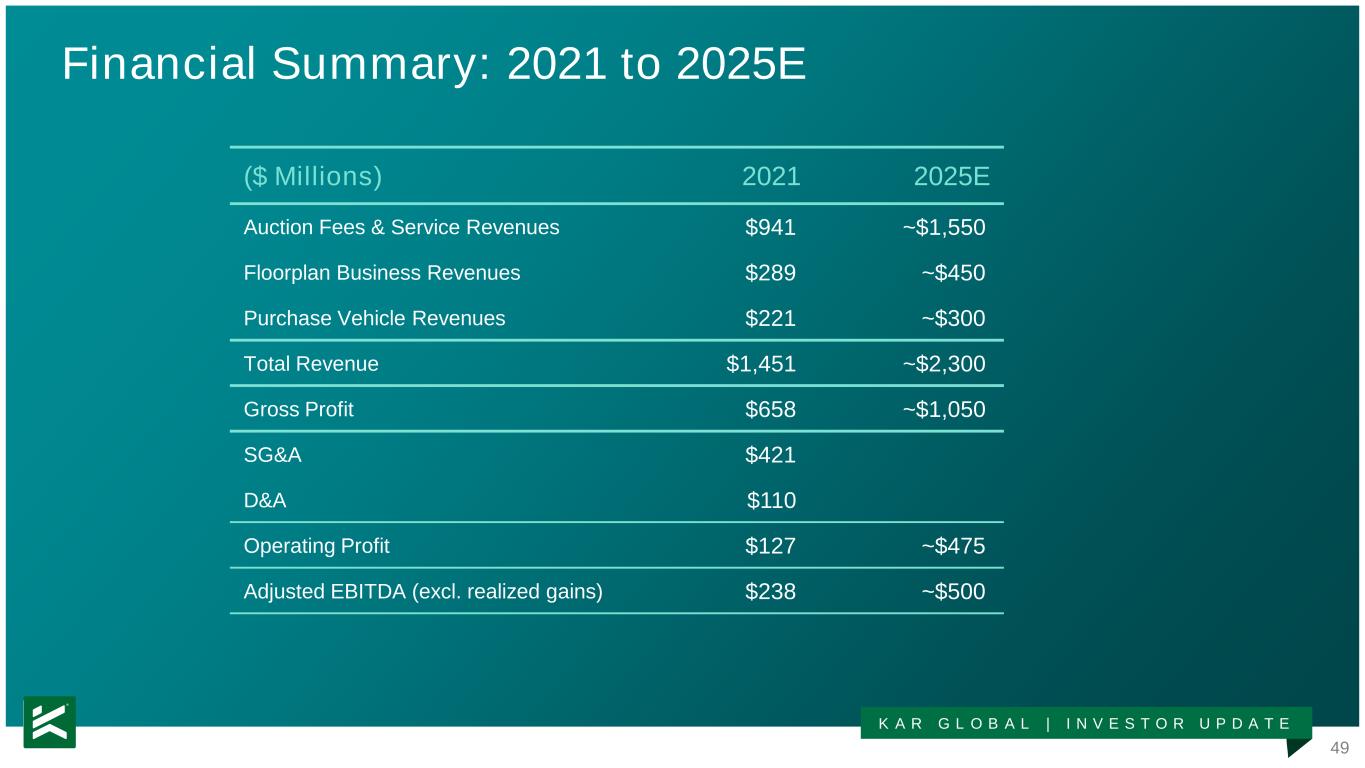
49 K A R G L O B A L | I N V E S T O R U P D A T E Financial Summary: 2021 to 2025E ($ Millions) 2021 2025E Auction Fees & Service Revenues $941 ~$1,550 Floorplan Business Revenues $289 ~$450 Purchase Vehicle Revenues $221 ~$300 Total Revenue $1,451 ~$2,300 Gross Profit $658 ~$1,050 SG&A $421 D&A $110 Operating Profit $127 ~$475 Adjusted EBITDA (excl. realized gains) $238 ~$500
50 K A R G L O B A L | I N V E S T O R U P D A T E Financial Model Highlights Attractive cash flows
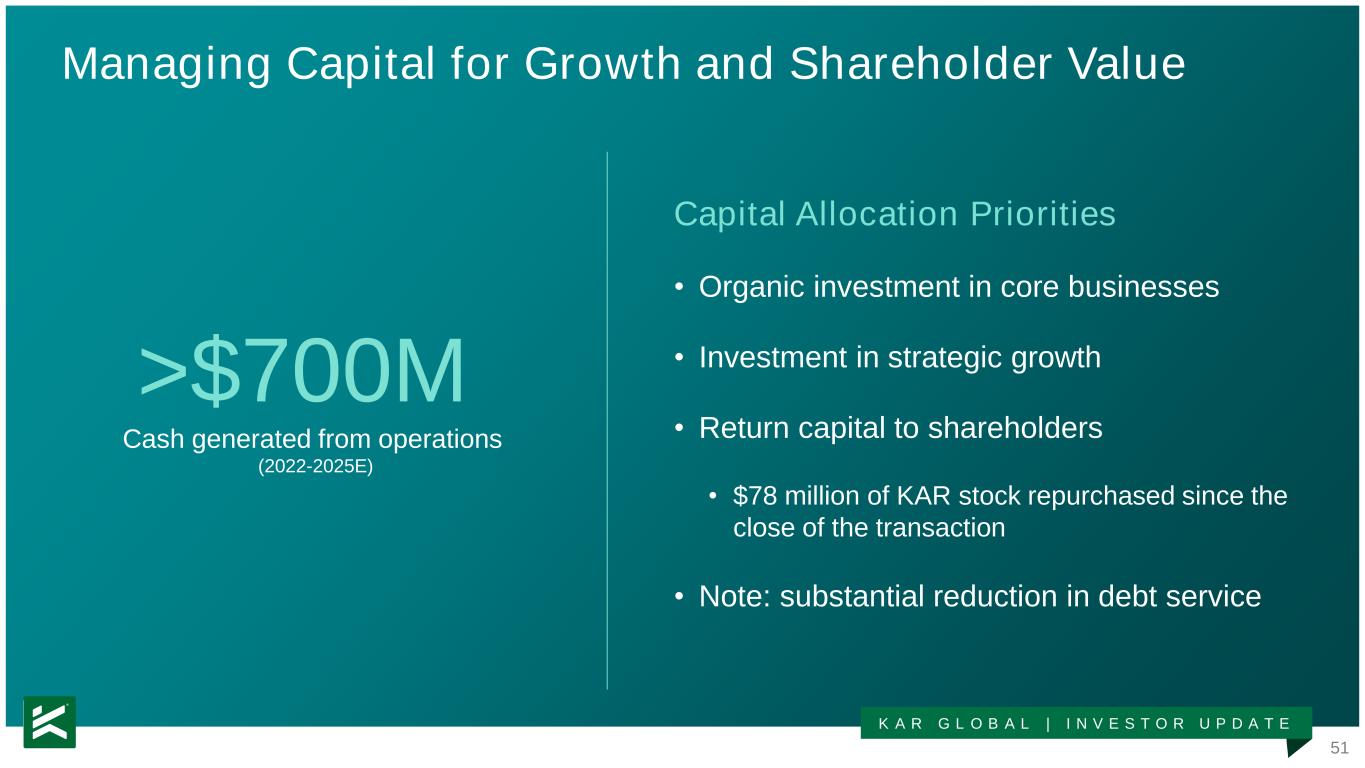
51 K A R G L O B A L | I N V E S T O R U P D A T E Managing Capital for Growth and Shareholder Value >$700M Cash generated from operations (2022-2025E) Capital Allocation Priorities • Organic investment in core businesses • Investment in strategic growth • Return capital to shareholders • $78 million of KAR stock repurchased since the close of the transaction • Note: substantial reduction in debt service
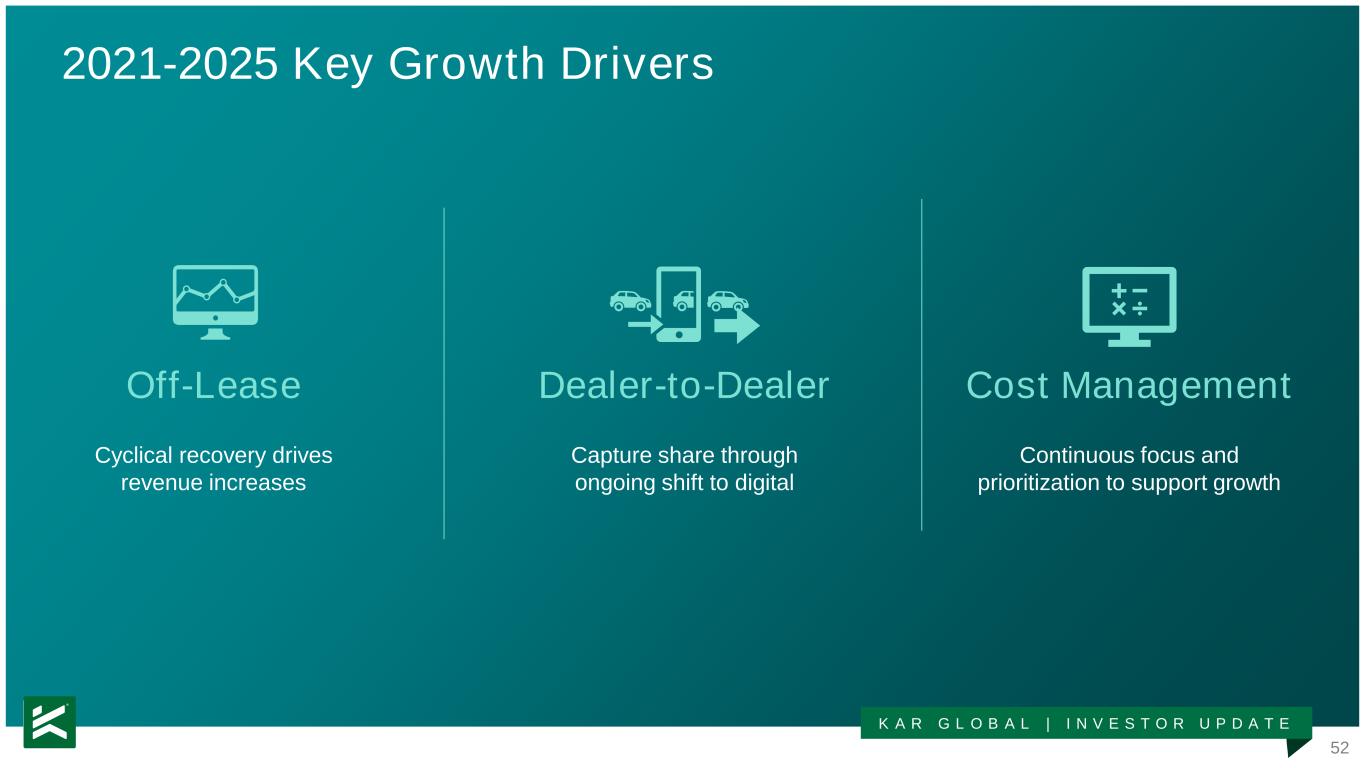
52 K A R G L O B A L | I N V E S T O R U P D A T E 2021-2025 Key Growth Drivers Off-Lease Cyclical recovery drives revenue increases Dealer-to-Dealer Capture share through ongoing shift to digital Cost Management Continuous focus and prioritization to support growth
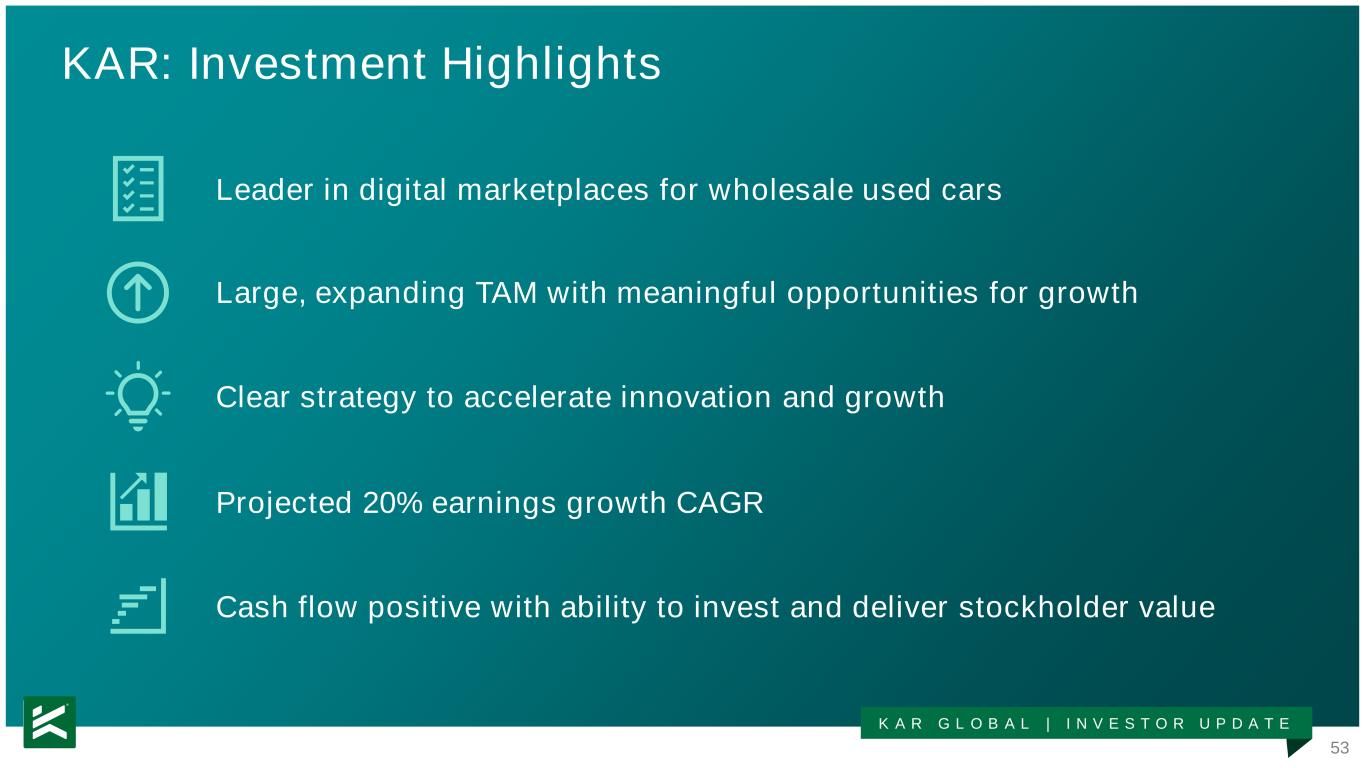
53 K A R G L O B A L | I N V E S T O R U P D A T E KAR: Investment Highlights Projected 20% earnings growth CAGR Large, expanding TAM with meaningful opportunities for growth Cash flow positive with ability to invest and deliver stockholder value Leader in digital marketplaces for wholesale used cars Clear strategy to accelerate innovation and growth

Q&A // June 14, 2022
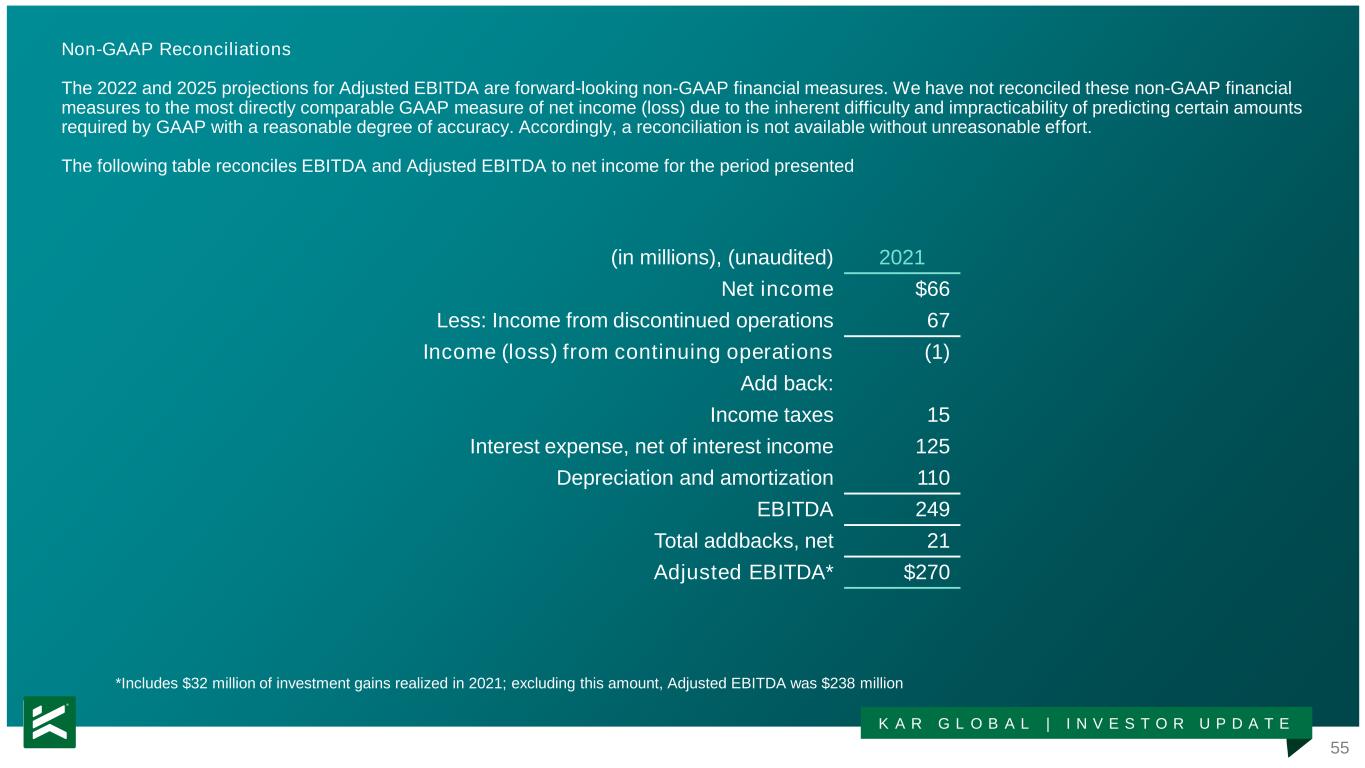
55 K A R G L O B A L | I N V E S T O R U P D A T E Non-GAAP Reconciliations The 2022 and 2025 projections for Adjusted EBITDA are forward-looking non-GAAP financial measures. We have not reconciled these non-GAAP financial measures to the most directly comparable GAAP measure of net income (loss) due to the inherent difficulty and impracticability of predicting certain amounts required by GAAP with a reasonable degree of accuracy. Accordingly, a reconciliation is not available without unreasonable effort. The following table reconciles EBITDA and Adjusted EBITDA to net income for the period presented *Includes $32 million of investment gains realized in 2021; excluding this amount, Adjusted EBITDA was $238 million (in millions), (unaudited) 2021 Net income $66 Less: Income from discontinued operations 67 Income (loss) from continuing operations (1) Add back: Income taxes 15 Interest expense, net of interest income 125 Depreciation and amortization 110 EBITDA 249 Total addbacks, net 21 Adjusted EBITDA* $270
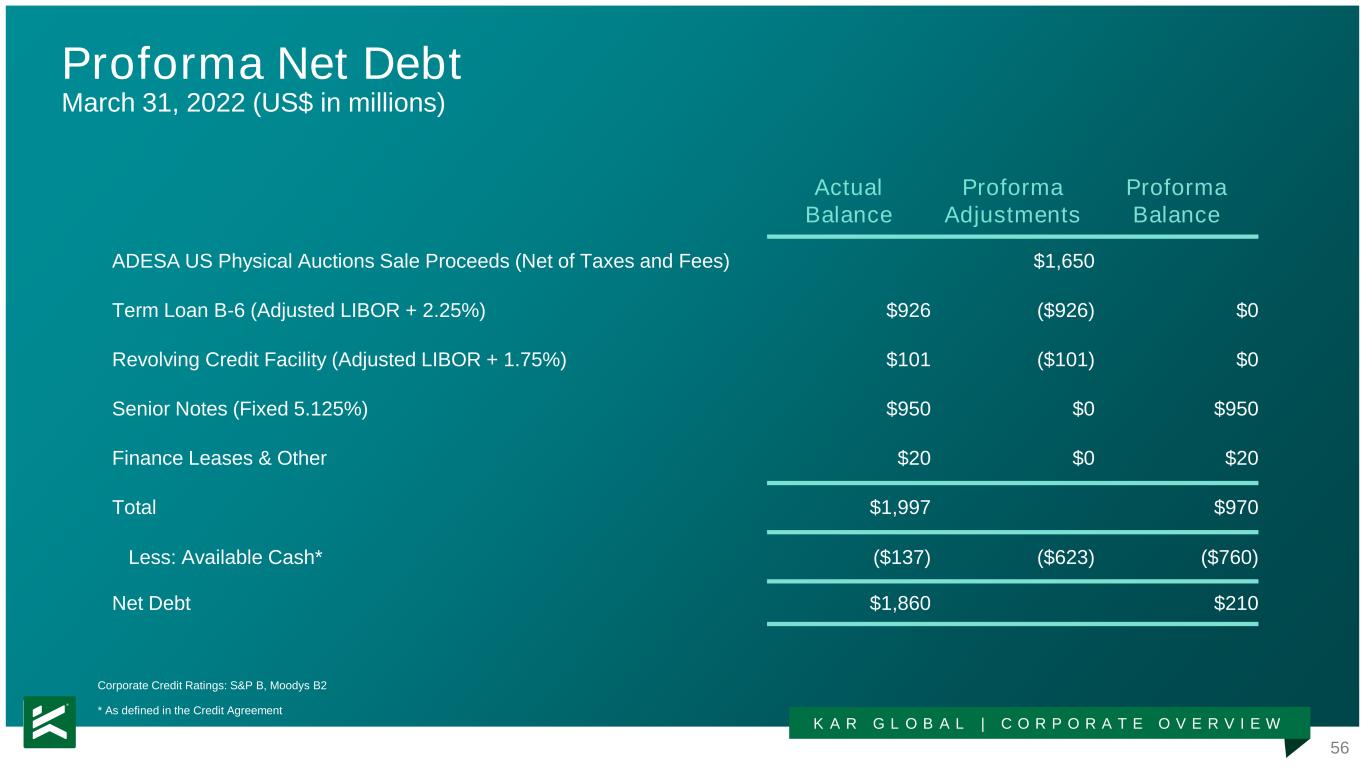
56 K A R G L O B A L | C O R P O R A T E O V E R V I E W Proforma Net Debt March 31, 2022 (US$ in millions) Corporate Credit Ratings: S&P B, Moodys B2 * As defined in the Credit Agreement Actual Balance Proforma Adjustments Proforma Balance ADESA US Physical Auctions Sale Proceeds (Net of Taxes and Fees) $1,650 Term Loan B-6 (Adjusted LIBOR + 2.25%) $926 ($926) $0 Revolving Credit Facility (Adjusted LIBOR + 1.75%) $101 ($101) $0 Senior Notes (Fixed 5.125%) $950 $0 $950 Finance Leases & Other $20 $0 $20 Total $1,997 $970 Less: Available Cash* ($137) ($623) ($760) Net Debt $1,860 $210


