Exhibit 99.1
INVESTOR DAY Management Presentation February 25, 2015
Safe harbor 2 This document contains forward - looking statements. Statements that are not historical fact, including statements about Vulcan's beliefs and expectations, are forward - looking statements. Generally, these statements relate to future financial performance, results of ope rations, business plans or strategies, projected or anticipated revenues, expenses, earnings (including EBITDA and other measures), dividend po lic y, shipment volumes, pricing, levels of capital expenditures, intended cost reductions and cost savings, anticipated profit improvements and /or planned divestitures and asset sales. These forward - looking statements are sometimes identified by the use of terms and phrases such as "believe," "should," "would," "expect," "project," "estimate," "anticipate," "intend," "plan," "will," "can," "may" or similar expressio ns elsewhere in this document. These statements are subject to numerous risks, uncertainties, and assumptions, including but not limited to gener al business conditions, competitive factors, pricing, energy costs, and other risks and uncertainties discussed in the reports Vulcan per iod ically files with the SEC. Forward - looking statements are not guarantees of future performance and actual results, developments, and business decisions may vary significantly from those expressed in or implied by the forward - looking statements. The following risks related to Vulcan's bus iness, among others, could cause actual results to differ materially from those described in the forward - looking statements: those associated with ge neral economic and business conditions; the timing and amount of federal, state and local funding for infrastructure; changes in Vulcan’s effect ive tax rate that can adversely impact results; the increasing reliance on information technology infrastructure for Vulcan’s ticketing, procuremen t, financial statements and other processes could adversely affect operations in the event such infrastructure does not work as intended or experienc es technical difficulties or is subjected to cyber attacks; the impact of the state of the global economy on Vulcan’s businesses and finan cia l condition and access to capital markets; changes in the level of spending for private residential and private nonresidential construction; the hig hly competitive nature of the construction materials industry; the impact of future regulatory or legislative actions; the outcome of pending legal pro cee dings; pricing of Vulcan's products; weather and other natural phenomena; energy costs; costs of hydrocarbon - based raw materials; healthcare costs ; the amount of long - term debt and interest expense incurred by Vulcan; changes in interest rates; the impact of Vulcan's below investment grade debt rating on Vulcan's cost of capital; volatility in pension plan asset values and liabilities which may require cash contributions to the pe nsion plans; the impact of environmental clean - up costs and other liabilities relating to previously divested businesses; Vulcan's ability to secure and permit aggregates reserves in strategically located areas; changes in our management team and our new divisional structure; Vulcan's ability to ma nage and successfully integrate acquisitions; the potential of goodwill or long - lived asset impairment; the potential impact of future le gislation or regulations relating to climate change or greenhouse gas emissions or the definition of minerals; and other assumptions, risks and uncert ain ties detailed from time to time in the reports filed by Vulcan with the SEC. All forward - looking statements in this communication are qualified in their entirety by this cautionary statement. Vulcan disclaims and does not undertake any obligation to update or revise any forward - looking statement in this document except as required by law.

Introduction
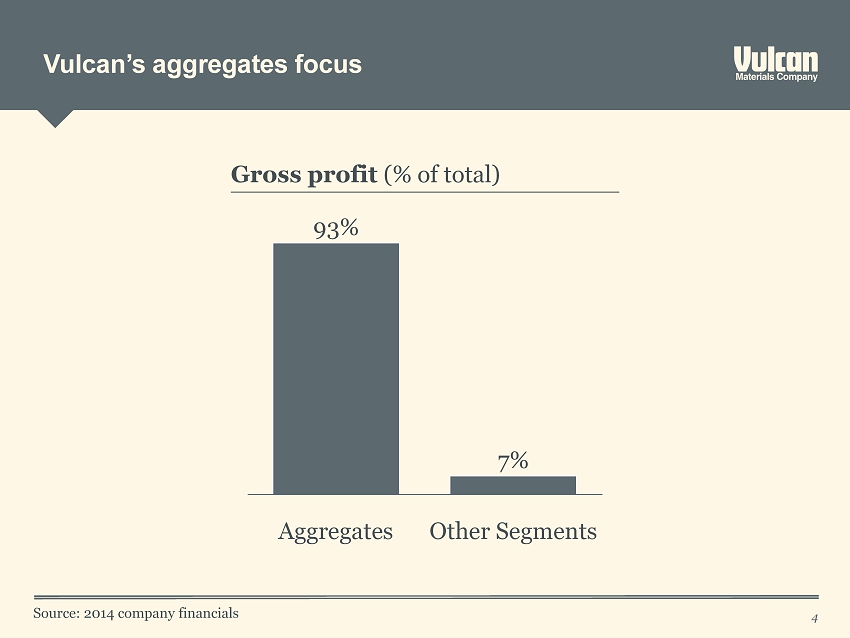
Other Segments Aggregates 93% 7% Gross profit (% of total) Vulcan’s aggregates focus 4 Source: 2014 company financials
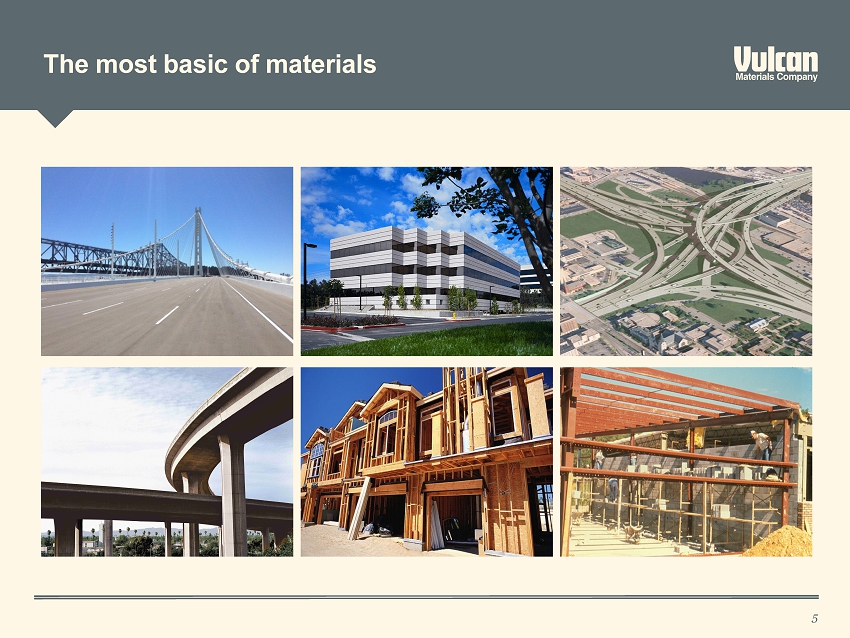
The most basic of materials 5
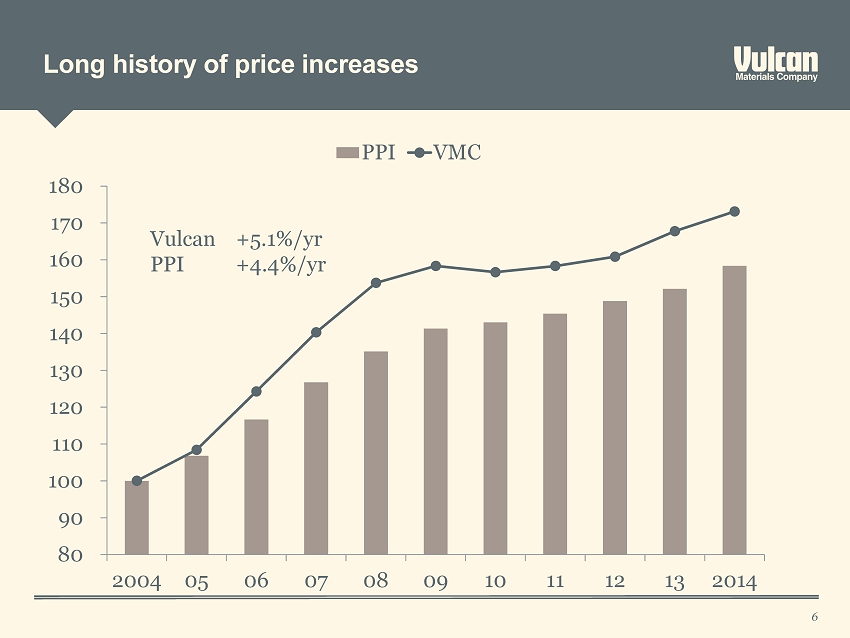
6 80 90 100 110 120 130 140 150 160 170 180 2004 05 06 07 08 09 10 11 12 13 2014 PPI VMC Vulcan +5.1%/yr PPI +4.4%/yr Long history of price increases
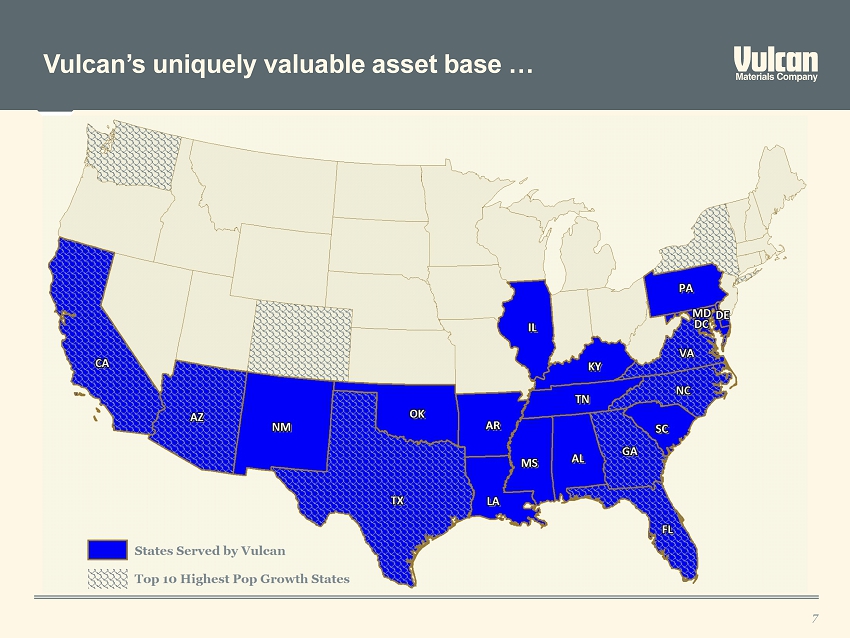
CAPABILITIES 7 Vulcan’s uniquely valuable asset base …
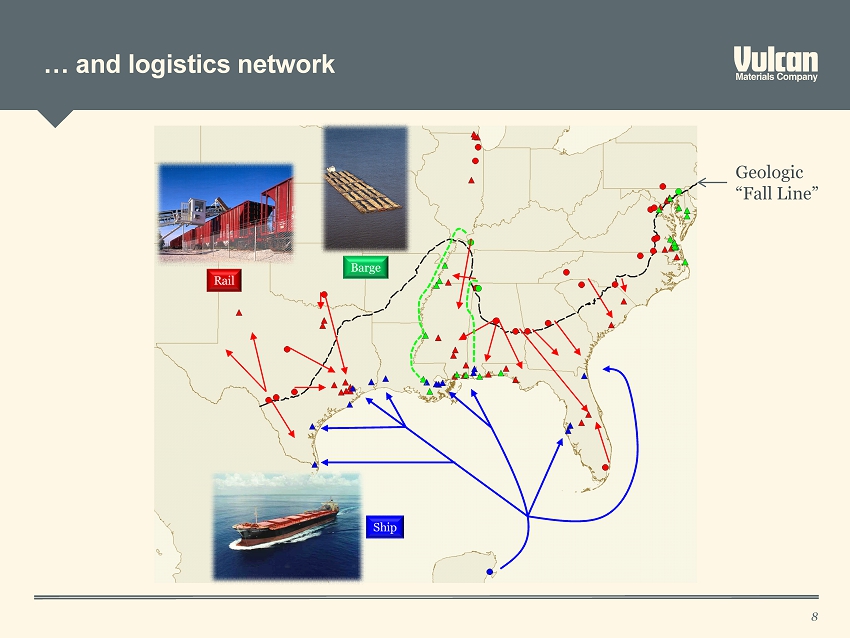
… and logistics network 8 Barge Rail Ship Geologic “Fall Line”
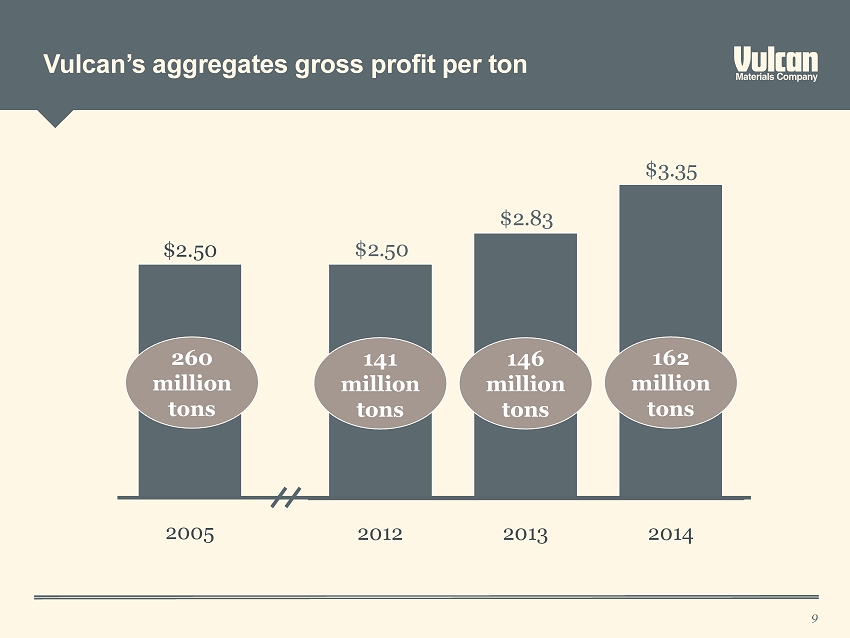
Vulcan’s aggregates gross profit per ton 9 $3.35 $2.83 $2.50 2014 2013 2012 162 million tons 146 million tons 141 million tons 2005 $2.50 260 million tons
Focus for remainder of this presentation 10 2 1 4 3 6 5 Unchanging values The past as a challenge to the future Earnings power at normal demand Execution focus Capital allocation and structure Conclusion and Q&A
Contents 11 Unchanging values

Unchanging values 12 Safety, health and environmental leadership Positive impact on the communities in which we operate Respect for our people Fair dealing with customers, suppliers and competitors
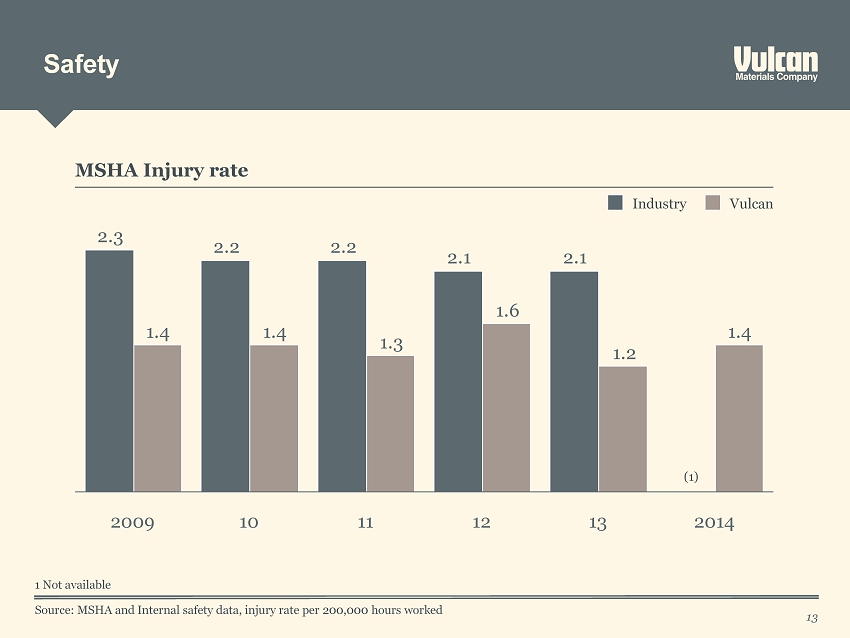
Safety 13 MSHA Injury rate 2.12.1 2.22.2 2.3 1.4 1.2 1.6 1.3 1.41.4 2014 (1) 13 12 11 10 2009 Vulcan Industry 1 Not available Source: MSHA and Internal safety data, injury rate per 200,000 hours worked
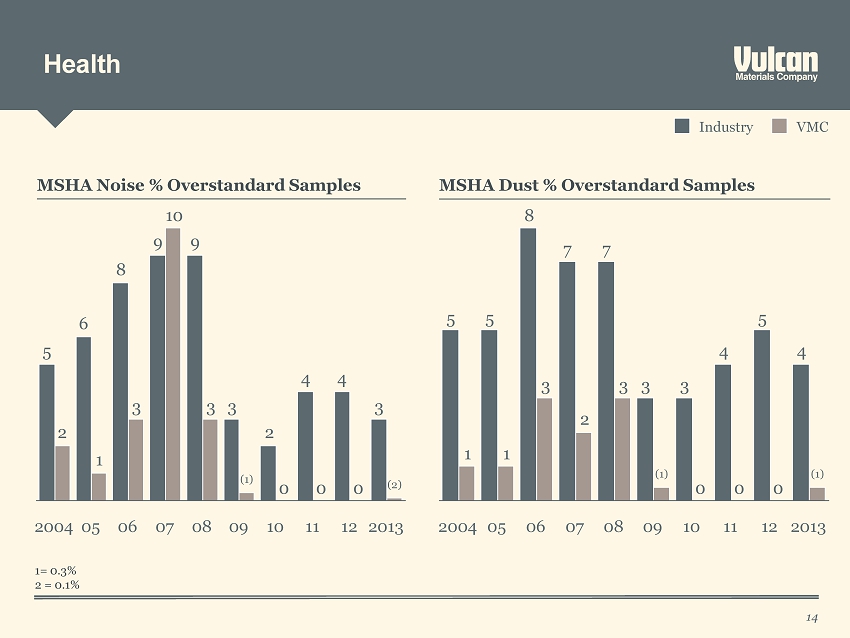
Health 14 3 44 2 3 99 8 6 5 000 3 10 3 1 2 10 09 (1) 08 07 06 05 2004 2013 (2) 12 11 VMC Industry MSHA Noise % Overstandard Samples 4 5 4 33 77 8 55 000 3 2 3 11 2013 (1) 12 11 10 09 (1) 08 07 06 05 2004 MSHA Dust % Overstandard Samples 1= 0.3 % 2 = 0.1%
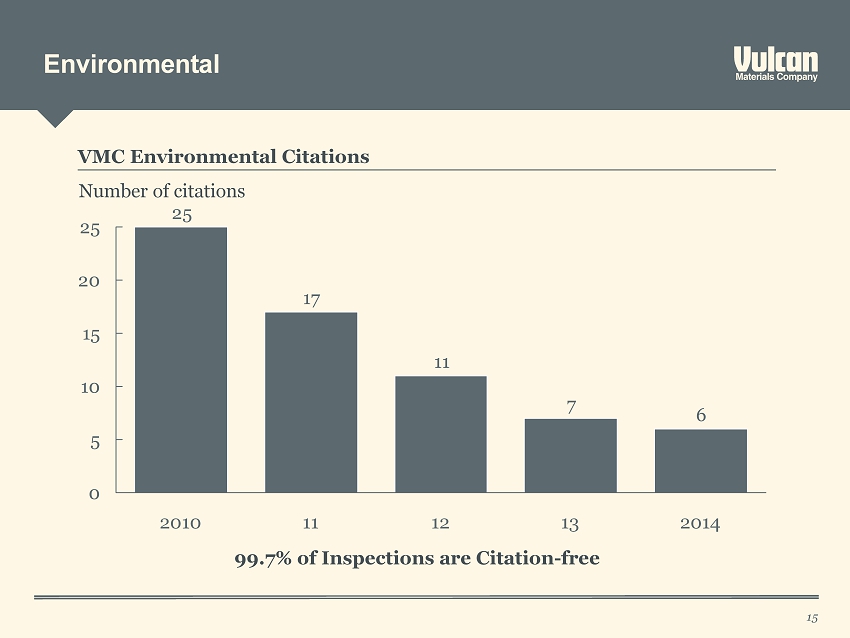
Environmental 15 VMC Environmental Citations 6 7 11 17 25 0 5 10 15 20 25 2014 12 13 2010 11 Number of citations 99.7% of Inspections are Citation - free

Unchanging values 16

Contents 17 The past as a challenge to the future

Looking back to look forward 18
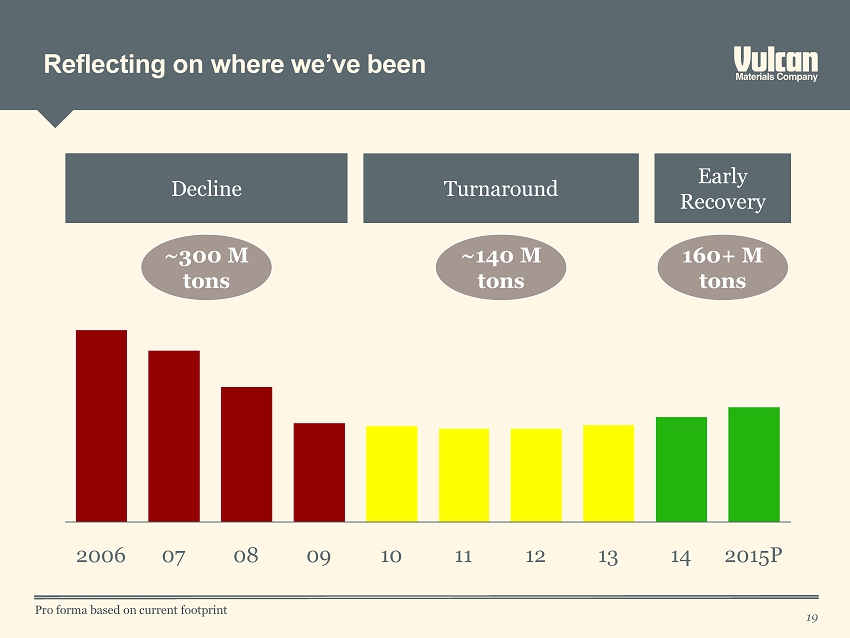
Reflecting on where we’ve been 19 2015P 12 08 09 14 13 2006 10 11 07 ~300 M tons ~140 M tons 160+ M tons Decline Turnaround Early Recovery Pro forma based on current footprint
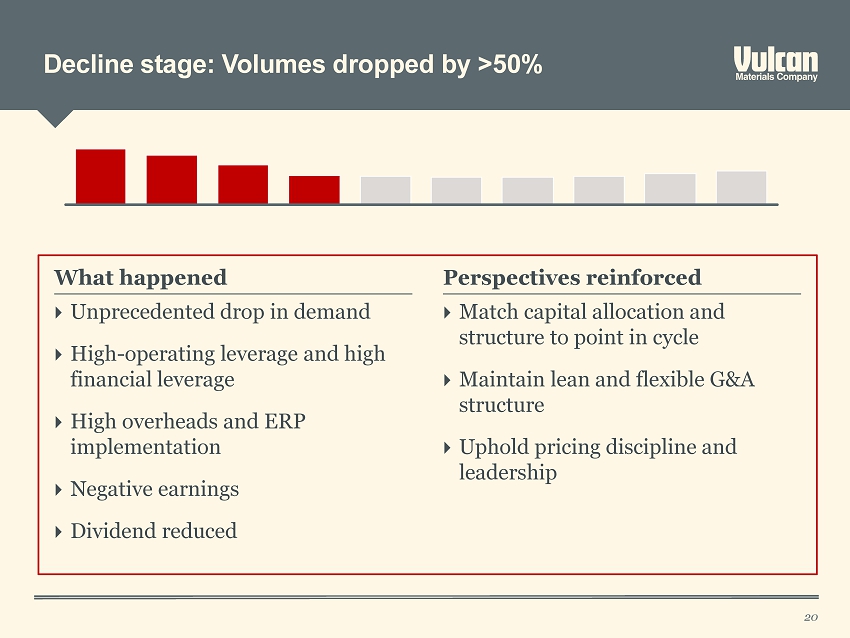
Decline stage: Volumes dropped by >50% 20 What happened Perspectives reinforced Unprecedented drop in demand High - operating leverage and high financial leverage High overheads and ERP implementation Negative earnings Dividend reduced Match capital allocation and structure to point in cycle Maintain lean and flexible G&A structure Uphold pricing discipline and leadership

Turnaround stage: Volumes stabilized at historic lows 21 EBITDA improved >$100 million $1 billion in non - core assets divested, including cement Debt reduced $800 million Demand recovery finally began in 2nd half of '13 Focus on what we can control Set bold targets; organize to meet them Challenge our own portfolio What happened Perspectives reinforced See Appendix for reconciliation Non - GAAP measures
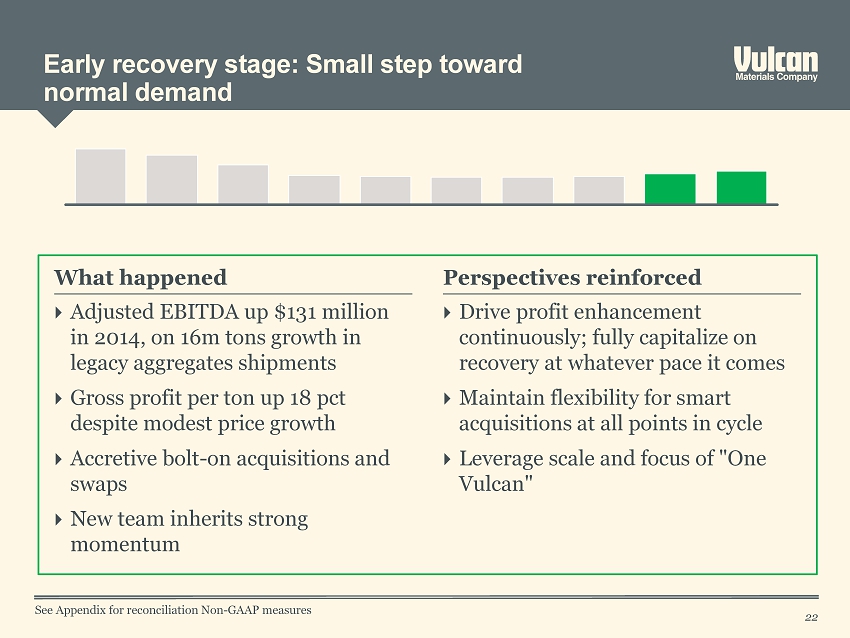
Early recovery stage: Small step toward normal demand 22 Adjusted EBITDA up $131 million in 2014, on 16m tons growth in legacy aggregates shipments Gross profit per ton up 18 pct despite modest price growth Accretive bolt - on acquisitions and swaps New team inherits strong momentum Drive profit enhancement continuously; fully capitalize on recovery at whatever pace it comes Maintain flexibility for smart acquisitions at all points in cycle Leverage scale and focus of "One Vulcan" What happened Perspectives reinforced See Appendix for reconciliation Non - GAAP measures
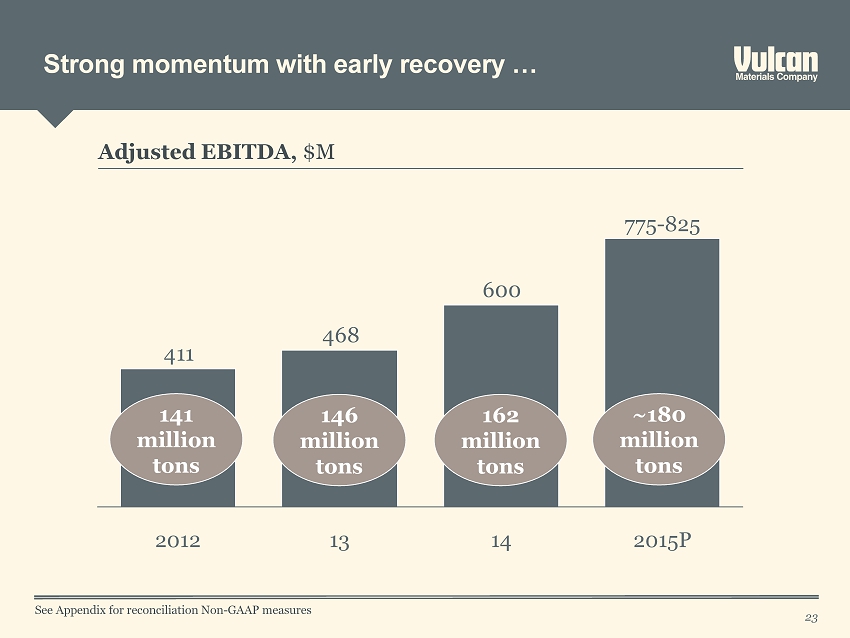
Strong momentum with early recovery … 23 Adjusted EBITDA, $M 600 468 411 14 13 2012 2015 P 775 - 825 141 million tons ~180 million tons 162 million tons 146 million tons See Appendix for reconciliation Non - GAAP measures
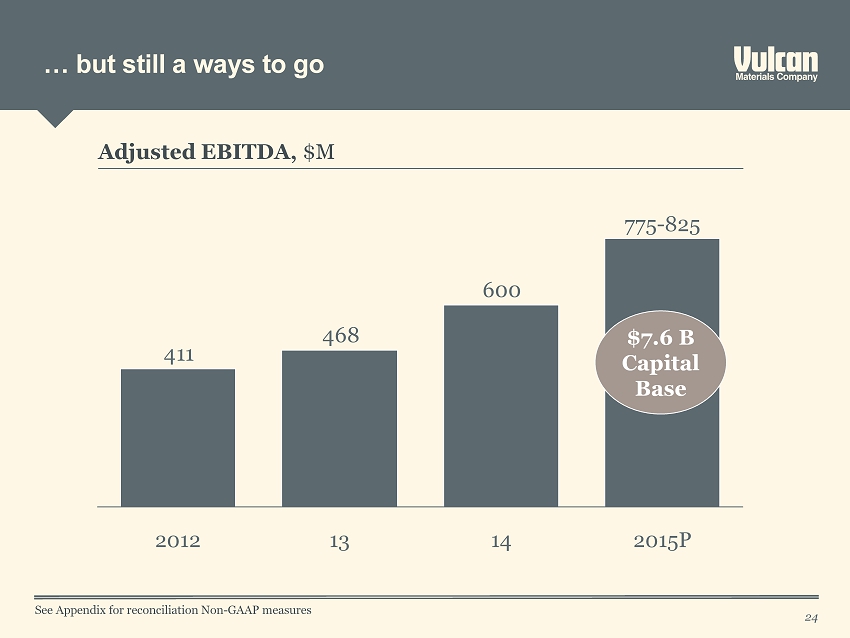
… but still a ways to go 24 Adjusted EBITDA, $M 600 468 411 13 2012 14 2015 P 775 - 825 $7.6 B Capital Base See Appendix for reconciliation Non - GAAP measures
Contents 25 Earnings power at normal demand
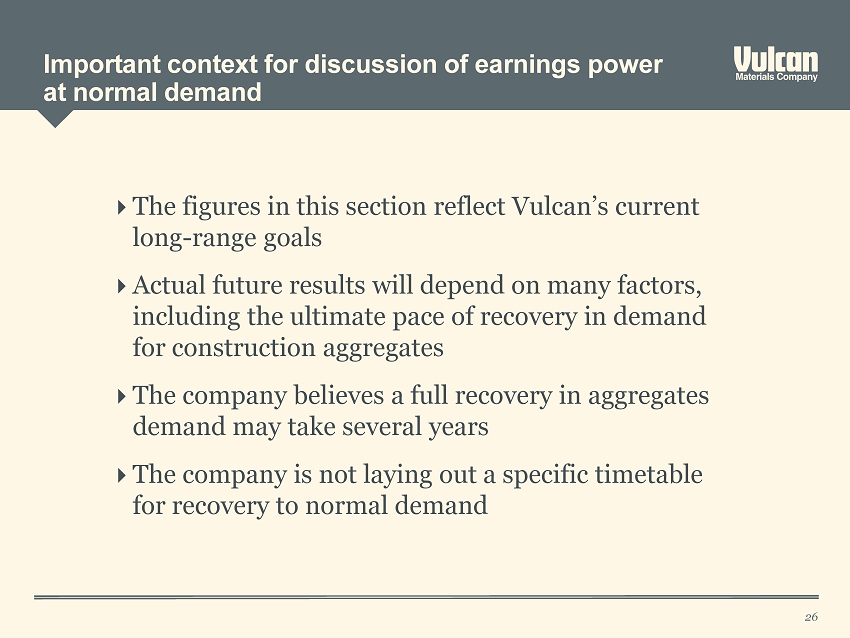
Important context for discussion of earnings power at normal demand 26 The figures in this section reflect Vulcan’s current long - range goals Actual future results will depend on many factors, including the ultimate pace of recovery in demand for construction aggregates The company believes a full recovery in aggregates demand may take several years The company is not laying out a specific timetable for recovery to normal demand
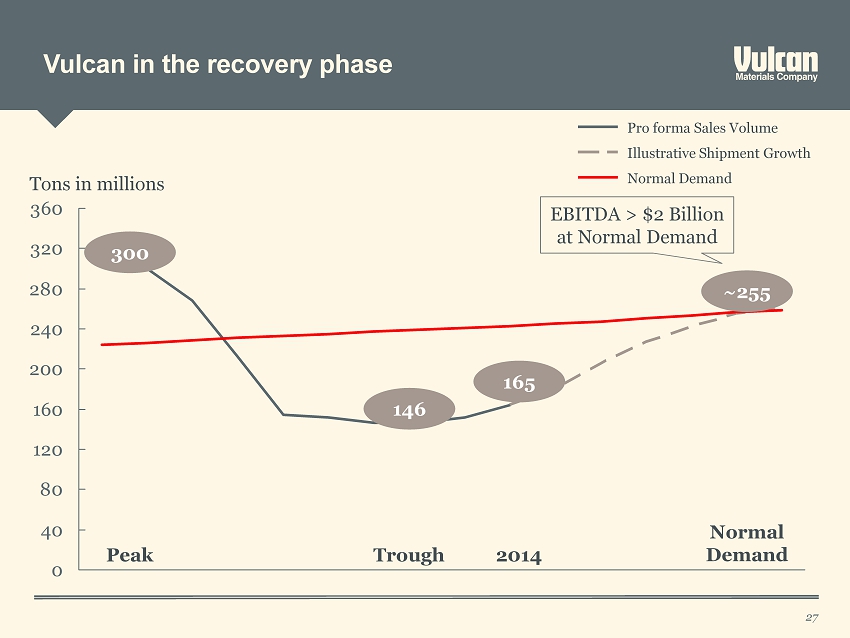
Vulcan in the recovery phase 27 146 255 165 0 40 80 120 160 200 240 280 320 360 300 Normal Demand Pro forma Sales Volume Illustrative Shipment Growth Peak Trough Normal Demand Tons in millions 2014 300 146 165 ~255 EBITDA > $2 Billion at Normal Demand
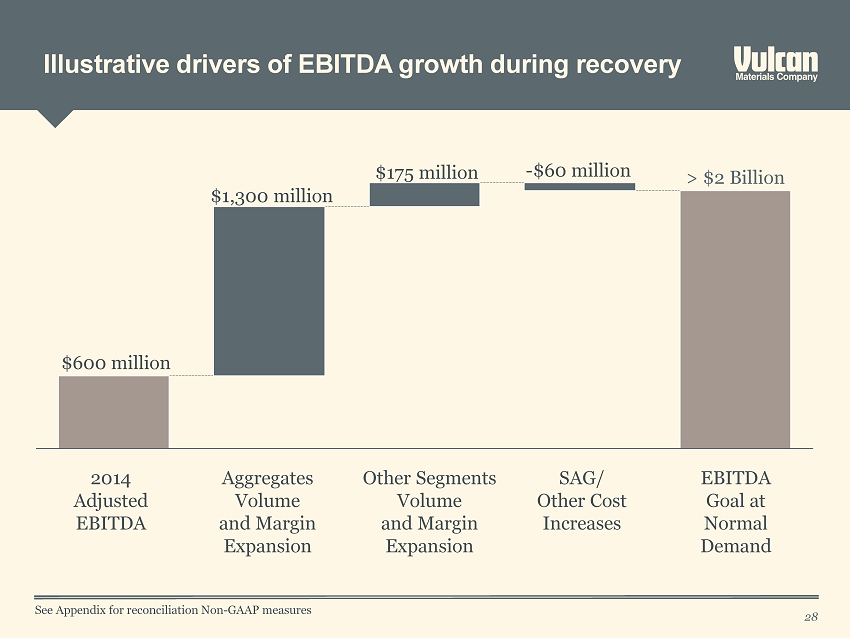
Illustrative drivers of EBITDA growth during recovery 28 SAG/ Other Cost Increases EBITDA Goal at Normal Demand > $2 Billion Other Segments Volume and Margin Expansion Aggregates Volume and Margin Expansion 2014 Adjusted EBITDA $600 million $1,300 million $175 million - $60 million See Appendix for reconciliation Non - GAAP measures
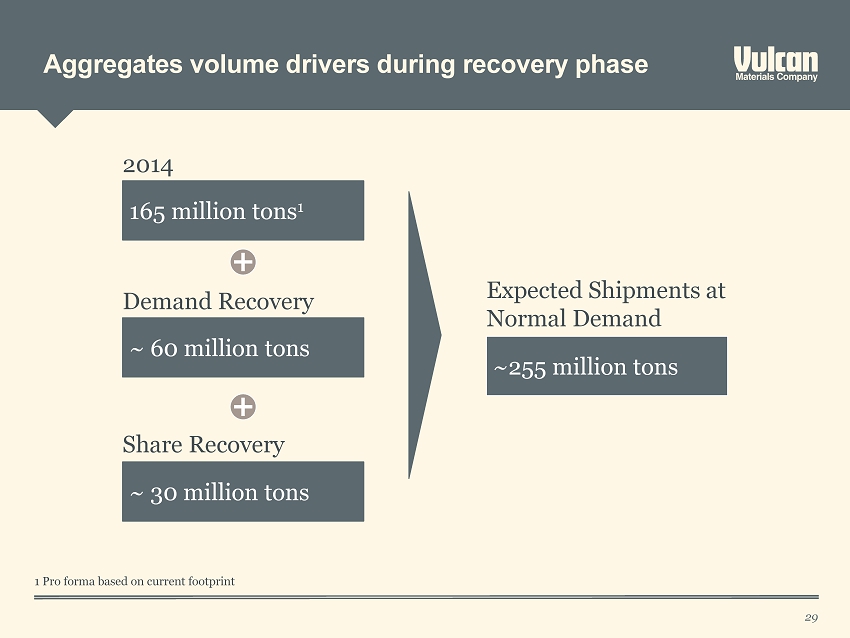
Aggregates volume drivers during recovery phase 29 1 Pro forma based on current footprint ~255 million tons Expected Shipments at Normal Demand ~ 30 million tons 165 million tons 1 ~ 60 million tons 2014 Demand Recovery Share Recovery
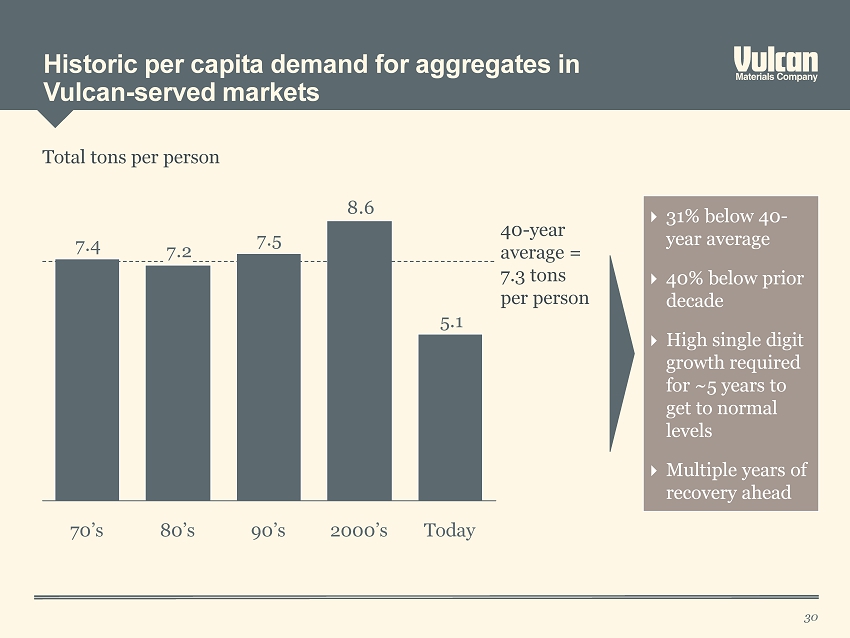
Historic per capita demand for aggregates in Vulcan - served markets 30 5.1 8.6 7.5 7.2 7.4 90’s 80’s 70’s Today 2000’s 40 - year average = 7.3 tons per person 31% below 40 - year average 40% below prior decade High single digit growth required for ~5 years to get to normal levels Multiple years of recovery ahead Total tons per person
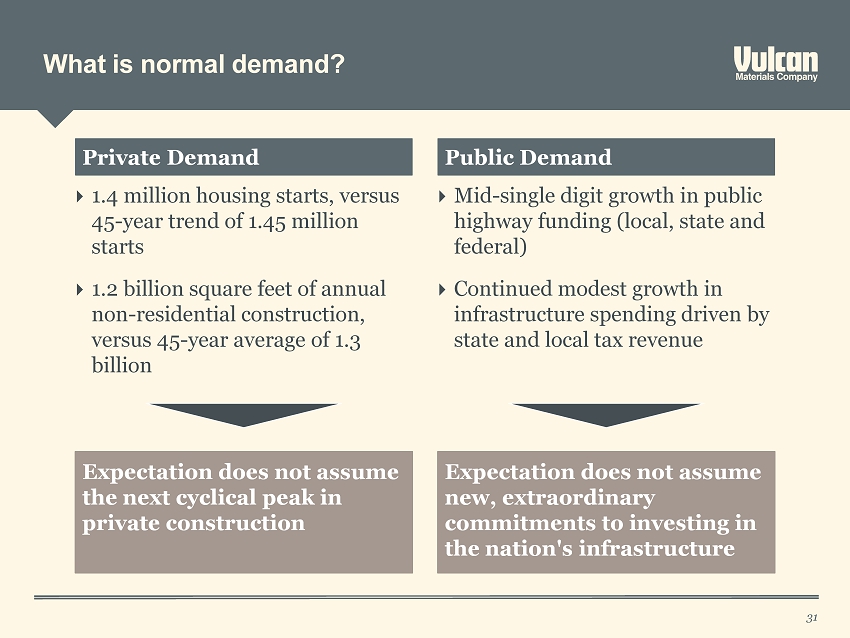
What is normal demand? 31 Private Demand Public Demand Expectation does not assume the next cyclical peak in private construction Expectation does not assume new , extraordinary commitments to investing in the nation's infrastructure 1.4 million housing starts, versus 45 - year trend of 1.45 million starts 1.2 billion square feet of annual non - residential construction, versus 45 - year average of 1.3 billion Mid - single digit growth in public highway funding (local, state and federal ) Continued modest growth in infrastructure spending driven by state and local tax revenue
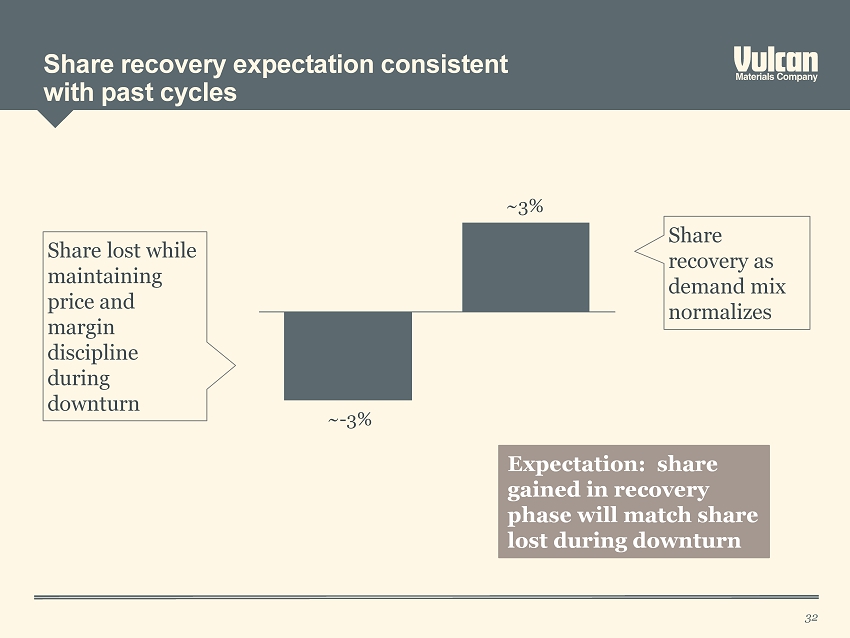
S hare recovery expectation consistent with past cycles 32 Share lost while maintaining price and margin discipline during downturn Share recovery as demand mix normalizes Expectation: share gained in recovery phase will match share lost during downturn ~ - 3% ~3%
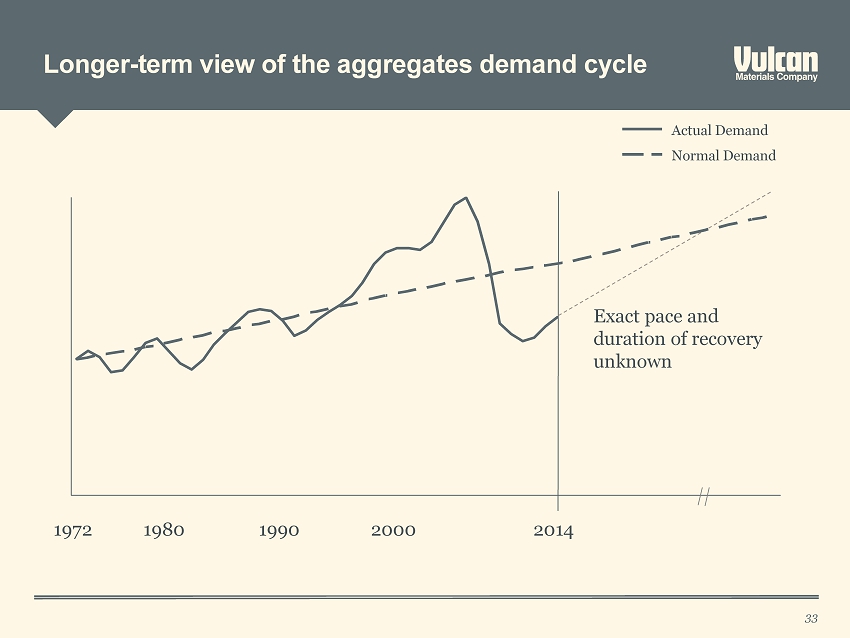
Longer - term view of the aggregates demand cycle 33 Normal Demand Actual Demand 2014 2000 1990 1980 1972 Exact pace and duration of recovery unknown
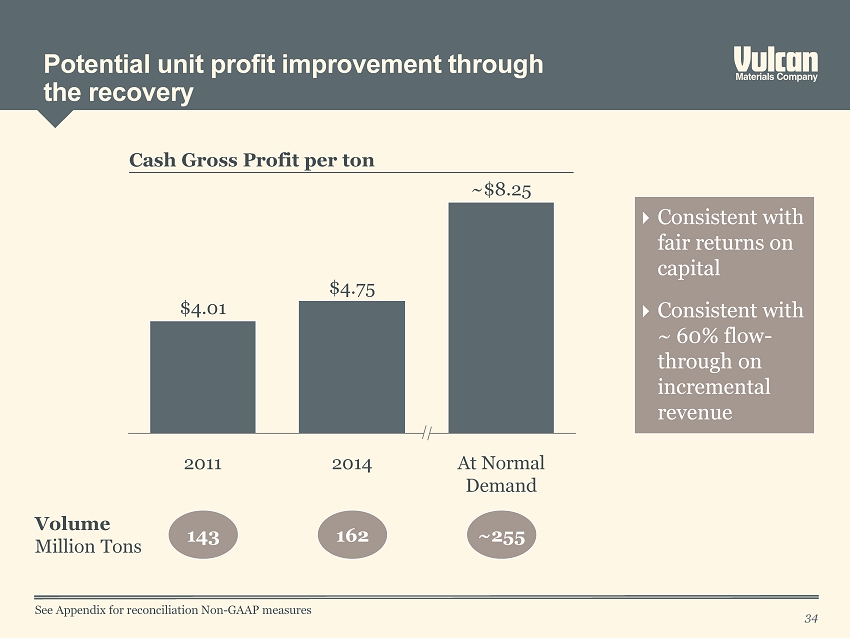
Potential unit profit improvement through the recovery 34 At Normal Demand 2014 ~$ 8.25 $ 4.75 $ 4.01 2011 Cash Gross Profit per ton Volume Million Tons 143 162 ~255 Consistent with fair returns on capital Consistent with ~ 60% flow - through on incremental revenue See Appendix for reconciliation Non - GAAP measures
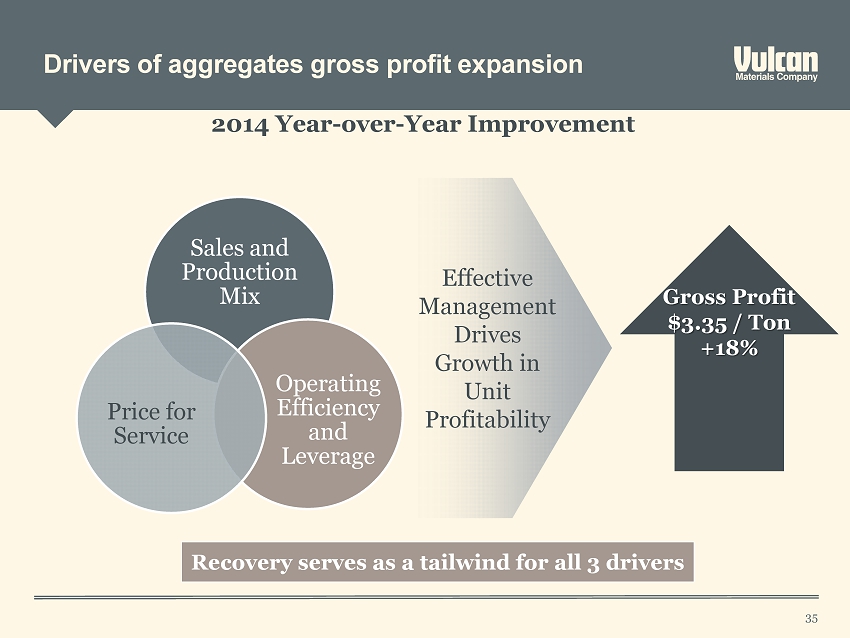
2014 Year - over - Year Improvement Effective Management Drives Growth in Unit Profitability Gross Profit $3.35 / Ton +18% Drivers of aggregates gross profit expansion Sales and Production Mix Operating Efficiency and Leverage Price for Service Recovery serves as a tailwind for all 3 drivers 35
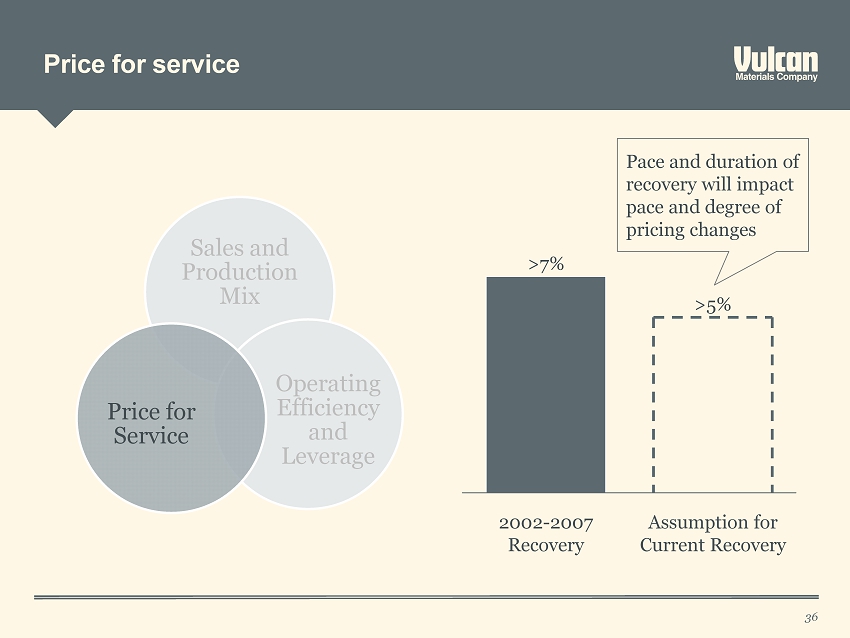
Price for service 36 Assumption for Current Recovery 2002 - 2007 Recovery >5% > 7 % Pace and duration of recovery will impact pace and degree of pricing changes Sales and Production Mix Operating Efficiency and Leverage Price for Service
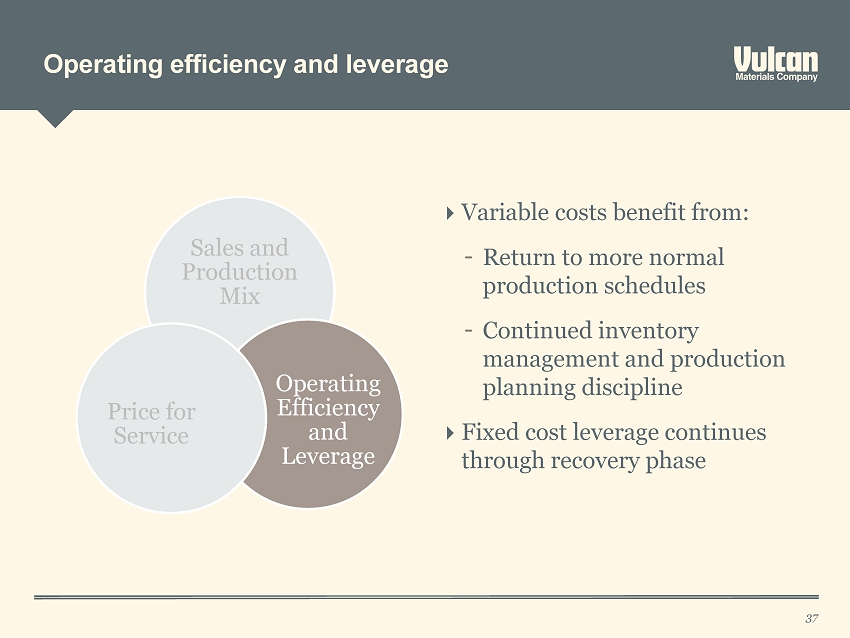
Operating efficiency and leverage 37 Sales and Production Mix Operating Efficiency and Leverage Price for Service Variable costs benefit from : – Return to more normal production schedules – Continued inventory management and production planning discipline Fixed cost leverage continues through recovery phase
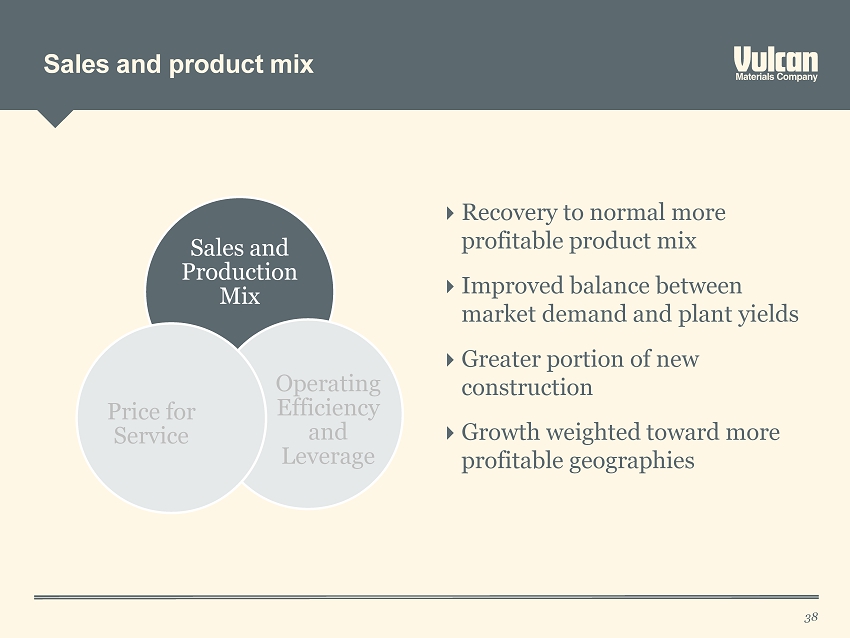
Sales and product mix 38 Sales and Production Mix Operating Efficiency and Leverage Price for Service Recovery to normal more profitable product mix Improved balance between market demand and plant yields Greater portion of new construction Growth weighted toward more profitable geographies
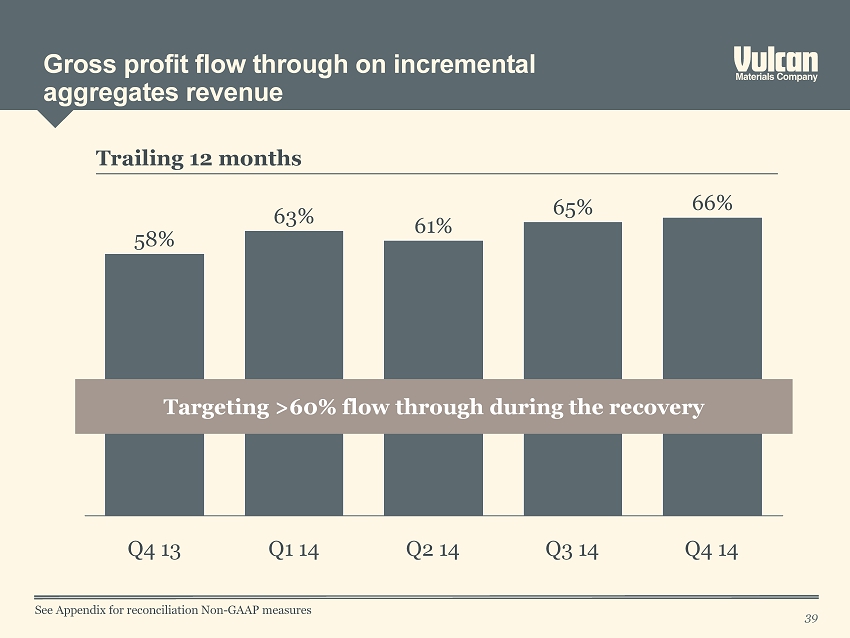
Gross profit flow through on incremental aggregates revenue 39 58% 61% 63% Q4 13 Q1 14 Q2 14 Q4 14 66% Q3 14 65% Trailing 12 months Targeting >60% flow through during the recovery See Appendix for reconciliation Non - GAAP measures
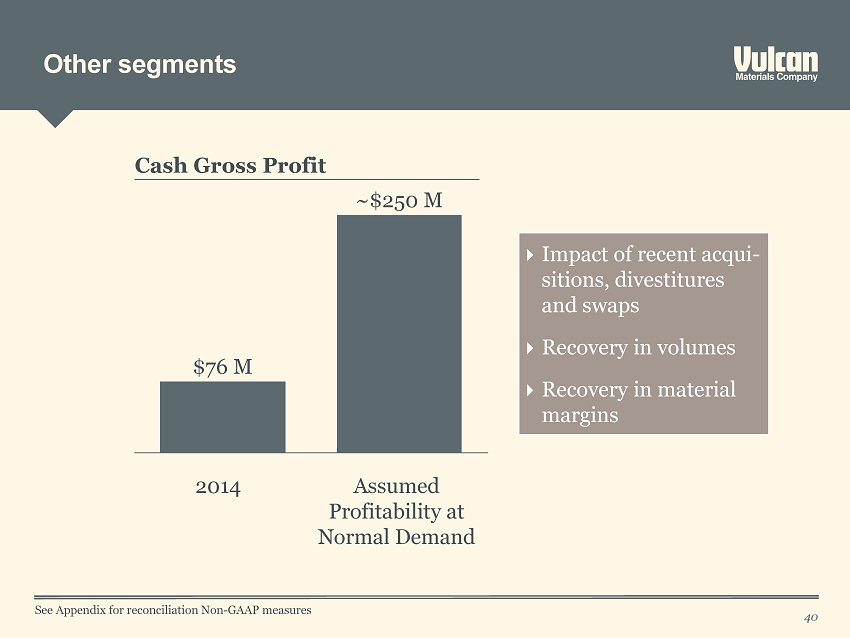
Other segments 40 Assumed Profitability at Normal D emand ~ $250 M 2014 $76 M Cash G ross Profit See Appendix for reconciliation Non - GAAP measures Impact of recent acqui - sitions , divestitures and swaps Recovery in volumes Recovery in material margins
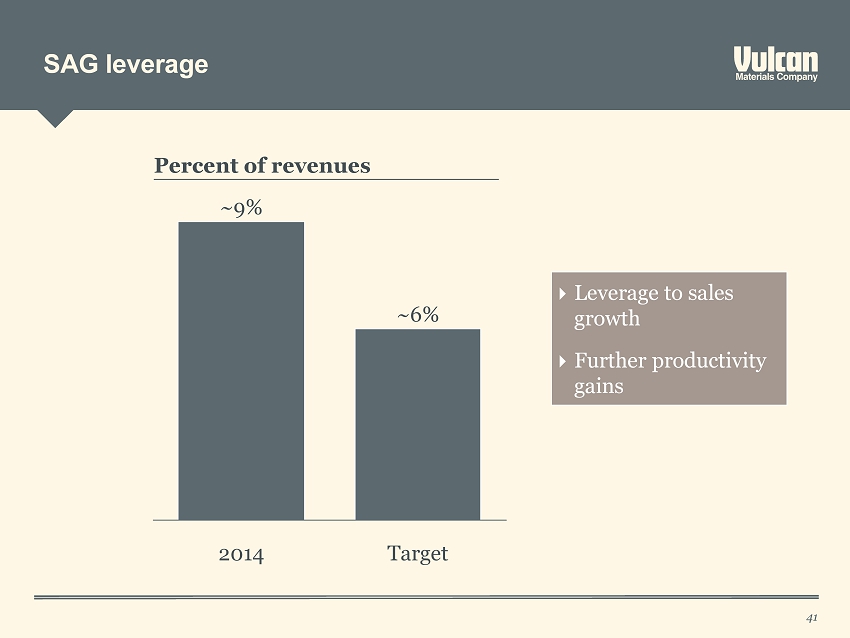
SAG leverage 41 ~6% 2014 Target ~9% Percent of revenues Leverage to sales growth Further productivity gains

Recap: Drivers of EBITDA growth during recovery 42 SAG/ Other Cost Increases EBITDA Goal at Normal Demand > $2 Billion Other Segments Volume and Margin Expansion Aggregates Volume and Margin Expansion 2014 Adjusted EBITDA $600 million $1,300 million $175 million - $60 million See Appendix for reconciliation Non - GAAP measures
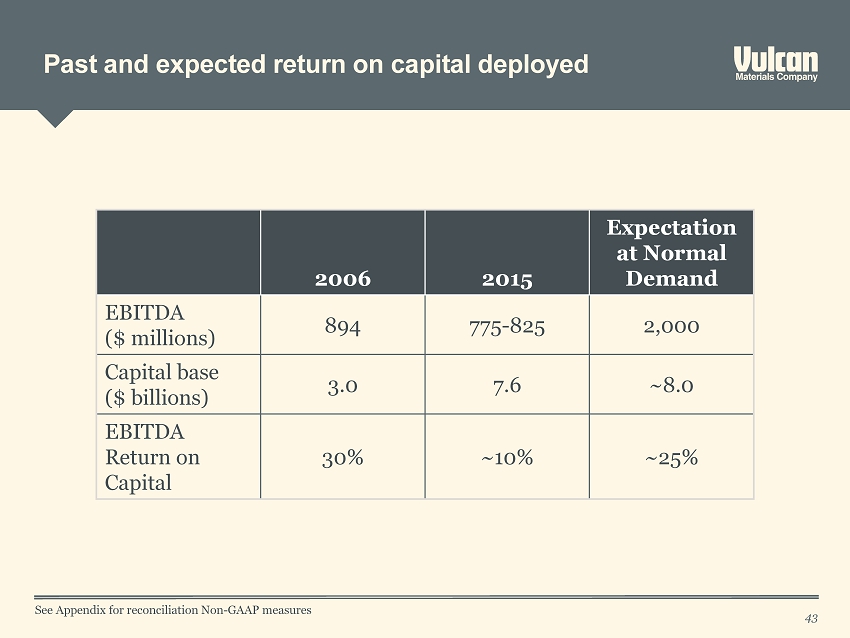
Past and expected return on capital deployed 2006 2015 Expectation at Normal Demand EBITDA ($ millions) 894 775 - 825 2,000 Capital base ($ billions) 3.0 7.6 ~8.0 EBITDA Return on Capital 30% ~10% ~25% See Appendix for reconciliation Non - GAAP measures 43
Contents 44 Execution focus
45 “What is the quality of your earnings … what are you doing to improve?”
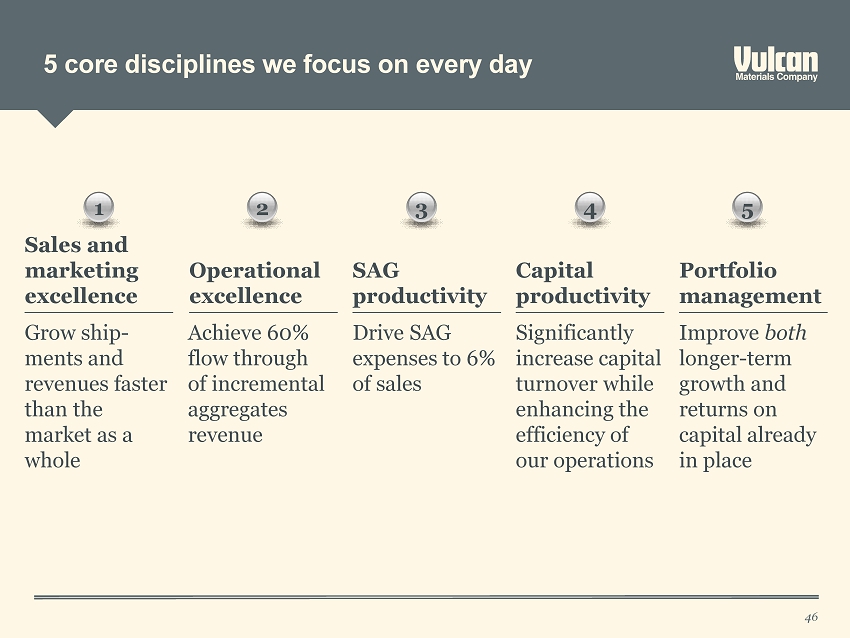
5 core disciplines we focus on every day 46 Grow ship - ments and revenues faster than the market as a whole Sales and marketing excellence Achieve 60% flow through of incremental aggregates revenue Operational excellence Drive SAG expenses to 6% of sales SAG productivity Significantly increase capital turnover while enhancing the efficiency of our operations Capital productivity Improve both longer - term growth and returns on capital already in place Portfolio management 1 2 3 4 5
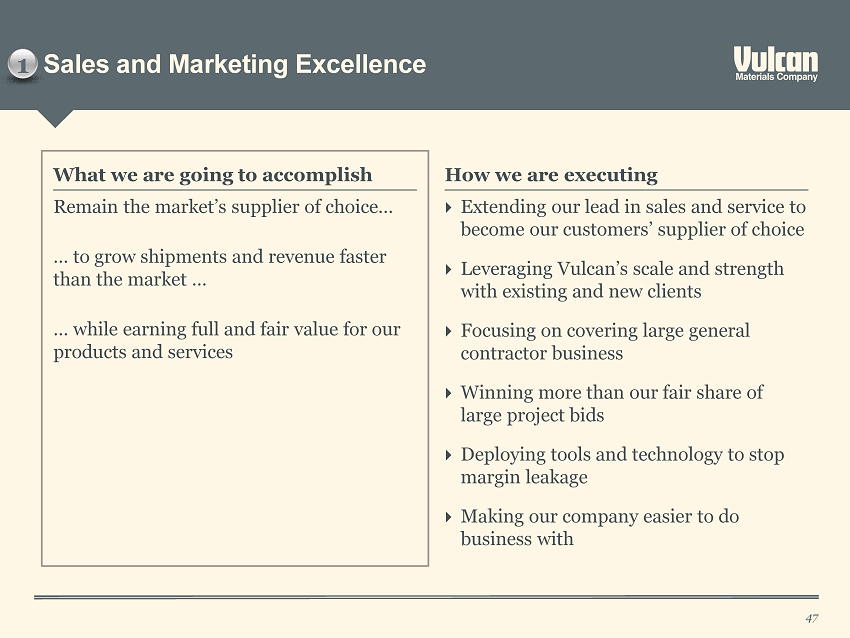
Sales and Marketing Excellence 47 Remain the market’s supplier of choice… … to grow shipments and revenue faster than the market … … while earning full and fair value for our products and services What we are going to accomplish How we are executing Extending our lead in sales and service to become our customers’ supplier of choice Leveraging Vulcan’s scale and strength with existing and new clients Focusing on covering large general contractor business Winning more than our fair share of large project bids Deploying tools and technology to stop margin leakage Making our company easier to do business with 1
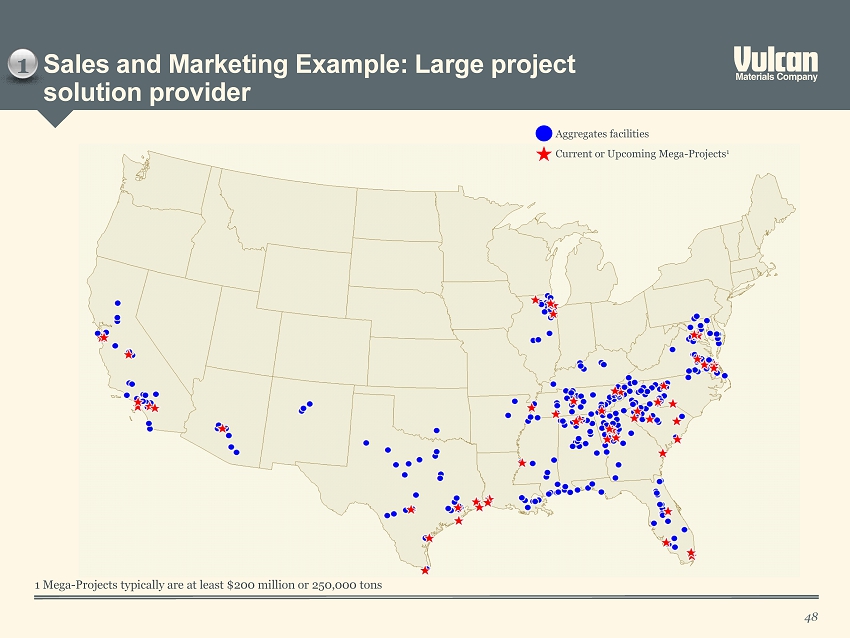
Sales and Marketing Example: Large project solution provider 48 1 Aggregates facilities Current or Upcoming Mega - Projects 1 1 Mega - Projects typically are at least $200 million or 250,000 tons
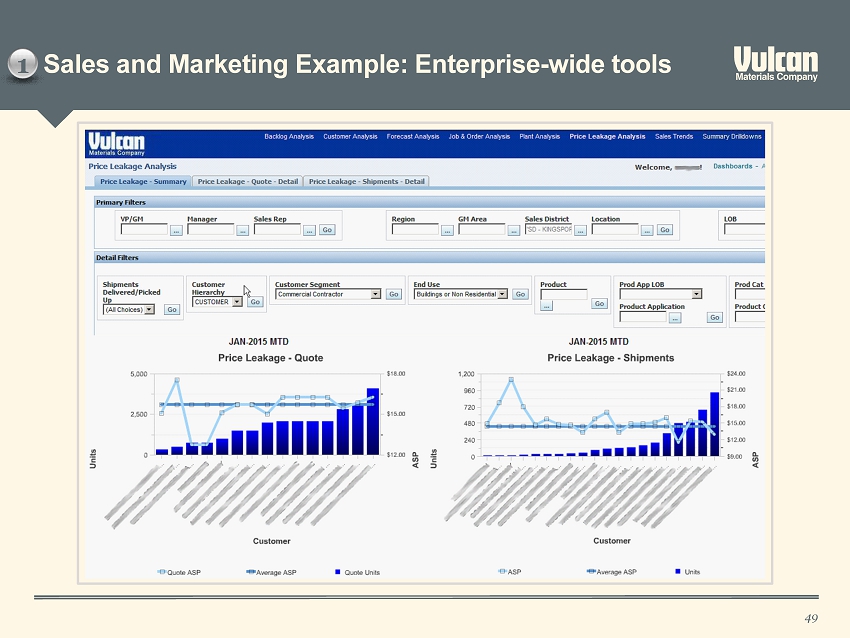
Sales and Marketing Example: Enterprise - wide tools 49 1
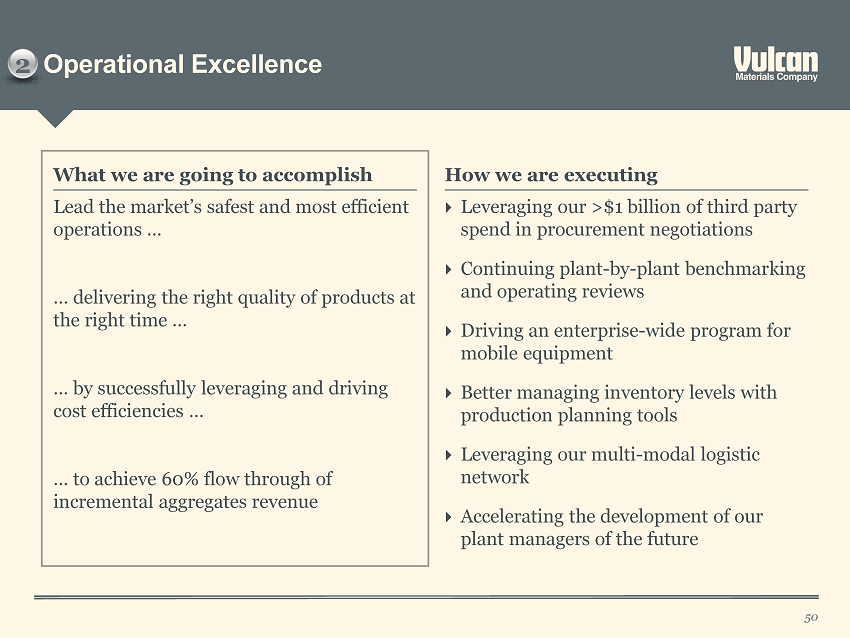
Operational Excellence 50 2 Lead the market’s safest and most efficient operations … … delivering the right quality of products at the right time … … by successfully leveraging and driving cost efficiencies … … to achieve 60% flow through of incremental aggregates revenue What we are going to accomplish How we are executing Leveraging our >$1 billion of third party spend in procurement negotiations Continuing plant - by - plant benchmarking and operating reviews Driving an enterprise - wide program for mobile equipment Better managing inventory levels with production planning tools Leveraging our multi - modal logistic network Accelerating the development of our plant managers of the future
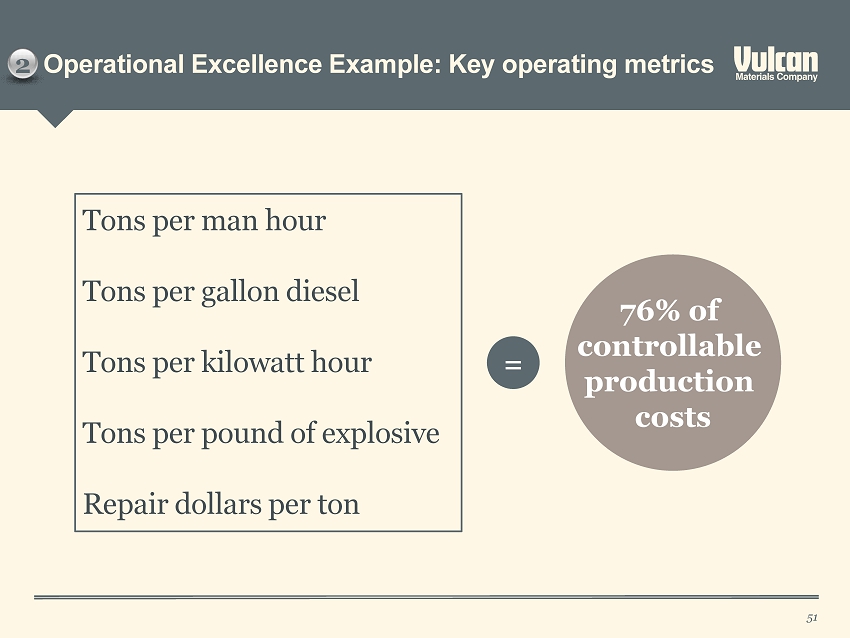
Operational Excellence Example: Key operating metrics 51 Tons per man hour Tons per gallon diesel Tons per kilowatt hour Tons per pound of explosive Repair dollars per ton = 76% of controllable production costs 2
SAG Productivity 52 3 Continue to leverage SAG to sales to reach 6% ... … while maintaining our close - to - market model and enabling continued growth … … as we capture all efficiencies while servicing our internal and external customers What we are going to accomplish How we are executing Leveraging central shared services for administrative support Maintaining tight hiring controls Continuing the commitment to reducing waste and running lean Capturing full benefits of common ERP platform Enabling rapid integration of acquired operations
Capital Productivity 53 4 Drive further improvement in capital turnover … … while maintaining the longer term health and productivity of our asset base … … and ensuring that the right projects are executed the right way What we are going to accomplish How we are executing Maximizing lifecycle value of land holdings Embedding capital accountability at all levels of the organization Optimizing working capital and inventory levels Fleet planning and optimization Management processes fostering appropriate competition for capital Maintaining the right balance of owned vs. controlled reserve positions
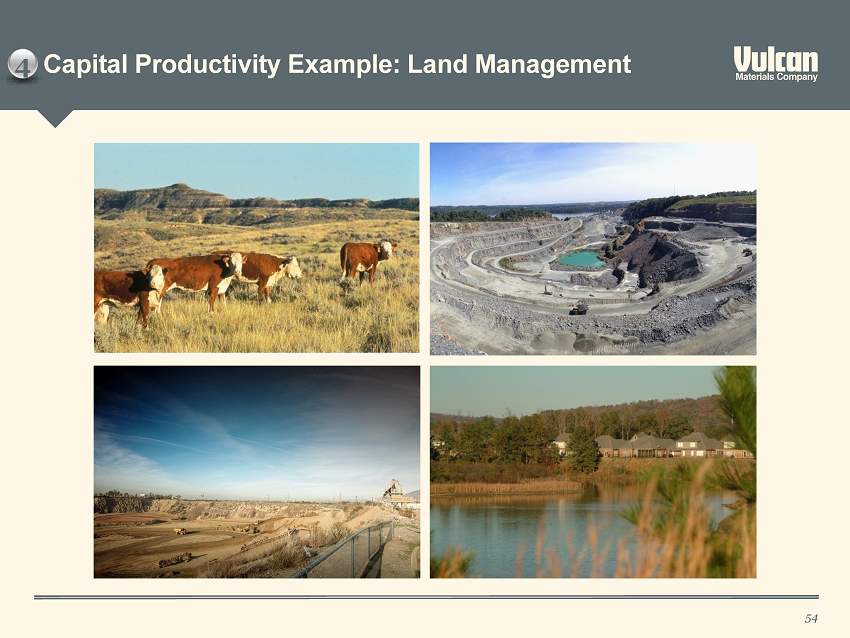
Capital Productivity Example: Land Management 54 4
Portfolio Management 55 5 Continue to pursue attractive bolt - on acquisitions ... … selectively enter new markets that meet our growth profile, eg . New Mexico … … divest non - core businesses or geographies where we are not the natural owner, eg . Florida cement/ready mix … … and negotiate swaps that benefit both parties, eg . California ready mix and Arizona asphalt What we are going to accomplish How we are executing Making bolt - on acquisitions that complement current operations in California, Arizona, Texas and Delaware Entering the New Mexico market by acquiring the #1 position in the market Divesting non - core ready mix and cement facilities in Florida Completed swap of ready mix plants for asphalt plants in California and Arizona
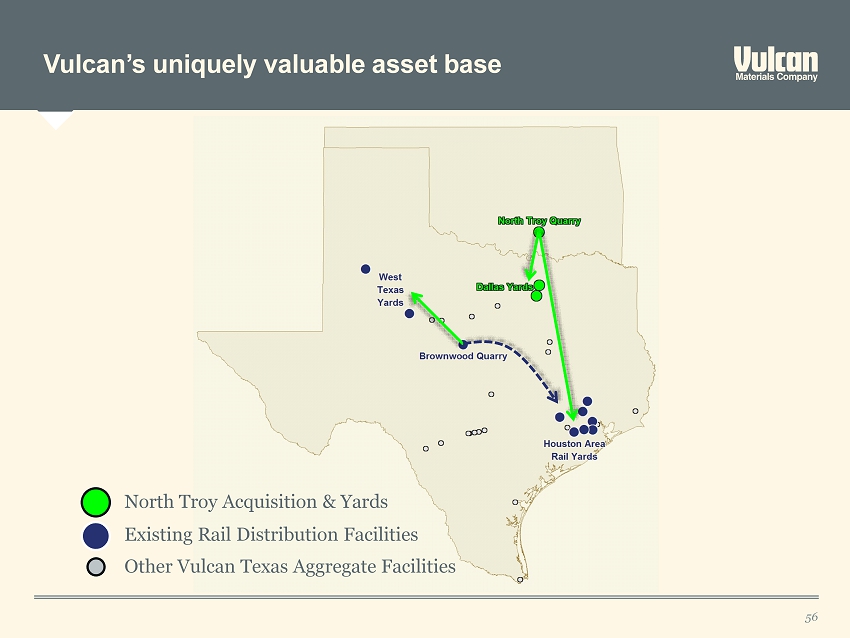
CAPABILITIES Vulcan’s uniquely valuable asset base 56 North Troy Acquisition & Yards Existing Rail Distribution Facilities Other Vulcan Texas Aggregate Facilities
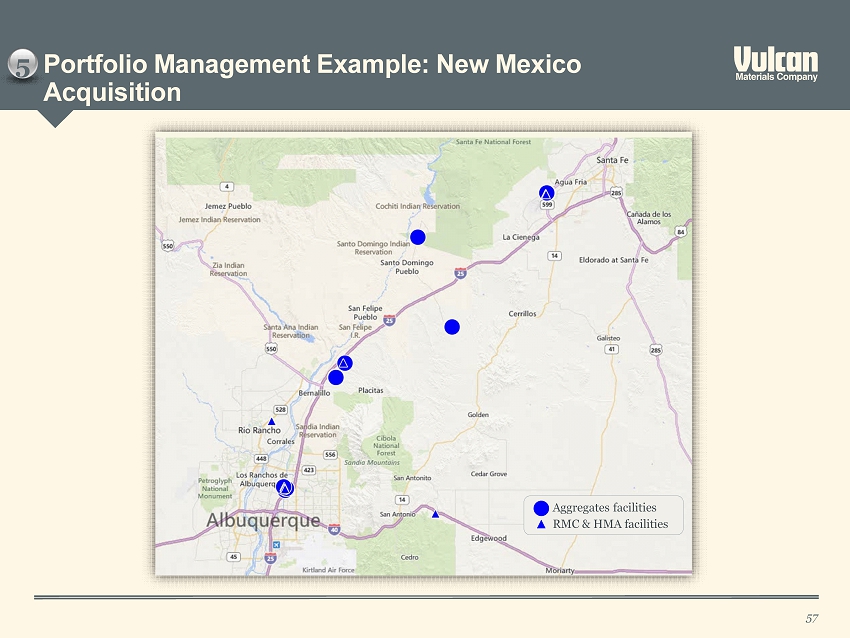
Portfolio Management Example: New Mexico Acquisition 57 5 Aggregates facilities RMC & HMA facilities
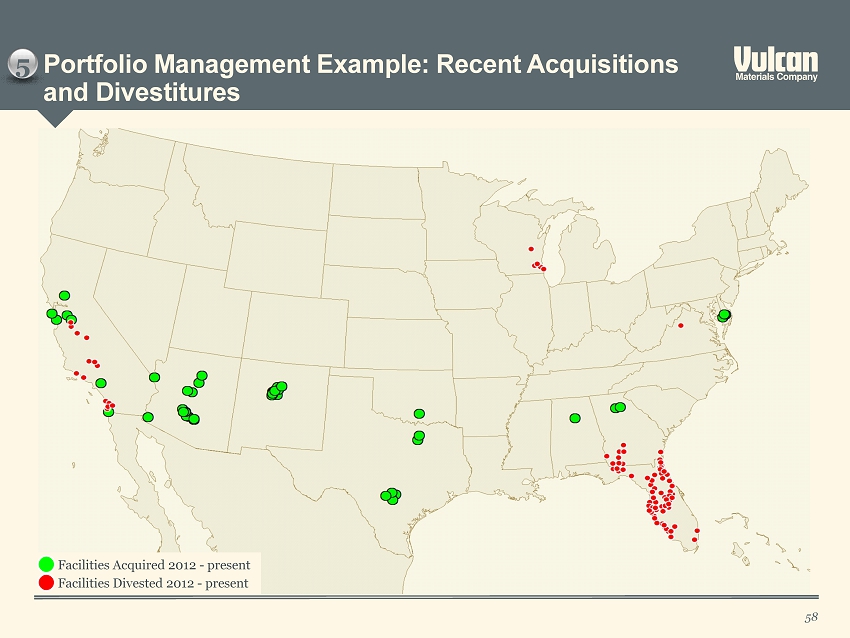
Portfolio Management Example: Recent Acquisitions and Divestitures 58 5 Facilities Acquired 2012 - present Facilities Divested 2012 - present

59 “We decided what we wanted to do and we concentrated on doing it better than anyone else.”
Contents 60 Capital allocation and structure
Four topics for discussion 61 Current & projected credit position Capital allocation during the recovery phase Near term and potential capital structure actions Capital allocation and structure through the cycle
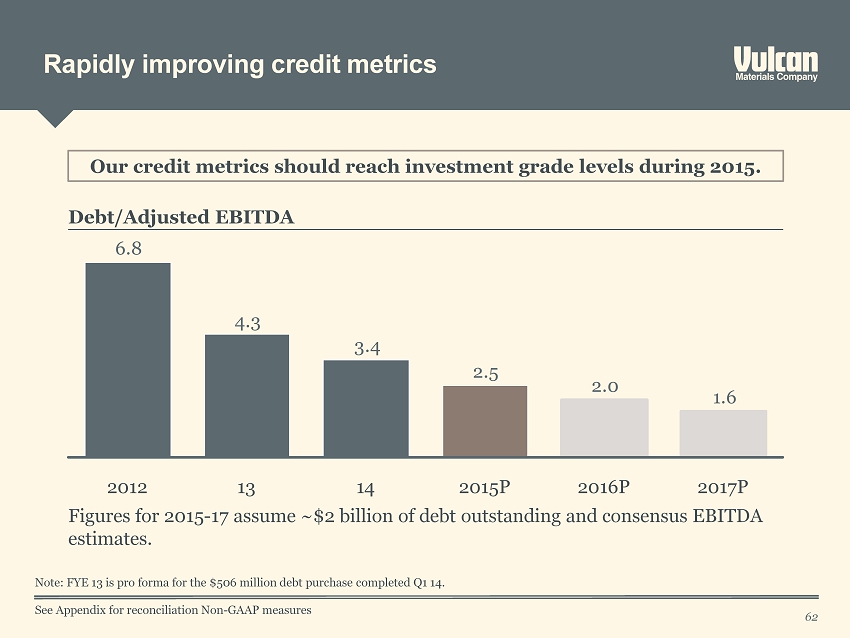
Rapidly improving credit metrics 62 Our credit metrics should reach investment grade levels during 2015. Figures for 2015 - 17 assume ~$2 billion of debt outstanding and consensus EBITDA estimates. 1.6 2.0 2.5 3.4 4.3 6.8 2015P 2016P 13 14 2017P 2012 Debt/Adjusted EBITDA See Appendix for reconciliation Non - GAAP measures Note: FYE 13 is pro forma for the $506 million debt purchase completed Q1 14.
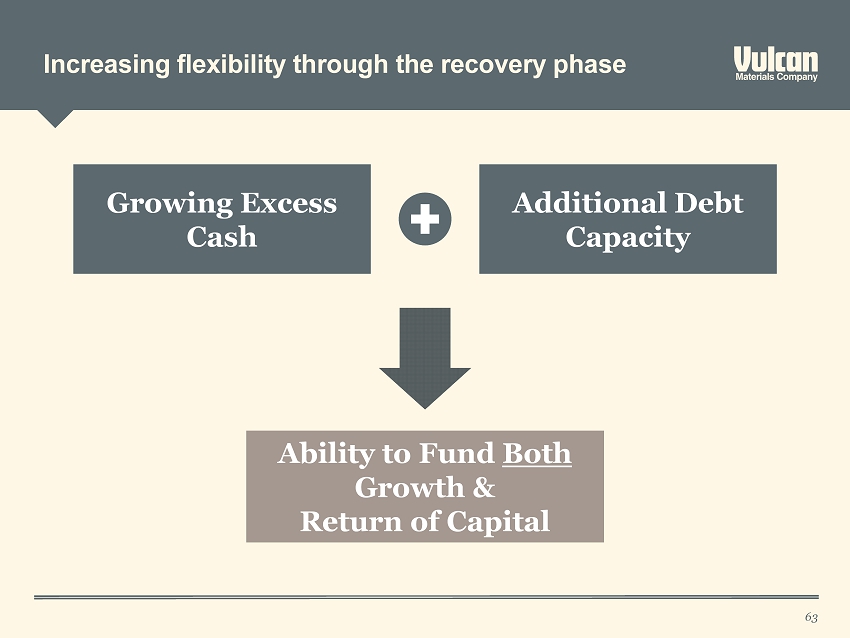
Increasing flexibility through the recovery phase 63 Growing Excess Cash Additional Debt Capacity Ability to Fund Both Growth & Return of Capital
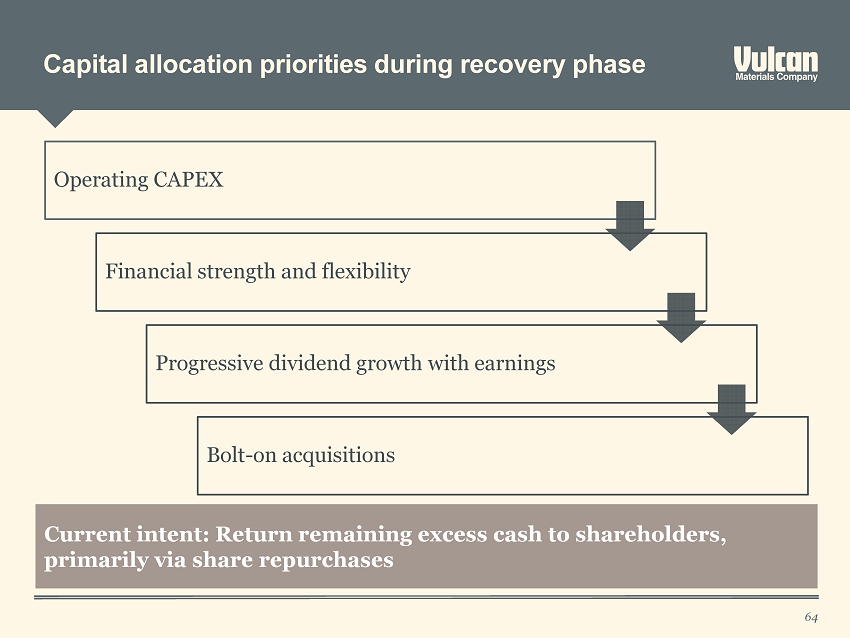
Capital allocation priorities during recovery phase 64 Operating CAPEX Financial strength and flexibility Progressive dividend growth with earnings Bolt - on acquisitions Current intent: Return remaining excess cash to shareholders, primarily via share repurchases

Anticipated approach to share repurchases 65 Review excess cash position and outlook quarterly Utilize open market repurchases: mix of opportunistic and time - period averaging Assess and adjust authorization periodically Report on activity quarterly
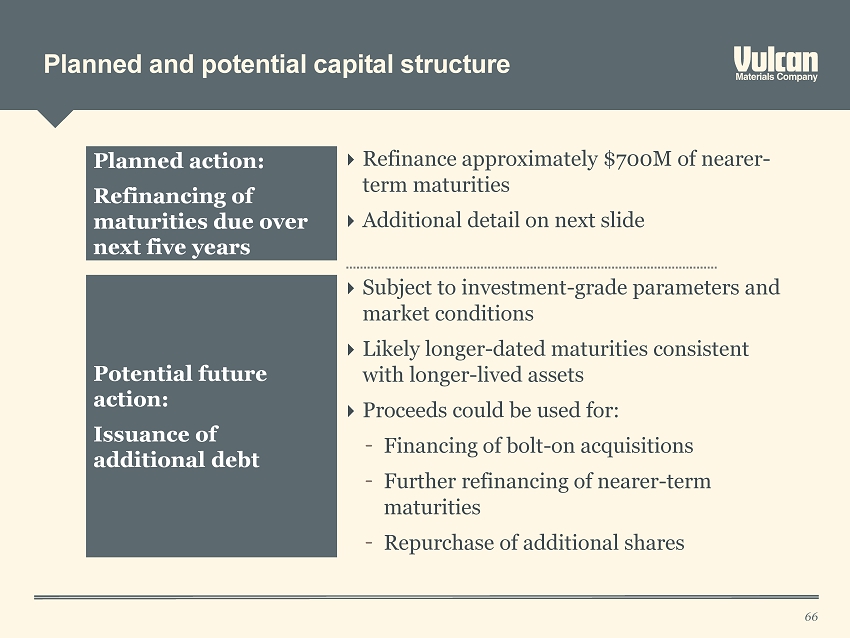
Planned and potential capital structure 66 Planned action: Refinancing of maturities due over next five years Refinance approximately $700M of nearer - term maturities Additional detail on next slide Potential future action: Issuance of additional debt Subject to investment - grade parameters and market conditions Likely longer - dated maturities consistent with longer - lived assets Proceeds could be used for : – Financing of bolt - on acquisitions – Further refinancing of nearer - term maturities – Repurchase of additional shares
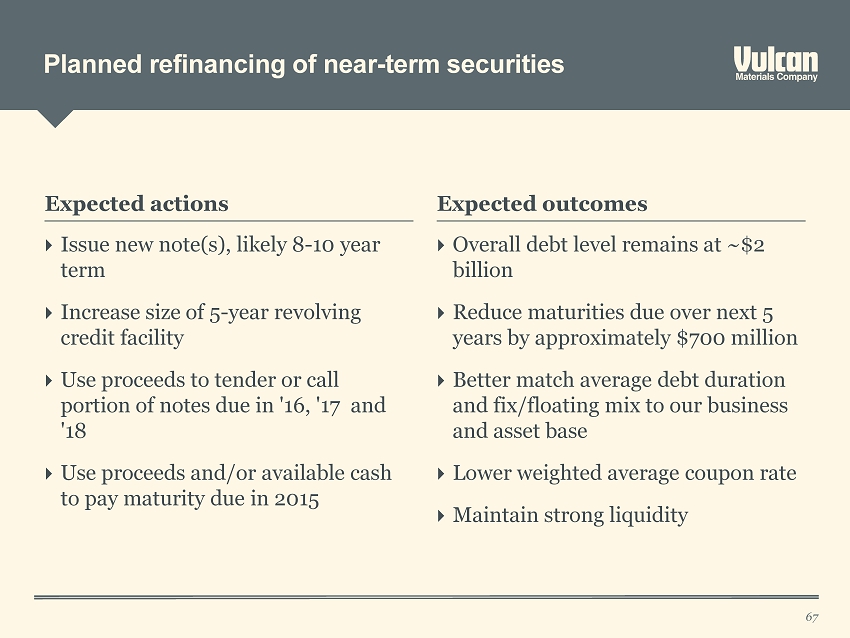
Planned refinancing of near - term securities 67 Expected outcomes Expected actions Issue new note(s), likely 8 - 10 year term Increase size of 5 - year revolving credit facility Use proceeds to tender or call portion of notes due in '16, '17 and '18 Use proceeds and/or available cash to pay maturity due in 2015 Overall debt level remains at ~$2 billion Reduce maturities due over next 5 years by approximately $700 million Better match average debt duration and fix/floating mix to our business and asset base Lower weighted average coupon rate Maintain strong liquidity

Illustrative approach to capital allocation through the cycle 68 Maintain investment grade metrics/ratings and access to capital markets at all points in the cycle. Recovery Phase Expansion Phase Accelerate dividend growth consistent with earnings Return excess cash with preference for share repurchases Fund growth preferably with debt Maintain dividend Strengthen balance sheet; prudently manage financial leverage Return excess cash with preference for regular or special dividends Fund growth preferably with equity

Contents 69 Conclusion and Q&A
Conclusion: What we aim to offer investors (1 of 4) 70 1. A domestic Aggregates business with several years of double - digit revenue growth potential Shipment growth with recovery in construction activity to long - term trend levels Pricing growth as seen in past recovery cycles Eventually, growth toward next cyclical peak 2. Earnings leverage at each stage in the P&L Gross profit margins expanding SAG leverage Financial leverage 3. Significant return of capital A progressive dividend growing with earnings Excess cash focused on share repurchase 4. An investment - grade balance sheet Debt amount and structure appropriate to the asset base and point in the cycle Adequate cushion against external shocks
Conclusion : What we aim to offer investors (2 of 4) 71 5. An advantaged aggregates asset base and franchise of lasting value A ‘pure play’ aggregates business A compelling portfolio of market positions – Most profitable market mix (as evidenced by margins per ton shipped ) – Higher growth rate in recovery; today still > 30% below normal demand – Higher long - term growth rate; serving nearly all key growth corridors and most rapidly growing population centers – Excellent multi - modal logistics capabilities, plus the inherent advantages of our Yucatan quarry and port facilities – Complementary downstream operations, where they matter – Over 85% of revenues from markets where we hold a #1 or # 2 position A sector with a decades - long record of real - price gains; a natural inflation hedge Over 15.8 billion tons of owned and leased reserves 119,000 acres of owned land, with significant unrecognized value
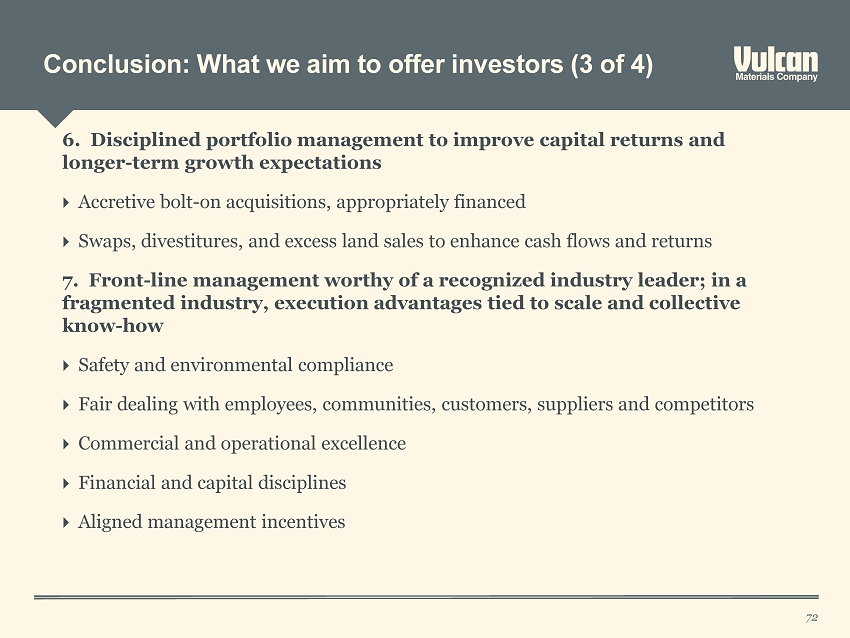
Conclusion: What we aim to offer investors (3 of 4) 72 6. Disciplined portfolio management to improve capital returns and longer - term growth expectations Accretive bolt - on acquisitions, appropriately financed Swaps, divestitures, and excess land sales to enhance cash flows and returns 7. Front - line management worthy of a recognized industry leader; in a fragmented industry, execution advantages tied to scale and collective know - how Safety and environmental compliance Fair dealing with employees, communities, customers, suppliers and competitors Commercial and operational excellence Financial and capital disciplines Aligned management incentives
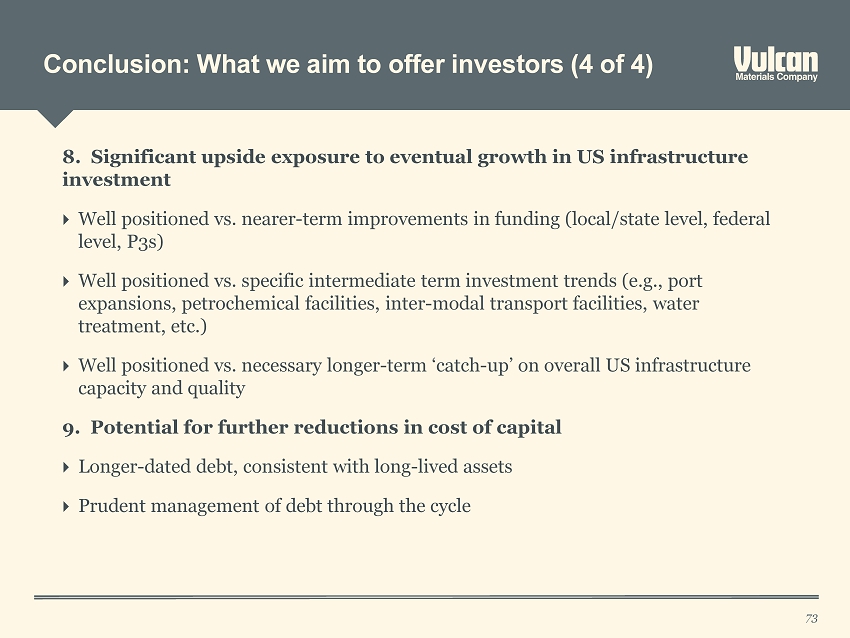
Conclusion: What we aim to offer investors (4 of 4) 73 8. Significant upside exposure to eventual growth in US infrastructure investment Well positioned vs. nearer - term improvements in funding (local/state level, federal level, P3s ) Well positioned vs. specific intermediate term investment trends (e.g., port expansions, petrochemical facilities, inter - modal transport facilities, water treatment, etc .) Well positioned vs. necessary longer - term ‘catch - up’ on overall US infrastructure capacity and quality 9. Potential for further reductions in cost of capital Longer - dated debt, consistent with long - lived assets Prudent management of debt through the cycle

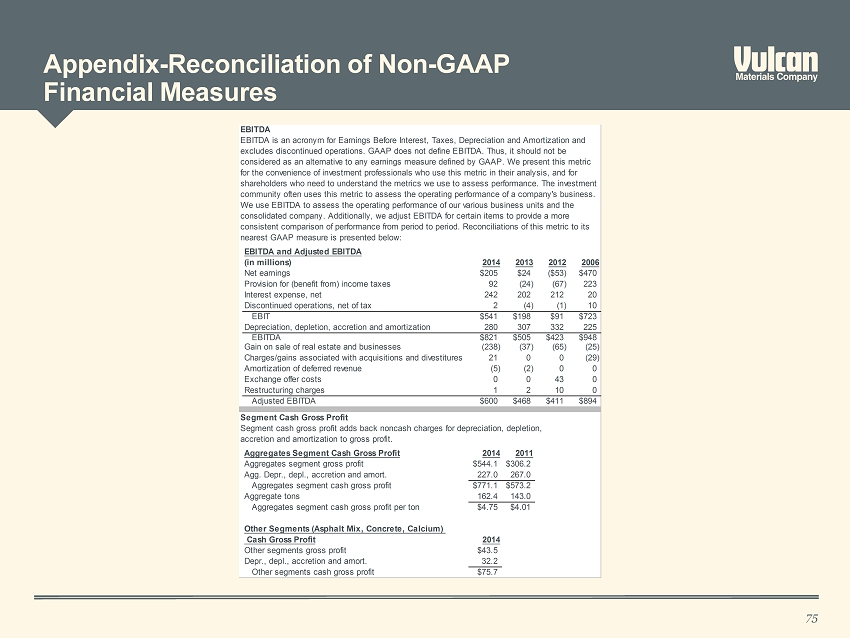
Appendix - Reconciliation of Non - GAAP Financial Measures 75 EBITDA EBITDA and Adjusted EBITDA (in millions) 2014 2013 2012 2006 Net earnings $205 $24 ($53) $470 Provision for (benefit from) income taxes 92 (24) (67) 223 Interest expense, net 242 202 212 20 Discontinued operations, net of tax 2 (4) (1) 10 EBIT $541 $198 $91 $723 Depreciation, depletion, accretion and amortization 280 307 332 225 EBITDA $821 $505 $423 $948 Gain on sale of real estate and businesses (238) (37) (65) (25) Charges/gains associated with acquisitions and divestitures 21 0 0 (29) Amortization of deferred revenue (5) (2) 0 0 Exchange offer costs 0 0 43 0 Restructuring charges 1 2 10 0 Adjusted EBITDA $600 $468 $411 $894 Segment Cash Gross Profit Aggregates Segment Cash Gross Profit 2014 2011 Aggregates segment gross profit $544.1 $306.2 Agg. Depr., depl., accretion and amort. 227.0 267.0 Aggregates segment cash gross profit $771.1 $573.2 Aggregate tons 162.4 143.0 Aggregates segment cash gross profit per ton $4.75 $4.01 Other Segments (Asphalt Mix, Concrete, Calcium) Cash Gross Profit 2014 Other segments gross profit $43.5 Depr., depl., accretion and amort. 32.2 Other segments cash gross profit $75.7 Segment cash gross profit adds back noncash charges for depreciation, depletion, accretion and amortization to gross profit. EBITDA is an acronym for Earnings Before Interest, Taxes, Depreciation and Amortization and excludes discontinued operations. GAAP does not define EBITDA. Thus, it should not be considered as an alternative to any earnings measure defined by GAAP. We present this metric for the convenience of investment professionals who use this metric in their analysis, and for shareholders who need to understand the metrics we use to assess performance. The investment community often uses this metric to assess the operating performance of a company's business. We use EBITDA to assess the operating performance of our various business units and the consolidated company. Additionally, we adjust EBITDA for certain items to provide a more consistent comparison of performance from period to period. Reconciliations of this metric to its nearest GAAP measure is presented below:
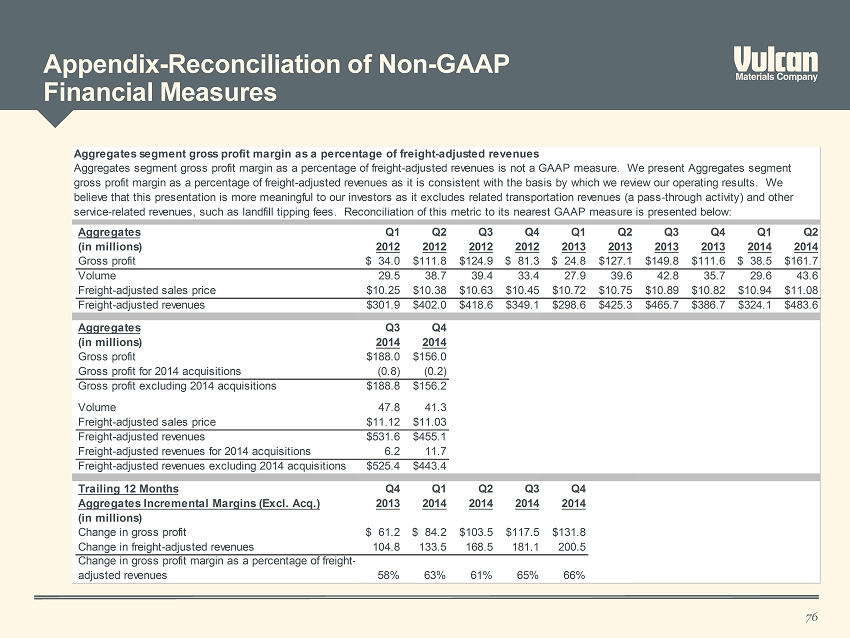
76 Aggregates segment gross profit margin as a percentage of freight-adjusted revenues Aggregates Q1 Q2 Q3 Q4 Q1 Q2 Q3 Q4 Q1 Q2 (in millions) 2012 2012 2012 2012 2013 2013 2013 2013 2014 2014 Gross profit $ 34.0 $111.8 $124.9 $ 81.3 $ 24.8 $127.1 $149.8 $111.6 $ 38.5 $161.7 Volume 29.5 38.7 39.4 33.4 27.9 39.6 42.8 35.7 29.6 43.6 Freight-adjusted sales price $10.25 $10.38 $10.63 $10.45 $10.72 $10.75 $10.89 $10.82 $10.94 $11.08 Freight-adjusted revenues $301.9 $402.0 $418.6 $349.1 $298.6 $425.3 $465.7 $386.7 $324.1 $483.6 Aggregates Q3 Q4 (in millions) 2014 2014 Gross profit $188.0 $156.0 (0.8) (0.2) $188.8 $156.2 Volume 47.8 41.3 Freight-adjusted sales price $11.12 $11.03 Freight-adjusted revenues $531.6 $455.1 6.2 11.7 Freight-adjusted revenues excluding 2014 acquisitions $525.4 $443.4 Trailing 12 Months Q4 Q1 Q2 Q3 Q4 Aggregates Incremental Margins (Excl. Acq.) 2013 2014 2014 2014 2014 (in millions) Change in gross profit $ 61.2 $ 84.2 $103.5 $117.5 $131.8 Change in freight-adjusted revenues 104.8 133.5 168.5 181.1 200.5 58% 63% 61% 65% 66% Aggregates segment gross profit margin as a percentage of freight-adjusted revenues is not a GAAP measure. We present Aggregates segment gross profit margin as a percentage of freight-adjusted revenues as it is consistent with the basis by which we review our operating results. We believe that this presentation is more meaningful to our investors as it excludes related transportation revenues (a pass-through activity) and other service-related revenues, such as landfill tipping fees. Reconciliation of this metric to its nearest GAAP measure is presented below: Change in gross profit margin as a percentage of freight- adjusted revenues Gross profit for 2014 acquisitions Gross profit excluding 2014 acquisitions Freight-adjusted revenues for 2014 acquisitions Appendix - Reconciliation of Non - GAAP Financial Measures