Exhibit 99.1
Lumber Liquidators Investor Presentation September 2019
The following information includes statements of the Company's expectations, intentions, plans and beliefs that constitute "forward - looking statements" within the meanings of the Private Securities Litigation Reform Act of 1995 . These statements, which may be identified by words such as "may," "will," "should," "expects," "intends," "plans," "anticipates," "believes," "thinks," "estimates," "seeks," "predicts," "could," "projects," "potential" and other similar terms and phrases, are based on the beliefs of the Company's management, as well as assumptions made by, and information currently available to, the Company's management as of the date of such statements . These statements are subject to risks and uncertainties, all of which are difficult to predict and many of which are beyond the Company's control . These risks include, without limitation, the impact on us of any of the following : the outcomes of legal proceedings, and the related impact on liquidity ; reputational harm ; obligations related to and impacts of new laws and regulations, including pertaining to tariffs ; obtaining products from abroad, including the effects of tariffs, as well as the effects of antidumping and countervailing duties ; obligations under various settlement agreements and other compliance matters ; disruptions related to our corporate headquarters relocation ; impact of the Tax Cuts and Jobs Act ; inability to open new stores, find suitable locations for our new store concept, and fund other capital expenditures ; inability to execute on our key initiatives or such key initiatives do not yield desired results ; managing growth ; transportation costs ; damage to our assets ; disruption in our ability to distribute our products ; operating stores in Canada and an office in China ; managing third - party installers and product delivery companies ; renewing store or warehouse leases ; having sufficient suppliers ; our , and our suppliers', compliance with complex and evolving rules, regulations, and laws at the federal, state, and local level ; disruption in our ability to obtain products from our suppliers ; product liability claims ; availability of suitable hardwood, including due to disruptions from the impacts of severe weather ; changes in economic conditions, both domestic and abroad ; sufficient insurance coverage ; access to capital ; disruption due to cybersecurity threats ; the handling of confidential customer information, including the impacts from the California Consumer Privacy Act ; management information systems disruptions ; alternative e - commerce offerings ; our advertising strategy ; anticipating consumer trends ; competition ; impact of changes in accounting guidance, including the implementation guidelines and interpretations ; maintenance of valuation allowances on deferred tax assets and the impacts thereof ; internal controls including those over tariffs ; stock price volatility ; and anti - takeover provisions . The Company specifically disclaims any obligation to update these statements, which speak only as of the dates on which such statements are made, except as may be required under the federal securities laws . Information regarding these and other additional risks and uncertainties is contained in the Company's other reports filed with the Securities and Exchange Commission, including the Item 1 A, "Risk Factors," section of the Form 10 - K for the year ended December 31 , 2018 . Please also refer to the financial statements and notes and management discussion included in our annual report on Form 10 - K and our quarterly reports on Form 10 - Q for definitions of key terms including comparable store net sales, average sale, comparable store traffic and Selling, General and Administrative ( SG&A ) expenses . Safe Harbor 2
To supplement the financial measures prepared in accordance with GAAP , we use the following non - GAAP financial measures : ( i ) Adjusted Gross Profit ; (ii) Adjusted Total SG&A ; (iii) Adjusted Operating Profit ; (iv) Adjusted Operating Profit Margin ; (v ) Adjusted Net Income (Loss) ; ( vi) Adjusted Earnings Per Share (EPS ) ; (vii) Adjusted EBITDA ; (viii) Adjusted EBITDA plus Stock - based Compensation Expense ; and (ix) Adjusted Free Cash Flow . The non - GAAP financial measures should be viewed in addition to, and not in lieu of, financial measures calculated in accordance with GAAP . These supplemental measures may vary from, and may not be comparable to, similarly titled measures by other companies . The non - GAAP financial measures are presented because management uses these non - GAAP financial measures to evaluate our operating performance and to determine incentive compensation . Therefore, we believe that the presentation of non - GAAP financial measures provides useful supplementary information to, and facilitates additional analysis by, investors . The presented non - GAAP financial measures exclude items that management does not believe reflect our core operating performance, which include regulatory and legal settlements and associated legal and operating costs, and changes in antidumping and countervailing duties, as such items are outside of our control or due to their inherent unusual, non - operating, unpredictable, non - recurring, or non - cash nature . See Non - GAAP reconciliation set forth in the Appendix contained herein . Non - GAAP Financial Measures 3

Leading North American multi - channel specialty retailer providing a complete purchasing solution and broad product selection to the hard - surface flooring market • Founded in 1994; IPO in 2007 • NYSE: LL; market cap as of June 30, 2019: ~$315M • 415 stores in 47 states and Canada, as of June 30, 2019 • Extensive assortment: solid and engineered hardwoods, laminates, resilient vinyl and waterproof vinyl plank, bamboo, cork, porcelain tile • Differentiated customer experience enabled by omnichannel approach and 1:1 engagement with store associates who lead the industry in knowledge and service • Bicoastal distribution centers total over 1.5M square feet • Headquartered in Toano, Virginia • Relocating to Richmond, VA in 4Q 2019 Lumber Liquidators Snapshot 4

Category Category Composition Hardwood Flooring Solid hardwoods (domestic & exotic), engineered, and bamboo products Manufactured Flooring Laminate, vinyl plank, and porcelain tile Molding s & Accessories Moldings, tools, tiles, and other accessories Installation and Delivery Installation and delivery services Sales by Flooring Type • Solid hardwood migration to engineered continues – LL now better balanced with industry • Strong growth in vinyl plank business • Installation Services contributing as key component of strategy to expand customer base among d o - it - for - me shoppers • Relationships with Pro customers provide LL with further growth potential, and exploring ancillary categories 5 39% 31% 18% 12% Trailing 4 - Quarter Sales Mix, as of June 30, 2019 Manufactured Flooring Hardwood Flooring Moldings & Accessories Installation & Delivery $0 $100,000 $200,000 $300,000 $400,000 $500,000 $600,000 2014 2015 2016 2017 2018 LL 5 - year Sales Mix Trend ($ in 000s) Hardwood Flooring Manufactured Flooring Moldings & Accessories Installation & Delivery
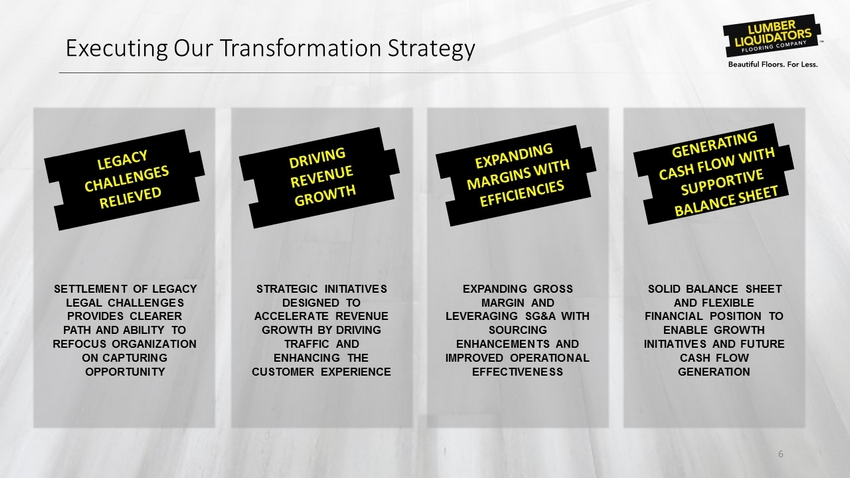
Executing Our Transformation Strategy SETTLEMENT OF LEGACY LEGAL CHALLENGES PROVIDES CLEARER PATH AND ABILITY TO REFOCUS ORGANIZATION ON CAPTURING OPPORTUNITY STRATEGIC INITIATIVES DESIGNED TO ACCELERATE REVENUE GROWTH BY DRIVING TRAFFIC AND ENHANCING THE CUSTOMER EXPERIENCE EXPANDING GROSS MARGIN AND LEVERAGING SG&A WITH SOURCING ENHANCEMENTS AND IMPROVED OPERATIONAL EFFECTIVENESS SOLID BALANCE SHEET AND FLEXIBLE FINANCIAL POSITION TO ENABLE GROWTH INITIATIVES AND FUTURE CASH FLOW GENERATION 6
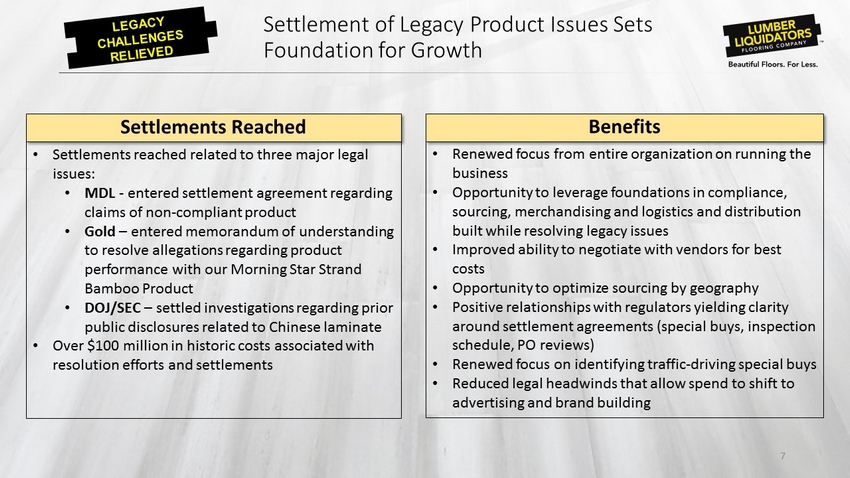
Settlement of L egacy Product Issues Sets Foundation for Growth 7 • Settlements reached related to three major legal issues: • MDL - entered settlement agreement regarding claims of non - compliant product • Gold – entered memorandum of understanding to resolve allegations regarding product performance with our Morning Star Strand Bamboo Product • DOJ/SEC – settled investigations regarding prior public disclosures related to Chinese laminate • Over $100 million in historic costs associated with resolution efforts and settlements • Renewed focus from entire organization on running the business • Opportunity to leverage foundations in compliance, sourcing, merchandising and logistics and distribution built while resolving legacy issues • Improved ability to negotiate with vendors for best costs • Opportunity to optimize sourcing by geography • Positive relationships with regulators yielding clarity around settlement agreements (special buys, inspection schedule, PO reviews) • Renewed focus on identifying traffic - driving special buys • Reduced legal headwinds that allow spend to shift to advertising and brand building Settlements Reached Benefits

• Invest in customer - facing technology, such as web experience, site performance and Picture IT! tool • Strengthen digital marketing platform and improve e - commerce and omnichannel effectiveness • Multi - phased project management for DIFM customers • Continue to enhance the assortment and product available to our customer including a focus on regional assortments Drive DIY, DIFM and Pro Traffic Enhance the Customer Experience Continue to Improve Operational Effectiveness GM EXPANSION & SG&A LEVERAGE • Expand geographically with new store prototypes to create a more compelling shopping experience • Continue to invest and focus on installation services and the do - it - for - me customer • Grow Pro customers by focusing on unique needs of varying Pro specialties • Refine the Lumber Liquidators brand to ensure optimal positioning for our value proposition (we sell floors) • Implement solutions that allow more store associate selling time and focus on the customer • Invest in tools and resources that will increase conversion • Centralized sales s upport and installation sales project coordination • Optimize supply chain network • Maximize gross margin through cost - out and pricing optimization while delivering clear value • Continue to ensure compliant sourcing from around the globe REVENUE GROWTH 8 Our Mission: “From inspiration to installation, our passion is to make beautiful flooring possible and easy for all.” We execute this through three key strategies: Driving accelerated revenue growth and expanding margins

Drive DIY, DIFM and Pro Traffic We look for opportunities to align our offering and sales approach to meet the dynamic needs of the home improvement customer Pro/ commercial Store expansion • We plan to open 10 to 15 new stores in 2019 • See potential to reach 500+ stores • Introducing new store formats • Moving to more “A” and “B” locations • Well - positioned to be an extension of the Pro’s business and their customer support by facilitating customer management and engaging with Pro customer referrals • Picture IT! visualizer tool, Pro Catalog, and Centralized Support have been well received • Projects and products well - suited to commercial applications 9 Do - It - For - Me • A larger and growing segment of customers seek installation support and a one - stop flooring solution • We have installation available across all SKUs, and began national advertising in 2018 Do - It - With - Me • Tech and Install team support • Online chat support functionality • Created web - based tutorial videos Do - It - Yourself • Will evolve brand to highlight services and product quality in addition to great prices • Provide new digital tools to aid visualization (Picture It!) and product selection (Floor Finder)

10 Store Network Characteristics • Attentive and knowledgeable store associates • Testing larger, open format stores, smaller market and showroom - only stores • Expect to open 10 to 15 new stores in 2019 • 415 stores as of June 30, 2019; See potential to reach 500+ stores 100 200 300 400 2010 2011 2012 2013 2014 2015 2016 2017 2018 2Q19 Total Store Count Far Reaching National Store Network 415 Large and Growing Store Network
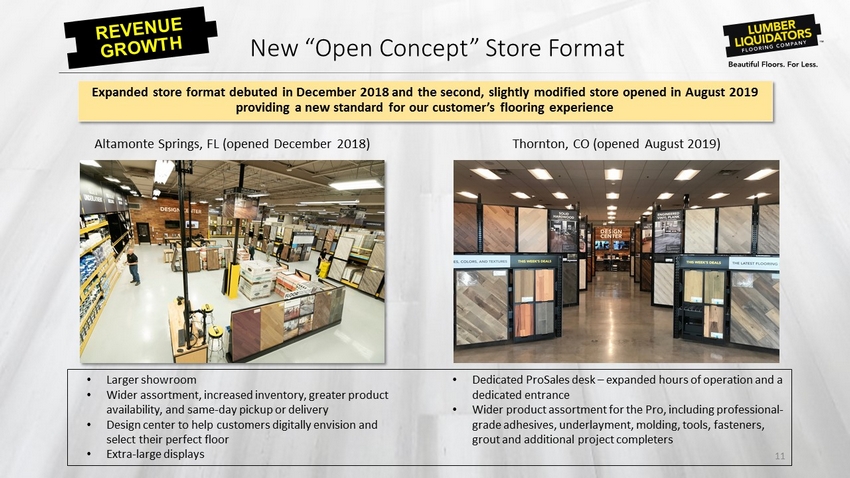
11 Expanded store format debuted in December 2018 and the second, slightly modified store opened in August 2019 providing a new standard for our customer’s flooring experience • Larger showroom • Wider assortment, increased inventory, greater product availability, and same - day pickup or delivery • Design center to help customers digitally envision and select their perfect floor • Extra - large displays New “Open Concept” Store Format • Dedicated ProSales desk – expanded hours of operation and a dedicated entrance • Wider product assortment for the Pro, including professional - grade adhesives, underlayment, molding, tools, fasteners, grout and additional project completers Altamonte Springs, FL (opened December 2018) Thornton, CO (opened August 2019)
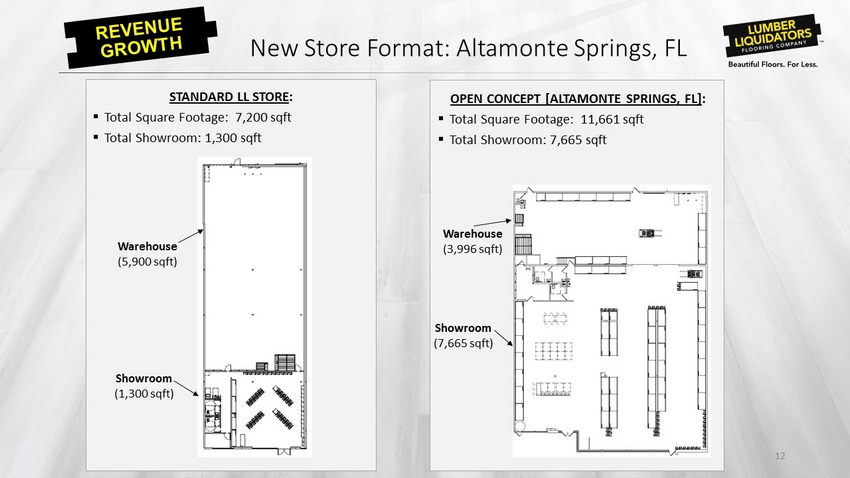
12 OPEN CONCEPT [ALTAMONTE SPRINGS, FL] : ▪ Total Square Footage: 11,661 sqft ▪ Total Showroom: 7,665 sqft STANDARD LL STORE : ▪ Total Square Footage: 7,200 sqft ▪ Total Showroom: 1,300 sqft Showroom ( 1,300 sqft ) Warehouse ( 5,900 sqft ) Showroom ( 7,665 sqft ) Warehouse ( 3,996 sqft ) New Store Format: Altamonte Springs, FL
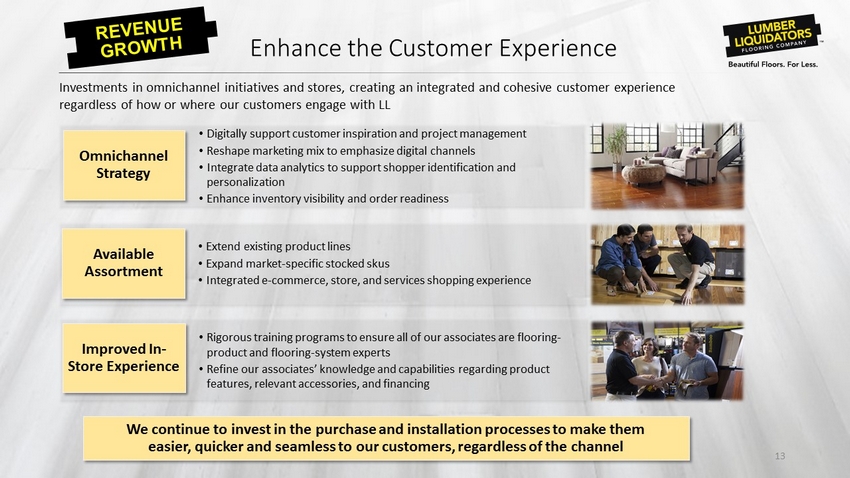
Investments in omnichannel initiatives and stores, creating an integrated and cohesive customer experience regardless of how or where our customers engage with LL Omnichannel Strategy • Digitally support customer inspiration and project management • Reshape marketing mix to emphasize digital channels • Integrate data analytics to support shopper identification and personalization • Enhance inventory visibility and order readiness We continue to invest in the purchase and installation processes to make them easier, quicker and seamless to our customers, regardless of the channel Enhance the Customer Experience 13 Available Assortment • Extend existing product lines • Expand market - specific stocked skus • Integrated e - commerce, store, and services shopping experience Improved In - Store Experience • Rigorous training programs to ensure all of our associates are flooring - product and flooring - system experts • Refine our associates’ knowledge and capabilities regarding product features, relevant accessories, and financing

We aim to expand and improve our technology, team and tactics to ensure we are delivering a best - in - class customer experience for the flooring consumer while driving significantly improved business results. • Reshaping marketing mix to focus more on digital marketing investments and away from less - effective channels, such as print and sports marketing, to drive traffic and orders • Robust analytics and measurement including A/B testing • New e - commerce partnerships to improve efficiency and efficacy • Hired digital experts to drive accelerated growth • Test and learn approach used to enhance current experience • Online floor visualizer tool to digitally preview floor in photo of customer’s home • Improved customer data capture and communication • Mobile first strategy delivers experience with organized look, feel and functionality • National brand that is locally focused and optimized • Re - platform planned in 2020 – will deliver significant enhancement of web performance and experience • Build the LL Installation Portal & digitize the installation experience • Provide the ability to view project status along the journey to installers and customers 14 We aim to aggressively expand and optimize both the digital marketing portfolio and the online customer experience to deliver an exceptional experience Digital Enhancements Improved Digital Marketing Enhanced Consumer Website Experience Installation and Pro Website Functionality
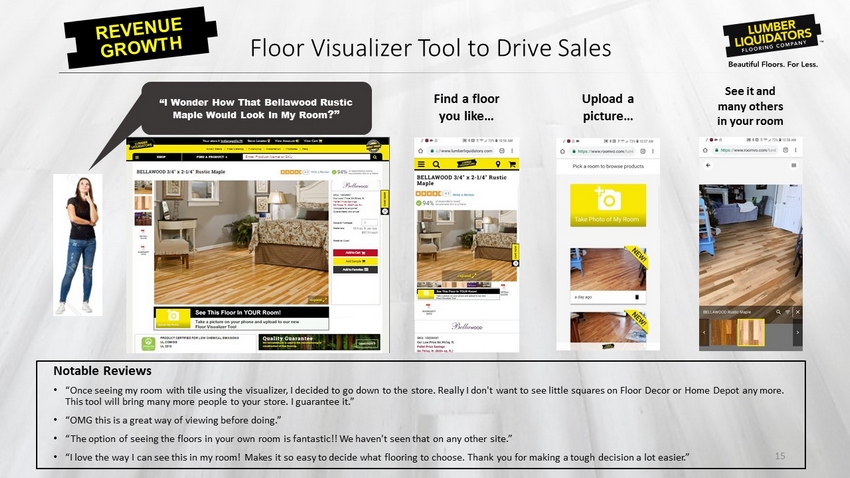
15 Upload a picture… Find a floor you like… See it and many others in your room “I Wonder How That Bellawood Rustic Maple Would Look In My Room ?” • “Once seeing my room with tile using the visualizer, I decided to go down to the store. Really I don't want to see little squ are s on Floor Decor or Home Depot any more. This tool will bring many more people to your store. I guarantee it.” • “OMG this is a great way of viewing before doing.” • “The option of seeing the floors in your own room is fantastic!! We haven't seen that on any other site.” • “I love the way I can see this in my room! Makes it so easy to decide what flooring to choose. Thank you for making a tough d eci sion a lot easier .” Notable Reviews Floor Visualizer Tool to Drive Sales

Continue to Improve Operational Effectiveness Implement Streamlined Processes to Leverage SG&A Increase In - store Selling Hours and Improve Selling Tools • Implemented “faith - based” receiving to streamline store receiving process and add hours to sales floor • Requiring fewer physical inventories facilitated by more disciplined inventory management • In - store use of Picture IT! visualizer tool • Refine advertising spend to enhance effectiveness • Leverage strengthened internal team to reduce third - party audit expenses • Relocate headquarters to benefit from centralized functional teams 16 Improve Sales Support and Installation Project Coordination • Centralized sales support and installation project management • Improve internal visibility to project status to enhance customer experience • Automate installation invoicing approvals and integrate with the Install portal • Leverage national advertising to drive broader awareness of capabilities Optimize Supply Chain Network • Develop long - term DC strategy to lower transportation costs while optimizing inventory investment and meeting customer order - fulfilment expectations • Explore opportunity to utilize larger stores as regional distribution hubs
17 • Closely monitoring situation, including potential incremental 5% on List 3 products proposed for October 1, but continue to execute our transformational strategy • Approximately 47% of our merchandise came from China in 2018 • Executing several key initiatives that are expected to result in long - term benefits • Cost out – vendor negotiations and improving supply chain efficiencies • Sourcing changes – evaluating opportunities to move to certain countries to mitigate impact • Hired a new Head of Sourcing in November 2018 • Extensive experience managing multilayered projects and finding cost - efficient solutions • Positive impacts to our sourcing functions already in place which supports mitigation efforts • Improved pricing strategy – important to ensure we are optimizing our revenue and cost • Evaluating opportunities to influence demand for non China - sourced product • Other considerations • Monitoring relative valuation of Renminbi • Evaluating impact on competitive landscape as approximately half of flooring market held by small, independent operators • Behavior of consumers and competitors are biggest unknowns Note: The guidance provided on August 7, 2019 in conjunction with the Company’s second quarter 2019 earnings release assumed 25% tariffs remained in place Tariff Mitigation
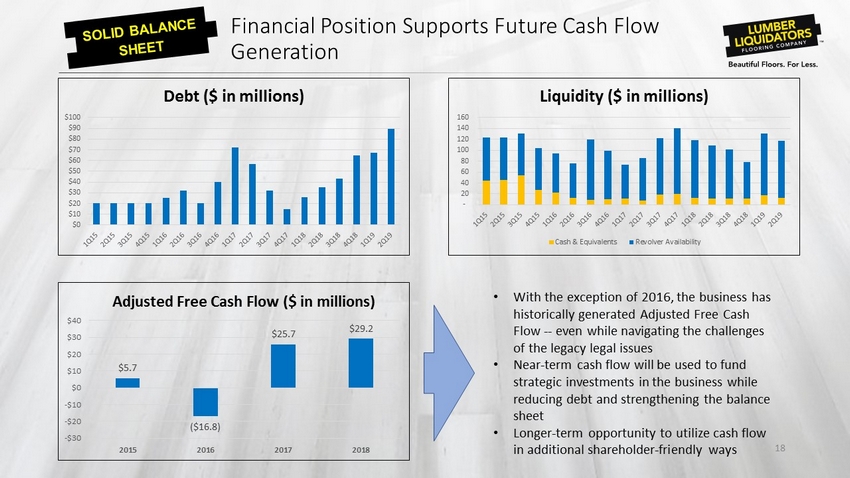
Financial Position Supports Future Cash Flow Generation 18 • With the exception of 2016, the business has historically generated Adjusted Free Cash Flow -- even while navigating the challenges of the legacy legal issues • Near - term cash flow will be used to fund strategic investments in the business while reducing debt and strengthening the balance sheet • Longer - term opportunity to utilize cash flow in additional shareholder - friendly ways $5.7 ($16.8) $25.7 $29.2 -$30 -$20 -$10 $0 $10 $20 $30 $40 2015 2016 2017 2018 Adjusted Free Cash Flow ($ in millions) $0 $10 $20 $30 $40 $50 $60 $70 $80 $90 $100 Debt ($ in millions) - 20 40 60 80 100 120 140 160 Liquidity ($ in millions) Cash & Equivalents Revolver Availability
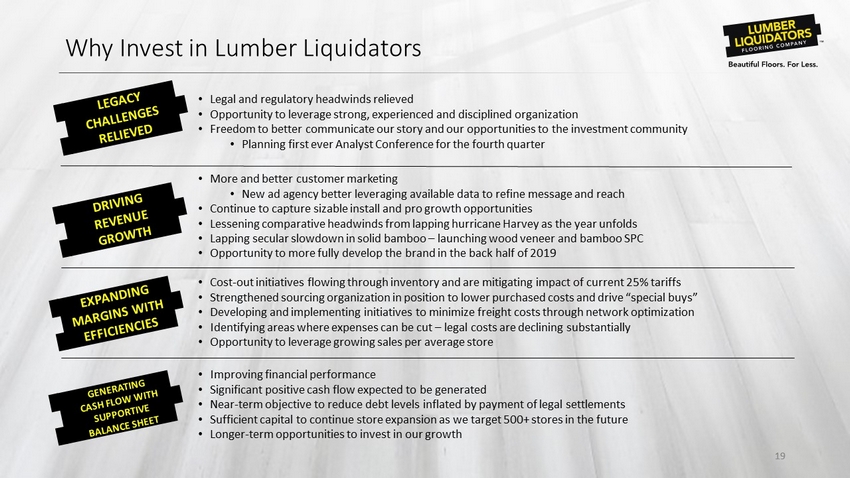
Why Invest in Lumber Liquidators 19 • Cost - out initiatives flowing through inventory and are mitigating impact of current 25% tariffs • Strengthened sourcing organization in position to lower purchased costs and drive “special buys” • Developing and implementing initiatives to minimize freight costs through network optimization • Identifying areas where expenses can be cut – legal costs are declining substantially • Opportunity to leverage growing sales per average store 19 • More and better customer marketing • New ad agency better leveraging available data to refine message and reach • Continue to capture sizable install and pro growth opportunities • Lessening comparative headwinds from lapping hurricane Harvey as the year unfolds • Lapping secular slowdown in solid bamboo – launching wood veneer and bamboo SPC • Opportunity to more fully develop the brand in the back half of 2019 • Improving financial performance • Significant positive cash flow expected to be generated • Near - term objective to reduce debt levels inflated by payment of legal settlements • Sufficient capital to continue store expansion as we target 500+ stores in the future • Longer - term opportunities to invest in our growth • Legal and regulatory headwinds relieved • Opportunity to leverage strong, experienced and disciplined organization • Freedom to better communicate our story and our opportunities to the investment community • Planning first ever Analyst Conference for the fourth quarter
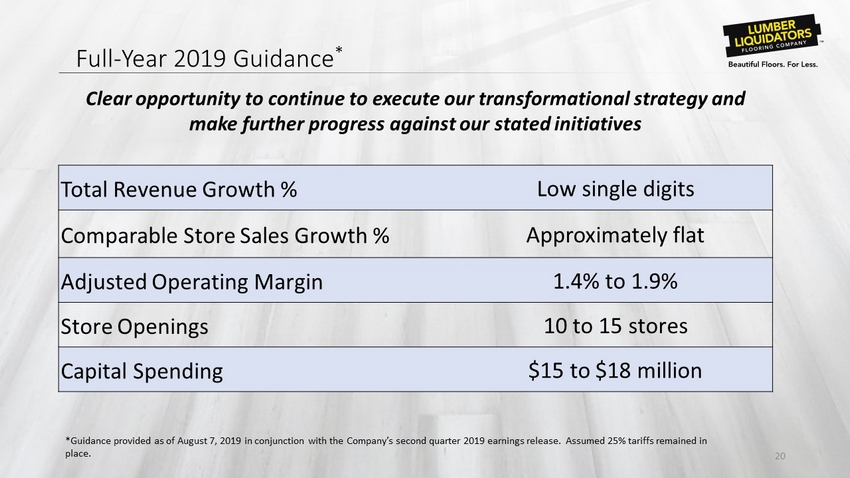
20 Total Revenue Growth % Low single digits Comparable Store Sales Growth % Approximately flat Adjusted Operating Margin 1.4% to 1.9% Store Openings 10 to 15 stores Capital Spending $15 to $18 million Full - Year 2019 Guidance * Clear opportunity to continue to execute our transformational strategy and make further progress against our stated initiatives *Guidance provided as of August 7, 2019 in conjunction with the Company’s second quarter 2019 earnings release. Assumed 25% tariffs remained in place.
Appendix
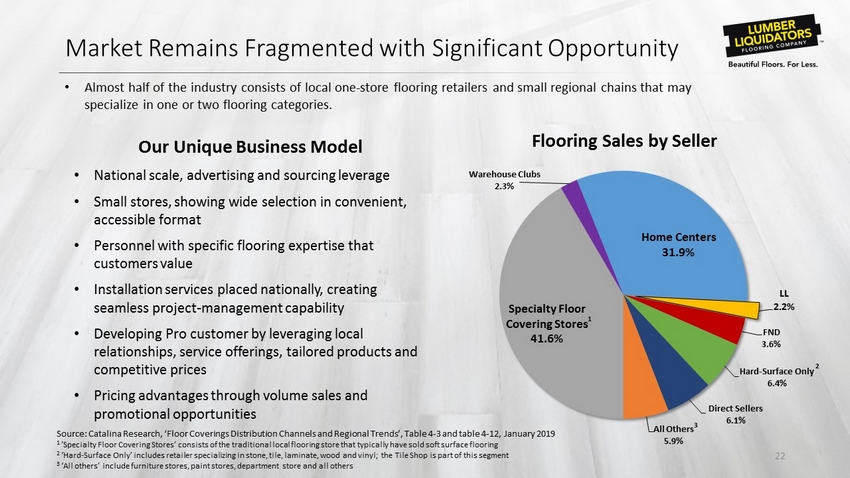
Market Remains Fragmented with Significant Opportunity 22 • Almost half of the industry consists of local one - store flooring retailers and small regional chains that may specialize in one or two flooring categories. Specialty Floor Covering Stores 41.6% Warehouse Clubs 2.3% Home Centers 31.9% LL 2.2% FND 3.6% Hard - Surface Only 6.4% Direct Sellers 6.1% All Others 5.9% Flooring Sales by Seller Our Unique Business Model • National scale, advertising and sourcing leverage • Small stores, showing wide selection in convenient, accessible format • Personnel with specific flooring expertise that customers value • Installation services placed nationally, creating seamless project - management capability • Developing Pro customer by leveraging local relationships, service offerings, tailored products and competitive prices • Pricing advantages through volume sales and promotional opportunities Source: Catalina Research, ‘Floor Coverings Distribution Channels and Regional Trends’, Table 4 - 3 and table 4 - 12, January 2019 1 ’Specialty Floor Covering Stores ’ consists of the traditional local flooring store that typically have sold soft surface flooring 2 ‘Hard - Surface Only’ includes retailer specializing in stone, tile, laminate, wood and vinyl; the Tile Shop is part of this seg ment 3 ‘All others’ include furniture stores, paint stores, department store and all others 1 2 3

Consumers Prefer Hard - Surface and Vinyl Plank Categories 23 Source: 2018 Catalina Research, ‘Floor Covering Industry Trends’; Table 1 - 5, 1 - 10 Floor Covering Product $ Mix [Catalina Research – Manufacturing Sales Estimate] 67% 11% 2% 7% 13% 1997 45% 8% 9% 4% 14% 20% 2017 38% 7% 17% 3% 14% 21% 2023(P) Carpet/Rugs Resilient - Other LVT/LVP - EVP Laminate Wood Ceramic Tile/Stone
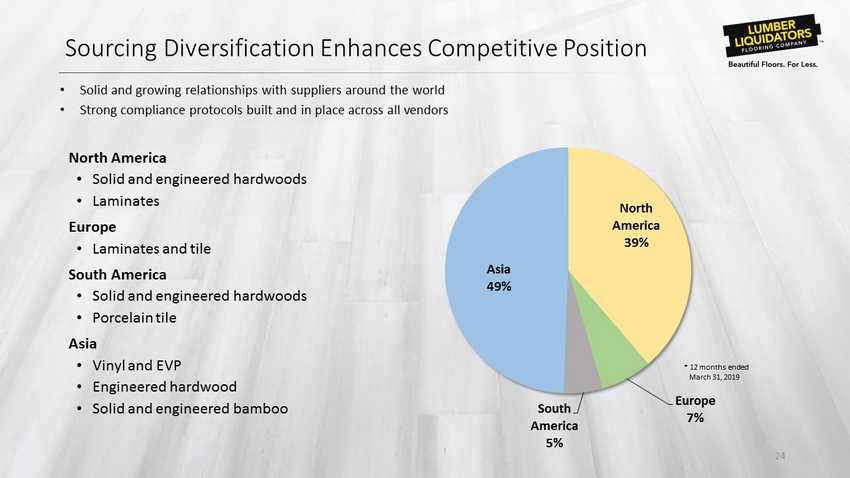
Sourcing Diversification Enhances Competitive Position 24 North America • Solid and engineered hardwoods • Laminates Europe • Laminates and tile South America • Solid and engineered hardwoods • Porcelain tile Asia • Vinyl and EVP • Engineered hardwood • Solid and engineered bamboo • Solid and growing relationships with suppliers around the world • Strong compliance protocols built and in place across all vendors North America 39% Europe 7% South America 5% Asia 49% * 12 months ended March 31, 2019
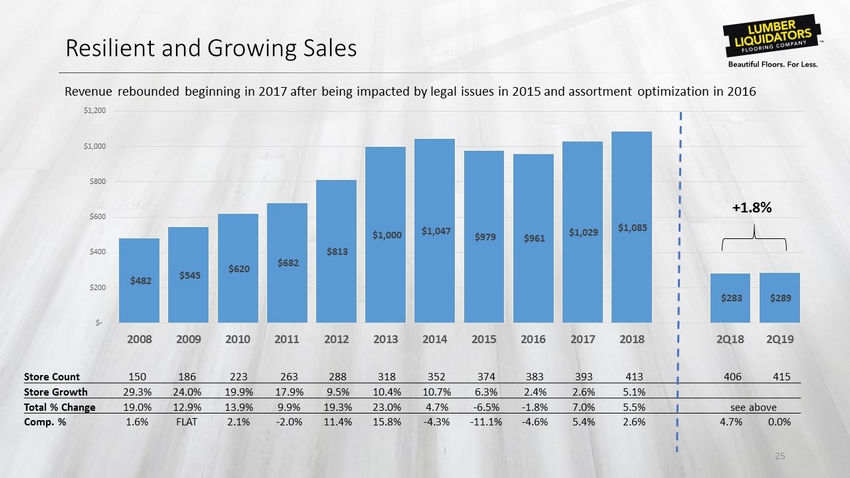
$482 $545 $620 $682 $813 $1,000 $1,047 $979 $961 $1,029 $1,085 $283 $289 $- $200 $400 $600 $800 $1,000 $1,200 2008 2009 2010 2011 2012 2013 2014 2015 2016 2017 2018 2Q18 2Q19 Resilient and Growing Sales 25 Revenue rebounded beginning in 2017 after being impacted by legal issues in 2015 and assortment optimization in 2016 Store Count 150 186 223 263 288 318 352 374 383 393 413 406 415 Store Growth 29.3% 24.0% 19.9% 17.9% 9.5% 10.4% 10.7% 6.3% 2.4% 2.6% 5.1% Total % Change 19.0% 12.9% 13.9% 9.9% 19.3% 23.0% 4.7% - 6.5% - 1.8% 7.0% 5.5% see above Comp. % 1.6% FLAT 2.1% - 2.0% 11.4% 15.8% - 4.3% - 11.1% - 4.6% 5.4% 2.6% 4.7% 0.0% + 1.8%

Comparable Store Sales and Transaction Trends 26 • Approximately flat comparable store sales expected in 2019 - 13.9% - 7.2% 1.0% 2.8% 4.7% 8.8% 3.8% 4.5% 2.9% 4.7% 2.1% 0.4% - 0.8% 0.0% -20.0% -15.0% -10.0% -5.0% 0.0% 5.0% 10.0% 1Q16 2Q16 3Q16 4Q16 1Q17 2Q17 3Q17 4Q17 1Q18 2Q18 3Q18 4Q18 1Q19 2Q19 Sales Comp % -20.00% -15.00% -10.00% -5.00% 0.00% 5.00% 10.00% 1Q16 2Q16 3Q16 4Q16 1Q17 2Q17 3Q17 4Q17 1Q18 2Q18 3Q18 4Q18 1Q19 2Q19 Average Ticket & Transactions Growth vs. Prior Year Avg Ticket % to LY Transactions % to LY
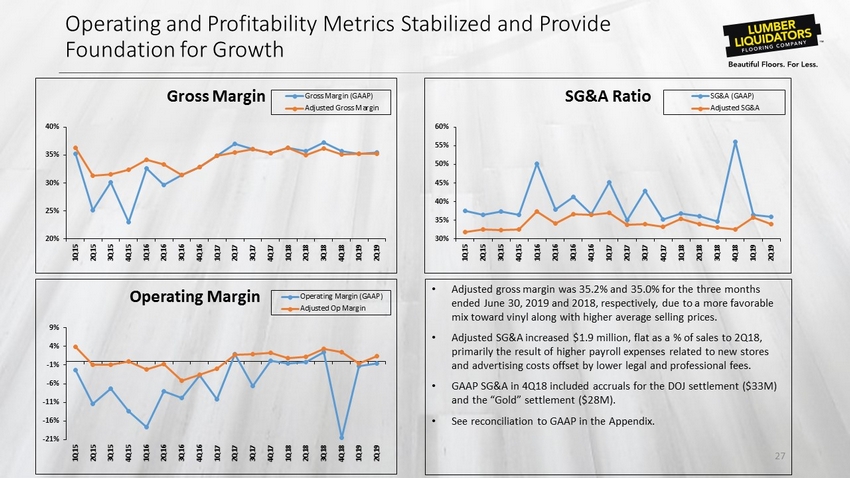
Operating and Profitability Metrics Stabilized and Provide Foundation for Growth 27 • Adjusted gross margin was 35.2% and 35.0% for the three months ended June 30, 2019 and 2018, respectively, due to a more favorable mix toward vinyl along with higher average selling prices. • Adjusted SG&A increased $1.9 million, flat as a % of sales to 2Q18, primarily the result of higher payroll expenses related to new stores and advertising costs offset by lower legal and professional fees. • GAAP SG&A in 4Q18 included accruals for the DOJ settlement ($33M) and the “Gold” settlement ($28M ). • See reconciliation to GAAP in the Appendix. 20% 25% 30% 35% 40% 1Q15 2Q15 3Q15 4Q15 1Q16 2Q16 3Q16 4Q16 1Q17 2Q17 3Q17 4Q17 1Q18 2Q18 3Q18 4Q18 1Q19 2Q19 Gross Margin Gross Margin (GAAP) Adjusted Gross Margin 30% 35% 40% 45% 50% 55% 60% 1Q15 2Q15 3Q15 4Q15 1Q16 2Q16 3Q16 4Q16 1Q17 2Q17 3Q17 4Q17 1Q18 2Q18 3Q18 4Q18 1Q19 2Q19 SG&A Ratio SG&A (GAAP) Adjusted SG&A -21% -16% -11% -6% -1% 4% 9% 1Q15 2Q15 3Q15 4Q15 1Q16 2Q16 3Q16 4Q16 1Q17 2Q17 3Q17 4Q17 1Q18 2Q18 3Q18 4Q18 1Q19 2Q19 Operating Margin Operating Margin (GAAP) Adjusted Op Margin
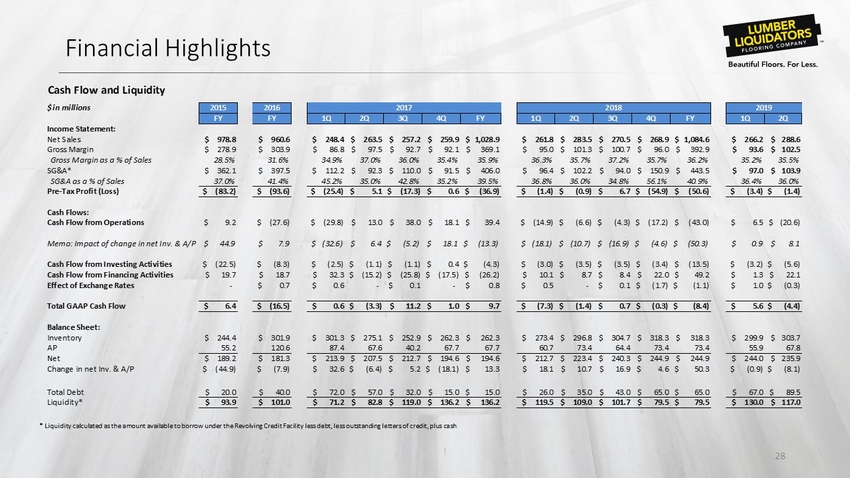
Financial Highlights 28 * Liquidity calculated as the amount available to borrow under the Revolving Credit Facility less debt, less outstanding lett ers of credit, plus cash Cash Flow and Liquidity $ in millions 2015 2016 FY FY 1Q 2Q 3Q 4Q FY 1Q 2Q 3Q 4Q FY 1Q 2Q Income Statement: Net Sales $ 978.8 $ 960.6 $ 248.4 $ 263.5 $ 257.2 $ 259.9 $ 1,028.9 $ 261.8 $ 283.5 $ 270.5 $ 268.9 $ 1,084.6 $ 266.2 $ 288.6 Gross Margin $ 278.9 $ 303.9 $ 86.8 $ 97.5 $ 92.7 $ 92.1 $ 369.1 $ 95.0 $ 101.3 $ 100.7 $ 96.0 $ 392.9 $ 93.6 $ 102.5 Gross Margin as a % of Sales 28.5% 31.6% 34.9% 37.0% 36.0% 35.4% 35.9% 36.3% 35.7% 37.2% 35.7% 36.2% 35.2% 35.5% SG&A* $ 362.1 $ 397.5 $ 112.2 $ 92.3 $ 110.0 $ 91.5 $ 406.0 $ 96.4 $ 102.2 $ 94.0 $ 150.9 $ 443.5 $ 97.0 $ 103.9 SG&A as a % of Sales 37.0% 41.4% 45.2% 35.0% 42.8% 35.2% 39.5% 36.8% 36.0% 34.8% 56.1% 40.9% 36.4% 36.0% Pre-Tax Profit (Loss) $ (83.2) $ (93.6) $ (25.4) $ 5.1 $ (17.3) $ 0.6 $ (36.9) $ (1.4) $ (0.9) $ 6.7 $ (54.9) $ (50.6) $ (3.4) $ (1.4) Cash Flows: Cash Flow from Operations $ 9.2 $ (27.6) $ (29.8) $ 13.0 $ 38.0 $ 18.1 $ 39.4 $ (14.9) $ (6.6) $ (4.3) $ (17.2) $ (43.0) $ 6.5 $ (20.6) Memo: Impact of change in net Inv. & A/P $ 44.9 $ 7.9 $ (32.6) $ 6.4 $ (5.2) $ 18.1 $ (13.3) $ (18.1) $ (10.7) $ (16.9) $ (4.6) $ (50.3) $ 0.9 $ 8.1 Cash Flow from Investing Activities $ (22.5) $ (8.3) $ (2.5) $ (1.1) $ (1.1) $ 0.4 $ (4.3) $ (3.0) $ (3.5) $ (3.5) $ (3.4) $ (13.5) $ (3.2) $ (5.6) Cash Flow from Financing Activities $ 19.7 $ 18.7 $ 32.3 $ (15.2) $ (25.8) $ (17.5) $ (26.2) $ 10.1 $ 8.7 $ 8.4 $ 22.0 $ 49.2 $ 1.3 $ 22.1 Effect of Exchange Rates - $ 0.7 $ 0.6 - $ 0.1 - $ 0.8 $ 0.5 - $ 0.1 $ (1.7) $ (1.1) $ 1.0 $ (0.3) Total GAAP Cash Flow $ 6.4 $ (16.5) $ 0.6 $ (3.3) $ 11.2 $ 1.0 $ 9.7 $ (7.3) $ (1.4) $ 0.7 $ (0.3) $ (8.4) $ 5.6 $ (4.4) Balance Sheet: Inventory $ 244.4 $ 301.9 $ 301.3 $ 275.1 $ 252.9 $ 262.3 $ 262.3 $ 273.4 $ 296.8 $ 304.7 $ 318.3 $ 318.3 $ 299.9 $ 303.7 AP 55.2 120.6 87.4 67.6 40.2 67.7 67.7 60.7 73.4 64.4 73.4 73.4 55.9 67.8 Net $ 189.2 $ 181.3 $ 213.9 $ 207.5 $ 212.7 $ 194.6 $ 194.6 $ 212.7 $ 223.4 $ 240.3 $ 244.9 $ 244.9 $ 244.0 $ 235.9 Change in net Inv. & A/P $ (44.9) $ (7.9) $ 32.6 $ (6.4) $ 5.2 $ (18.1) $ 13.3 $ 18.1 $ 10.7 $ 16.9 $ 4.6 $ 50.3 $ (0.9) $ (8.1) Total Debt $ 20.0 $ 40.0 $ 72.0 $ 57.0 $ 32.0 $ 15.0 $ 15.0 $ 26.0 $ 35.0 $ 43.0 $ 65.0 $ 65.0 $ 67.0 $ 89.5 Liquidity* $ 93.9 $ 101.0 $ 71.2 $ 82.8 $ 119.0 $ 136.2 $ 136.2 $ 119.5 $ 109.0 $ 101.7 $ 79.5 $ 79.5 $ 130.0 $ 117.0 2017 2018 2019

Non - GAAP Reconciliation 29 (1) We recognized adjustments to countervailing and antidumping duties of a favorable $4.9 million, a favorable $2.8 million and an unfavorable $5.5 million associated with applicable shipments of engineered hardwood from China related to prior periods for the years ended December 31, 2018, 2017 and 2016, respectively. (2) In the second quarter 2017, we reduced the reserve that had been established in a prior period for estimated costs to be incu rr ed related to our indoor air quality testing program by approximately $1 million. This reserve was recorded in other current liabilities in the condensed consolidated balance sheet. (3) We recognized classification adjustments related to Harmonized Tariff Schedule (“ HTS ”) duty categorization in prior periods during the year ended December 31, 2018. $ in thousands FY 2015 FY 2016 1Q17 2Q17 3Q17 4Q17 FY 2017 1Q18 2Q18 3Q18 4Q18 FY 2018 1Q19 2Q19Gross Profit $ 278,858 $ 303,869 $ 86,799 $ 97,455 $ 92,687 $ 92,120 $ 369,061 $ 94,972 $ 101,310 $ 100,682 $ 95,976 $ 392,940 $ 93,611 $ 102,487 Less: Anti-Dumping and HTS Adjustments (1) $ 4,921 $ 5,450 - $ (2,797) - - $ (2,797) - $ (2,126) $ (2,822) - $ (4,948) - (779) Indoor Air Quality Testing Program (2) $ 9,445 $ 6,187 - $ (993) - - $ (993) - - - - - - - Inventory Impairments $ 29,051 - - - - - - - - - - - - - Other (3) - - - - - - - - - - $ (1,711) $ (1,711) - - Adjusted Gross Profit $ 322,275 $ 315,506 $ 86,799 $ 93,665 $ 92,687 $ 92,120 $ 365,271 $ 94,972 $ 99,184 $ 97,860 $ 94,265 $ 386,281 $ 93,611 $ 101,708
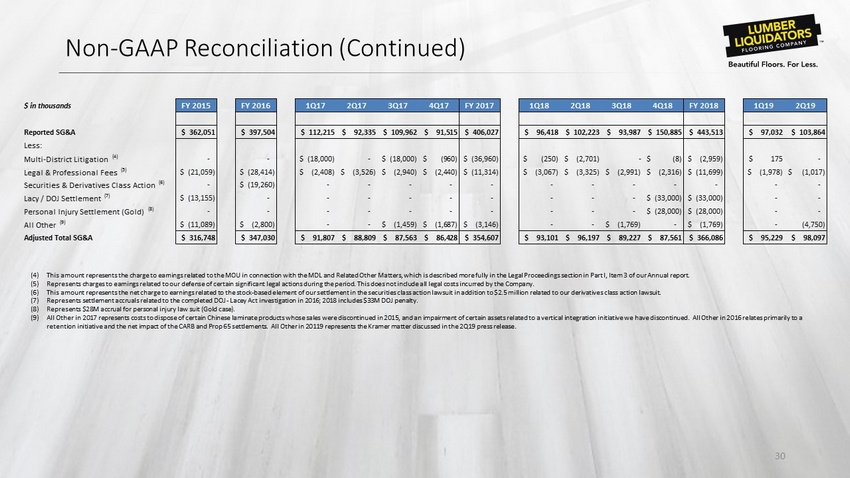
Non - GAAP Reconciliation (Continued) 30 (4) This amount represents the charge to earnings related to the MOU in connection with the MDL and Related Other Matters, which is described more fully in the Legal Proceedings section in Part I, Item 3 of our Annual report. (5) Represents charges to earnings related to our defense of certain significant legal actions during the period. This does not i ncl ude all legal costs incurred by the Company. (6) This amount represents the net charge to earnings related to the stock - based element of our settlement in the securities class a ction lawsuit in addition to $2.5 million related to our derivatives class action lawsuit. (7) Represents settlement accruals related to the completed DOJ - Lacey Act investigation in 2016; 2018 includes $33M DOJ penalty. (8) Represents $28M accrual for personal injury law suit (Gold case). (9) All Other in 2017 represents costs to dispose of certain Chinese laminate products whose sales were discontinued in 2015, and an impairment of certain assets related to a vertical integration initiative we have discontinued. All Other in 2016 relates pr im arily to a retention initiative and the net impact of the CARB and Prop 65 settlements . All Other in 20119 represents the Kramer matter discussed in the 2Q19 press release. $ in thousands FY 2015 FY 2016 1Q17 2Q17 3Q17 4Q17 FY 2017 1Q18 2Q18 3Q18 4Q18 FY 2018 1Q19 2Q19 Reported SG&A $ 362,051 $ 397,504 $ 112,215 $ 92,335 $ 109,962 $ 91,515 $ 406,027 $ 96,418 $ 102,223 $ 93,987 $ 150,885 $ 443,513 $ 97,032 $ 103,864 Less: Multi-District Litigation (4) - - $ (18,000) - $ (18,000) $ (960) $ (36,960) $ (250) $ (2,701) - $ (8) $ (2,959) $ 175 - Legal & Professional Fees (5) $ (21,059) $ (28,414) $ (2,408) $ (3,526) $ (2,940) $ (2,440) $ (11,314) $ (3,067) $ (3,325) $ (2,991) $ (2,316) $ (11,699) $ (1,978) $ (1,017) Securities & Derivatives Class Action (6) - $ (19,260) - - - - - - - - - - - - Lacy / DOJ Settlement (7) $ (13,155) - - - - - - - - - $ (33,000) $ (33,000) - - Personal Injury Settlement (Gold) (8) - - - - - - - - - - $ (28,000) $ (28,000) - - All Other (9) $ (11,089) $ (2,800) - - $ (1,459) $ (1,687) $ (3,146) - - $ (1,769) - $ (1,769) - (4,750) Adjusted Total SG&A $ 316,748 $ 347,030 $ 91,807 $ 88,809 $ 87,563 $ 86,428 $ 354,607 $ 93,101 $ 96,197 $ 89,227 $ 87,561 $ 366,086 $ 95,229 $ 98,097
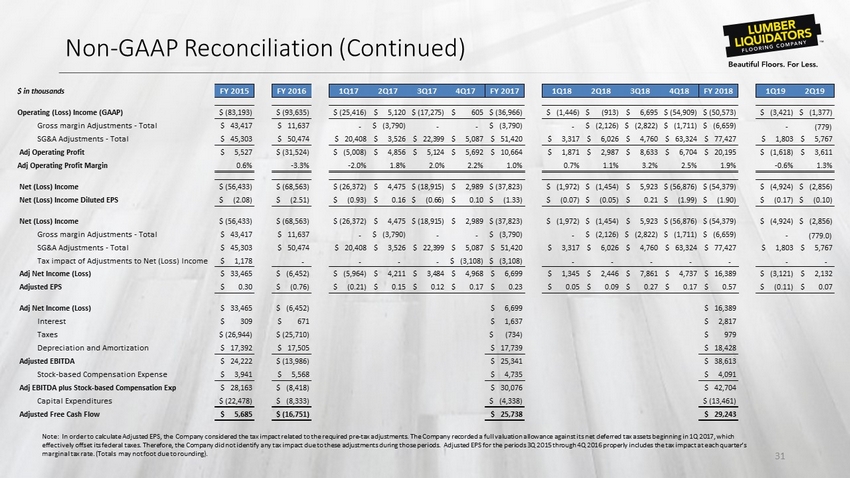
Non - GAAP Reconciliation (Continued) 31 Note: In order to calculate Adjusted EPS, the Company considered the tax impact related to the required pre - tax adjustments. T he Company recorded a full valuation allowance against its net deferred tax assets beginning in 1Q 2017, which effectively offset its federal taxes. Therefore, the Company did not identify any tax impact due to these adjustments during tho se periods. Adjusted EPS for the periods 3Q 2015 through 4Q 2016 properly includes the tax impact at each quarter’s marginal tax rate. (Totals may not foot due to rounding). $ in thousands FY 2015 FY 2016 1Q17 2Q17 3Q17 4Q17 FY 2017 1Q18 2Q18 3Q18 4Q18 FY 2018 1Q19 2Q19 Operating (Loss) Income (GAAP) $ (83,193) $ (93,635) $ (25,416) $ 5,120 $ (17,275) $ 605 $ (36,966) $ (1,446) $ (913) $ 6,695 $ (54,909) $ (50,573) $ (3,421) $ (1,377) Gross margin Adjustments - Total $ 43,417 $ 11,637 - $ (3,790) - - $ (3,790) - $ (2,126) $ (2,822) $ (1,711) $ (6,659) - (779) SG&A Adjustments - Total $ 45,303 $ 50,474 $ 20,408 $ 3,526 $ 22,399 $ 5,087 $ 51,420 $ 3,317 $ 6,026 $ 4,760 $ 63,324 $ 77,427 $ 1,803 $ 5,767 Adj Operating Profit $ 5,527 $ (31,524) $ (5,008) $ 4,856 $ 5,124 $ 5,692 $ 10,664 $ 1,871 $ 2,987 $ 8,633 $ 6,704 $ 20,195 $ (1,618) $ 3,611 Adj Operating Profit Margin 0.6% -3.3% -2.0% 1.8% 2.0% 2.2% 1.0% 0.7% 1.1% 3.2% 2.5% 1.9% -0.6% 1.3% Net (Loss) Income $ (56,433) $ (68,563) $ (26,372) $ 4,475 $ (18,915) $ 2,989 $ (37,823) $ (1,972) $ (1,454) $ 5,923 $ (56,876) $ (54,379) $ (4,924) $ (2,856) Net (Loss) Income Diluted EPS $ (2.08) $ (2.51) $ (0.93) $ 0.16 $ (0.66) $ 0.10 $ (1.33) $ (0.07) $ (0.05) $ 0.21 $ (1.99) $ (1.90) $ (0.17) $ (0.10) Net (Loss) Income $ (56,433) $ (68,563) $ (26,372) $ 4,475 $ (18,915) $ 2,989 $ (37,823) $ (1,972) $ (1,454) $ 5,923 $ (56,876) $ (54,379) $ (4,924) $ (2,856) Gross margin Adjustments - Total $ 43,417 $ 11,637 - $ (3,790) - - $ (3,790) - $ (2,126) $ (2,822) $ (1,711) $ (6,659) - (779.0) SG&A Adjustments - Total $ 45,303 $ 50,474 $ 20,408 $ 3,526 $ 22,399 $ 5,087 $ 51,420 $ 3,317 $ 6,026 $ 4,760 $ 63,324 $ 77,427 $ 1,803 $ 5,767 Tax impact of Adjustments to Net (Loss) Income $ 1,178 - - - - $ (3,108) $ (3,108) - - - - - - - Adj Net Income (Loss) $ 33,465 $ (6,452) $ (5,964) $ 4,211 $ 3,484 $ 4,968 $ 6,699 $ 1,345 $ 2,446 $ 7,861 $ 4,737 $ 16,389 $ (3,121) $ 2,132 Adjusted EPS $ 0.30 $ (0.76) $ (0.21) $ 0.15 $ 0.12 $ 0.17 $ 0.23 $ 0.05 $ 0.09 $ 0.27 $ 0.17 $ 0.57 $ (0.11) $ 0.07 Adj Net Income (Loss) $ 33,465 $ (6,452) $ 6,699 $ 16,389 Interest $ 309 $ 671 $ 1,637 $ 2,817 Taxes $ (26,944) $ (25,710) $ (734) $ 979 Depreciation and Amortization $ 17,392 $ 17,505 $ 17,739 $ 18,428 Adjusted EBITDA $ 24,222 $ (13,986) $ 25,341 $ 38,613 Stock-based Compensation Expense $ 3,941 $ 5,568 $ 4,735 $ 4,091 Adj EBITDA plus Stock-based Compensation Exp $ 28,163 $ (8,418) $ 30,076 $ 42,704 Capital Expenditures $ (22,478) $ (8,333) $ (4,338) $ (13,461) Adjusted Free Cash Flow $ 5,685 $ (16,751) $ 25,738 $ 29,243
Lumber Liquidators Investor contacts: Danielle O’Brien Edelman Investor Relations ir@lumberliquidators.com Paul Taaffe VP – FP&A and Investor Relations ptaaffe@lumberliquidators.com