UNITED STATES
SECURITIES AND EXCHANGE COMMISSION
WASHINGTON, DC 20549
FORM 20-F
(Mark One)
| ¨ | Registration statement pursuant to Section 12(b) or 12(g) of the Securities Exchange Act of 1934 |
or
| x | Annual report pursuant to Section 13 or 15(d) of the Securities Exchange Act of 1934 |
For the fiscal year ended December 31, 2007.
or
| ¨ | Transition report pursuant to Section 13 or 15(d) of the Securities Exchange Act of 1934 |
For the transition period from to
or
| ¨ | Shell company report pursuant to Section 13 or 15(d) of the Securities Exchange Act of 1934 |
Date of event requiring this shell company report
Commission file number: 001-33433
CHINA SUNERGY CO., LTD.
(Exact name of Registrant as specified in its charter)
N/A
(Translation of Registrant’s name into English)
Cayman Islands
(Jurisdiction of incorporation or organization)
No. 123 Focheng West Road
Jiangning Economic & Technical Development Zone
Nanjing, Jiangsu 211100, People’s Republic of China
(Address of principal executive offices)
Ruennsheng Allen Wang, (86 25) 5276 6890,
allen.wang@chinasunergy.com,
No. 123 Focheng West Road
Jiangning Economic & Technical Development Zone
Nanjing, Jiangsu 211100, People’s Republic of China
(Name, Telephone, E-mail and/or Facsimile number and Address of Company Contact Person)
Securities registered or to be registered pursuant to Section 12(b) of the Act:
| | |
Title of each class | | Name of each exchange on which registered |
American Depositary Shares, each representing six ordinary shares, par value US$0.0001 per share | | Nasdaq Global Market |
Securities registered or to be registered pursuant to Section 12(g) of the Act:
None
(Title of Class)
Securities for which there is a reporting obligation pursuant to Section 15(d) of the Act:
None
(Title of Class)
Indicate the number of outstanding shares of each of the Issuer’s classes of capital or common stock as of the close of the period covered by the annual report.
237,332,777 ordinary shares, par value US$0.0001 per share, as of December 31, 2007.
Indicate by check mark if the registrant is a well-known seasoned issuer, as defined in Rule 405 of the Securities Act. Yes ¨ No x
If this report is an annual or transition report, indicate by check mark if the registrant is not required to file reports pursuant to Section 13 or 15(d) of the Securities Exchange Act of 1934. Yes ¨ No x
Indicate by check mark whether the registrant: (1) has filed all reports required to be filed by Section 13 or 15(d) of the Securities Exchange Act of 1934 during the preceding 12 months (or for such shorter period that the registrant was required to file such reports), and (2) has been subject to such filing requirements for the past 90 days. Yes x No ¨
Indicate by check mark whether the registrant is a large accelerated filer, an accelerated filer, or a non-accelerated filer. See definition of “accelerated filer and large accelerated filer” in Rule 12b-2 of the Exchange Act. (Check one):
| | | | |
| Large accelerated filer ¨ | | Accelerated filer ¨ | | Non-accelerated filer x |
Indicate by check mark which basis of accounting the registrant has been to prepare the financial statements included in this filing:
| | | | |
| U.S. GAAP x | | International Financial Reporting Standards as issued by the International Accounting Standards Board ¨ | | Other ¨ |
Indicate by check mark which financial statement item the registrant has elected to follow: Item 17 ¨ Item 18 x
If “other” has been checked in response to the previous question, indicate by check mark which financial statement item the registrant has elected to follow. Item 17 ¨ Item 18 ¨
If this is an annual report, indicate by check mark whether the registrant is a shell company (as defined in Rule 12b-2 of the Exchange Act). Yes ¨ No x
(APPLICABLE ONLY TO ISSUERS INVOLVED IN BANKRUPTCY PROCEEDINGS DURING THE PAST FIVE YEARS)
Indicate by check mark whether the registrant has filed all documents and reports required to be filed by Sections 12, 13 or 15(d) of the Securities Exchange Act of 1934 subsequent to the distribution of securities under a plan confirmed by a court. Yes ¨ No ¨
TABLE OF CONTENTS
INTRODUCTION
In this annual report, except where the context otherwise requires and for purposes of this annual report only:
| | • | | “we,” “us,” “our company,” “our,” “Sunergy” and “China Sunergy” refer to China Sunergy Co., Ltd., its predecessor entities and its subsidiaries; |
| | • | | “shares” or “ordinary shares” refers to our ordinary shares, “ADSs” refers to our American depositary shares, each of which represents six ordinary shares, and “ADRs” refers to the American depositary receipts that evidence our ADSs; |
| | • | | “China” or “PRC” refers to the People’s Republic of China, excluding, for the purposes of this report, the Hong Kong Special Administrative Region, the Macau Special Administrative Region and Taiwan; |
| | • | | “RMB” or “Renminbi” refers to the legal currency of China; “$” or “U.S. dollars” refers to the legal currency of the United States; and “Euro” or “€” refers to the legal currency of the European Union; |
| | • | | “original equipment manufacturing” or “OEM” refers to arrangements under which we process silicon wafers provided by our customers into solar cells and charge processing fees from these customers; |
| | • | | “passivated emitter and rear cell” refers to a solar cell which uses oxide on its front and rear surfaces, and of which the rear surface is contacted by metal only at certain regions; |
| | • | | “selective emitter cell” refers to a solar cell where the regions under the front metal contact and the rest of the front surface areas are separately diffused and optimized; and |
| | • | | when calculating our manufacturing or production capacity of solar cells, we have assumed that all production will be done using 156-millimeter monocrystalline silicon wafers, even though we currently use and expect to continue to use a mixture of monocrystalline and multicrystalline silicon wafers, each in sizes of 125-millimeter and 156-millimeter; to the extent we use smaller wafers or multicrystalline wafers, our actual production will be less than our capacity. |
Our financial statements are expressed in the U.S. dollar, which is our reporting and functional currency. However, a majority of the revenues and expenses of our consolidated operating subsidiary is denominated in Renminbi. With respect to amounts not recorded in our consolidated financial statements included elsewhere in this report, all translations from Renminbi to U.S. dollars were made at the noon buying rate in the City of New York for cable transfers in Renminbi per U.S. dollar as certified for customs purposes by the Federal Reserve Bank of New York. Unless otherwise noted, all translations from Renminbi to U.S. dollars have been made at a rate of RMB7.2946 to US$1.00, the noon buying rate in effect as of December 31, 2007. We make no representation that any Renminbi or U.S. dollar amounts could have been, or could be, converted to U.S. dollars or Renminbi, at any particular rate, or at all. On June 5, 2008 the noon buying rate was RMB6.9460 to US$1.00.
This annual report on Form 20-F includes our audited consolidated statements of operations for the years ended December 31, 2005, 2006 and 2007, and consolidated balance sheets as of December 31, 2005, 2006 and 2007.
We completed our initial public offering of 9,775,000 ADSs on May 22, 2007. On May 17, 2007, we listed our ADSs on the Nasdaq Global Market, or Nasdaq, under the symbol “CSUN.”
1
FORWARD-LOOKING INFORMATION
This annual report on Form 20-F contains statements of a forward-looking nature. These statements involve known and unknown risks, uncertainties and other factors that may cause our actual results, performance or achievements to be materially different from those expressed or implied by the forward-looking statements. These statements are made under the “safe harbor” provisions of the U.S. Private Securities Litigation Reform Act of 1995. Whenever you read a statement that is not simply a statement of historical fact (such as when we describe what we “believe,” “expect” or “anticipate” will occur, and other similar statements), you must remember that our expectations may not be correct, even though we believe that they are reasonable.
Whether actual results will conform with our expectations and predictions is subject to a number of risks and uncertainties, many of which are beyond our control, and reflect future business decisions that are subject to change. Some of the assumptions, future results and levels of performance expressed or implied in the forward-looking statements we make inevitably will not materialize, and unanticipated events may occur which will affect our results.
We would like to caution you not to place undue reliance on forward-looking statements and you should read these statements in conjunction with the risk factors disclosed in Item 3 of this annual report, “Key Information—Risk Factors.” We do not undertake any obligation to update or revise the forward-looking statements except as required under applicable law.
2
I. PART I
| ITEM 1. | IDENTITY OF DIRECTORS, SENIOR MANAGEMENT AND ADVISERS |
Not Applicable.
| ITEM 2. | OFFER STATISTICS AND EXPECTED TIMETABLE |
Not Applicable.
| A. | Selected Financial Data |
The following table presents selected consolidated financial information for our company. You should read the following information in conjunction with Item 5, “Operating and Financial Review and Prospects,” below. The selected consolidated statement of operations data for the three years ended December 31, 2005, 2006 and 2007 and the selected consolidated balance sheet data as of December 31, 2005, 2006 and 2007 have been derived from our audited consolidated financial statements and should be read in conjunction with those statements, which are included in this annual report beginning on page F-1. Our selected consolidated statement of operations data for the period from August 2, 2004 to December 31, 2004 and the selected consolidated balance sheet data as of December 31, 2004, have been derived from audited consolidated financial statements which are not included in this annual report. Our audited consolidated financial statements are prepared and presented in accordance with United States generally accepted accounting principles, or U.S. GAAP.
3
| | | | | | | | | | | | | | | | |
| | | For the Period
from
August 2, 2004
to
December 31, 2004 | | | For the Year Ended December 31, | |
| | | | 2005 | | | 2006 | | | 2007 | |
| | | (in thousands, except share, per share, operating data and percentages) | |
Consolidated Statement of Operations Data | | | | | | | | | | | | | | | | |
Net revenues | | | — | | | $ | 13,750 | | | $ | 149,521 | | | $ | 234,908 | |
Cost of revenues | | | — | | | | (11,796 | ) | | | (122,889 | ) | | | (216,881 | ) |
| | | | | | | | | | | | | | | | |
Gross profit | | | — | | | | 1,954 | | | | 26,632 | | | | 18,027 | |
| | | | | | | | | | | | | | | | |
Operating expenses: | | | | | | | | | | | | | | | | |
Selling expenses | | | — | | | | (38 | ) | | | (1,014 | ) | | | (1,644 | ) |
General and administrative expenses | | $ | (953 | )(1) | | | (1,584 | ) | | | (9,901 | )(2) | | | (13,664 | ) |
Research and development expenses | | | — | | | | (49 | ) | | | (546 | ) | | | (2,555 | ) |
| | | | | | | | | | | | | | | | |
Total operating expenses | | | (953 | )(1) | | | (1,671 | ) | | | (11,461 | )(2) | | | (17,863 | ) |
Income (loss) income from operations | | | (953 | ) | | | 283 | | | | 15,171 | | | | 164 | |
Net income (loss) | | | (959 | ) | | | (307 | ) | | | 11,814 | | | | (4,855 | ) |
Dividend on Series A redeemable convertible preferred shares | | | — | | | | — | | | | (13,377 | )(3) | | | (155 | ) |
Dividend on Series B redeemable convertible preferred shares | | | — | | | | — | | | | (28,552 | )(4) | | | (330 | ) |
Dividend on Series C redeemable convertible preferred shares | | | — | | | | — | | | | (7,097 | )(5) | | | (233 | ) |
| | | | | | | | | | | | | | | | |
Net loss attributable to holders of ordinary shares | | $ | (959 | ) | | $ | (307 | ) | | $ | (37,212 | ) | | $ | (5,573 | ) |
| | | | | | | | | | | | | | | | |
Net loss per share | | | | | | | | | | | | | | | | |
—Basic | | $ | (0.01 | ) | | $ | (0.00 | ) | | $ | (0.36 | ) | | $ | (0.04 | ) |
—Diluted | | $ | (0.01 | ) | | $ | (0.00 | ) | | $ | (0.36 | ) | | $ | (0.04 | ) |
Shares used in computation | | | | | | | | | | | | | | | | |
—Basic | | | 108,000,000 | | | | 108,000,000 | | | | 103,583,178 | | | | 185,165,757 | |
—Diluted | | | 108,000,000 | | | | 108,000,000 | | | | 103,583,178 | | | | 185,165,757 | |
| | | | |
Other Consolidated Financial Data | | | | | | | | | | | | | | | | |
Gross margin | | | — | | | | 14.2 | % | | | 17.8 | % | | | 7.7 | % |
| | | | |
Consolidated Operating Data | | | | | | | | | | | | | | | | |
Solar cells sold (in megawatts, or MW) | | | — | | | | 4.4 | | | | 46.4 | | | | 70.0 | |
Average selling price (in $ per watt) | | | — | | | $ | 3.10 | | | $ | 3.22 | | | $ | 2.92 | |
| (1) | Included a non-cash charge of $0.8 million relating to forgiveness of shareholder receivables from certain of our directors and executive officers. |
| (2) | Included a non-cash charge of $3.7 million relating to the excess distribution to our president and a non-cash charge of $0.5 million relating to forgiveness of shareholder receivables from certain of our directors and executive officers. |
| (3) | Included a one-time beneficial conversion feature of $13,110,400. |
| (4) | Included a one-time beneficial conversion feature of $27,999,948. |
| (5) | Included a one-time beneficial conversion feature of $6,941,170. |
4
| | | | | | | | | | | | | | |
| | | As of December 31, |
| | | 2004 | | | 2005 | | | 2006 | | 2007 |
| | | (in thousands) |
Consolidated Balance Sheet Data | | | | | | | | | | | | | | |
Cash and cash equivalents | | $ | 1,032 | | | $ | 2,765 | | | $ | 14,750 | | $ | 60,458 |
Restricted cash | | | 2,016 | | | | 21,959 | | | | 4,952 | | | 23,473 |
Inventories | | | 30 | | | | 6,647 | | | | 44,331 | | | 56,092 |
Accounts receivable, net | | | — | | | | 1,705 | | | | 43,048 | | | 26,817 |
Advances to suppliers | | | — | | | | 17,408 | | | | 26,281 | | | 79,912 |
Amounts due from related parties | | | 2,256 | | | | 14,104 | | | | 1,977 | | | 2,112 |
Prepaid expenses and other current assets | | | 12 | | | | 281 | | | | 1,082 | | | 16,316 |
Total current assets | | | 5,346 | | | | 64,870 | | | | 136,421 | | | 265,708 |
Property, plant and equipment, net | | | 2,290 | | | | 13,414 | | | | 38,730 | | | 52,929 |
Total assets | | | 8,602 | | | | 79,307 | | | | 176,327 | | | 321,144 |
Short-term borrowings | | | — | | | | 21,685 | | | | 69,263 | | | 121,841 |
Current portion of long-term borrowings | | | — | | | | — | | | | 8,674 | | | — |
Accounts payable | | | 721 | | | | 3,216 | | | | 11,845 | | | 7,157 |
Advances from customers | | | — | | | | 11,132 | | | | 950 | | | 4,893 |
Amounts due to related parties | | | 2,335 | | | | 28,437 | | | | 4 | | | 8 |
Total current liabilities | | | 3,114 | | | | 65,393 | | | | 92,104 | | | 136,243 |
Long-term borrowings | | | 1,812 | | | | 8,674 | | | | — | | | — |
Series A redeemable convertible preferred shares | | | — | | | | — | | | | 13,228 | | | — |
Series B redeemable convertible preferred shares | | | — | | | | — | | | | 28,502 | | | — |
Series C redeemable convertible preferred shares | | | — | | | | — | | | | 20,056 | | | — |
Additional paid-in capital | | | 9,450 | | | | 9,450 | | | | 20,145 | | | 178,361 |
Subscription receivable | | | (5,298 | ) | | | (3,052 | ) | | | — | | | — |
Total shareholders’ equity | | | 3,193 | | | | 5,240 | | | | 22,280 | | | 183,848 |
Total liabilities, mezzanine equity and shareholders’ equity | | | 8,602 | | | | 79,307 | | | | 176,327 | | | 321,144 |
Exchange Rate Information
This annual report contains translations of certain Renminbi amounts into U.S. dollars at the rate of RMB7.2946 to $1.00, the noon buying rate in effect on December 31, 2007 in New York City for cable transfers of Renminbi as certified for customs purposes by the Federal Reserve Bank of New York. We make no representation that the Renminbi or U.S. dollar amounts referred to in this annual report could have been or could be converted into U.S. dollars or Renminbi, as the case may be, at any particular rate or at all. See Item 3, “Key Information—Risk Factors—Risks Related to Doing Business in China—Fluctuation in the value of the Renminbi may have a material adverse effect on your investment” for discussions of the effects of fluctuating exchange rates. On June 5, 2008, the noon buying rate was RMB6.9460 to $1.00.
5
The following table sets forth information concerning exchange rates between the RMB and the U.S. dollar for the periods indicated. These rates are provided solely for your convenience and are not necessarily the exchange rates that we used in this annual report or will use in the preparation of our periodic reports or any other information to be provided to you. The source of these rates is the Federal Reserve Bank of New York.
| | | | | | | | |
| | | Noon Buying Rate |
Period | | Period End | | Average(1) | | Low | | High |
| | | (RMB per US$1.00) |
2003 | | 8.2767 | | 8.2772 | | 8.2800 | | 8.2765 |
2004 | | 8.2765 | | 8.2768 | | 8.2771 | | 8.2765 |
2005 | | 8.0702 | | 8.1826 | | 8.2765 | | 8.0702 |
2006 | | 7.8041 | | 7.9723 | | 8.0702 | | 7.8041 |
2007 | | 7.2946 | | 7.5806 | | 7.8127 | | 7.2946 |
December 2007 | | 7.2946 | | 7.3682 | | 7.4120 | | 7.2946 |
January 2008 | | 7.1818 | | 7.2405 | | 7.2946 | | 7.1818 |
February 2008 | | 7.1115 | | 7.1644 | | 7.1973 | | 7.1100 |
March 2008 | | 7.0120 | | 7.0722 | | 7.1110 | | 7.0105 |
April 2008 | | 6.9870 | | 6.9997 | | 7.0185 | | 6.9840 |
May 2008 | | 6.9400 | | 6.9725 | | 7.000 | | 6.9377 |
June 2008 (through June 5, 2008) | | 6.9460 | | 6.9440 | | 6.9633 | | 6.9325 |
| (1) | Annual averages are calculated from month-end rates. Monthly averages are calculated using the average of the daily rates during the relevant period. |
| B. | Capitalization and Indebtedness |
Not Applicable.
| C. | Reasons for the Offer and Use of Proceeds |
Not Applicable.
Risks Related to Our Company and Our Industry
Our limited operating history may not serve as an adequate measure of our future prospects and results of operations.
Our limited operating history may not provide a meaningful basis for evaluating our business, financial performance and prospects. We completed our first solar cell manufacturing line in June 2005 and began commercial shipment of solar cells in August 2005. Relative to the solar power industry as a whole, we have sold only a limited number of solar cells and have recognized limited revenues from sales of our solar cells. In line with the rapid growth of the solar power industry, we have experienced a high growth rate since we began commercial shipment of solar cells. Our net revenues increased from $149.5 million in 2006 to $234.9 million in 2007. We may not be able to achieve similar growth, or any growth, in future periods. In addition, our future success will require us to continue to expand our manufacturing capacity and total output significantly beyond current levels. We may not be able to achieve or maintain satisfactory manufacturing yields or conversion efficiencies, which measure the ability of solar power products to convert sunlight into electricity, following the expansion of our operations. Accordingly, you should not rely on our results of operations for any prior periods as an indication of our future performance. You should consider our business and prospects in light of the risks, expenses and challenges that we face as an early-stage company seeking to develop and manufacture new products in a rapidly evolving market.
6
We have incurred losses in certain periods and may incur losses in the future.
We incurred net losses of $0.3 million and $4.9 million in 2005 and 2007, respectively. We cannot assure you that we will not incur net losses in the future or that there will not be any earnings or revenue declines in any future periods. We expect our costs and expenses to increase as we expand our operations. Our ability to achieve and maintain profitability depends on, among others, the growth rate of the solar power market, the continued global market acceptance of solar power products in general and our existing and future products in particular, our ability to secure quality raw materials, primarily silicon wafers, the pricing trend of solar power products, the competitiveness of our products as well as our ability to provide new products to meet the demands of our customers, our ability to achieve our manufacturing expansion plans and our ability to control our costs and expenses. We may not be able to achieve or sustain profitability on a quarterly or annual basis.
The current industry-wide shortage of silicon raw materials may constrain our revenue growth and decrease our gross margins and profitability.
Polysilicon is an essential raw material in our production of solar cells, and is also used in the semiconductor industry. Polysilicon is created by refining quartz sand. In order to manufacture solar cells, polysilicon is melted and processed into crystalline silicon ingots, which are then sliced into wafers. We primarily purchase wafers from third-party suppliers to manufacture our solar cells. We also procure polysilicon, silicon ingots and other silicon-based raw materials from various suppliers, and outsource the production of silicon wafers from these raw materials under toll manufacturing arrangements with third parties. Toll manufacturing is a type of contract manufacturing frequently used in the solar power industry, in which part of the manufacturing process is outsourced to qualified third parties, or toll manufacturers. The raw materials used by toll manufacturers are usually supplied by the originating company. Sometimes, we also sell polysilicon raw materials to wafer manufacturers and purchase silicon wafers from them under buy-and-sell arrangements. In order to meet a portion of our raw material requirements, we also enter into buy-and-sell arrangements with some of our customers, under which we secure silicon wafers from some of our customers, and sell solar cells to them in return. The procurement costs of silicon wafers and other silicon-based raw materials have accounted for a substantial majority of our cost of revenues since we began our commercial production of solar cells in August 2005. In contrast to some of our vertically integrated competitors that can obtain polysilicon supplies internally below market price, we do not have, and will not in the foreseeable future establish, any polysilicon or wafer manufacturing facilities.
The global supply of polysilicon is controlled by a limited number of producers and there is currently an industry-wide shortage of polysilicon due to the growing demand for solar power products and the continuing expansion of the semiconductor industry. According to Solarbuzz LLC, or Solarbuzz, an independent solar energy research firm, the average long-term supply contract price of polysilicon is expected to increase from $60-$65 per kilogram in 2007 to $65-$75 per kilogram in 2008. In addition, according to Solarbuzz, spot prices for polysilicon were, in some cases, as high as $400 per kilogram in 2007. Increases in the price of polysilicon have resulted in increases in the price of wafers. These increases in the price of silicon raw materials have in the past increased our production costs and may continue to impact our cost of revenues and net income. Partially as a result of such increases, our gross margin decreased significantly from 17.8% in 2006 to 7.7% in 2007. We do not expect that the supply shortage of polysilicon and silicon-based raw materials, including crystalline silicon ingots and silicon wafers, will be remedied in the near term.
Partly as a result of the industry-wide shortage, we have, from time to time, faced a shortage of silicon raw materials and experienced late delivery from suppliers and have had to purchase silicon raw materials of lower quality that have resulted in lower conversion efficiencies and reduced revenues per cell. We may continue to face such shortages, late delivery or lower quality of supply in the future for the following reasons, among others. First, we do not have a history of long-term relationships with silicon or wafer raw material suppliers. Second, many of our competitors, who also purchase silicon raw materials from our suppliers, have had stronger relationships as well as greater bargaining power over the suppliers. Currently we procure a substantial portion of our silicon wafer or other silicon-based raw material supplies under short-term supply contracts. To address the
7
shortage of silicon wafer supplies, we also secure silicon wafers from some of our customers and sell solar cells to them in return. We also seek to forge long-term supply relationships with global and domestic suppliers throughout the supply chain in an effort to secure a cost-effective supply of silicon wafers and silicon-based raw materials. However, we cannot assure you that our procurement efforts will be successful in ensuring an adequate supply of silicon raw materials at commercially viable prices or at satisfactory quality to meet our solar cell production requirements. If we are unable to meet customer demand for our products, or if our products are only available at a higher cost because of a shortage of silicon raw materials, we could lose customers, market share and revenue. This would materially and adversely affect our business, financial condition, results of operations and cash flow.
Our dependence on a limited number of third-party suppliers for key raw materials and customized manufacturing equipment could prevent us from timely delivering our products to our customers in the required quantities, which could result in order cancellations and decreased revenue.
We purchase silicon raw materials, primarily silicon wafers, from a limited number of third-party suppliers. Our top ten suppliers supplied approximately 55.2% of the silicon raw material supplies we procured in 2007, mostly under contracts with a term of less than one year. If we fail to develop or maintain our relationships with our major suppliers, we may be unable to manufacture our products or our products may only be available at a higher cost or after a long delay, and we could be prevented from delivering our products to our customers in the required quantities and at prices that are profitable. Problems of this kind could cause order cancellations and loss of market share. Historically, we encountered problems with respect to the quality of silicon raw material supplied by some of our suppliers, which resulted in lower conversion efficiencies of our solar cells.
Furthermore, some of our suppliers have failed to perform their delivery obligations in the past. For example, one of our suppliers contracted to sell to us 8.3 MW of monocrystalline wafers in 2007, but failed to perform its contractual delivery obligations. In addition, in 2007 we entered into an agreement with a Taiwan-based wafer provider for a supply of approximately 68 MW of silicon wafers for 2007, 2008 and 2009. However, the first delivery under the above agreement has been delayed to July 2008, and we are not sure that the supplier will timely deliver wafers according to the delayed schedule. In 2007, we also had suppliers providing us with substandard quality silicon wafers, which resulted in our cells having lower efficiency, thereby decreasing our production as measured in MW. In April 2008, the Nanjing Intermediate People’s Court issued a judgment in our favor against Wuxi Zhuriyi International Trade Co., Ltd. for its failure to perform its contractual obligations to deliver us silicon raw materials. In addition, we have filed civil litigation with the Nanjing Intermediate People’s Court against Suzhou Shenlong PV Technology Co., Ltd. for its failure to perform its contractual obligations to deliver us silicon wafers. However, many of our contracts do not provide for a remedy for non-delivery beyond a refund of any advance payment that we may have made, and our legal recourse in cases of non-delivery may be limited.
The failure of any major supplier to supply raw materials that meet our quality, quantity and cost requirements in a timely manner could impair our ability to manufacture our products and could increase our costs, particularly if we are unable to obtain these materials and components from alternative sources on a timely basis or on commercially reasonable terms. The pricing terms under our raw material supply framework agreements generally are to be determined based on future negotiations. If we cannot reach agreement on pricing terms with those suppliers in the future, those agreements will not be enforceable and we would then need to seek alternative supplies. In such an event, we may not be able to secure sufficient alternative supplies.
In addition, certain of our manufacturing equipment has been designed and made specifically for us. As a result, such equipment is not readily available from multiple vendors and would be difficult to repair or replace. Any significant damage to, or breakdown of, our customized manufacturing equipment could cause material interruptions to our operations and consequentially could have a material adverse effect on our business and results of operations.
8
We have significant outstanding bank borrowings, and we may not be able to arrange adequate financing when they mature or may encounter other difficulties in maintaining liquidity.
As of December 31, 2007, we had $60.5 million in cash and cash equivalents, and we had $121.8 million in outstanding borrowings, all of which would become due within one year. In the first quarter of 2008, we borrowed additional loans and repaid some of our loans, and all of our current loans will become due within one year of the date of this report. We cannot assure you that we will be able to obtain extensions of these facilities as they mature. In the event we are unable to obtain extensions of these facilities, or if we are unable to obtain sufficient alternative funding on reasonable terms to make repayments, we will have to repay these borrowings with cash generated by our operating activities. We cannot assure you that our business will generate sufficient cash flows from operations to repay these borrowings. In addition, repaying these borrowings with cash generated by our operating activities will divert our financial resources from the requirements of our ongoing operations and future growth. As of the date of this report, we still need additional debt or equity financing of approximately $40 million to finance the remaining cost of our planned expansion of our manufacturing lines, the modification of our existing manufacturing lines and the construction of our Shanghai research facility.
Given the current state of the industry, we generally need to make prepayments to our suppliers of silicon raw materials in advance of shipment. As a result, our purchases of silicon raw materials have required, and we anticipate will continue to require, us to make significant working capital commitments. We will also incur additional capital expenditures for the future expansion and modification of our manufacturing lines . As a result of these requirements, we expect to require additional debt or equity financing. Furthermore, we have granted credit terms for our sales to some of our large customers. Receivables from our top three customers represented approximately 82.1% of our total accounts receivable as of December 31, 2007, and failure to timely collect our receivables may adversely affect our cash flows. If we fail to effectively manage our cash flows from operations, borrowings and equity contributions to support our cash flow requirements, we may encounter difficulty in liquidity, which would have a material adverse effect on our business, financial condition and future prospects.
Our advance payments to most of our silicon raw material suppliers expose us to the credit risk of such suppliers, which may materially and adversely affect our financial condition, results of operations and liquidity.
In order to secure more supply of silicon raw materials, we make advance payments to most of our silicon raw material suppliers, consistent with industry practice. Our advances to suppliers were approximately $79.9 million as of December 31, 2007. We depend on a limited number of suppliers and we make such advance payments without receiving collateral. As a result, our claims for such advance payments would rank only as unsecured claims, exposing us to the credit risks of the suppliers in the event of their insolvency or bankruptcy. We may not be able to recover such advance payments and would suffer losses should the suppliers fail to fulfill their delivery obligations under the contracts. Accordingly, defaults by our suppliers may materially and adversely affect our financial condition, results of operations and liquidity.
Price changes for our silicon raw materials and products due to changes in seasonal demand, unpredictable events such as adverse weather conditions and natural disasters, and other factors, may adversely affect our quarterly operating results from time to time.
The availability of polysilicon, an essential raw material for our production of solar cells, is uncertain, and its price is volatile. Historically our margins and results of operations have been materially adversely affected by the availability and price of polysilicon and other silicon raw materials. The market prices for our products are also subject to fluctuation due to a number of other factors and could decline unexpectedly. For example, the price for solar cells in Germany, which is used throughout our industry as a pricing benchmark, could be adversely affected by changes in the subsidies available for solar power, and price declines in Germany or in any other major market for solar cells could adversely affect our average selling prices. Purchases of solar power products also tend to decrease during the winter months because of adverse weather conditions in certain regions,
9
which complicate the installation of solar power systems. Historically, our results of operations have been affected by such seasonality of industry-wide demand for solar power products. Our quarterly operating results also may fluctuate from period to period due to other factors, including adverse weather conditions and natural disasters. For example, unusually heavy snowstorms in central China in the first quarter of 2008 disrupted our power supply and the transportation of our raw materials and finished products, forcing us to suspend our operations for three weeks. Any of these various factors could negatively affect our production, margins and results of operations and, as a result of these factors, you may not be able to rely on period to period comparisons of our operating results as an indication of our future performance.
The reduction or elimination of government subsidies and economic incentives for on-grid solar energy applications could cause demand for our products and our revenues to decline.
Almost all of our solar cells sold are eventually utilized in the on-grid market, where the solar power systems are connected to the utility grid and generate electricity to feed into the grid. We believe that the near-term growth of the market for on-grid applications depends in large part on the availability and size of government subsidies and economic incentives. The reduction or elimination of subsidies and economic incentives may adversely affect the growth of this market or result in increased price competition, either of which could cause our revenues to decline.
Today, when upfront system costs are factored into cost per kilowatt, the cost of solar power substantially exceeds the cost of power furnished by the electric utility grid in almost all locations. As a result, national and local governmental bodies in many countries, most notably in Germany, Spain, Italy, the United States and China, have provided subsidies and economic incentives in the form of feed-in tariffs, rebates, tax credits and other incentives to distributors, system integrators and manufacturers of solar power products in order to promote the use of solar energy in on-grid applications and to reduce dependence on other forms of energy. These government economic incentives could potentially be reduced or eliminated altogether. For example, Germany has been a strong supporter of solar power products and systems and is a significant market for our customers that engage in solar module manufacturing and system integration businesses. Utilities in Germany are generally obligated to purchase electricity generated from grid-connected solar power systems at defined feed-in tariff rates, which will decline over time according to a predetermined schedule. Specifically, German subsidies decline at a rate of 5.0% to 6.5% per year for systems installed after 2006 based on the type and size of the solar power systems. Political or market changes in Germany could result in significant reductions or eliminations of subsidies or economic incentives, such as a more accelerated reduction of feed-in tariffs than as planned according to the current schedule. Reductions in, or eliminations of, subsidies and economic incentives for on-grid solar energy applications could result in decreased demand for our products and cause our revenues to decline.
If solar power technology is not suitable for widespread adoption, or if sufficient demand for solar power products does not develop or takes longer to develop than we anticipate, our revenues may not continue to increase or may even decline, and we may be unable to achieve or sustain our profitability.
The solar power market is at a relatively early stage of development, and the extent of acceptance of solar power products is uncertain. Historical and current market data on the solar power industry are not as readily available as those for other more established industries where trends can be assessed more reliably from data gathered over a longer period of time. In addition, demand for solar power products may not develop or may develop to a lesser extent than we anticipate. Many factors may affect the viability of widespread adoption of solar power technology and demand for solar power products, including:
| | • | | cost-effectiveness, performance and reliability of solar power products compared to conventional and other renewable energy sources and products; |
| | • | | success of other alternative energy generation technologies, such as wind power, hydroelectric power and biomass; |
10
| | • | | fluctuations in economic and market conditions that affect the viability of conventional and other renewable energy sources, such as increases or decreases in the prices of oil and other fossil fuels or decreases in capital expenditures by end users of solar power products; and |
| | • | | deregulation of the electric power industry and the broader energy industry. |
If solar power technology is not viable for widespread adoption or sufficient demand for solar power products does not develop or develops to a lesser extent than we anticipate, our revenues may suffer and we may be unable to sustain our profitability.
Because the markets in which we compete are highly competitive and many of our competitors have greater resources than we do, we may not be able to compete successfully and we may lose or be unable to gain market share.
The market for solar power products is highly competitive and continually evolving. We expect to face increased competition, which may result in price reductions, reduced margins or loss of market share. Our competitors include solar power divisions of large conglomerates such as BP Solar, Kyocera, Sanyo and Sharp Corporation, as well as specialized cell manufacturers such as Motech Industries Inc., Q-Cells AG, Suntech Power Holdings Co., Ltd., Solarfun Power Holdings Co., Ltd. and JA Solar Holdings Co., Ltd. Some of our competitors, for example Renewable Energy Corporation ASA, have also become vertically integrated, from upstream polysilicon manufacturing to solar system integration. During the current period of silicon supply shortage, their internally produced raw materials may enable them to realize a higher margin in comparison with other solar cell manufacturers. Many of our competitors have a stronger market position than ours and have larger resources and better name recognition than we have. Further, many of our competitors are developing and are currently producing products based on alternative solar power technologies, such as thin-film technologies, which may ultimately have costs similar to, or lower than, our projected costs. There are also other companies planning to enter into the solar cell business. For example, we may face competition from semiconductor manufacturers, a few of which have already announced their intention to start producing solar cells. In addition, the entire solar power industry faces competition from conventional and non-solar renewable energy technologies. Due to the relatively high manufacturing costs compared to most other energy sources, solar energy is generally not competitive without government subsidies and economic incentives.
Many of our existing and potential competitors have substantially greater financial, technical, manufacturing and other resources than we do. Our competitors’ greater size in some cases provides them with a competitive advantage with respect to manufacturing costs due to their economies of scale and their ability to purchase raw materials at lower prices. For example, those of our competitors that also manufacture semiconductors may source both semiconductor grade silicon wafers and solar grade silicon wafers from the same supplier. As a result, such competitors may have stronger bargaining power with the supplier and have an advantage over us in pricing as well as obtaining silicon wafer supplies at times of shortage. Many of our competitors also have more established distribution networks and larger customer bases. In addition, many of our competitors have well-established relationships with our customers and have extensive knowledge of our target markets. As a result, they may be able to devote greater resources to the research, development, promotion and sale of their products or respond more quickly to evolving industry standards and changes in market conditions than we can. It is possible that new competitors or alliances among existing competitors could emerge and rapidly acquire significant market share, which would harm our business. If we fail to compete successfully, our business would suffer and we may lose or be unable to gain market share.
Advances in solar power technology could render our products uncompetitive or obsolete, which could reduce our market share and cause our sales and profit to decline.
The solar power market is characterized by evolving technology standards that require improved features, such as higher conversion efficiencies and higher power output. This requires us to develop new solar power
11
products and enhancements for existing solar power products to keep pace with evolving industry standards and changing customer requirements. For example, currently we are focused on crystalline silicon technology and the expansion of efficient production capacity based on crystalline silicon, which today is the primary technology used by most solar cell manufacturers. Some overseas producers have focused on developing alternative forms of solar power technologies, such as thin-film technologies. Failure to further refine our technology and to develop and introduce new solar power products could cause our products to become uncompetitive or obsolete, which could reduce our market share and cause our revenues to decline. We will need to invest significant financial resources in research and development to maintain our market position, keep pace with technological advances in the solar power industry and effectively compete in the future.
If our future innovations fail to enable us to maintain or improve our competitive position, we may lose market share. If we are unable to successfully design, develop and bring to market competitive new solar power products or enhance our existing solar power products, we may not be able to compete successfully. Competing solar power technologies may result in lower manufacturing costs or higher product performance than those expected from our solar power products. In addition, if we, or our customers, are unable to manage product transitions, our business and results of operations would be negatively affected.
We may not be successful in the commercial production of N-type solar cells, selective emitter cells or other new products, which could limit our growth prospects.
We are currently developing process technologies for manufacturing N-type solar cells. The conversion efficiency rate of N-type solar cells may generally be higher than that of P-type solar cells. But there are substantial technical difficulties in manufacturing N-type solar cells on a large scale, such as the difficulties associated with applying electrical contacts to silicon materials. Therefore, we believe that to date, only a limited number of manufacturers in the world produce N-type solar cells on a commercial scale.
We may face significant challenges in manufacturing N-type solar cells. Minor deviations in the manufacturing process can cause substantial decreases in yield and cell conversion efficiencies and, in some cases, cause production to be suspended or yield no output. In addition, the silicon wafer required for the manufacture of N-type solar cells is different from that used for the manufacture of P-type solar cells. We may face difficulty in securing wafer supply for the manufacture of N-type solar cells. If we are unable to commence manufacturing our N-type solar cells on a timely basis, or if we face technological difficulties in cost-efficiently producing our N-type solar cells with the expected performance on a stable level, or if we are unable to secure sufficient raw material supplies or generate sufficient customer demand for our N-type solar cells, our business and prospects may be adversely impacted.
In addition, we commenced mass commercial production of selective emitter cells, an improved version of the P-type solar cells that we and most other solar cell manufacturers produce, in the fourth quarter of 2007. We also plan to develop passivated emitter and rear cells in the future. However, these products are still new and their stability and performance is still unproven. We may face difficulty in the development and commercial production of selective emitter cells, passivated emitter and rear cells or other new products. We may also have difficulty in converting existing manufacturing lines or installing new manufacturing lines for the production of new products. These difficulties could arise from a number of reasons, including difficulties or delays in obtaining or installing equipment, adapting our production to new processes or training our personnel. We may also have difficulties in achieving the higher conversion efficiencies that we expect to achieve with these new products. Any of these difficulties may adversely affect our business, results of operations and financial condition.
12
Our future success substantially depends on our ability to significantly increase both our manufacturing capacity and total output, which exposes us to a number of risks and uncertainties.
We currently have six solar cell manufacturing lines, and we expect to add another four lines by the end of 2008 to raise our annual production capacity from 192 MW to approximately 320 MW, assuming the use of 156-millimeter monocrystalline silicon wafers. Our future success depends on our ability to significantly increase both our manufacturing capacity and total output. If we are unable to do so, we may be unable to expand our business, decrease our costs per watt, maintain our competitive position and improve our profitability. Our ability to establish additional manufacturing capacity and increase output is subject to significant risks and uncertainties, including:
| | • | | the need to raise significant additional funds, which we may be unable to obtain on commercially viable terms or at all, to purchase raw materials and to build additional manufacturing facilities; |
| | • | | delays and cost overruns as a result of a number of factors, many of which are beyond our control, such as increases in the price of silicon raw materials and problems with equipment vendors; |
| | • | | delays or denial of required approvals by relevant government authorities; |
| | • | | diversion of significant management attention; and |
| | • | | the ability to secure sufficient silicon raw materials, primarily silicon wafers, to support our expanded manufacturing capacity. |
If we are unable to establish or successfully operate additional manufacturing capacity, or if we encounter any of the risks described above, we may be unable to expand our business as planned. Moreover, we cannot assure you that if we do expand our manufacturing capacity as planned, we will be able to generate sufficient customer demand for our solar power products to support our increased production levels.
We may experience difficulty in achieving acceptable yields and product performance as a result of manufacturing problems, which could negatively impact our future revenue.
The technology for the manufacture of solar cells is highly complex and is continually being modified in an effort to improve yields and product performance. The quality of the raw materials used, microscopic impurities such as dust and other contaminants, difficulties in the manufacturing process, or malfunctions of the equipment or facilities used can lower yields, cause quality control problems, interrupt production or result in losses of products in process.
Because our existing manufacturing capabilities are, and our future manufacturing capabilities will likely remain, concentrated in our manufacturing facilities in Nanjing, China, any problem in our facilities may limit our ability to manufacture products. We may encounter problems in our manufacturing facilities as a result of, among other things, production failures, construction delays, human errors, equipment malfunction or process contamination, which could seriously harm our operations. We may also experience floods, droughts, power losses and similar events beyond our control that would affect our facilities. For example, the unusually heavy snowstorms in the first quarter of 2008 disrupted our power supply and forced us to suspend our manufacturing operations for three weeks. Any disruption in our manufacturing process that forces us to shut down and restart our production causes a drop-off in production quality during the first two or three weeks after we resume production, which in turn reduces our yield as more of our output falls below our quality control standards during that period.
Our business depends substantially on the continuing efforts of our executive officers and key employees, and our business may be severely disrupted if we lose their services.
Our future success depends substantially on the continued services of our executive officers and key employees, especially Mr. Tingxiu Lu, our chairman, Dr. Jianhua Zhao, our vice chairman and chief technology officer, Mr. Ruennsheng Allen Wang, our chief executive officer, Mr. Kenneth Luk, our chief financial officer, and Dr. Aihua Wang, our vice president. If one or more of our executive officers or key employees were unable or unwilling to continue in their present positions, we might not be able to replace them easily, timely, or at all. For example, after our previous chief financial officer James Shaofeng Qi resigned in August 2007, approximately four months elapsed before Mr. Kenneth Luk, our current chief financial officer, joined us in December 2007. If we lose the services of our executive officers or key employees, especially if we cannot
13
timely find replacements, our business may be severely disrupted, our financial conditions and results of operations may be materially and adversely affected and we may incur additional expenses to recruit, train and retain personnel. If any of our executive officers or key employees joins a competitor or forms a competing company, we may lose customers, suppliers, know-how and key professionals and staff members. Each of our executive officers and key employees has entered into an employment agreement with us which contains non-competition provisions. However, if any dispute arises between our executive officers or our key employees and us, these agreements may not be enforceable in China, where these executive officers or our key employees reside, in light of the uncertainties with China’s legal system. See “—Risks Related to Doing Business in China—Uncertainties with respect to the Chinese legal system could have a material adverse effect on us.”
Our costs and expenses may be greater than those of our competitors if we enter into fixed-price, prepaid arrangements with our suppliers.
Historically we have secured a portion of our supply of silicon raw materials through fixed-price, prepaid supply arrangements with domestic suppliers. We may enter into such fixed-price supply contracts in the future. If we enter into such contracts, our cost of revenues may be greater than that of our competitors if the price of silicon raw materials decreases in the future. Additionally, if demand for our solar cells decreases, we may incur costs associated with carrying excess inventory, which may have a material adverse effect on our cash flows. To the extent we would not be able to pass these increased costs and expenses on to our customers, our business, results of operations and financial condition may be materially and adversely affected.
Our dependence on a limited number of customers may cause significant fluctuations or declines in our revenues.
We currently sell a substantial portion of our solar cells to a limited number of customers. Our top three customers contributed over 48.1% of our net revenues in 2007. Sales to our top five customers accounted for 56.9% of our net revenues during the same period. Sales to each of Wuxi Guofei Green Energy Source Co., Ltd. and aleo solar AG contributed over 10% of our net revenues for the year ended December 31, 2007.
Sales to our customers are typically made through non-exclusive arrangements. We anticipate that our dependence on a limited number of customers will continue in the foreseeable future. Consequently, any one of the following events may cause material fluctuations or declines in our revenues:
| | • | | reduction, delay or cancellation of orders from one or more of our significant customers; |
| | • | | loss of one or more of our significant customers and our failure to identify additional or replacement customers; and |
| | • | | failure of any of our significant customers to make timely payment for our products. |
If we fail to manage our growth and expansion effectively, our business may be adversely affected.
We have experienced a period of rapid growth and expansion that has placed, and continues to place, significant strain on our management personnel, systems and resources. To accommodate our growth, we anticipate that we will need to implement a variety of new and upgraded operational and financial systems, procedures and controls, including improvements to our accounting and other internal management systems, all of which require substantial management efforts. We also will need to continue to expand, train, manage and motivate our workforce, manage our customer relationships and manage our relationships with raw material suppliers. All of these endeavors will require substantial management effort and skill and the incurrence of additional expenditures. If we fail to manage our growth effectively, that failure may have a material adverse effect on our business.
Future acquisitions may have an adverse effect on our ability to manage our business.
If we are presented with appropriate opportunities, we may acquire technologies, businesses or assets that are complementary to our business. Future acquisitions would expose us to potential risks, including risks
14
associated with the assimilation of new personnel, unforeseen or hidden liabilities, the diversion of management attention and resources from our existing business and the inability to generate sufficient revenues to offset the costs and expenses of acquisitions. Any difficulties encountered in the acquisition and integration process may have an adverse effect on our ability to manage our business.
We face risks associated with the marketing, distribution and sale of our solar power products internationally, and if we are unable to effectively manage these risks, they could impair our ability to expand our business abroad.
In 2007, we sold approximately 35.7% of our products to customers outside of China. We intend to continue to expand our sales in Europe as well as in other overseas markets such as the United States, Korea and other Asian countries and regions. The marketing, distribution and sale of our solar power products in the international markets expose us to a number of risks, including:
| | • | | fluctuations in currency exchange rates; |
| | • | | increased costs associated with maintaining marketing efforts in various countries; |
| | • | | difficulty and costs relating to compliance with the different commercial and legal requirements of the overseas markets in which we offer our products; |
| | • | | difficulty in engaging and retaining sales personnel who are knowledgeable about, and can function effectively in, overseas markets; and |
| | • | | trade barriers such as export requirements, tariffs, taxes and other restrictions and expenses, which could increase the prices of our products and make us less competitive in some countries. |
If we are unable to attract, train and retain qualified personnel, our business may be materially and adversely affected.
Our future success depends, to a significant extent, on our ability to attract, train and retain qualified personnel, particularly technical personnel with expertise in the solar power industry. Since our industry is characterized by high demand and intense competition for talent, there can be no assurance that we will be able to attract or retain the qualified technical staff or other highly-skilled employees that we will need to achieve our strategic objectives. As we are still a relatively young company and our business has grown rapidly, our ability to train and integrate new employees into our operations may not meet the growing demands of our business. If we are unable to attract and retain qualified personnel, our business may be materially and adversely affected.
We may be exposed to infringement or misappropriation claims by third parties, which, if determined adversely to us, could cause us to pay significant damage awards.
Our success depends largely on our ability to use and develop our technology and know-how without infringing the intellectual property rights of third parties. The validity and scope of claims relating to solar power technology patents involve complex scientific, legal and factual questions and analysis and, therefore, may be highly uncertain. We may be subject to litigation involving claims of patent infringement or violation of other intellectual property rights of third parties. The defense and prosecution of intellectual property suits, patent opposition proceedings and related legal and administrative proceedings can be both costly and time-consuming and may significantly divert the efforts and resources of our technical and management personnel. An adverse determination in any such litigation or proceedings to which we may become a party could subject us to significant liability to third parties, require us to seek licenses from third parties, to pay ongoing royalties, or to redesign our products, or subject us to injunctions prohibiting the manufacture and sale of our products or the use of our technologies. Protracted litigation could also result in our customers or potential customers deferring or limiting their purchase or use of our products until resolution of such litigation.
Failure to protect our intellectual property rights may undermine our competitive position, and litigation to protect our intellectual property rights may be costly.
We rely primarily on trade secrets, patent laws and other contractual restrictions to protect our intellectual property. Nevertheless, these afford only limited protection, and the actions we take to protect our intellectual property rights may not be adequate to provide us with meaningful protection or commercial advantage. For example, we have three patents and two pending patent applications in China. We cannot assure you that in a
15
legal proceeding the claims of our patents would be found valid or that the claims would be interpreted as having sufficient scope to protect the technology we consider important to our business, nor can we assure you that our patent applications will eventually issue with claims of sufficient scope to protect additional technology significant to our business. As a result, we may be unable to exclude third parties from using the technologies that we have developed and compete with us, which could have a material adverse effect on our business, financial condition or operating results.
Furthermore, we have granted NewSouth Innovations Pty Limited, or NewSouth Innovations, a non-exclusive, royalty-free license to use the technology for manufacturing N-type solar cells covered in one of our patents in China for internal research purposes, and a right to commercially utilize or sublicense such technology after March 1, 2009, provided that they may not sublicense such technology to certain of our Chinese competitors until after March 1, 2010. As a result, we may not be able to block our competitors from using the technology covered by this patent after March 1, 2010, which could have a material adverse effect on our business, financial condition or operating results.
In addition, litigation may be necessary to enforce our intellectual property rights. We cannot assure you that the outcome of such potential litigation will be in our favor. Such litigation may be costly and may divert management attention as well as divert other resources away from our business. In addition, we have no insurance coverage against litigation costs and would have to bear all costs arising from such litigation to the extent we are unable to recover them from other parties. The occurrence of any of the foregoing could have a material adverse effect on our business, results of operations and financial condition.
Changes to existing regulations and policies may present technical, regulatory and economic barriers to the purchase and use of solar power products, which may significantly reduce demand for our products.
The market for electricity generation products is heavily influenced by government regulations and policies concerning the electric utility industry, as well as policies adopted by electric utilities. These regulations and policies often relate to electricity pricing and technical requirements regarding the interconnection between customer-owned electricity generation and the grid. In a number of countries, these regulations and policies are being modified and may continue to be modified. Customer purchases of, or further investment in the research and development of, alternative energy sources, including solar power technology, could be deterred by these regulations and policies, which could result in a significant reduction in the potential demand for our products. For example, without a regulatory mandated exception for solar power systems, utility customers are often charged interconnection or standby fees for putting distributed power generation on the electric utility grid. These fees could increase the cost to customers of using our solar power products and make them less desirable, thereby harming our business, prospects, results of operations and financial condition.
We anticipate that our products and their installation will be subject to oversight and regulation in accordance with national and local regulations relating to building codes, safety, environmental protection, utility interconnection and metering and related matters. It is difficult to track the requirements of individual jurisdictions and to design products that comply with the varying standards. Any new government regulations or utility policies pertaining to our solar power products may result in significant additional expenses to us or cause a significant reduction in demand for our solar power products.
Fluctuations in exchange rates could adversely affect our business.
A major portion of our sales is denominated in Renminbi and Euros, with the remainder in U.S. dollars, while a substantial portion of our costs and expenses is denominated in Renminbi and U.S. dollars, with the remainder in Euros. Fluctuations in exchange rates, particularly among the U.S. dollar, Renminbi and Euro, could affect our net profit margins and could result in foreign exchange losses and operating losses.
We had net foreign exchange losses of $1.3 million and $1.2 million in 2006 and 2007, respectively. We cannot predict the impact of future exchange rate fluctuations on our results of operations and may incur net foreign exchange losses in the future.
16
Compliance with environmental regulations can be expensive, and noncompliance with these regulations may result in adverse publicity and potentially significant monetary damages and fines.
As our manufacturing processes generate noise, waste water, gases and other industrial wastes, we are required to comply with all national and local regulations regarding protection of the environment. We believe we are in material compliance with present environmental protection requirements and have all necessary environmental permits to conduct our business. However, if more stringent regulations are adopted in the future, the costs of compliance with such new regulations could be substantial. We believe that we have all of the permits necessary to conduct our business as it is presently conducted. If we fail to comply with present or future environmental regulations, however, we may be required to pay substantial fines, suspend production or cease operations. We use, generate and discharge toxic, volatile and otherwise hazardous chemicals and wastes in our research and development and manufacturing activities. Any failure by us to control the use of, or to restrict adequately the discharge of, hazardous substances could subject us to potentially significant monetary damages and fines or suspensions in our business operations.
We have limited insurance coverage and may incur losses resulting from product liability claims or business interruptions.
As the insurance industry in China is still in an early stage of development, product liability insurance and business interruption insurance available in China offer limited coverage compared to that offered in many other countries. We do not have any product liability insurance or business interruption insurance. As with other solar power product manufacturers, we are exposed to risks associated with product liability claims if the use of our solar power products results in injury. Since our products generate electricity, it is possible that users could be injured or killed by our products as a result of product malfunctions, defects, improper installation or other causes. We only began commercial shipment of our solar power products in August 2005, and, because of our limited operating history, we cannot predict whether product liability claims will be brought against us in the future or the effect of any resulting negative publicity on our business. The successful assertion of product liability claims against us could result in potentially significant monetary damages and require us to make significant payments. In addition, any business disruption or natural disaster could result in substantial costs and a diversion of resources, which would have an adverse effect on our business and results of operation.
Problems with product quality or product performance may cause us to incur warranty expenses and may damage our market reputation and prevent us from achieving increased sales and market share.
Our products may contain defects that are not detected until after they are sold or are installed because we cannot test for all possible scenarios. Historically, some of our sales contracts with overseas customers provided for a 10-year warranty for the performance of our solar cells, and in some cases, our solar cells were sold with up to a 20-year warranty. In 2007, we sold 1.6 MW of solar modules, in most cases with a two-year warranty for defects in material and workmanship and a minimum power output warranty of up to 25 years following the date of purchase. As a result, we bear the risk of extensive warranty claims long after we have sold our products and recognized revenues. We have sold solar cells only since August 2005. Due to the short usage history of our products, we cannot assure you that our assumptions regarding the durability and reliability of our products are reasonable. Our warranty provisions may be inadequate, and we may have to incur substantial expense to repair or replace defective products in the future. Any increase in the defect rate of our products would cause us to increase the amount of our warranty reserves and have a correspondingly negative impact on our operating results. Furthermore, widespread product failures may damage our market reputation, reduce our market share and cause our sales to decline.
There have been historical deficiencies with our internal controls and there remain areas of our internal and disclosure controls that require improvement. If we fail to maintain an effective system of internal controls, we may be unable to accurately report our financial results or prevent fraud, and investor confidence and the market price of our common shares may, therefore, be adversely impacted.
We are subject to reporting obligations under the U.S. securities laws. Beginning with our annual report on Form 20-F for the fiscal year ending December 31, 2008, we will be required to prepare a management report on our internal controls over financial reporting containing our management’s assessment of the effectiveness of our internal controls over financial reporting. In addition, our independent registered public accounting firm must
17
attest to and report on the effectiveness of our internal controls over financial reporting. Our management may conclude that our internal controls over our financial reporting are not effective. Moreover, even if our management concludes that our internal control over financial reporting is effective, our independent registered public accounting firm may still issue an adverse report on the effectiveness of our internal control over financial reporting or may issue a report that is qualified if it is not satisfied with our controls or the level at which our controls are documented, designed, operated or reviewed, or if it interprets the relevant requirements differently from us. Our reporting obligations as a public company will place a significant strain on our management, operational and financial resources and systems for the foreseeable future.
During the audits of our financial statements as of and for the years ended December 31, 2004, 2005 and 2006, we and our independent registered public accounting firm identified certain deficiencies in our internal controls, including a material weakness and a number of significant deficiencies, as then defined in the applicable rules of the Public Company Accounting Oversight Board. The material weakness was insufficient resources in our accounting department to properly identify adjustments, analyze transactions and prepare financial statements in accordance with U.S. GAAP. Significant deficiencies included issues relating to segregation of duties, reconciliations between sub-ledger and the general ledger, management of inventory and fixed assets, recording of construction-in-progress, salary expense recording, and transaction balance reconciliations. In addition, our independent registered public accounting firm identified a treasury and cash flow planning deficiency. These deficiencies could adversely affect our ability to record, process, summarize and report financial data consistent with the assertions of management in the financial statements and could negatively affect our ability to comply with the requirements of U.S. GAAP. In connection with the audit of our financial statements as of and for the year ended December 31, 2007, we and our independent registered public accounting firm identified several significant deficiencies in connection with access control on important transactions in our enterprise resource planning, or ERP, system, our management of inventory and fixed assets, bad debt provision and ERP software application development.
It is important to note that neither we nor our independent registered public accounting firm undertook a comprehensive assessment of our internal controls for purposes of identifying and reporting deficiencies in our internal control over financial reporting, as we and they will be required to do beginning with our annual report on Form 20-F for the fiscal year ending December 31, 2008. We believe it is possible that, had we performed a formal assessment of our internal control over financial reporting or had our independent registered public accounting firm performed an audit of our internal control over financial reporting, additional deficiencies may have been identified.
We have undertaken remedial steps and plan to continue to take additional remedial steps to improve our internal control over financial reporting and our disclosure controls. However, the implementation of these measures may not fully address these deficiencies in our internal control over financial reporting, and we cannot yet conclude that they have been fully remedied. If we are unable to implement solutions to deficiencies in our existing internal control over financial reporting and our disclosure controls and procedures, or if we fail to maintain an effective system of internal control over financial reporting and an effective system of disclosure controls in the future, we may be unable to accurately report our financial results or prevent fraud, and as a result, investor confidence and the market price of our ADSs may be adversely impacted.
Our chairman has substantial influence over our company, and his interests may not be aligned with the interests of our other shareholders.
Mr. Tingxiu Lu, our chairman, currently beneficially owns 16.5% of our outstanding share capital. Further, most of our bank borrowings are guaranteed by China Electric Equipment Group Co., Ltd., or CEEG, an entity controlled by Mr. Lu. CEEG recently agreed to guarantee the bank borrowings of Sunergy Nanjing for up to RMB1 billion until May 2010, subject to adjustment in the event of a material change in CEEG’s credit or operational status. Mr. Lu has substantial influence over our business, including decisions regarding mergers, consolidations
18
and the sale of all or substantially all of our assets, election of directors and other significant corporate actions. This concentration of ownership may discourage, delay or prevent a change in control of our company, which could deprive our shareholders of an opportunity to receive a premium for their shares as part of a sale of our company and might reduce the price of our ADSs. These actions may be taken even if they are opposed by our other shareholders and holders of our ADSs, including those who purchased our ADSs in our initial public offering.
We have been named as defendant in connection with securities class action lawsuits, which, if determined adversely, could negatively affect our business and results of operations.
We and several of our directors and officers were named defendants in three purported class actions currently pending in the United States District Court for the Southern District of New York—Brown v. China Sunergy Co., Ltd. et al., Case No. 07-CV-07895 (DAB), Sheshtawy v. China Sunergy Co., Ltd. et al., Case No. 07-CV-08656 (DAB), and Giombetti v. China Sunergy Co., Ltd. et al., Case No. 07-CV-09689 (DAB). The plaintiffs in these cases allege that we made false and misleading statements in our registration statement and prospectus in connection with our initial public offering in May 2007 regarding, among other things, the procurement of polysilicon and seek unspecified damages. Although we intend to vigorously defend against the class actions, it is time-consuming and costly and could divert the attention of our senior management. An unfavorable resolution of these lawsuits or any future lawsuits could materially and adversely affect our results of operations and financial condition. See Item 8, “Financial Information—Legal Proceedings.”
Risks Related to Doing Business in China
Adverse changes in political and economic policies of the PRC government could have a material adverse effect on the overall economic growth of China, which could reduce the demand for our products and materially and adversely affect our competitive position.
All of our business operations are conducted in China and a majority of our sales are made in China. Accordingly, our business, financial condition, results of operations and prospects are affected significantly by economic, political and legal developments in China. The Chinese economy differs from the economies of most developed countries in many respects, including:
| | • | | the amount of government involvement; |
| | • | | the level of development; |
| | • | | the control of foreign exchange; and |
| | • | | the allocation of resources. |
While the Chinese economy has grown significantly in the past 20 years, the growth has been uneven, both geographically and among various sectors of the economy. The PRC government has implemented various measures to encourage or control economic growth and guide the allocation of resources. Some of these measures benefit the overall Chinese economy, but may also have a negative effect on us. For example, our financial condition and results of operations may be adversely affected by government control over capital investments or changes in tax regulations that are applicable to us.
The Chinese economy has been transitioning from a planned economy to a more market-oriented economy. Although in recent years the PRC government has implemented measures emphasizing the utilization of market forces for economic reform, the reduction of state ownership of productive assets and the establishment of sound corporate governance in business enterprises, a substantial portion of the productive assets in China is still owned by the PRC government. The continued control of these assets and other aspects of the national economy by the PRC government could materially and adversely affect our business. The PRC government also exercises
19
significant control over Chinese economic growth through the allocation of resources, controlling payment of foreign currency-denominated obligations, setting monetary policy and providing preferential treatment to particular industries or companies. Efforts by the PRC government to slow the pace of growth of the Chinese economy could result in decreased capital expenditures by solar energy users, which in turn could reduce demand for our products.
Uncertainties with respect to the Chinese legal system could have a material adverse effect on us.
We conduct substantially all of our manufacturing operations through our wholly owned subsidiary, China Sunergy (Nanjing) Co., Ltd., or Sunergy Nanjing, previously named CEEG (Nanjing) PV-Tech Co., Ltd., a limited liability company established in China. Sunergy Nanjing is generally subject to laws and regulations applicable to foreign investment in China and, in particular, laws applicable to wholly foreign-owned enterprises. The PRC legal system is based on written statutes. Prior court decisions may be cited for reference but have limited precedential value. Since 1979, PRC legislation and regulations have significantly enhanced the protections afforded to various forms of foreign investments in China. However, since these laws and regulations have not been fully developed and the PRC legal system continues to rapidly evolve, the interpretations of many laws, regulations and rules are not always uniform and enforcement of these laws, regulations and rules involves uncertainties. We cannot predict the effect of future developments in the PRC legal system, including the promulgation of new laws, changes to existing laws or the interpretation or enforcement thereof, the preemption of local regulations by national laws, or the overturn of local government’s decisions by the superior government. These uncertainties may limit legal protections available to us. In addition, any litigation in China may be protracted and result in substantial costs and diversion of resources and management attention.
We rely on dividends paid by our subsidiary for our cash needs.
We conduct substantially all of our operations through Sunergy Nanjing. We rely on dividends paid by Sunergy Nanjing for our cash needs, including the funds necessary to pay dividends and other cash distributions to our shareholders, to service any debt we may incur and to pay our operating expenses. The payment of dividends by entities organized in China is subject to limitations. Regulations in the PRC currently permit payment of dividends only out of accumulated profits as determined in accordance with accounting standards and regulations in China. Sunergy Nanjing is also required to set aside at least 10% of its after-tax profit based on PRC accounting standards each year to its general reserves until the accumulative amount of such reserves reaches 50% of its registered capital. These reserves are not distributable as cash dividends. Sunergy Nanjing is also required to allocate a portion of its after-tax profits, as determined by its board of directors, to its staff welfare and bonus funds, which may not be distributed to equity owners. In addition, if Sunergy Nanjing incurs debt on its own behalf in the future, the instruments governing the debt may restrict its ability to pay dividends or make other distributions to us.
Furthermore, the dividends we receive from our PRC subsidiary may also be adversely affected by the new PRC Enterprise Income Tax Law, or the New EIT Law, and its Implementing Regulation, which became effective on January 1, 2008. See “—Our global income and the dividends we receive from our PRC subsidiary may be subject to PRC tax under the New EIT Law, which would have a material adverse effect on our results of operations.”
Our global income and the dividends we receive from our PRC subsidiary may be subject to PRC tax under the New EIT Law, which would have a material adverse effect on our results of operations.
Under the New EIT Law and its Implementing Regulation, which have become effective on January 1, 2008, an enterprise established outside of the PRC with “de facto management bodies” within the PRC is considered a resident enterprise and will be subject to a 25% PRC income tax on its global income. The implementation rules define the term “de facto management bodies” as “establishments that carry out substantial and overall management and control over the manufacturing and business operations, personnel, accounting, properties, etc. of an enterprise.” Accordingly, we may be considered a resident enterprise and may therefore be
20
subject to a 25% PRC income tax on our global income. If we are considered a resident enterprise and earn income other than dividends from our PRC subsidiary, such 25% PRC income tax on our global income could significantly increase our tax burden and materially and adversely affect our cash flow and profitability.
Under the applicable PRC tax laws in effect before January 1, 2008, dividend payments to foreign investors made by foreign-invested enterprises such as our PRC subsidiary, Sunergy Nanjing, were exempt from PRC withholding tax. Pursuant to the New EIT Law and its Implementing Regulation, however, dividends generated after January 1, 2008 and payable by a foreign-invested enterprise to its foreign investors will be subject to a 10% withholding tax if the foreign investors are considered as non-resident enterprises without any establishment or place within China or if the dividends payable have no connection with the establishment or place of the foreign investors within China, unless any such foreign investor’s jurisdiction of incorporation has a tax treaty with China that provides for a reduced withholding arrangement. The Cayman Islands, where we are incorporated, does not have such a tax treaty with China. China Sunergy (Hong Kong) Co., Ltd., or Sunergy Hong Kong, the direct holder of the 100% equity interest in Sunergy Nanjing, is incorporated in Hong Kong. According to the Mainland and Hong Kong Special Administrative Region Arrangement on Avoiding Double Taxation or Evasion of Taxation on Income agreed between China and Hong Kong in August 2006, dividends paid by a foreign-invested enterprise in China to its direct holding company in Hong Kong will be subject to withholding tax at a rate of no more than 5% (if the foreign investor owns directly at least 25% of the shares of the foreign-invested enterprise). Under the Implementing Regulation of the New EIT Law, if we and Sunergy Hong Kong were regarded as resident enterprises, the dividends payable to us from Sunergy Nanjing would be exempt from the PRC income tax. If we were regarded as a non-resident enterprise and Sunergy Hong Kong were regarded as a resident enterprise, then Sunergy Hong Kong would be required to withhold a 10% withholding tax on any dividends payable to us, while if Sunergy Hong Kong is regarded as a non-resident enterprise, then Sunergy Nanjing would be required to withhold a 5% withholding tax on any dividends payable to Sunergy Hong Kong. In either case, the amount of funds available to us to meet our cash requirements, including the payment of dividends to our shareholders and debt service on any debt we incur, could be materially reduced.
In addition, because there remains uncertainty regarding the interpretation and implementation of the concept of “place of effective management,” if we are regarded as a PRC resident enterprise, under the New EIT Law any dividends to be distributed by us to our non-PRC shareholders will be subject to a withholding tax. We also cannot assure you that any gain realized by non-PRC shareholders or holders of our ADSs from the transfer of our shares or ADSs will not be subject to a withholding tax. Unless there are further rules announced by the Chinese tax authorities, we are required under the New EIT Law to withhold PRC income tax on our dividends payable to our non-PRC shareholders, or any gain realized by our non-PRC shareholders or holders of ADSs from transfer of the shares or ADSs, and your investment in our ADSs may be materially and adversely affected.
Fluctuation in the value of the Renminbi may have a material adverse effect on your investment.
The change in value of the Renminbi against the U.S. dollar, Euro and other currencies is affected by, among other things, changes in China’s political and economic conditions. On July 21, 2005, the PRC government changed its decade-old policy of pegging the value of the Renminbi to the U.S. dollar. Under the new policy, the Renminbi is permitted to fluctuate within a narrow and managed band against a basket of certain foreign currencies. This change in policy has resulted in an approximately 19.2% appreciation of the Renminbi against the U.S. dollar between July 21, 2005 and June 5, 2008. While the international reaction to the Renminbi revaluation has generally been positive, there remains significant international pressure on the PRC government to adopt an even more flexible currency policy, which could result in a further and more significant appreciation of the Renminbi against the U.S. dollar. As a portion of our costs and expenses is denominated in Renminbi, the revaluation in July 2005 and potential future revaluation has increased and could further increase our costs in U.S. dollar terms. For example, to the extent that we need to convert U.S. dollars into Renminbi for our operations, appreciation of the Renminbi against the U.S. dollar would have an adverse effect on the Renminbi amount we receive from the conversion. Conversely, if we decide to convert our Renminbi into U.S. dollars for the purpose of making payments for
21
dividends on our shares or ADSs or for other business purposes, appreciation of the U.S. dollar against the Renminbi would have a negative effect on the U.S. dollar amount available to us.
Restrictions on currency exchange may limit our ability to receive and use our revenues or financing effectively.
Certain portions of our revenues and expenses are denominated in Renminbi. If our revenues denominated in Renminbi increase or expenses denominated in Renminbi decrease in the future, we may need to convert a portion of our revenues into other currencies to meet our foreign currency obligations, including, among others, payment of dividends declared, if any, in respect of our ordinary shares or ADSs. Under China’s existing foreign exchange regulations, Sunergy Nanjing is able to pay dividends in foreign currencies, without prior approval from the State Administration of Foreign Exchange, or SAFE, by complying with certain procedural requirements. However, we cannot assure you that the PRC government will not take further measures in the future to restrict access to foreign currencies for current account transactions.
Foreign exchange transactions by Sunergy Nanjing under capital accounts continue to be subject to significant foreign exchange controls and require the approval of, or registration with, PRC governmental authorities. In particular, if Sunergy Nanjing borrows foreign currency loans from us or other foreign lenders, these loans must be registered with the SAFE, and if we finance Sunergy Nanjing by means of additional capital contributions, these capital contributions must be approved or registered by certain government authorities including the SAFE, the Ministry of Commerce or their local counterparts. These limitations could affect the ability of Sunergy Nanjing to obtain foreign exchange through debt or equity financing, and could affect our business and financial condition.
Our business benefits from certain PRC preferential tax treatments. Expiration of, or changes to, these incentives could have a material adverse effect on our operating results.
The PRC government has provided various incentives to foreign-invested enterprises. Because Sunergy Nanjing is a foreign-invested enterprise engaged in manufacturing businesses and located in Nanjing, which is within a coastal economic zone, it was entitled to a preferential enterprise income tax rate of 24% prior to January 1, 2008. As a foreign-invested enterprise engaged in manufacturing businesses, Sunergy Nanjing was also entitled to a two-year exemption from the enterprise income tax for its first two profitable years of operation and to a 50% reduction of its applicable income tax rate for the succeeding three years. On March 16, 2007, the National People’s Congress of China, or the Congress, enacted the New EIT Law, under which foreign invested enterprises and domestic companies would be subject to enterprise income tax at a uniform rate of 25%. The New EIT Law also provides for transitional measures for enterprises established prior to the promulgation of the New EIT Law and eligible for lower tax rate preferential treatment in accordance with the then-prevailing tax laws and administrative regulations. These enterprises will gradually become subject to the unified tax rate over a five-year transitional period from January 1, 2008 (enterprises which were subject to enterprise income tax rate of 24% before January 1, 2008 are subject to enterprise income tax of 25% from January 1, 2008); enterprises eligible for regular tax reductions or exemptions may continue to enjoy tax preferential treatments after the implementation of the New EIT Law and until their preferential treatments expire. If the preferential tax rate currently enjoyed by us is not available after the expiration of the preferential tax treatment period, or the preferential tax rate is modified or revoked, our financial condition and results of operations may be adversely affected. In addition, our historical operating results may not be indicative of our operating results for future periods as a result of the expiration of the preferential tax treatment we enjoy.
Our failure to obtain the prior approval of the China Securities Regulatory Commission, or the CSRC, of the listing and trading of our ADSs on the Nasdaq Global Market could have a material adverse effect on our business, operating results, reputation and trading price of our ADSs.
On August 8, 2006, six PRC regulatory agencies, including CSRC, promulgated the Regulation on Mergers and Acquisitions of Domestic Companies by Foreign Investors, which became effective on September 8, 2006.
22
This regulation, among other things, has certain provisions that purport to require offshore special purpose vehicles, or SPVs, formed for the purpose of acquiring PRC domestic companies and controlled by PRC individuals, to obtain the approval of the CSRC prior to listing their securities on an overseas stock exchange. The application of this PRC regulation remains unclear with no consensus currently existing among the leading PRC law firms regarding the scope and applicability of the CSRC approval requirement. On September 21, 2006, the CSRC published on its official website a notice specifying the documents and materials that are required to be submitted for obtaining CSRC approval. We believe, based on the advice of our PRC counsel, Jun He Law Offices, that although the CSRC generally has jurisdiction over overseas listing of SPVs like us, it was not necessary for us to obtain CSRC approval for our initial public offering given the fact that we had legally completed the acquisition of all the equity interest in Sunergy Nanjing before the new regulation became effective. Uncertainty as to how this regulation will be interpreted or implemented still remains. If the CSRC or another PRC regulatory agency subsequently determines that the CSRC’s approval was required for our initial public offering, we may face sanctions by the CSRC or another PRC regulatory agency. If this happens, these regulatory agencies may impose fines and penalties on our operations in the PRC, limit our operating privileges in the PRC, delay or restrict the repatriation of the proceeds from our initial public offering into the PRC, restrict or prohibit payment or remittance of dividends by Sunergy Nanjing, or take other actions that could have a material adverse effect on our business, financial condition, results of operations, reputation and prospects, as well as the trading price of our ADSs. Also, if later the CSRC requires that we obtain its approval, we may be unable to obtain a waiver of the CSRC approval requirements, if and when procedures are established to obtain such a waiver. Any uncertainties and/or negative publicity regarding this CSRC approval requirement could have a material adverse effect on the trading price of our ADSs.
Regulations relating to offshore investment activities by PRC residents may limit our ability to inject capital into our PRC subsidiary, limit our subsidiary’s ability to distribute profits to us, or otherwise adversely affect us.
In October 2005, SAFE issued a regulation entitled “Circular on several issues concerning foreign exchange regulation of corporate finance and roundtrip investments by PRC residents through special purpose companies incorporated overseas,” or Circular No. 75. Circular No. 75 states that if PRC residents use assets or equity interests in their PRC entities as capital contributions to establish offshore companies or inject assets or equity interests of their PRC entities into offshore companies to raise capital overseas, they must register with local SAFE branches with respect to their overseas investments in offshore companies and must also file amendments to their registrations if their offshore companies experience material events involving capital variation, such as changes in share capital, share transfers, mergers and acquisitions, spin-off transactions, long-term equity or debt investments or uses of assets in China to guarantee offshore obligations. Under Circular No. 75, failure to comply with the registration procedures set forth in such regulation may result in restrictions being imposed on the foreign exchange activities of the relevant PRC entity, including the payment of dividends and other distributions to its offshore parent, as well as restrictions on the capital inflow from the offshore entity to the PRC entity. While we believe our shareholders have complied with existing SAFE registration procedures, any future failure by any of our shareholders who is a PRC resident or controlled by a PRC resident to comply with relevant requirements under Circular No. 75 could subject our company to fines or sanctions imposed by the PRC government, including restrictions on Sunergy Nanjing’s ability to pay dividends or make distributions to us and our ability to increase our investment in or provide loans to Sunergy Nanjing.
All participants of our existing equity compensation plan who are PRC citizens may be required to register with the SAFE. We may also face regulatory uncertainties that could restrict our ability to adopt additional equity compensation plans for our directors and employees and other parties under PRC law.
On February 1, 2007, the Implementing Regulation of the Administration Measures for Individual Foreign Exchange, or the Implementing Regulations of MIFE came into effect, which provides that in the case of a domestic individual participating in an employee stock ownership plan or stock option plan of an overseas listed company, the required foreign exchange administrative filings involved shall be handled after the listed company
23
or its domestic agency has filed a unified application and has obtained the approval from the foreign exchange authorities. On April 6, 2007, the capital account department of the SAFE issued Operating Procedures for the Administration of Domestic Individuals Participating in the Employee Stock Ownership Plan or Stock Option Plan of an Overseas Listed Company, or Circular No. 78. It is not clear at this time whether Circular No. 78 covers all forms of equity compensation plans or only those which provide for the granting of stock options. For any plans which are so covered and are adopted by a non-PRC listed company, such as our company, after April 6, 2007, according to Implementing Regulations of MIFE and Circular No. 78, all participants who are PRC citizens are required to register with and obtain approvals from the SAFE prior to their participation in the plan. In addition, Circular No. 78 also requires PRC citizens to register with the SAFE and make the necessary applications and filings by July 5, 2007 if they participated in an overseas listed company’s covered equity compensation plan prior to April 6, 2007.
Participants in our equity compensation plans have not registered with the SAFE, and we and the participants who are PRC citizens are currently conducting the registration procedures. Failure to comply with such provisions may subject us and the participants of our equity compensation plans who are PRC citizens to fines and legal sanctions and prevent us from being able to grant equity compensation to our personnel which is currently a significant component of the compensation of certain of our PRC employees. In that case, our business operations may be adversely affected.
Increase in labor costs and the new Labor Contract Law and other labor-related regulations in the PRC may adversely affect our business and our profitability.
On June 29, 2007, the National People’s Congress of China enacted a new Labor Contract Law, which became effective on January 1, 2008. Compared to the PRC Labor Law effective as of January 1, 1995, the new Labor Contract Law imposes more restrictions and increases costs for the employers to terminate employment, including specific provisions related to fixed term employment contracts, temporary employment, probation, consultation with the labor union and employee assembly, employment without a contract, dismissal of employees, compensation upon termination and overtime work, and collective bargaining. According to the new Labor Contract Law, the employer is obliged to sign an unlimited term labor contract with an employee if the employer continues to hire the employee after two consecutive fixed term labor contracts or after the employee spends 10 consecutive years working for the employer. The employer also has to pay a compensation fee to the employee if the employer terminates an unlimited term labor contract. Unless an employee refuses to extend an expired labor contract, such compensation is also required when the labor contract expires. Further, under the Regulations on Paid Annual Leave for Employees, which became effective on January 1, 2008, employees who have served more than one year for an employer are entitled to a paid vacation ranging from 5 to 15 days, depending on their length of service. Employees who waive such vacation time at the request of employers shall be compensated for three times their normal salaries for each waived vacation day. As a result of these new protective labor measures, our labor costs are expected to increase, which may adversely affect our business and our results of operations.
We face risks related to health epidemics and other outbreaks.
Our business could be adversely affected by the effects of avian flu, SARS or another epidemic or outbreak. China reported a number of cases of SARS in April 2004. Since 2005, there have been reports of occurrences of avian flu in various parts of China, including a few confirmed human cases and deaths. Any prolonged recurrence of avian flu, SARS or other adverse public health developments in China may have a material adverse effect on our business operations. These could include restrictions on our ability to travel or ship our products outside of China as well as temporary closure of our manufacturing facilities. Such closures or travel or shipment restrictions would severely disrupt our business operations and adversely affect our results of operations. We have not adopted any written preventive measures or contingency plans to combat any future outbreak of avian flu, SARS or any other epidemic.
24
Risks Related to Our Shares and ADSs
The market price for our ADSs has been volatile since our ADSs began trading on NASDAQ, and may be subject to fluctuations in the future, which could result in substantial losses to investors.
The closing price of our ADSs has ranged from a high of $17.88 to a low of $5.05 since our ADSs began trading on NASDAQ on May 17, 2007. We cannot assure you that the market price of ADSs will not significantly fluctuate from its current level. The market price of our ADSs may be subject to wide fluctuations in response to factors including the following:
| | • | | announcements of technological or competitive developments; |
| | • | | regulatory developments in our target markets affecting us, our customers or our competitors; |
| | • | | announcements of studies and reports relating to the conversion efficiencies of our products or those of our competitors; |
| | • | | actual or anticipated fluctuations in our quarterly operating results; |
| | • | | changes in financial estimates by securities research analysts; |
| | • | | changes in the economic performance or market valuations of other solar power technology companies; |
| | • | | addition or departure of our executive officers and key research personnel; |
| | • | | announcements regarding patent litigation or the issuance of patents to us or our competitors; |
| | • | | fluctuations in the exchange rates between the U.S. dollar, the Euro and RMB; |
| | • | | release or expiry of lock-up or other transfer restrictions on our outstanding ordinary shares or ADSs; and |
| | • | | sales or perceived sales of additional ADSs. |
In addition, the securities markets have from time to time experienced significant price and volume fluctuations that are not related to the operating performance of particular companies. These market fluctuations may also have a material adverse effect on the market price of our ADSs. In particular, the performance and fluctuation of market prices of other companies with business operations located mainly in China that have listed their securities in the United States may affect the volatility in the price of and trading volumes for our ADSs. The trading performances of these China-based companies’ securities at the time of or after their offerings may affect the overall sentiment toward China-based companies’ securities listed in the United States and consequently may impact the trading performance of our ADSs. Volatility in global capital markets could also have an effect on the market price of our ADS.
Substantial future sales of our ADSs or ordinary shares in the public market, or the perception that these sales could occur, could cause the price of our ADSs to decline.
Additional sales of our ADSs or ordinary shares in the public market, or the perception that these sales could occur, could cause the market price of our ADSs to decline. If our shareholders sell substantial amounts of our ADSs, including those issued upon the exercise of outstanding options, in the public market, the market price of our ADSs could fall. Such sales also might make it more difficult for us to sell equity or equity-related securities in the future at a time and price that we deem appropriate. If any existing shareholder or shareholders sell a substantial amount of ordinary shares, the prevailing market price for our ADSs could be adversely affected.
In addition, we may issue additional ordinary shares or ADSs for future acquisitions. If we pay for our future acquisitions in whole or in part with additionally issued ordinary shares or ADSs, your ownership interests in our company would be diluted and this, in turn, could have a material adverse effect on the price of our ADSs.
25
We may be classified as a passive foreign investment company, which could result in adverse U.S. federal income tax consequences to U.S. holders of our ADSs or ordinary shares.
Based on the price of the ADSs and our ordinary shares and the composition of our income and assets and our operations, we believe we were not considered a “passive foreign investment company,” or PFIC, for U.S. federal income tax purposes for our taxable year ended December 31, 2007. However, the application of the PFIC rules is subject to ambiguity in several respects, and, in addition, we must make a separate determination each year as to whether we are a PFIC (after the close of each taxable year). Accordingly, we cannot assure you that we will not be a PFIC for our current taxable year ending December 31, 2008 or any future taxable year. If we were treated as a PFIC for any taxable year during which a U.S. person held an ADS or an ordinary share, certain adverse U.S. federal income tax consequences could apply to such U.S. person. See Item 10, “Additional Information—Taxation—United States Federal Income Taxation—Passive Foreign Investment Company.”
Your right to participate in any future rights offerings may be limited, which may cause dilution to your holdings and you may not receive cash dividends if it is impractical to make them available to you.
We may from time to time distribute rights to our shareholders, including rights to acquire our securities. However, we cannot make rights available to you in the United States unless we register the rights and the securities to which the rights relate under the Securities Act or an exemption from the registration requirements is available. Also, under the deposit agreement, the depositary bank will not make rights available to you unless the distribution to ADS holders of both the rights and any related securities are either registered under the Securities Act, or exempted from registration under the Securities Act. We are under no obligation to file a registration statement with respect to any such rights or securities or to endeavor to cause such a registration statement to be declared effective. Moreover, we may not be able to establish an exemption from registration under the Securities Act. Accordingly, you may be unable to participate in our rights offerings and may experience dilution in your holdings.
In addition, the depositary of our ADSs has agreed to pay to you the cash dividends or other distributions it or the custodian receives on our ordinary shares or other deposited securities after deducting its fees and expenses. You will receive these distributions in proportion to the number of ordinary shares your ADSs represent. However, the depositary may, at its discretion, decide that it is inequitable or impractical to make a distribution available to any holders of ADSs. For example, the depositary may determine that it is not practicable to distribute certain property through the mail, or that the value of certain distributions may be less than the cost of mailing them. In these cases, the depositary may decide not to distribute such property and you will not receive such distribution.
Anti-takeover provisions in our charter documents may discourage a third party from acquiring us, which could limit our shareholders’ opportunities to sell their shares at a premium.
Our amended and restated memorandum and articles of association include provisions that could limit the ability of others to acquire control of us, modify our structure or cause us to engage in change-of-control transactions. These provisions could have the effect of depriving our shareholders of an opportunity to sell their shares at a premium over prevailing market prices by discouraging third parties from seeking to obtain control of us in a tender offer or similar transaction.
For example, our board of directors will have the authority, without further action by our shareholders, to issue preferred shares in one or more series and to fix the powers and rights of these shares, including dividend rights, conversion rights, voting rights, terms of redemption and liquidation preferences, any or all of which may be greater than the rights associated with our ordinary shares. Preferred shares could thus be issued quickly with terms calculated to delay or prevent a change in control or make removal of management more difficult. In addition, if our board of directors issues preferred shares, the market price of our ordinary shares may fall and the voting and other rights of the holders of our ordinary shares may be adversely affected.
26
Our articles of association provide for a staggered board, which means that our directors are divided into three classes, with one-third of our board standing for election every year. This means that, with our staggered board, at least two annual shareholders’ meetings, instead of one, are generally required in order to effect a change in a majority of our directors. Our staggered board can discourage proxy contests for the election of our directors and purchases of substantial blocks of our shares by making it more difficult for a potential acquirer to take control of our board in a relatively short period of time.
We are a Cayman Islands company and, because judicial precedent regarding the rights of shareholders is more limited under Cayman Islands law than that under U.S. law, you may have less protection for your rights than you would under U.S. law.
Our corporate affairs are governed by our amended and restated memorandum and articles of association, the Cayman Islands Companies Law and the common law of the Cayman Islands. The rights of shareholders to take action against the directors, actions by minority shareholders and the fiduciary responsibilities of our directors to us under Cayman Islands law are to a large extent governed by the common law of the Cayman Islands. The common law of the Cayman Islands is derived in part from comparatively limited judicial precedent in the Cayman Islands as well as that from English common law, which has persuasive, but not binding, authority on a court in the Cayman Islands. The rights of our shareholders and the fiduciary responsibilities of our directors under Cayman Islands law are not as clearly established as they would be under statutes or judicial precedent in some jurisdictions in the United States. In particular, the Cayman Islands has a less developed body of securities laws than the United States. In addition, some U.S. states, such as Delaware, have more fully developed and judicially interpreted bodies of corporate law than the Cayman Islands.
As a result of all of the above, public shareholders may have more difficulty in protecting their interests in the face of actions taken by management, members of the board of directors or controlling shareholders than they would as shareholders of a U.S. public company.
You will have limited ability to bring an action against us or against our directors and officers, or to enforce a judgment against us or them, because we are incorporated in the Cayman Islands, because we conduct a majority of our operations in China and because the majority of our directors and officers reside outside the U.S.
We are incorporated in the Cayman Islands, and conduct substantially all of our operations in China through Sunergy Nanjing, our wholly owned subsidiary established in China. Most of our directors and officers reside outside the United States and substantially all of the assets of those persons are located outside the United States. As a result, it may be difficult or impossible for you to bring an action against us or against these individuals in the Cayman Islands or in China in the event that you believe that your rights have been infringed under the applicable securities laws or otherwise. Even if you are successful in bringing an action of this kind, the laws of the Cayman Islands and of China may render you unable to enforce a judgment against our assets or the assets of our directors and officers.
The voting rights of holders of our ADSs are limited in several significant ways by the terms of the deposit agreement.
Holders of our ADSs may only exercise their voting rights with respect to the underlying ordinary shares in accordance with the provisions of the deposit agreement. Upon receipt of voting instructions from a holder of ADSs in the manner set forth in the deposit agreement, the depositary will endeavor to vote the underlying ordinary shares in accordance with these instructions. Under our amended and restated memorandum and articles of association and Cayman Islands law, the minimum notice period required for convening a general meeting is ten days. When a general meeting is convened, you may not receive sufficient notice of a shareholders’ meeting to permit you to withdraw your ordinary shares to allow you to cast your vote with respect to any specific matter at the meeting. In addition, the depositary and its agents may not be able to send voting instructions to you or
27
carry out your voting instructions in a timely manner. We will make all reasonable efforts to cause the depositary to extend voting rights to you in a timely manner, but we cannot assure you that you will receive the voting materials in time to ensure that you can instruct the depositary to vote your shares. Furthermore, the depositary and its agents will not be responsible for any failure to carry out any instructions to vote, for the manner in which any vote is cast or for the effect of any such vote. As a result, you may not be able to exercise your right to vote and you may lack recourse if your ordinary shares are not voted as you requested.
You may be subject to limitations on transfer of your ADSs.
Your ADSs, represented by American depositary receipts, are transferable on the books of the depositary. However, the depositary may close its books at any time or from time to time when it deems expedient in connection with the performance of its duties. The depositary may close its books from time to time for a number of reasons, including in connection with corporate events such as a rights offering, during which time the depositary needs to maintain an exact number of ADS holders on its books for a specified period. The depositary may also close its books in emergencies, and on weekends and public holidays. The depositary may refuse to deliver, transfer or register transfers of our ADSs generally when our books or the books of the depositary are closed, or at any time if we or the depositary thinks it is necessary or advisable to do so in connection with the performance of its duty under the deposit agreement, including due to any requirement of law or any government or governmental body, or under any provision of the deposit agreement.
| ITEM 4. | INFORMATION ON THE COMPANY |
| A. | History and Development of the Company |
Our operating subsidiary, Sunergy Nanjing, was incorporated in August 2004 in Nanjing, China. China Sunergy Co., Ltd., or Sunergy BVI, our holding company incorporated in the British Virgin Islands, acquired all of the equity interests in Sunergy Nanjing in April 2006 through a series of transactions that we have accounted for as a legal reorganization. As part of a restructuring in anticipation of our initial public offering, we incorporated China Sunergy Co., Ltd., or Sunergy, in the Cayman Islands on August 4, 2006. Sunergy became our ultimate holding company upon its issuance of shares to the existing shareholders of Sunergy BVI on August 30, 2006 in exchange for all shares of equivalent classes that these shareholders previously held in Sunergy BVI. In December 2007, Sunergy BVI incorporated China Sunergy (Hong Kong) Co., Ltd., or Sunergy Hong Kong, in Hong Kong. During the same month, Sunergy BVI transferred all of the equity interests in Sunergy Nanjing to Sunergy Hong Kong, which became the direct holding company of Sunergy Nanjing. We conduct substantially all of our operations through Sunergy Nanjing.
In May 2007, we completed our initial public offering, in which we issued and sold 9,775,000 ADSs, representing 58,650,000 of our ordinary shares, at a public offering price of US$11.00 per ADS.
Our principal executive offices are located at No. 123 Focheng West Road, Jiangning Economic & Technical Development Zone, Nanjing, Jiangsu 211100, People’s Republic of China. Our telephone number at this address is (86-25) 5276-6688 and our fax number is (86-25) 5276-6882.
You should direct all inquiries to us at the address and telephone number of our principal executive offices set forth above. Our website is www.chinasunergy.com. The information contained on our website does not form part of this report. Our agent for service of process in the United States is CT Corporation System, located at 111 Eighth Avenue, New York, New York 10011.
We manufacture our solar cells from silicon wafers utilizing crystalline silicon solar cell technology to convert sunlight directly into electricity through a process known as the photovoltaic effect. We sell our solar cell
28
products to Chinese and overseas module manufacturers and system integrators, who assemble our solar cells into solar modules and solar power systems for use in various markets.
We commenced business operations in August 2004. In 2005, we had only one solar cell manufacturing line. In 2006, we installed five additional solar cell manufacturing lines and expanded our annual manufacturing capacity by 160 MW, assuming the use of 156-millimeter monocrystalline silicon wafers. As of December 31, 2007 and as of the date of this report, our six solar cell manufacturing lines have an aggregate annual production capacity of 192 MW, assuming the use of 156-millimeter monocrystalline silicon wafers. We plan to increase our annual production capacity to approximately 320 MW, assuming the use of 156-millimeter monocrystalline silicon wafers, by the end of 2008, with ten manufacturing lines in total.
Our research and development team is led by two solar power researchers, each with over 10 years of experience and established credentials in the solar power industry. Our research and development efforts focus on continually enhancing our solar cell conversion efficiencies, which measure the ability of solar power products to convert sunlight into electricity, and improving our manufacturing operations. In the fourth quarter of 2007, we commenced commercial mass production of selective emitter cells, an improved version of the P-type solar cells that we and most other solar cell manufacturers produce. In addition, we are focusing on the development of advanced process technologies for manufacturing other new products, such as N-type solar cells, which generally have higher conversion efficiencies than those of P-type solar cells. We also plan to develop passivated emitter and rear cells in the future.
We sold 4.4 MW and 46.4 MW of solar cells in 2005 and 2006, respectively. In 2007, the shipment of our solar power products amounted to 74.0 MW, including 70.0 MW of solar cells sold, 2.4 MW of solar cells processed under OEM arrangements, and 1.6 MW of modules sold. We had net revenues of $13.7 million, $149.5 million and $234.9 million in 2005, 2006 and 2007, respectively. We incurred a net loss of $0.3 million in 2005, had net income of $11.8 million in 2006 and incurred a net loss of $4.9 million in 2007.
Products
We currently design, develop, manufacture and sell solar cells. A solar cell is a device made from a silicon wafer that converts sunlight directly into electricity by a process known as the photovoltaic effect. Currently, we produce both monocrystalline and multicrystalline silicon solar cells. In addition to standard P-type solar cells, we commenced mass commercial production of selective emitter cells, an improved version of the P-type solar cells that we and most other solar cell manufacturers produce, in the fourth quarter of 2007. The following table sets forth a sample of the types of solar cells we offered in 2007 with the specifications indicated.
| | | | | | | | | | |
Monocrystalline or Multicrystalline Solar Cell | | Dimensions
(mm×mm) | | Average
Conversion
Efficiency (%) | | Highest
Conversion
Efficiency (%) | | Peak Power
(W) | | As a Percentage
of Total Output
in 2007 as
Measured by
MW (%) |
Monocrystalline silicon solar cell | | 125×125
156×156 | | 16.0 16.2 | | 18.4 18.0 | | 2.7 4.3 | | 73.8 4.8 |
| | | | | |
Multicrystalline silicon solar cell | | 125×125
156×156 | | 15.3 15.3 | | 17.1 17.5 | | 2.7 4.3 | | 3.2 18.2 |
We produce a test batch of solar cells from each shipment of silicon wafers that we receive, and return the wafers if the quality is below our standards. However, normal variation in the quality of silicon wafers in shipments that meet our standards will still result in the production of a certain proportion of solar cells that do not meet our customers’ specifications. We refer to these solar cells as being off-specification. We sell off-specification solar cells at a discount to recover some or all of the expense we incur in the production process. Off-specification solar cells can be difficult to sell and the market price for them is volatile.
29
In addition to solar cells, we also sell limited quantities of polysilicon and solar cell modules.
Manufacturing Process
The manufacturing process for our solar cells, other than selective emitter cells, includes the following main steps:
| | • | | Chemical treatment of silicon wafers. We first fabricate a textured structure on the wafer surface through chemical treatment to reduce the reflection of sunlight. The chemical treatment process for monocrystalline silicon wafers produces a “pyramid-textured surface,” which traps sunlight into the silicon. For multicrystalline silicon wafers, a similar type of surface structure cannot be readily formed with traditional process technology. We adopt an advanced process that allows the formation on multicrystalline silicon wafers of a similar surface structure to that of monocrystalline silicon wafers. We believe that this technology helps us to achieve high conversion efficiencies for the multicrystalline silicon solar cells that we manufacture. |
| | • | | Diffusion process. Diffusion is a thermal process through which we selectively incorporate impurities into the silicon wafer and form an electrical field within the surface region of the wafer. We have developed different diffusion processing parameters for refined low-grade silicon wafers and off-specification wafers in order to achieve optimal efficiency for these wafers. |
| | • | | Edge isolation. We achieve electrical isolation between the front and back surfaces of the silicon wafer through a process known as edge isolation. In addition to using the conventional method of edge isolation, which is etching the edge with plasma, we are also using chemical etching technology. Chemical etching technology is more appropriate for the treatment of off-specification wafers, and should decrease manufacturing costs and reduce waste gas emissions. |
| | • | | Surface passivation. Surface passivation refers to the process of applying an anti-reflection coating to the front surface of the solar cell to reduce the chemical reaction detrimental to the formation of the electrical current. Our surface passivation technology ensures the appropriate thickness and refractive index of the coating to achieve high conversion efficiencies. |
| | • | | Screen printing and firing. We screen print negative and positive metal contacts, or electrodes, on the solar cell. Silicon and metal electrodes are then connected through an electrode firing process in a furnace at a high temperature. The match between the printing parameters and firing conditions is crucial for the solar cell performance. We have developed proprietary technology in this respect which facilitates our usage of silicon wafers as thin as 200 microns. |
Manufacturing Capacity and Manufacturing Facilities
Since our inception in August 2004, we have significantly expanded our manufacturing capacity to capture a larger portion of the market opportunity for our solar cells. We completed construction on a green-field site and started trial production of our first manufacturing line with a production capacity of 32 MW per year, assuming the use of 156-millimeter monocrystalline silicon wafers, in June 2005. We sold 4.4 MW of solar cells in 2005.
We completed our second to sixth solar cell manufacturing lines and started generating revenues from these lines in 2006. Our fourth line, which achieved full-scale manufacturing capacity in November 2006, produces selective emitter solar cells rather than the standard P-type solar cells. We sold 46.4 MW of solar cells in 2006. In 2007, the shipment of our solar power products amounted to 74.0 MW, including 70.0 MW of solar cells sold, 2.4 MW of solar cells processed under OEM arrangements and 1.6 MW of modules sold.
As of December 31, 2007 and as of the date of this report, we have six solar cell manufacturing lines with an aggregate annual production capacity of 192 MW, assuming the use of 156-millimeter monocrystalline silicon wafers. Our actual output of solar cells depends on the size of the silicon wafers that we use; historically we have
30
used a mix of monocrystalline and multicrystalline silicon wafers, each in sizes of 125 millimeters and 156 millimeters. Our actual output does not match our production capacity because we cannot obtain sufficient supply of 156-millimeter wafers, as most of our suppliers and most of the suppliers in China sell the smaller size. To the extent we use smaller wafers or multicrystalline wafers, our actual production will be less than our production capacity. We plan to increase our aggregate production capacity of solar cells to approximately 320 MW per year, assuming the use of 156-millimeter monocrystalline silicon wafers, by the end of 2008 with ten manufacturing lines in total, five of which will be capable of producing selective emitter solar cells.
We use high-precision manufacturing equipment sourced worldwide to enhance the quality of our finished products. With customized designs, we assemble such equipment into streamlined manufacturing lines to improve the efficiency of our manufacturing processes. We also leverage our location in China to purchase, from domestic suppliers, low-cost equipment with quality comparable to imported machinery.
The table below sets forth a summary of our current manufacturing lines for solar cells as of the date of this report:
| | | | |
Solar Cell Manufacturing Line | | Time of Achieving Full-
scale Manufacturing
Capacity | | Annualized
Manufacturing
Capacity(1)
(in MW) |
Line 1 | | August 2005 | | 32 |
Line 2 | | May 2006 | | 32 |
Line 3 | | June 2006 | | 32 |
Line 4 | | November 2006(2) | | 32 |
Line 5 | | November 2006 | | 32 |
Line 6 | | December 2006 | | 32 |
| | | | |
Total | | | | 192 |
| | | | |
| (1) | Calculated by assuming the use of 156-millimeter monocrystalline silicon wafers, with assumptions regarding the number of cells per month and the conversion rates of those cells. |
| (2) | Produces selective emitter solar cells. |
Raw Materials
Silicon wafers are the most important raw materials for producing solar cells, with monocrystalline and multicrystalline silicon wafers as the most commonly used materials. We can produce solar cells with either of these types of silicon wafers, and this dual capability provides us with flexibility in raw material procurement.
We seek to procure silicon wafers from various suppliers, including manufacturers and trading companies, most of which are located in China. In addition, we procure polysilicon, silicon ingots and other silicon-based raw materials throughout the various segments of the supply chain, and outsource the production of silicon wafers from these raw materials under toll manufacturing arrangements with third parties. Sometimes, we sell polysilicon raw materials to wafer manufacturers and purchase silicon wafers from them under buy-and-sell arrangements. In order to meet a portion of our raw material requirements, we also enter into buy-and-sell arrangements with some of our customers, under which we secure silicon wafers from some of our customers, and sell solar cells to them in return.
In 2007, our principal suppliers of silicon wafers and other silicon-based raw materials included Jiangxi LDK Solar Hi-Tech Co. Ltd., Luoyang Zhonggui High-tech Co., Ltd., Changzhou Xiandai Communications Optic Fiber Co., Ltd., ET Solar Industry Limited, and Changzhou EGing Photovoltaic Technology Co., Ltd. Our top five suppliers supplied approximately 37.8% of silicon wafers and other silicon raw material supplies that we procured in 2007. Historically, a majority of our silicon wafers and other silicon-based raw materials are supplied
31
pursuant to supply contracts with one year or shorter terms or purchase orders, so the composition of our top suppliers changes from year to year. We seek to enter into additional long-term supply contracts or framework agreements. However, the pricing terms under our framework agreements generally are subject to further negotiation, and in the event that we cannot reach agreement on the pricing terms with the suppliers in the future, those agreements may not be enforceable.
Our manufacturing process also involves metallic paste, chemicals and other materials. We secure these raw materials from multiple vendors who have demonstrated good quality control and reliability.
Quality Assurance and Customer Support and Service
Our quality control consists of three components: incoming inspection through which we ensure the quality of the raw materials that we source from third parties, in-process quality control of our manufacturing processes, and output quality control of finished products through inspection and testing. We have received the ISO 9001:2000 certification for our quality assurance programs, which we believe demonstrates our technological capabilities and instills customer confidence. We adhere to strict standards when testing the conversion efficiency of our products to ensure that our products perform to specified standards.
A team within our sales group works closely with our quality assurance group to provide customer support and service. We emphasize gathering customer feedback for our products and timely addressing customer concerns. Our customer support and service team also provides our customers with training and consultation with respect to the application of our products.
Customers and Markets
We sell our solar cells primarily to module manufacturers, who assemble our cells into solar modules and solar power systems for use in various markets, particularly European markets. We also outsource to third parties the manufacturing of solar modules from our solar cells or purchase solar modules from third parties for sale of such solar modules to our customers. In 2007, solar module sales accounted for only 2.5% of our revenues and we do not plan to substantially increase our solar module sales in the near future. In 2007, our major customers included Wuxi Guofei Green Energy Source Co., Ltd., aleo solar AG, Solarwatt AG, Canadian Solar (Changshu) Co., Ltd. and Canadian Solar (Suzhou) Co., Ltd. In 2007, our top five customers contributed 56.9% of our net revenues. Sales to each of Wuxi Guofei Green Energy Source Co., Ltd. and aleo solar AG contributed over 10% of our net revenues for the year ended December 31, 2007.
32
We currently make a majority of our sales to customers located in China. We also sell our solar power products to customers located in Germany, Italy and other countries. The following table sets forth by region our net revenues derived from sales of our products for the periods indicated:
| | | | | | | | | | | | | | | | | | |
| | | Year Ended December 31, | |
| | | 2005 | | | 2006 | | | 2007 | |
| | | (in thousands, except percentages) | |
Europe: | | | | | | | | | | | | | | | | | | |
—Germany | | $ | 173 | | 1.2 | % | | $ | 15 | | — | | | $ | 62,314 | | 26.5 | % |
—Italy | | | — | | — | | | | 12,235 | | 8.2 | % | | | 8,980 | | 3.8 | |
—Netherlands | | | 7 | | 0.1 | | | | 8,957 | | 6.0 | | | | — | | — | |
—Others | | | — | | — | | | | 175 | | 0.1 | | | | 1,803 | | 0.8 | |
Europe Total | | | 180 | | 1.3 | | | | 21,382 | | 14.3 | | | | 73,097 | | 31.1 | |
PRC | | | 13,487 | | 98.1 | | | | 119,238 | | 79.7 | | | | 151,058 | | 64.3 | |
South Africa | | | 6 | | — | | | | 3,712 | | 2.5 | | | | 83 | | — | |
South Korea | | | — | | — | | | | 3,183 | | 2.1 | | | | 6,419 | | 2.8 | |
Others | | | 77 | | 0.6 | | | | 2,006 | | 1.4 | | | | 4,251 | | 1.8 | |
Total net revenues | | $ | 13,750 | | 100.0 | % | | $ | 149,521 | | 100.0 | % | | | 234,908 | | 100 | % |
In order to continue growing our sales and to reduce our reliance on any particular market segment, we intend to broaden our geographic presence and customer base. While we expect China will continue to be one of our most significant markets for the foreseeable future, we plan to expand our sales of solar cells to several overseas solar power markets, including European countries and those countries and regions with growing demand or market potential for solar power products, such as the United States, Korea and other Asian countries and regions.
We sell our products primarily under sales contracts, purchase orders and buy-and-sell arrangements, as follows:
| | • | | Sales contracts and purchase orders. Historically, we entered into sales contracts of various terms with our customers and were obligated to deliver solar cells according to a pre-agreed price and schedule during the term of the contract. Given the strong industry demand for solar cells and the volatility in average selling prices of silicon raw materials and solar cells in recent periods, a substantial portion of our contracts now provide for re-negotiation of price terms based on regular pricing reviews every three or six months or provide for adjustment of pricing terms when the change in exchange rate reaches certain benchmarks. Depending on their credit history with us, we may grant our large customers credit terms, usually within one month, according to our current credit policy. With respect to the other customers, we typically request full payment before or upon shipment. We also sell our solar cells via purchase orders placed by our customers. |
| | • | | Buy-and-sell arrangements. Under buy-and-sell arrangements, we obtain silicon wafer supplies from our customers, and are obligated to sell solar cells to them in return. The payment we make for the wafers and the payment our customers make for the solar cells are either settled separately or sometimes offset against each other. |
We also process silicon wafers provided by our customers into solar cells under OEM arrangements, and we charge processing fees from these customers.
In October 2007, we entered into a framework agreement with aleo solar AG under which it agreed to purchase 10 MW and 20 MW of our solar cells in the first half and the second half of 2008, respectively. The prices of our solar cells under this agreement for the first half of 2008 are fixed, and the prices for the subsequent deliveries are to be further negotiated. In February 2007, we entered into a framework sales contract with Wuxi Guofei Green Energy Source Co., Ltd., under which it agreed to purchase a total of 60 MW of our solar cells in 2007 and 2008. The prices of our solar cells under this contract for the first quarter of 2007 were fixed, and the prices for subsequent deliveries have been and are to be negotiated quarterly.
33
Sales and Marketing
We market and sell our solar power products worldwide through our direct sales force, which is based in our facilities in Nanjing, China. Our marketing programs include industrial conferences, trade fairs, sales training, advertising and public relation events. Our sales and marketing groups work closely with our research and development and manufacturing groups to coordinate our product development activities, product launches and ongoing demand and supply planning. We plan to establish a global sales network and have expanded our sales network by establishing two regional offices, one in Shanghai, China and the other in Munich, Germany.
Historically, the identity of our customers has changed substantially from year to year. We aim to further develop long-term relationships with key customers that are market leaders or strong niche players in their respective industrial or geographic segments. We believe that these customers will provide consistent revenue streams to minimize business volatility, and we target to achieve a substantial portion of our total net revenues from sales to strategic customers. We believe that our focus on solar cell manufacturing minimizes our conflict of interest with module manufacturers and enables us to establish and maintain long-term partnerships with our customers. We only engage in sales of modules under limited circumstances, and sales of modules only account for a few percentage points of our net revenues each year. As more and more module manufacturers are based in China, our proximity to our customers gives us competitive advantages, such as rapid delivery, effective communication and efficient post-sale services. To further diversify our customer base, which currently consists primarily of module manufacturers, we will seek to increase our sales to system integrators and develop customers in the market for specialty applications, such as, solar power streetlights and traffic lights.
Intellectual Property
As of the date of this report, we have three patents in China, one of which relates to process technologies for the manufacture of N-type solar cells, and the other two of which relate to utility models for N-type solar cells. In addition, we have two patent applications pending in China, one of which relates to manufacture of selective emitter solar cells, and the other to rectification of bowed solar cells. We intend to continue to assess appropriate opportunities for patent protection of those aspects of our technology that we believe provide significant competitive advantage to us.
We also rely on a combination of trade secrets and employee contractual protections to establish and protect our proprietary rights. We believe that many elements of our solar power products and manufacturing processes involve proprietary know-how, technology or data that are not covered by patents or patent applications, including technical processes, equipment designs, algorithms and procedures. We have taken security measures to protect these elements. All of our research and development personnel have entered into confidentiality and proprietary information agreements with us. These agreements address intellectual property protection issues and require our employees to assign to us all of their inventions, designs and technologies that they develop primarily utilizing our resources or when performing their duties during their employment.
We filed trademark applications for “NPV,” “SUNERGY,” and “CSUN” as well as several logos with the PRC Trademark Office in 2006 and 2007. The registrations for these trademarks have not been completed and, under PRC law, we have not obtained proprietary rights to these trademarks yet. Further, CEEG and Sunergy Nanjing entered into two trademark license agreements effective as of February 9, 2006 and June 7, 2006, respectively, pursuant to which CEEG granted to Sunergy Nanjing the rights to use the trademarks of “CEEG” and its Chinese characters in Sunergy Nanjing’s ordinary business for ten years.
Competition
The market for solar cells is highly competitive and continually evolving. We expect to face increased competition, which may result in price reductions, reduced margins or loss of market share. We believe that the key competitive factors in the market for solar cells include:
| | • | | manufacturing efficiency; |
| | • | | conversion efficiency and performance; |
34
| | • | | strength of supplier relationships; and |
Our competitors include solar power divisions of large conglomerates such as BP Solar, Kyocera, Sanyo and Sharp Corporation, as well as specialized cell manufacturers such as Motech Industries Inc., Q-Cells AG, Suntech Power Holdings Co., Ltd., Solarfun Power Holdings Co. Ltd. and JA Solar Holdings Co., Ltd. Some of our competitors have also become vertically integrated, from upstream polysilicon manufacturing to solar power system integration, such as Renewable Energy Corporation ASA.
Many of our competitors are developing or currently producing products based on alternative solar power technologies, such as thin-film technologies, which may ultimately have costs similar to, or lower than, our projected costs. We expect that we will also need to compete with new entrants to the solar power market. In addition, the entire solar power industry also faces competition from conventional and non-solar renewable energy technologies.
Many of our existing and potential competitors have substantially greater financial, technical, manufacturing and other resources than we do. Our competitors’ greater size in some cases provides them with a competitive advantage with respect to manufacturing costs due to their economies of scale and their ability to purchase raw materials at lower prices. Many of our competitors also have more established distribution networks and larger customer bases. As a result, they may be able to devote greater resources to the research, development, promotion and sale of their products or respond more quickly to evolving industry standards and changes in market conditions than we can.
REGULATION
This section sets forth a summary of the most significant regulations or requirements that affect our business activities in China or our shareholders’ rights to receive dividends and other distributions from us.
Renewable Energy Law and Other Government Directives
In February 2005, China enacted its Renewable Energy Law, which became effective on January 1, 2006. The Renewable Energy Law sets forth policies to encourage the development and use of solar energy and other non-fossil energy. The renewable energy law sets out the national policy to encourage and support the use of solar and other renewable energy and the use of on-grid generation. It also authorizes the relevant pricing authorities to set favorable prices for the purchase of electricity generated by solar and other renewable power generation systems.
The law also sets out the national policy to encourage the installation and use of solar energy water-heating systems, solar energy heating and cooling systems, solar photovoltaic systems and other solar energy utilization systems. It also provides the general principles regarding financial incentives for the development of renewable energy projects. The projects, as listed in the renewable energy industry development guidance catalogue, may obtain preferential loans from financial institutions and can enjoy tax preferences. The State Council is authorized to stipulate the specific tax preferential treatments. However, so far, no rule has been issued by the State Council pertaining to this matter. In January 2006, China’s National Development and Reform Commission promulgated two implementation directives of the Renewable Energy Law. These directives set out specific measures in setting prices for electricity generated by solar and other renewal power generation systems and in sharing additional expenses occurred. The directives further allocate the administrative and supervisory authorities among different government agencies at the national and provincial levels and stipulate responsibilities of electricity grid companies and power generation companies with respect to the implementation of the Renewable Energy Law. In July 2007, China’s National Development and Reform Commission further
35
promulgated an implementation directive of the Renewable Energy Law. The directive stipulates the responsibility of electricity grid companies to buy all electricity generated by renewable energy power generation systems.
China’s Ministry of Construction also issued directives in September 2006 and February 2007, which seek to expand the use of solar energy in residential and commercial buildings and encourages the increased application of solar energy in different townships. In addition, the State Council promulgated a directive in July 2005 which sets out specific measures to conserve energy resources.
Environmental Regulations
We are subject to a variety of governmental regulations related to environmental protection. The major environmental regulations applicable to us include the Environmental Protection Law of the PRC, the Law of PRC on the Prevention and Control of Water Pollution, Implementation Rules of the Law of PRC on the Prevention and Control of Water Pollution, the Law of PRC on the Prevention and Control of Air Pollution, Implementation Rules of the Law of PRC on the Prevention and Control of Air Pollution, the Law of PRC on the Prevention and Control of Solid Waste Pollution, and the Law of PRC on the Prevention and Control of Noise Pollution.
We are in compliance with present environmental protection requirements in all material aspects and have all necessary environmental permits to conduct our business. Our operations are subject to regulation and periodic monitoring by local environmental protection authorities.
Restriction on Foreign Ownership
The principal regulation governing foreign ownership of solar power businesses in the PRC is the Foreign Investment Industrial Guidance Catalogue, effective as of December 1, 2007, or the Catalogue. The Catalogue classifies the various industries into four categories: encouraged, permitted, restricted and prohibited. As confirmed by the government authorities, Sunergy Nanjing, our operating subsidiary, is engaged in an encouraged industry. Sunergy Nanjing is permitted under the PRC laws to be wholly owned by a foreign company. Sunergy Nanjing is, accordingly, also entitled to certain preferential treatments granted by the PRC government authorities, such as exemption from tariffs on equipment imported for its own use.
Tax
PRC enterprise income tax is calculated primarily on the basis of taxable income determined under PRC accounting principles. In accordance with Income Tax Law of China for Enterprises with Foreign Investment and Foreign Enterprises promulgated as of April 9, 1991 and effective as of July 1, 1991, or the Income Tax Law, and the related implementing rules, foreign-invested enterprises incorporated in the PRC were generally subject to an enterprise income tax rate of 33% (30% of state income tax plus 3% of local income tax). The Income Tax Law and the related implementing rules provided certain preferential tax treatments to foreign-invested enterprises which were established in certain areas in the PRC.
Sunergy Nanjing, a foreign-invested enterprise engaged in a manufacturing business and established in Nanjing, which is within a coastal economic zone, was entitled to a preferential enterprise income tax rate of 24%. As a wholly foreign owned enterprise engaged in a manufacturing business, Sunergy Nanjing was also entitled to a two-year exemption from the enterprise income tax for its first two profitable years of operation, which were 2006 and 2007, and to a 50% reduction of its applicable income tax rate for the succeeding three years, which would be 2008, 2009 and 2010. To enjoy the above preferential treatment, the operation duration of Sunergy Nanjing shall be no less than 10 years.
36
On March 16, 2007, the National People’s Congress, enacted the New EIT Law. On December 6, 2007, the State Council adopted the Implementing Regulation for the New EIT Law. Both the New EIT Law and its Implementing Regulation became effective on January 1, 2008. Under the New EIT Law and its Implementing Regulation, foreign-invested enterprises and domestic companies would be subject to enterprise income tax at a uniform rate of 25%. On December 26, 2007, State Council of China promulgated the circular on implementation of enterprise tax transition preferential policy, or the Circular. Under the New EIT Law, the Implementing Regulation and the Circular, enterprises that were established and already enjoyed preferential tax treatments before March 16, 2007 will continue to enjoy them (i) in the case of preferential tax rates, for a period of five years from January 1, 2008, and the enterprises that previously enjoyed the tax rate of 24% shall be subject to the tax rate of 25% as of 2008, and (ii) in the case of preferential tax exemption or reduction for a specified term, until the expiration of such term. Therefore, Sunergy Nanjing is subject to an applicable income tax rate of 12.5% in 2008, 2009 and 2010.
Pursuant to the Provisional Regulation of China on Value Added Tax and its implementing rules, all entities and individuals that are engaged in the sale of goods, the provision of processing, repairs and replacement services and the importation of goods into China are generally required to pay value added tax, or VAT, at a rate of 17.0% of the gross sales proceeds received, less any deductible VAT already paid or borne by the taxpayer. Further, when exporting goods, the exporter is entitled to a portion or all of the refund of VAT that it has already paid or borne. Accordingly, Sunergy Nanjing is subject to the 17.0% VAT with respect to its sales of solar cells in China, while Sunergy Nanjing’s export sales of solar cells is exempt from such VAT.
Foreign Currency Exchange
The principal regulations governing foreign currency exchange in China are the Foreign Exchange Administration Regulations (1996), as amended in 1997. Under these regulations, the RMB is freely convertible for current account items, including the distribution of dividends, interest payments, trade and service-related foreign exchange transactions, but not for capital account items, such as direct investment, loan, repatriation of investment and investment in securities outside China, unless the prior approval of SAFE is obtained.
Pursuant to the Administration Rules of the Settlement, Sale and Payment of Foreign Exchange (1996), foreign-invested enterprises in China may purchase or remit foreign exchange, subject to a cap approved by the SAFE, for settlement of current account transactions without the approval of the SAFE. Foreign exchange transactions under the capital account are still subject to limitations and require approvals from, or registration with, the SAFE and other relevant PRC governmental authorities.
The business operations of Sunergy Nanjing, which are subject to the foreign currency exchange regulations, have all been in compliance with these regulations.
Dividend Distribution
The principal regulations governing distribution of dividends of wholly foreign-owned enterprises include the Wholly Foreign-owned Enterprise Law (1986), as amended by the Decision on Amending the Law of the PRC on Wholly Foreign-owned Enterprise (2000), and the Implementing Rules of the Wholly Foreign-owned Enterprise Law (1990), as amended by the Decision of the State Council on Amending the Implementing Rules of the Law of the PRC on Wholly Foreign-owned Enterprises (2001).
Under these regulations, foreign-invested enterprises in China may pay dividends only out of their accumulated profits, if any, determined in accordance with Chinese accounting standards and regulations. In addition, wholly foreign owned enterprises in China are required to set aside at least 10% of their respective after-tax profits based on PRC accounting standards each year, if any, to fund its general reserves fund, until the accumulative amount of such reserves reaches 50% of its registered capital. These reserves are not distributable as cash dividends. A wholly foreign owned enterprise is also required to allocate a portion of its after-tax profits, as determined by its board of directors, to its staff welfare and bonus funds.
37
Intellectual Property Rights
The Patent Law (1984), as amended by the Decision on Amending the Patent Law (2000), and the Implementing Rules of the Patent Law (2001), as amended by the Decision on Amending the Implementing Rules of the Patent Law (2002) provide for the application and protection of patents. An invention patent shall be valid for twenty years and an external design patent and a utility model patent shall be valid for ten years, commencing on their application dates, respectively. Any persons or entities using a patent without the consent of the patent owner, making counterfeits of patented products, or conducting other activities which infringe upon patent rights will be held liable for compensation to the patent owner, fines charged by the administrative authorities and even criminal punishment. Our operating subsidiary, Sunergy Nanjing, has three patents in China, one of which relates to process technologies for the manufacture of N-type solar cells, and the other two of which relate to utility models for N-type solar cells.
The Trademark Law of the PRC (1986), as amended in 2002, and the Implementing Regulations of the Trademark Law (2002) provide for the application, protection and license of trademarks. A registered trademark shall be valid for ten years, commencing on the date of registration and can be renewed by an application made within six months before expiration. The renewed registration shall also be valid for ten years and can be renewed unlimitedly. We filed trademark applications for “NPV,” “SUNERGY,” “CSUN” as well as several logos with the PRC Trademark Office in 2006 and 2007, respectively. The registrations for these trademarks have not been completed and, under PRC law, we have not obtained proprietary rights to these trademarks yet.
Labor and Work Safety
The laws and regulations governing the labor relations for enterprises and institutions in the PRC include Labor Law of the PRC (1995), or the Labor Law. Contracts must be formed if labor relationships are established between entities and their laborers. The Labor Law sets limits on the maximum number of hours a laborer can work, and entities must establish and continuously develop its system for labor safety and sanitation, strictly abide by national rules and standards on labor safety and sanitation, provide laborers with safety and sanitation conditions and educate laborers on labor safety and sanitation. The government provides additional protection to female staff and workers and juvenile workers.
On June 29, 2007, the National People’s Congress enacted the Labor Contract Law of the PRC, or the Labor Contract Law, which came into effect as of January 1, 2008. The Labor Contract Law imposes stricter requirements in terms of signing labor contracts, paying remuneration, stipulating probation and penalties and dissolving labor contracts.
The laws and regulations governing the labor relations also include the Work Safety Law of the PRC (2002), the Regulation on Occupational Injury Insurance (2004), the Interim Measures Concerning the Maternity Insurance (1995), the Interim Regulations on the Collection and Payment of Social Insurance Premiums (1999) and its interim measures (1999), and the Regulation on the Administration of Housing Fund (2002).
Sunergy Nanjing is subject to the above laws and regulations.
38
| C. | Organizational Structure |
The following diagram illustrates our company’s organizational structure, and the place of formation, ownership interest and affiliation of each of our subsidiaries as of the date hereof.
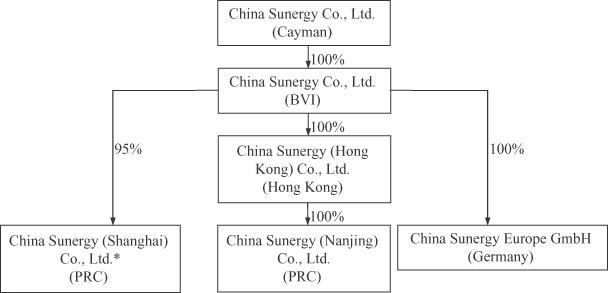
| * | China Electric Equipment Group Co., Ltd, or CEEG, holds the remaining 5% of the equity interest in Sunergy Shanghai. |
In November 2007, Sunergy BVI and CEEG jointly incorporated China Sunergy (Shanghai) Co., Ltd., or Sunergy Shanghai., in which we hold a 95% interest, and CEEG a 5% interest. According to our current plan, Sunergy Shanghai will primarily engage in solar power research and development activities, and we plan to complete the construction of a research and development center in Shanghai in the first half of 2009.
In December 2007, Sunergy BVI incorporated Sunergy Hong Kong in Hong Kong. During the same month, Sunergy BVI transferred all its equity interest in Sunergy Nanjing to Sunergy Hong Kong, as a result of which Sunergy Hong Kong became the direct holding company of our principal operating subsidiary, Sunergy Nanjing. In November 2007, Sunergy BVI incorporated China Sunergy Europe GmbH in Munich, Germany.
| D. | Property, Plant and Equipment |
We conduct our research, development and manufacturing of solar cells at our facilities in Nanjing, China, where we occupy a site area of approximately 53,000 square meters. These facilities include office premises with a total floor space of approximately 9,600 square meters and manufacturing facilities with a total floor space of approximately 10,600 square meters that can accommodate up to six solar cell manufacturing lines. In addition, Sunergy Nanjing and CEEG, an entity controlled by Mr. Tingxiu Lu, our chairman, entered into an agreement on December 20, 2006. Pursuant to the agreement, CEEG granted Sunergy Nanjing an option to purchase, prior to December 31, 2007, the right to use a parcel of land of approximately 26,000 square meters at a price of approximately $0.5 million. On July 23, 2007, CEEG and Sunergy Nanjing entered into a land use right transfer agreement, under which Sunergy Nanjing purchased the use right to the foregoing parcel of land at a price of approximately $1.2 million, which was equivalent to the valuation price. Sunergy Nanjing agreed to increase the purchase consideration to avoid that the land be compulsorily acquired by the government due to the price being significantly lower than the valuation price. We are in process of constructing facilities on this land in order to install four additional solar cell manufacturing lines.
39
In 2007, we pledged our certain raw materials and inventories with a total value of approximately $61.7 million to secure repayment of our short-term borrowings of approximately $28.7 million due in 2008. We have repaid these short-term borrowings in the first quarter in 2008. In January and February 2008, we pledged raw materials and inventories with a total value of approximately $26.1 million to secure our repayment of short-term borrowings of approximately $15.7 million that will become due in January and February 2009, respectively.
We are currently in the process of securing land use rights to a plot of land in Shanghai, and we plan to complete the construction of a research and development center in Shanghai in the first half of 2009.
We maintain property insurance policies with reputable insurance companies for covering our equipment, facilities, buildings and their improvements, and office furniture. These insurance policies cover losses due to fire, earthquake, flood and a wide range of other natural disasters. We maintain director and officer liability insurance for our directors and executive officers. Our insurance products contain various coverage limits and deductibles. We do not currently maintain product liability insurance or business interruption insurance. We have appointed an insurance broker to provide us with proposals for insurance coverage for our company, and we plan to enlarge our coverage during 2008.
| ITEM 4A. | UNRESOLVED STAFF COMMENTS |
Not Applicable.
| ITEM 5. | OPERATING AND FINANCIAL REVIEW AND PROSPECTS |
The following discussion of our financial condition and results of operations is based upon and should be read in conjunction with our consolidated financial statements and their related notes included in this annual report on Form 20-F. This report contains forward-looking statements. See “Introduction—Forward-Looking. Information.” In evaluating our business, you should carefully consider the information provided under the caption “Risk Factors” in this annual report on Form 20-F. We caution you that our businesses and financial performance are subject to substantial risks and uncertainties.
Overview
We sell our solar cell products mostly to module manufacturers and, to a lesser extent, to system integrators, who assemble our cells into solar modules and solar power systems for use in various markets. We commenced business operations in August 2004 through Sunergy Nanjing, a limited liability company established in China. Our holding company incorporated in the British Virgin Islands, Sunergy BVI, acquired all of the equity interests in Sunergy Nanjing in April 2006 through a series of transactions that have been accounted for as a legal reorganization. In anticipation of our initial public offering, we incorporated Sunergy in the Cayman Islands as a listing vehicle on August 4, 2006. Sunergy acquired all of the equity interests in Sunergy BVI upon its issuance of shares to the existing shareholders of Sunergy BVI on August 30, 2006 in exchange for all shares of equivalent classes that these shareholders previously held in Sunergy BVI, and Sunergy BVI became our wholly owned subsidiary. In December 2007, Sunergy BVI incorporated Sunergy Hong Kong in Hong Kong. During the same month, Sunergy BVI transferred all of the equity interests in Sunergy Nanjing to Sunergy Hong Kong, which became our direct holding company. We conduct substantially all of our operations through Sunergy Nanjing.
Our management’s operational expertise and execution capability, coupled with our strong research and development capabilities, have allowed us to rapidly install our solar cell manufacturing lines and expand our manufacturing capacity. As of the date of this report, we had six solar cell manufacturing lines with an aggregate production capacity of 192 MW per year, assuming the use of 156-millimeter monocrystalline silicon wafers. We plan to increase our aggregate production capacity of solar cells to approximately 320 MW per year, assuming
40
the use of 156-millimeter monocrystalline silicon wafers, by the end of 2008. Our research and development efforts focus on continually enhancing our solar cell conversion efficiencies, which measure the ability of solar power products to convert sunlight into electricity, and improving our manufacturing operations. We commenced commercial production of selective emitter cells in the fourth quarter of 2007. In addition, we are focusing on the development of advanced process technologies for manufacturing new products, such as N-type solar cells, which generally have higher conversion efficiencies than those of P-type solar cells. We also plan to develop passivated emitter and rear cells in the future.
We sold 4.4 MW and 46.4 MW of solar cells in 2005 and 2006, respectively. In 2007, the shipment of our solar power products amounted to 74.0 MW, including 70.0 MW of solar cells sold, 2.4 MW of solar cells processed under OEM arrangements and 1.6 MW of modules sold. We had net revenues of $13.7 million, $149.5 million and $234.9 million in 2005, 2006 and 2007, respectively. We incurred a net loss of $0.3 million in 2005, had a net income of $11.8 million in 2006 and incurred a net loss of $4.9 million in 2007.
We operate and manage our business as a single segment.
The most significant factors that affect our financial performance and results of operations are:
| | • | | availability, price and quality of silicon raw materials, primarily silicon wafers; |
| | • | | manufacturing capacity; |
| | • | | pricing of our solar cells; |
| | • | | pace of advancement in process technologies; and |
| | • | | seasonality of our operations. |
Industry Demand
Our business and revenue growth have been primarily driven by the growing industry demand and our ability to attract new customers and expand our manufacturing capacity at the same time. The solar power market has grown rapidly in the past several years. According to Solarbuzz, the global solar power market, as measured by annual solar power system installed capacities, increased from 598 MW in 2003 to 2,826 MW in 2007, representing a CAGR of 47.4%. Under the lowest of three different projections, Solarbuzz expects that annual solar power system installed capacities will further increase to 6,179 MW in 2012. Solar power industry revenues are expected to increase from $17.2 billion in 2007 to $23.7 billion in 2012, representing a CAGR of 8.3%. We believe that growth in the near term will be constrained by the current shortage of silicon raw materials, but is expected to accelerate after 2008.
We believe that the following factors will continue to drive the growth of the solar power industry:
| | • | | government incentives for solar power; |
| | • | | growing demand for electricity, supply constraints and desire for energy security; and |
| | • | | growing awareness of the advantages of solar power. |
Availability, Price and Quality of Silicon Raw Materials
Silicon wafers are the most important raw material from which our solar cells are made. To manufacture silicon wafers, polysilicon is melted and processed into crystalline silicon ingots, which are then sliced into wafers. There is currently an industry-wide shortage of polysilicon due to the growing demand for solar power products. According to Solarbuzz, the average long-term supply contract price of polysilicon is expected to increase from $60-$65 per kilogram in 2007 to $65-$75 per kilogram in 2008. In addition, spot prices for
41
polysilicon were, in some cases, as high as $400 per kilogram in 2007. Increases in the price of polysilicon have resulted in the increases in the price of silicon wafers. We believe that the average price of polysilicon and silicon wafers will remain at historically high levels or even increase in the foreseeable future until a significant portion of polysilicon manufacturing capacity currently under construction becomes available.
We purchase silicon wafers from wafer manufacturers and trading companies. To address the current shortage of silicon wafers, we also procure polysilicon, silicon ingots and other silicon-based raw materials from various suppliers, and outsource the production of silicon wafers from these raw materials under toll manufacturing arrangements with third parties. Toll manufacturing is a type of contract manufacturing frequently used in the solar power industry, in which part of the manufacturing process is outsourced to qualified third parties, or toll manufacturers. We also secure silicon wafers from some of our customers, and sell solar cells to them in return. Generally, the pricing terms under our framework agreements are to be further negotiated. However, our procurement efforts may not ensure a continuously adequate supply of silicon raw materials at commercially viable prices to meet our solar cell production requirements. See Item 3, “Key Information—Risk Factors—Risks Related to Our Company and Our Industry—The current industry-wide shortage of silicon raw materials may constrain our revenue growth and decrease our gross margins and profitability.” In addition, partly as a result of the industry-wide shortage, we have, from time to time, faced a shortage of silicon raw materials and experienced late or non-delivery from suppliers and have purchased silicon raw materials of lower grade quality that have resulted in lower conversion efficiency and reduced average selling price and revenues.
The procurement costs of silicon raw materials have accounted for a substantial majority of our cost of revenues since we began our commercial production of solar cells in August 2005. Increases in the price of silicon raw materials have previously increased our production costs and may continue to impact our cost of revenues and net income. Partially as a result of such increases, our gross margin decreased from 17.8% in 2006 to 7.7% in 2007.
Given the current state of the industry, suppliers of silicon raw materials typically require customers to make payments in advance of shipment. Our suppliers generally require us to make a prepayment at a certain percentage of the order value prior to shipping. As a result, our purchases of silicon raw materials have required us to make significant working capital commitments, and we are required to manage our borrowings and equity contributions to support our raw material purchases.
The silicon wafers required for the manufacture of N-type solar cells are different from those which are used for the manufacture of P-type solar cells. We cannot assure you that, if we are successful in commencing large-scale commercial production of N-type solar cells, we will be able to obtain adequate supply of such wafers.
Manufacturing Capacity
In order to capture the market opportunity for our solar cell products, we have expanded, and plan to continue to expand, our manufacturing capacity. Increased capacity has had and could continue to have a significant effect on our results of operations, by allowing us to produce and sell more solar cell products generating higher revenues, and by lowering certain manufacturing costs resulting from economies of scale. In June 2005, we completed our first solar cell manufacturing line with a manufacturing capacity of 32 MW per year, and we started generating revenues from the first line in August 2005. We completed our second to sixth solar cell manufacturing lines and started generating revenues from these lines in 2006. We sold 46.4 MW of solar cells in 2006, and in 2007 we shipped 74.0 MW of solar power products including 70.0 MW of solar cells sold, 2.4 MW of solar cells processed under OEM arrangements and 1.6 MW of modules sold. Our net revenues in 2007 amounted to $234.9 million, compared to $149.5 million in 2006.
As of the date of this report, we have six solar cell manufacturing lines with an aggregate manufacturing capacity of 192 MW per year, assuming the use of 156-millimeter monocrystalline silicon wafers. Our actual output of solar cells depends on the size of the silicon wafers that we use; historically, we have used a mix of
42
monocrystalline and multicrystalline silicon wafers, each in sizes of 125 millimeters and 156 millimeters. Our actual output does not match our production capacity because we cannot obtain sufficient supply of 156-millimeter wafers, as most of our suppliers and most of the suppliers in China sell the smaller size. To the extent we use smaller wafers or multicrystalline wafers, our actual production will be less than our production capacity. To capture the expected growth in the industry demand, we are in the process of further expanding our manufacturing capacity of solar cells to approximately 320 MW per year, assuming the use of 156-millimeter monocrystalline silicon wafers, by the end of 2008.
Pricing of Our Solar Cells
Solar cells are priced based on the number of watts of electricity they can generate and on their conversion efficiency. Pricing per watt of solar cells is principally affected by manufacturing costs, including the cost of silicon wafers, and the overall demand. Increased economies of scale and process technologies advancements in the past resulted in a steady reduction in manufacturing costs and the price per watt of solar cells. However, since 2004, price per watt of solar cells began rising gradually due to rapid demand growth worldwide and the resulting shortages of silicon raw materials. Following several years of increases, prices of solar cells declined gradually in early 2007 mainly due to decreases in subsidies or feed-in tariffs in major end-markets of solar power products, such as Germany, as well as increased production output around the world. From the third quarter of 2007, average selling prices of our solar cells have increased due to increasing demand for solar power products and the appreciation of the Renminbi.
We determine the power output of our solar cells based on their size and measured conversion efficiencies. We determine the price per watt of our solar cells based on the prevailing market prices when we enter into sales contracts with our customers or when our customers place purchase orders with us, taking into account the size of the contract or the purchase order, the strength, history and prospects of our relationship with the customer and our costs. Most of our customers pay premiums over the price of standard P-type cells for our selective emitter solar cells due to their higher conversion efficiency rates. The average selling prices of our solar cells were $3.22 per watt and $2.92 per watt in 2006 and 2007, respectively.
Pace of Advancement in Process Technologies
Our cell products are priced based on the number of watts of electricity they can generate. Process technologies advancement is important because it helps increase conversion efficiencies of solar cells, thereby generating higher revenues per solar cell, and helps reduce the manufacturing cost of solar cells per watt. As a result, solar cell manufacturers, ourselves included, are continuously developing advanced process technologies for large-scale manufacturing.
We commenced commercial production of selective emitter cells, an improved version of the P-type solar cells that most solar cell manufacturers produce, in the fourth quarter of 2007. We began pilot production of HP cells during the same quarter. In addition, we are focusing on the development of advanced process technologies for manufacturing new products, such as N-type solar cells, which generally have higher conversion efficiencies than those of P-type solar cells.
Seasonality of Our Operations
We believe that industry demand for solar power products may be affected by seasonality. Demand tends to be lower during the winter season from December to February, primarily because of adverse weather conditions in certain regions, which complicate the installation of solar power systems. Furthermore, as there are fewer working days for our China-based customers during Chinese New Year holidays, usually in January or February, our sales volumes and revenues tend to be lower during these periods. In addition, the prices of silicon raw materials also tend to decrease during such periods.
43
Overview of Financial Results
We evaluate our business using a variety of key financial measures.
Net Revenues
Our net revenues are net of value-added tax. Factors affecting our net revenues include average selling price per watt, unit volume sold and product demand for our solar cells. In addition to sale of solar cells, in 2007 we derived revenues from selling silicon raw materials under our buy-and-sell arrangements with silicon wafer manufacturers and selling those raw materials that we could not use. We also outsource to third parties the manufacturing of solar modules from our solar cells or purchase solar modules from third parties, and sell these solar modules to our customers.
We began commercial shipment of solar cells in August 2005. Due to our limited output, we sold solar cells to a small number of customers in 2005. In 2006 and 2007, customers contributing 10% or more of our total net sales accounted for approximately 53.1% and 41.3% of our total net revenues, respectively. Each of Wuxi Guofei Green Energy Source Co., Ltd. and aleo solar AG contributed over 10% of net revenues for the year ended December 31, 2007.
The following table sets forth by region our total net revenues derived from sales of our products for the periods indicated:
| | | | | | | | | | | | | | | | | | |
| | | Year Ended December 31, | |
| | | 2005 | | | 2006 | | | 2007 | |
| | | (in thousands, except percentages) | |
Europe: | | | | | | | | | | | | | | | | | | |
—Germany | | $ | 173 | | 1.2 | % | | $ | 15 | | — | | | $ | 62,314 | | 26.5 | % |
—Italy | | | — | | — | | | | 12,235 | | 8.2 | % | | | 8,980 | | 3.8 | |
—Netherlands | | | 7 | | 0.1 | | | | 8,957 | | 6.0 | | | | — | | — | |
—Others | | | — | | — | | | | 175 | | 0.1 | | | | 1,803 | | 0.8 | |
Europe Total | | | 180 | | 1.3 | | | | 21,382 | | 14.3 | | | | 73,097 | | 31.1 | |
PRC | | | 13,487 | | 98.1 | | | | 119,238 | | 79.7 | | | | 151,058 | | 64.3 | |
South Africa | | | 6 | | — | | | | 3,712 | | 2.5 | | | | 83 | | — | |
South Korea | | | — | | — | | | | 3,183 | | 2.1 | | | | 6,419 | | 2.8 | |
Others | | | 77 | | 0.6 | | | | 2,006 | | 1.4 | | | | 4,251 | | 1.8 | |
Total net revenues | | $ | 13,750 | | 100.0 | % | | $ | 149,521 | | 100.0 | % | | $ | 234,908 | | 100 | % |
Cost of Revenues and Operating Expenses
The following table sets forth our cost of revenues and our operating expenses as a percentage of our total net revenues for the periods indicated.
| | | | | | | | | |
| | | Year Ended December 31, | |
| | | 2005 | | | 2006 | | | 2007 | |
Cost of revenues | | 85.8 | % | | 82.2 | % | | 92.3 | % |
Operating expenses: | | | | | | | | | |
Selling expenses | | 0.3 | | | 0.7 | | | 0.7 | |
General and administrative expenses | | 11.5 | | | 6.6 | | | 5.8 | |
Research and development expenses | | 0.4 | | | 0.4 | | | 1.1 | |
| | | | | | | | | |
Total operating expenses | | 12.2 | % | | 7.7 | % | | 7.6 | % |
| | | | | | | | | |
44
Since we began commercial shipment of solar cells, our cost of revenues has stayed relatively flat and later decreased as a percentage of our total net revenues in 2005 and 2006 as we have been able to offset increases in silicon raw material costs, to a large extent, by increasing the prices of our solar cells, and to a lesser extent, by improving our process technologies and enhancing our economies of scale. However, our cost of revenues significantly increased as a percentage of our total net revenues in 2007, primarily due to the rising prices of silicon raw materials as a result of the industry-wide shortage of polysilicon and the decreases in the prices of off-specification solar cells.
Our operating expenses include general and administrative expenses, selling expenses and research and development expenses. In November 2004, Sunergy Nanjing amended its articles of association to effectively reduce the cash contribution requirement of certain of its shareholders, who were also our directors and officers. We accounted for this as forgiveness of shareholder receivables from certain shareholders of Sunergy Nanjing and recorded a non-cash compensation charge of approximately $0.8 million. Furthermore, in March 2006, two shareholders of Sunergy Nanjing transferred a 10% equity interest in Sunergy Nanjing to Sunergy Nanjing’s other shareholders, who were also our directors and employees, and we accounted these transactions as a non-pro rata dividend distribution to the transferees. As a result, we recorded a non-cash compensation charge of approximately $3.7 million, equal to the fair value of the interest a transferee, Dr. Jianhua Zhao, our then president, received in excess of what he would have received had the distribution been made on a pro rata basis. In March 2006, Sunergy Nanjing also amended its articles of association to effectively reduce the cash contribution requirements on certain of its shareholders, who were also our directors and executive officers. We accounted for this as forgiveness of shareholder receivables from certain shareholders of Sunergy Nanjing and recorded a non-cash compensation charge of approximately $0.5 million. In the fourth quarter of 2006, we also recorded share-based compensation expenses of $0.1 million in connection with the grants of share options to certain employees.
Our total operating expenses as a percentage of our total net revenues fell from 12.2% in 2005 to 7.7% in 2006, as we ramped up production on lines two through six, and remained relatively flat through 2007, at 7.6%.
Cost of Revenues
Our cost of revenues consists primarily of:
| | • | | Direct raw materials. Silicon raw materials, primarily in the form of silicon wafers, comprise a substantial majority of our cost of revenues. We expect our expenditures for silicon raw materials to continue to increase due to increases in the quantity of silicon raw materials we will need following the expansion of our manufacturing capacity and increases in the prices of silicon raw materials. In addition to silicon raw materials, direct raw materials involved in our production also include metallic paste and chemicals. |
| | • | | Direct labor. Direct labor costs include salaries and benefits for manufacturing personnel. We expect direct labor costs to increase as we hire additional manufacturing personnel following the expansion of our manufacturing capacity. |
| | • | | Overhead. Overhead costs include maintenance, utilities such as electricity and water used in manufacturing, and other support expenses associated with the manufacturing. |
| | • | | Depreciation and amortization of manufacturing facilities and equipment. Due to our capacity expansion, our depreciation and amortization expenses have increased. We expect depreciation to increase in absolute terms in the future as we continue to expand our manufacturing capacity. |
| | • | | Warranty costs.With respect to solar cell sales made with contractual warranty provisions, we accrue 0.5% of our net revenues as warranty costs at the time revenue is recognized. Our sales contracts concluded after December 2006 do not contain warranty provisions, which we believe is in line with the practice of other solar cell manufacturers in China. We do not expect to enter into solar cell sales |
45
| | contracts with warranty provisions in the future. We still accrue warranty costs for deliveries of solar cells under the contracts concluded before December 2006. With respect to solar modules, which are typically sold with a two-year warranty for defects in material and workmanship and a minimum power output warranty of up to 25 years following the date of purchase, we accrue 1.0% of our net revenues generated from module sales based on our competitors’ accrual history and industry practice. |
| | • | | Shipping and handling costs. Cost of revenues also includes shipping and handling costs of products bought from suppliers or sold to customers. |
General and Administrative Expenses
General and administrative expenses consist primarily of salaries and benefits for our administrative and finance and human resources personnel, expenses associated with our administrative offices, professional advisory fees and other compliance-related costs, bad debt provision as well as depreciation of equipment used for administrative purposes. Pursuant to PRC law, our board of directors has the discretion to allocate a portion of our after-tax profit to staff welfare and bonus funds, which may not be distributed to equity owners.
General and administrative expenses account for the largest part of our operating expenses. In 2006 and 2007, we also recorded share-based compensation expenses of $0.1 million and $0.5 million, respectively, in connection with the grants of share options to certain employees. Since 2004, our general and administrative expenses increased due to higher salaries, benefits, depreciation and other administrative costs we have incurred as a result of the expansion of our manufacturing capacity and sales volume. In 2007, the increase of our general and administrative expenses also increased as we hired additional personnel and incurred expenses to support our operations as a public company, including compliance-related costs.
Selling Expenses
Selling expenses consist primarily of post-sale service expenses, sales employee salaries, travel and entertainment expenses, freight expenses, and other sales and marketing expenses.
We expect that our selling expenses will increase in absolute terms in the near term as we increase our sales efforts, hire additional sales personnel, develop new markets and initiate additional marketing programs to establish our brand name.
Research and Development Expenses
Research and development expenses consist primarily of salaries and benefits for research and development personnel. Since the third quarter of 2006, our research and development expenses have also included costs of raw materials used in our research and development activities, and prototype costs and depreciation of equipment related to the design, development, testing and enhancement of our products and manufacturing processes. We expect our research and development expenses to increase as we plan to hire additional personnel for the research and development of our process technologies.
Share-based Compensation Expenses
In 2006 and 2007, we entered into option award agreements pursuant to our share incentive plan. Under these option award agreements, we had outstanding options to purchase 1,586,900 ordinary shares as of December 31, 2007. See Item 6, “Directors, Senior Management and Employees—Compensation of Directors and Executive Officers—Share Incentive Plan.” Changes in the amount of share-based compensation will primarily affect our general and administrative expenses, reported net income and earnings per share.
Under Statement of Financial Accounting Standard No. 123R, “Share-Based Payment,” or SFAS No. 123R, which became effective on January 1, 2006, we are required to recognize share-based compensation as
46
compensation expense in our statement of operations based on the fair value of equity awards on the grant date, with the compensation expense recognized over the period in which the recipient is required to provide service in exchange for the award (usually the vesting period). This statement also requires us to adopt a fair value-based method of measuring the compensation expense related to share-based compensation. For options granted to employees, we record share-based compensation expenses for the fair value of the options at the grant date. We recognize such share-based compensation expenses over the vesting period of the options.
As of December 31, 2007, there was $1,856,288 in total unrecognized compensation expense related to unvested share-based compensation arrangements granted under the plan, which is expected to be recognized over a weighted-average period of 2.88 years.
Beneficial Conversion Feature
To be consistent with our audited financial statements, all historical share information, per-share and conversion price information contained in the following two paragraphs has been retroactively adjusted to reflect a 100-for-one share split that became effective on April 24, 2007.
In 2006, we issued Series A, Series B and Series C preferred shares, all of which have automatically converted upon the completion of our initial public offering into the number of ordinary shares equal to the quotient of (a) the original subscription price plus all accrued and unpaid dividends, divided by (b) the conversion price, which initially equaled the original subscription price, subject to adjustments in the case of certain dilution events. The conversion prices were subject to certain earnings-based adjustments in the event our 2006 and 2007 net earnings, as defined in our then amended and restated memorandum of association, should be less than a predefined amount. For each of the preferred shares, we recognized an initial beneficial conversion feature, or BCF, based on the conversion price that would be in effect assuming we would not generate any additional income or issue any additional ordinary shares or other dilutive securities after the date of issuance. As of the Series A, Series B and Series C issuance dates, our earnings were below the pre-defined amounts. As such, we assumed that if there are no changes to the current circumstances other than the passage of time, the conversion price would be (a) approximately $0.0001 per share for both the Series A and Series B shares as there was no floor on the conversion price adjustment, and (b) $1.76 for the Series C shares, representing the adjustment floor (collectively the “Effective Conversion Price”). Based on this, we recorded a BCF, limited to proceeds received upon issuance, for the Series A, Series B and Series C preferred shares of $13,110,400, $27,999,948 and $6,941,170, respectively, during the year ended December 31, 2006. This amount was amortized immediately as a dividend to holders of the preferred shares as the preferred shares were convertible upon issuance.
As our 2006 net earnings were less than the pre-defined earnings target, the conversion prices of the Series A and Series B preferred shares were adjusted to $0.39 and $0.44, respectively (collectively the “Adjusted Conversion Price”), effective December 31, 2006. The Adjusted Conversion Price was greater than the Effective Conversion Price, resulting in an adjusted BCF (intrinsic value) that is lower than the BCF (intrinsic value) recognized at issuance of the Series A and Series B preferred shares. As the BCF had been fully amortized and there was no incremental BCF to recognize based on the Adjusted Conversion Price, no further adjustments were required.
Taxation
Under the current laws of the Cayman Islands and the British Virgin Islands, we and Sunergy BVI are not subject to income or capital gains tax. Additionally, dividend payments made by us and Sunergy BVI are not subject to withholding tax in those jurisdictions.
47
Under the current Hong Kong Inland Revenue Ordinance, Sunergy Hong Kong is subject to 17.5% income tax on its taxable income generated from operations in Hong Kong. Additionally, payments of dividends by Sunergy Hong Kong to us are not subject to any Hong Kong withholding tax.
Pursuant to the New EIT Law and the Implementing Regulation, both of which became effective on January 1, 2008, dividends generated after January 1, 2008 and payable by a foreign-invested enterprise to its foreign investors will be subject to a 10% withholding tax if the foreign investors are considered as non-resident enterprises without any establishment or place within China or if the dividends payable have no connection with the establishment or place of the foreign investors within China, unless any such foreign investor’s jurisdiction of incorporation has a tax treaty with China that provides for a reduced withholding arrangement. The Cayman Islands, where we are incorporated, does not have such a tax treaty with China. Sunergy Hong Kong, our wholly owned subsidiary and the direct holder of 100% equity interest in Sunergy Nanjing, is incorporated in Hong Kong. According to the Mainland and Hong Kong Special Administrative Region Arrangement on Avoiding Double Taxation or Evasion of Taxation on Income agreed between China and Hong Kong, dividends paid by a foreign-invested enterprise in China to its direct holding company in Hong Kong will be subject to withholding tax at a rate of no more than 5% (if the foreign investor owns directly at least 25% of the shares of the foreign-invested enterprise). Under the New EIT Law and the Implementing Regulation, if we and Sunergy Hong Kong were regarded as a resident enterprise, the dividends payable to Sunergy Hong Kong from Sunergy Nanjing would be exempt from the PRC income tax. If Sunergy Hong Kong is regarded as a non-resident enterprise, and therefore would be subject to a 5% withholding tax for any dividends payable to it from Sunergy Nanjing, the amount of funds available to us to meet our cash requirements, including the payment of dividends to our shareholders and debt service on any debt we may incur through our Cayman holding company, could be materially reduced.
PRC Enterprise Income Tax
Up through December 31, 2007, a foreign-invested enterprise in China was typically subject to enterprise income tax at the rate of 30% on taxable income and local income tax at the rate of 3% on taxable income. Sunergy Nanjing, a foreign-invested enterprise engaged in a manufacturing business and established in Nanjing, which is within a coastal economic zone, was entitled to a preferential enterprise income tax rate of 24%. As a wholly foreign owned enterprise engaged in a manufacturing business, Sunergy Nanjing was also entitled to a two-year exemption from enterprise income tax for its first two profitable years of operation, which were 2006 and 2007, and to a 50% reduction of its applicable income tax rate for the succeeding three years, which would be 2008, 2009 and 2010. On March 16, 2007, the National People’s Congress issued the New EIT Law, under which foreign-invested enterprises and domestic companies would be subject to enterprise income tax at a uniform rate of 25%. On December 6, 2007, the Congress also adopted its Implementing Regulation. On December 26, 2007, State Council of China promulgated the circular on implementation of enterprise tax transition preferential policy, or the Circular. Under the New EIT Law, the Implementing Regulation and the Circular, enterprises that were established and already enjoyed preferential tax treatments before March 16, 2007 will continue to enjoy them (i) in the case of preferential tax rates, for a period of five years from January 1, 2008, and the enterprises that previously enjoy the tax rate of 24% shall be subject to the tax rate of 25% as of 2008, and (ii) in the case of preferential tax exemption or reduction for a specified term, until the expiration of such term. The New EIT Law and its Implementing Regulation have become effective on January 1, 2008. Therefore, we are subject to an applicable income tax rate of 12.5% in 2008, 2009 and 2010.
We were in a tax loss position under PRC tax law in 2004, 2005 and 2007, and thus were not subject to any enterprise income tax during these periods.
Critical Accounting Policies
We prepare financial statements in accordance with U.S. GAAP, which requires us to make judgments, estimates and assumptions that affect (a) the reported amounts of our assets and liabilities, (b) the disclosure of
48
our contingent assets and liabilities at the end of each fiscal period and (c) the reported amounts of revenues and expenses during each fiscal period. We continually evaluate these estimates based on our own historical experience, knowledge and assessment of current business and other conditions, our expectations regarding the future based on available information and reasonable assumptions, which together form our basis for making judgments about matters that are not readily apparent from other sources. Since the use of estimates is an integral component of the financial reporting process, our actual results could differ from those estimates. Some of our accounting policies require a higher degree of judgment than others in their application.
When reviewing our financial statements, you should consider (a) our selection of critical accounting policies, (b) the judgment and other uncertainties affecting the application of such policies and (c) the sensitivity of reported results to changes in conditions and assumptions. We believe the following accounting policies involve the most significant judgment and estimates used in the preparation of our financial statements.
Revenue Recognition
We recognize revenue for product sales when persuasive evidence of an arrangement exists, delivery has occurred, the fee is fixed or determinable, and collectibility is reasonably assured. A portion of our sales to customers require the customers to prepay before delivery has occurred. Such prepayments are recorded as advances from customers, in the consolidated balance sheets, until delivery has occurred. Processing fees we receive under OEM arrangements are subject to the same policy. A majority of our contracts with overseas customers are written such that the customer takes title and assumes the risks and rewards of ownership of the products upon shipment. Accordingly, with respect to our overseas sales, we recognize revenue upon documentary evidence of shipment, assuming all other criteria have been met.
Warranty Costs
Historically, some of our sales contracts with overseas customers provided for a 10- or 20-year warranty for the performance of our solar cells against declines in certain technical specifications, primarily the minimum power generation capacity specified at the time of delivery. We also sell our module products to customers along with a warranty on the performance of solar module products at certain levels of conversion efficiency for an extended period. Our solar modules are typically sold with a 25-year warranty against specified declines in the initial minimum power generation capacity at the time of sale. In addition, we provided warranty for our solar modules against defects in materials and workmanship for a period two years from the date of sale. We, therefore, maintain warranty reserves (recorded as accrued warranty costs) to cover potential liabilities that could arise from these warranties. We accrue the estimated costs of warranties at 0.5% of our solar cell sales made with warranty provisions and 1.0% of our solar module sales, respectively, and include that amount in our selling expenses. Due to limited warranty claims to date, we accrue the estimated costs of warranties based primarily on an assessment of our competitors’ accrual history and industry practice. Although we conduct quality testing and inspection of our solar cell products, our solar cell products have not been tested in an environment simulating the up to 20-year warranty periods. We have not experienced any material warranty claims to date in connection with declines of the power generation capacity or other technical specifications of our solar cells or solar modules. We will prospectively revise our actual rate to the extent that actual warranty costs differ from the estimates.
Valuation of Share-based Compensation
We account for share-based compensation to our employees based on SFAS No. 123R and record compensation expense based on the fair value of the options and other awards on the date of grant.
In 2006 and 2007, we granted share options to certain of our employees. We incurred share-based compensation expenses of $0.1 million and $0.5 million for the years ended December 31, 2006 and 2007, respectively. We used the binomial option-pricing method to determine the amount of employee share-based
49
compensation expenses. This approach requires us to make assumptions on such variables as share price volatility, expected lives of options and discount rates. Changes in these assumptions could significantly affect the amount of employee share-based compensation expenses we recognize in our consolidated financial statements. See Item 5, “—Overview of Financial Results—Share-based Compensation Expenses.”
In November 2007, we modified the exercise price of all the options granted in 2006 from $1.988 to $1.283 per ordinary share. The total incremental compensation expense resulting from the modification was $139,600, which will be amortized over the remaining requisite service period of 2.95 years.
Inventories
We state inventory at the lower of cost or market value. Cost is determined using the weighted-average method. Cost consists of direct materials, direct labor and those overhead costs that have been incurred in bringing the inventories to their present location and conditions. Adjustments are recorded to write down the cost of obsolete and excess inventory to the estimated market value based on historical and forecast demand.
Income Taxes
We recognize deferred income taxes for temporary differences between the tax basis of assets and liabilities and their reported amounts in the financial statements, net operating loss carry forwards and credits by applying enacted statutory tax rates applicable to future years. We reduce deferred tax assets by a valuation allowance when, in our opinion, it is more likely than not that some portion or all of the deferred tax assets will not be realized. We provide for current income taxes in accordance with the laws of the relevant taxing authorities. The components of the deferred tax assets and liabilities are individually classified as current and non-current based on the characteristics of the underlying assets and liabilities, or the expected timing of their use when they do not relate to a specific asset or liability.
50
Results of Operations
The following table sets forth a summary, for the periods indicated, of our consolidated results of operations, with each item expressed as a percentage of our total net revenues. Our limited operating history makes the prediction of future operating results very difficult. Period-to-period comparisons of our operating results should not be relied upon as indicative of future performance. Item 3 “Key Information—Risk Factors—Risks Related to Our Company and Our Industry—Our limited operating history may not serve as an adequate measure of our future prospects and results of operations.”
| | | | | | | | | | | | | | | | | | | | | |
| | | Year Ended December 31, | |
| | | 2005 | | | 2006 | | | 2007 | |
| | | (in thousands, except percentages) | |
Net revenues | | $ | 13,750 | | | 100.0 | % | | $ | 149,521 | | | 100.0 | % | | $ | 234,908 | | | 100.0 | % |
Cost of revenues | | | (11,796 | ) | | (85.8 | ) | | | (122,889 | ) | | (82.2 | ) | | | (216,881 | ) | | (92.3 | ) |
| | | | | | | | | | | | | | | | | | | | | |
Gross profit | | | 1,954 | | | 14.2 | | | | 26,632 | | | 17.8 | | | | 18,027 | | | 7.7 | |
Operating expenses | | | | | | | | | | | | | | | | | | | | | |
Selling expenses | | | (38 | ) | | (0.3 | ) | | | (1,014 | ) | | (0.7 | ) | | | (1,644 | ) | | (0.7 | ) |
General and administrative expenses | | | (1,584 | ) | | (11.5 | ) | | | (9,901 | ) | | (6.6 | ) | | | (13,664 | ) | | (5.8 | ) |
Research and development expenses | | | (49 | ) | | (0.4 | ) | | | (546 | ) | | (0.4 | ) | | | (2,555 | ) | | (1.1 | ) |
| | | | | | | | | | | | | | | | | | | | | |
Total operating expenses | | | (1,671 | ) | | (12.2 | ) | | | (11,461 | ) | | (7.7 | ) | | | (17,863 | ) | | (7.6 | ) |
Income from operations | | | 283 | | | 2.0 | | | | 15,171 | | | 10.1 | | | | 164 | | | 0.1 | |
Interest expense | | | (620 | ) | | (4.4 | ) | | | (3,002 | ) | | (2.0 | ) | | | (7,394 | ) | | (3.2 | ) |
Interest income | | | 113 | | | 0.8 | | | | 420 | | | 0.3 | | | | 1,577 | | | 0.7 | |
Other (expense) income | | | (163 | ) | | (1.2 | ) | | | (845 | ) | | (0.5 | ) | | | 93 | | | 0.0 | |
| | | | | | | | | | | | | | | | | | | | | |
(Loss) income before income taxes | | | (387 | ) | | (2.8 | ) | | | 11,744 | | | 7.9 | | | | (5,560 | ) | | (2.4 | ) |
Tax benefit | | | 80 | | | 0.6 | | | | 70 | | | — | | | | 705 | | | 0.3 | |
| | | | | | | | | | | | | | | | | | | | | |
Net (loss) income | | $ | (307 | ) | | (2.2 | )% | | $ | 11,814 | | | 7.9 | | | $ | (4,855 | ) | | (2.1 | ) |
Dividend on Series A redeemable convertible preferred shares | | | — | | | — | | | | (13,377 | ) | | (8.9 | ) | | | (155 | ) | | (0.1 | ) |
Dividend on Series B redeemable convertible preferred shares | | | — | | | — | | | | (28,552 | ) | | (19.1 | ) | | | (330 | ) | | (0.1 | ) |
Dividend on Series C redeemable convertible preferred shares | | | — | | | — | | | | (7,097 | ) | | (4.7 | ) | | | (233 | ) | | (0.1 | ) |
| | | | | | | | | | | | | | | | | | | | | |
Net loss attributable to holders of ordinary shares | | $ | (307 | ) | | (2.2 | )% | | $ | (37,212 | ) | | (24.9 | )% | | $ | (5,573 | ) | | (2.4 | )% |
| | | | | | | | | | | | | | | | | | | | | |
Year Ended December 31, 2007 Compared to Year Ended December 31, 2006
Net Revenues.Our total net revenues increased by $85.4 million, from $149.5 million in 2006 to $234.9 million in 2007. Our net revenues increased primarily due to an increase in the volume of the solar power products we sold.
In 2007, we shipped 74.0 MW of solar power products, including 2.4 MW of solar cells processed under OEM arrangements and 1.6 MW of solar modules, compared to our 46.4 MW of solar cell sales in 2006. The increase in our sales of solar power products was due to the expansion of our manufacturing capacity and production output. Our average selling price decreased from $3.22 per watt in 2006 to $2.92 per watt in 2007 due primarily to lower selling prices for off-specification cells and to decreases in subsidies or feed-in tariffs in major end-markets of solar power products, such as Germany, as well as increased production around the world.
Cost of Revenues. Our cost of revenues increased by $94.0 million, from $122.9 million in 2006 to $216.9 million in 2007. Our cost of revenues increased primarily due to the rapid expansion of our manufacturing capacity and output and the rising prices of silicon raw materials due to the industry-wide shortage of polysilicon.
51
Silicon raw materials, primarily silicon wafers, accounted for 89.9% of our cost of revenue in 2007 compared to 91.9% in 2006. As a percentage of our total net revenues, our cost of revenues increased from 82.2% in 2006 to 92.3% in 2007.
Gross Profit. Our gross profit in 2007 decreased by $8.6 million to $18.0 million, from $26.6 million in 2006. Our gross margin decreased from 17.8% in 2006 to 7.7% in 2007. The decrease was primarily attributable to a decrease in our average selling prices of solar cells, partly as a result of lower selling prices for off-specification cells, and the rising prices of silicon raw materials.
Operating Expenses. Our operating expenses increased by $6.4 million, from $11.5 million in 2006 to $17.9 million in 2007. The increase in operating expenses was due to increases in general and administrative expenses, selling expenses and research and development expenses. As a percentage of our total net revenues, operating expenses stayed relatively flat at 7.6% in 2007, compared to 7.7% in 2006.
General and administrative expenses. Our general and administrative expenses increased by $3.8 million, from $9.9 million in 2006 to $13.7 million in 2007. The increase in our general and administrative expenses was due primarily to increases in salaries and benefits for our administrative, finance and human resources personnel as we hired more personnel to manage our growing business, and also due to an increase in bad debt provision.
Selling expenses. Our selling expenses increased by $0.6 million from $1.0 in 2006 to $1.6 million in 2007, due primarily to increases in sales employee salaries, travel expenses and freight expenses. With the growth of our net revenues, selling expenses as a percentage of net revenues stayed relatively flat in 2007 compared to 2006.
Research and development expenses. Research and development expenses increased by $2.0 million from $0.5 in 2006 to $2.5 million in 2007. The increase in research and development expenses was due primarily to an increase in costs of raw materials used in our research and development activities, our payment of service fees to New South Innovations Pty Limited under a collaborative research agreement, an increase in salaries and benefits for research and development personnel and depreciation of equipment related to the design, development, testing and enhancement of our products and manufacturing processes.
Interest Expense and Interest Income. Our interest expenses increased from $3.0 million in 2006 to $7.4 million in 2007. The increase in our interest expenses was due to an increase in our bank borrowings. Our interest income increased from $0.4 million in 2006 to $1.6 million in 2007, due primarily to an increase in our cash balances after the completion of our initial public offering.
Net Income (Loss). As a result of the foregoing, we incurred a net loss of $4.9 million in 2007, compared to net income of $11.8 million in 2006.
Year Ended December 31, 2006 Compared to Year Ended December 31, 2005
Net Revenues.Our total net revenues increased by $135.8 million, from $13.7 million in 2005 to $149.5 million in 2006. Our net revenues increased primarily due to an increase in the volume of the solar cells we sold, as well as an increase in the average selling price of our solar cells.
The volume of the solar cells we sold increased from 4.4 MW in 2005 to 46.4 MW in 2006 due to the expansion of our manufacturing capacity. We completed our second to sixth solar cell manufacturing lines in 2006, and thus our manufacturing capacity increased from 32 MW per year to 192 MW per year, assuming the use of 156-millimeter monocrystalline silicon wafers, during 2006. In addition, our average selling price rose from $3.10 per watt in 2005 to $3.22 per watt in 2006 due to strong global demand for solar power products, as well as our ability to pass through higher silicon raw material prices.
52
Cost of Revenues. Our cost of revenues increased by $111.1 million, from $11.8 million in 2005 to $122.9 million in 2006. Our cost of revenues increased primarily due to the rapid expansion of our manufacturing capacity and output. The increase in our cost of revenues was also impacted by the rising prices of silicon raw materials due to the industry-wide shortage of polysilicon. Further, as our second to sixth solar cell manufacturing lines were installed in 2006, our depreciation costs increased during 2006.
Silicon raw materials, primarily silicon wafers, accounted for 91.9% of our cost of revenue in 2006. As a percentage of our total net revenues, our cost of revenues decreased from $85.8% in 2005 to $82.2% in 2006. The decrease was due to our ability to increase our selling price to pass through higher silicon raw material costs, and was also due to cost-saving from improving our process technologies and enhancing our economies of scale.
Gross Profit. As a result of the foregoing, our gross profit in 2006 increased by $24.6 million to $26.6 million, from $2.0 million in 2005. Our gross margin increased from 14.2% to 17.8% during the same periods.
Operating Expenses. Our operating expenses increased by $9.8 million, from $1.7 million in 2005 to $11.5 million in 2006. The increase in operating expenses was due to increases in selling expenses, general and administrative expenses and research and development expenses. As a percentage of total net revenues, operating expenses decreased from 12.2% in 2005 to 7.7% in 2006. The decrease was due to the substantial growth of our net revenues resulted from our expansion of manufacturing capacity and output and strong market demand, outpacing the growth of our operating expenses.
General and administrative expenses. Our general and administrative expenses increased by $8.3 million, from $1.6 million in 2005 to $9.9 million in 2006. In March 2006, two shareholders of Sunergy Nanjing transferred a 10% equity interest in Sunergy Nanjing to Sunergy Nanjing’s other shareholders, who were also our directors and employees, and we accounted these transactions as a non-pro rata dividend distribution to the transferees. As a result, we recorded a non-cash compensation charge of approximately $3.7 million, equal to the fair value of the interest a transferee, Dr. Jianhua Zhao, our then president, received in excess of what he would have received had the distribution been made on a pro rata basis. In March 2006, Sunergy Nanjing also amended its articles of association to effectively reduce the cash contribution requirements on certain of its shareholders, who were also our directors and officers. We accounted for this as forgiveness of shareholder receivables from certain shareholders of Sunergy Nanjing and recorded a non-cash compensation charge of approximately $0.5 million. In the fourth quarter of 2006, we also recorded share-based compensation expenses of $0.1 million in connection with the grants of share options to certain employees. The increase in our general and administrative expenses was due primarily to such compensation expenses, and also due to increases in salaries and benefits for our administrative, finance and human resources personnel as we hired more personnel after our expansion of manufacturing capacity and output.
Selling expenses. Our selling expenses increased by $1.0 million from $38,000 in 2005 to $1.0 million in 2006, due primarily to increases in post-sale service expenses, sales employee salaries and other sales and marketing expenses. Selling expenses as a percentage of net revenues increased from 0.3% to 0.7% during the same periods. However, compared to our net revenues, our selling expenses are still not significant. Due to the strong global demand for solar cell products, we achieved the growth of our sales with relatively low selling expenses.
Research and development expenses. Research and development expenses increased by $0.5 million from $49,000 in 2005 to $0.5 million in 2006. The increase in research and development expenses was due primarily to our payment of service fees to New South Innovations Pty Limited under a collaborative research agreement and the increase in costs of raw materials used in our research and development activities, and prototype costs and depreciation of equipment related to the design, development, testing and enhancement of our products and manufacturing processes.
Interest Expenses. Our interest expenses increased from $0.6 million in 2005 to $3.0 million in 2006. The increase in our interest expenses was due to an increase in our short-term borrowings.
53
Net Income (Loss). As a result of the foregoing, we had a net income of $11.8 million in 2006 compared to a net loss of $0.3 million in 2005. In 2006, our net margin was 7.9%.
| B. | Liquidity and Capital Resources |
Cash Flows and Working Capital
To date, we have financed our operations primarily through cash flows from equity contributions by our shareholders, operations, short-term borrowings and term loans.
As of December 31, 2005, 2006 and 2007, we had $2.8 million, $14.7 million and $60.5 million, respectively, in cash and cash equivalents, and $30.4 million, $77.9 million and $121.8 million, respectively, in outstanding borrowings. As of December 31, 2005, 2006 and 2007, $21.7 million, $77.9 million and $121.8 million, respectively, of our outstanding borrowings were due within one year. These borrowings expire at various times throughout the year. Our cash and cash equivalents primarily consist of cash on hand and demand deposits placed with banks. Our short-term borrowings outstanding as of December 31, 2005, 2006 and 2007 bore an average interest rate of 5.67%, 5.93% and 6.27%, respectively.
We had $8.7 million, nil and nil of long-term borrowings as of December 31, 2005, 2006 and 2007, respectively. On November 18, 2004, we entered into an agreement for a facility with a maximum borrowing amount of $6.1 million, of which $1.8 million was drawn on November 25, 2004, and the remaining $4.3 million was drawn on January 4, 2005. This facility had a three-year term and bore an interest rate of 6.34%. We borrowed another term loan with an amount of approximately $2.5 million in October 2005, with an interest rate of 6.34%. We repaid these loans in 2007. See Item 3, “Key Information—Risk Factors—Risks Related to Our Company and Our Industry—We have significant outstanding bank borrowings, and we may not be able to arrange adequate financing when they mature or may encounter other difficulties in maintaining liquidity.” We have historically been able to repay our borrowings as they became due from capital contributions from our shareholders, proceeds from short-term and long-term borrowings and our operating cash flows.
As of December 31, 2007, approximately $28.7 million and $16.4 million of the above borrowings have been secured by the pledge of our raw materials and off-shore standby letters of credit, respectively. The remaining short-term borrowings have been guaranteed by China Electric Equipment Group Co., Ltd., an entity controlled by Mr. Tingxiu Lu, our chairman, and Wuxi Guofei Green Energy Source Co., Ltd., one of our major customers. In an agreement between Sunergy Nanjing and CEEG dated December 18, 2006, CEEG had undertaken to guarantee the bank borrowings of Sunergy Nanjing for up to RMB1 billion, subject to adjustment in the event of the material change of CEEG’s credit or operation status, for one year after our initial public offering. In May 2008, Sunergy Nanjing and CEEG signed an agreement to further extend the term of the above agreement to May 16, 2010.
We historically used cash advances from related parties to meet some of our temporary liquidity needs. We have fully repaid such cash advances as of September 30, 2006, and we do not expect to borrow cash advances from related parties in the future.
We have significant working capital commitments because suppliers of silicon wafers and other silicon-based raw materials require us to make prepayments in advance of shipment. Due to the industry-wide shortage of silicon raw materials, working capital and access to financings for the purchase of silicon raw materials are critical to growing our business. Our advances to suppliers increased significantly from $17.4 million as of December 31, 2005 to $26.3 million as of December 31, 2006 and further increased significantly to $79.9 million as of December 31, 2007 due primarily to the growth of our solar cell business.
54
Inventories, one of the principal components of our current assets, increased significantly from $6.6 million as of December 31, 2005 to $44.3 million as of December 31, 2006 and further increased to $56.1 million as of December 31, 2007, due to increased production volume. We expect that our inventories will continue to increase as our net revenues increase.
We generally require customers to make prepayment before delivery. However, depending on their credit history with us, we historically granted our large customers credit terms of one to three months. The credit terms we grant have been shortened to within one month, according to our current credit policy. Our accounts receivable decreased from $43.0 million as of December 31, 2006 to $26.8 million as of December 2007. The decrease in our accounts receivable was primarily due to payment we received for deliveries previously made and the shorter credit term we granted to our customers in 2007 as compared to 2006. Our accounts receivable increased from $1.7 million as of December 31, 2005 to $43.0 million as of December 31, 2006, as we granted credit terms from one to three months for sales to our large customers, especially our top three customers in 2006, and our sales volumes increased in 2006 compared to 2005.
The following table sets forth a summary of our cash flows for the periods indicated:
| | | | | | | | | | | | |
| | | Year Ended December 31, | |
| | | 2005 | | | 2006 | | | 2007 | |
| | | (in thousands) | |
Net cash used in operating activities | | $ | (13,088 | ) | | $ | (76,147 | ) | | $ | (62,768 | ) |
Net cash used in investing activities | | | (30,333 | ) | | | (6,757 | ) | | | (35,272 | ) |
Net cash provided by financing activities | | | 44,739 | | | | 92,123 | | | | 135,033 | |
Net increase in cash and cash equivalents | | | 1,734 | | | | 11,984 | | | | 45,708 | |
Cash and cash equivalents at the beginning of the year | | | 1,032 | | | | 2,765 | | | | 14,750 | |
Cash and cash equivalents at the end of the year | | | 2,765 | | | | 14,750 | | | | 60,458 | |
Operating Activities
Net cash used in operating activities amounted to $62.8 million in 2007, as compared to $76.1 million in 2006 and $13.1 million in 2005. Net cash used in operating activities in 2007 was mainly attributable to a significant increase in advances to suppliers, an increase in prepaid value-added-tax expenses and an increase in inventories primarily due to our expanded manufacturing capacity and the resultant requirement for more silicon raw materials. However, our net cash used in operating activities in 2007 was partly offset by a decrease in accounts receivable due to payment we received for deliveries previously made and the shorter credit term we granted to our customers in 2007 as compared to 2006. Net cash used in operating activities in 2006 was mainly attributable to a significant increase in accounts receivable primarily due to our granting favorable credit terms for sales to our large customers, particularly our top three customers, a significant increase in inventories and an increase in advances to suppliers primarily due to our expanded manufacturing capacity and the resultant requirement for more silicon raw materials, and a decrease in advances from customers after we changed our prepayment requirement by lowering the prepayment ratio and not requesting prepayment under several sales contracts. Net cash used in operating activities in 2005 was primarily attributable to a significant increase in advances to suppliers and an increase in inventories primarily due to our procurement of silicon raw materials, partly offset by an increase in advances from customers after we commenced the manufacture and sale of our solar cells.
Investing Activities
Net cash used in investing activities in 2007 amounted to $35.3 million, as compared to $6.8 million and $30.3 million in 2006 and 2005, respectively. Net cash used in investing activities in 2007 was primarily due to our purchases of property, plant and equipment in the amount of $15.6 million in connection with the expansion of our solar cell manufacturing lines, as well as an increase in restricted cash of $18.5 million in connection with
55
deposit of US dollars as security for our RMB loans. Net cash used in investing activities in 2006 was primarily due to our purchases of property, plant and equipment in the amount of $23.1 million in connection with the expansion of our solar cell manufacturing lines, partly offset by a decrease in restricted cash of $17.0 million due to decreases in our bank deposits for securing letter of credit facilities for our imports of equipment and for securing notes payable used in setting related party transactions. Net cash used in investing activities in 2005 was primarily attributable to a significant increase in restricted cash of $19.9 million and our purchases of property, plant and equipment in the amount of $10.4 million in connection with our solar cell manufacturing lines.
Financing Activities
Net cash provided by financing activities was $135.0 million in 2007, primarily attributable to proceeds from short-term borrowings in the amount of $168.0 million and net proceeds of $95.9 million received from our initial public offering. Net cash provided by financing activities was $92.1 million in 2006, consisting primarily of proceeds received from issuance of our Series A, Series B and Series C preferred shares, short-term borrowings and financing provided by related parties, partly offset by repayment of bank borrowings and financing provided by related parties. Net cash provided by financing activities was $44.7 million in 2005, consisting primarily of financing provided by related parties, proceeds received from short-term borrowings, term loans and capital contributions by shareholders, partly offset by repayment of financing provided by related parties and bank borrowings.
As of the date of this report, we still require debt or equity financing of approximately $40 million to finance the remaining cost of the expansion of our solar cell manufacturing lines, the conversion of our existing manufacturing lines and the construction of our Shanghai research facility. We believe that our current cash and cash equivalents and anticipated cash flow from our operations and the proposed financing described in the preceding sentence will be sufficient to meet our anticipated cash needs, including our cash needs for working capital and capital expenditures for at least the next 12 months. We may, however, require additional cash due to changing business conditions or other future developments, including any investments or acquisitions we may decide to pursue. If our existing cash is insufficient to meet our requirements, we may seek to sell additional equity securities, debt securities or borrow from lending institutions. Financing may be unavailable in the amounts we need or on terms acceptable to us, if at all. The sale of additional equity securities, including convertible debt securities, would dilute our earnings per share. The incurrence of debt would divert cash for working capital and capital expenditures to service debt obligations and could result in operating and financial covenants that restrict our operations and our ability to pay dividends to our shareholders. If we are unable to obtain additional equity or debt financing as required, our business operations and prospects may suffer.
Capital Expenditures
We incurred capital expenditures of $10.4 million, $24.9 million and $16.8 million in 2005, 2006 and 2007, respectively. Our capital expenditures have been used primarily to build our plant and purchase equipment for our solar cell manufacturing lines. We estimate that our capital expenditures will be approximately $60 million in 2008, and will be used primarily to purchase equipment for the further expansion of our manufacturing lines. By the end of 2008, we plan to have increased our manufacturing capacity of solar cells to approximately 320 MW per year, assuming the use of 156-millimeter monocrystalline silicon wafers.
| C. | Research and Development |
Our senior management team heads our research and development efforts and sets strategic directions for the advancement of our products and manufacturing processes. Dr. Jianhua Zhao, our vice chairman and chief technology officer, Dr. Aihua Wang, our vice president, and Dr. Fengming Zhang, our vice president, are all experienced solar power researchers. Under their guidance, our research and development plans include the following areas:
| | • | | Development of solar cell structures. We commenced commercial mass production of selective emitter cells, an improved version of P-type solar cells that most solar cell manufacturers produce, by using monocrystalline wafers in the fourth quarter of 2007. In July 2007, we placed orders to buy four new |
56
| | solar cell lines which we plan to install in the third quarter of 2008 for the production of selective emitter cells beginning in the fourth quarter of 2008. The manufacture of selective emitter cells will require a high degree of accuracy in the alignment between the diffusion region and the electrode printed on the silicon wafers. We are working to maintain and improve the conversion efficiency rate of selective emitter cells by using standard P-type silicon substrates. In addition, we are conducting research on producing selective emitter cells by using multicrystalline wafers. We also plan to develop passivated emitter and rear cells, which were initially developed in the University of New South Wales, for mass production in the future. In comparison with selective emitter cells, the manufacture of passivated emitter and rear cells will require P-type silicon substrates with higher quality. We believe passivated emitter and rear cells can achieve high conversion efficiencies without the need for any alignment. |
| | • | | Development of the manufacturing process for N-type solar cells. We also focus our research and development efforts on the process technologies of N-type solar cells. The conversion efficiencies of N-type cells may generally be higher than those of P-type solar cells. Based on Dr. Zhao and Dr. Wang’s previous experience working with N-type solar cells, including developing what were the most efficient N-type solar cells in the world, we have successfully conducted research and a large number of experiments on solving the technical problems associated with manufacturing N-type solar cells. We have devoted our research and development efforts to forming P-type emitters, surface passivation, screen printing and other aspects of the manufacturing process for N-type solar cells. |
| | • | | Increase our solar cell manufacturing efficiency and reduce the manufacturing costs. We continuously strive for optimizing the processing parameters and conditions for each manufacturing step to improve the overall performance of our solar cells, streamline our manufacturing process and reduce the manufacturing costs. We are conducting research on producing HP cells by using multicrystalline wafers, and we are also working collaboratively with metallic paste manufacturers to reduce the paste used for our manufacturing without affecting solar cell performance. |
We believe that the continual improvement of our technology is vital to maintaining our long-term competitiveness. Therefore, we have established our own solar power research center and have installed an experimental manufacturing line dedicated to our research and development.
To further leverage our internal advanced research and development capability, we have established cooperative relationships with several universities and institutions in China, including Nanjing University, one of the leading science and engineering universities in China. We have also entered into an agreement on collaborative research with the University of New South Wales, a leading university in the solar power field. We believe our collaborative efforts with these institutions have kept us apprised of the latest industry trends and developments, helped implement our own innovation initiatives and will continue to contribute to our technological advancement.
In addition, several government authorities in China, including State Development and Reform Commission, Ministry of Science and Technology and Jiangsu Science and Technology Department, have provided us or committed to provide us with grants for our research in solar power technologies. Jiangsu Science and Technology Department also recognized our research and development capability by establishing the photovoltaic engineering technology research center in our company. We have invited solar power experts from external research institutes to form the expert commission for such research center.
Our gross expenditures on research and development were $49,000, $0.5 million and $2.6 million in 2005, 2006 and 2007, respectively.
57
Other than as disclosed elsewhere in this annual report, we are not aware of any trends, uncertainties, demands, commitments or events since January 1, 2007 that are reasonably likely to have a material effect on our net revenues, income, profitability, liquidity or capital resources, or that caused the disclosed financial information to be not necessarily indicative of future operating results or financial conditions.
| E. | Off-balance Sheet Commitments and Arrangements |
We have not entered into any financial guarantees or other commitments to guarantee the payment obligations of third parties. We have not entered into any derivative contracts that are indexed to our shares and classified as shareholder’s equity, or that are not reflected in our consolidated financial statements. Furthermore, we do not have any retained or contingent interest in assets transferred to an unconsolidated entity that serves as credit, liquidity or market risk support to such entity. We do not have any variable interest in any unconsolidated entity that provides financing, liquidity, market risk or credit support to us or that engages in leasing, hedging or research and development services with us.
| F. | Contractual Obligations and Commercial Commitments |
The following table sets forth our contractual obligations and commercial commitments as of December 31, 2007:
| | | | | | | | | | | | | |
| | | Payment Due by Period |
| | | Total | | Less than
1 Year | | 1-3 Years | | 3-5 Years | | More than
5 Years |
| | | (in thousands) |
Operating lease obligations | | $ | 165 | | $ | 143 | | $ | 22 | | — | | — |
Purchase obligations(1) | | $ | 227,790 | | $ | 227,790 | | | — | | — | | — |
| | | | | | | | | | | | | |
Total | | $ | 227,955 | | $ | 227,933 | | $ | 22 | | | | |
| | | | | | | | | | | | | |
| (1) | Includes commitments to purchase production equipment in the amount of $22.9 million and commitments to purchase silicon raw materials in the amount of $204.9 million. |
Other than the contractual obligations and commercial commitments set forth above, we did not have any other material long-term debt obligations, operating lease obligations, purchase obligations or other material long-term liabilities as of December 31, 2007. This table does not reflect our short-term debt obligations, which as of December 31, 2007 totaled $121.8 million.
This annual report on Form 20-F contains statements of a forward-looking nature. These statements involve known and unknown risks, uncertainties and other factors that may cause our actual results, performance or achievements to be materially different from those expressed or implied by the forward-looking statements. These statements are made under the “safe harbor” provisions of the U.S. Private Securities Litigation Reform Act of 1995. Whenever you read a statement that is not simply a statement of historical fact (such as when we describe what we “believe,” “expect” or “anticipate” will occur, and other similar statements), you must remember that our expectations may not be correct, even though we believe that they are reasonable.
Whether actual results will conform with our expectations and predictions is subject to a number of risks and uncertainties, many of which are beyond our control, and reflect future business decisions that are subject to change. Some of the assumptions, future results and levels of performance expressed or implied in the forward-looking statements we make inevitably will not materialize, and unanticipated events may occur which will affect our results.
58
We would like to caution you not to place undue reliance on forward-looking statements and you should read these statements in conjunction with the risk factors disclosed in Item 3 of this annual report, “Key Information—Risk Factors.” We do not undertake any obligation to update or revise the forward-looking statements except as required under applicable law.
| H. | Recent Accounting Pronouncements |
In September 2006, the Financial Accounting Standards Board, or the FASB, issued SFAS No. 157, “Fair Value Measurement,” or SFAS 157, which defines fair value, establishes a framework for measuring fair value and expands disclosures about assets and liabilities measured at fair value. We will be required to adopt SFAS 157 for fiscal year beginning January 1, 2008. Our management is currently evaluating the requirements of SFAS 157 and has not yet determined the impact on our financial position or results of operations and cash flows.
In February 2007, the FASB issued SFAS No. 159, “The Fair Value Option for Financial Assets and Financial Liabilities,” or SFAS 159. SFAS No. 159 permits entities to choose to measure many financial instruments and certain other items at fair value. SFAS No. 159 is effective for fiscal years beginning after November 15, 2007. We are currently evaluating the impact, if any, of SFAS 159 on our financial position, results of operations and cash flows.
In December 2007, the FASB issued SFAS No. 141 (revised 2007), “Business Combinations,” or SFAS 141R, which replaces SFAS No. 141, “Business Combination.” The statement retains the purchase method of accounting for acquisitions, but requires a number of changes, including changes in the way assets and liabilities are recognized in the purchase accounting. It also changes the recognition of assets acquired and liabilities assumed arising from contingencies, requires the capitalization of in-process research and development at fair value, and requires the expensing of acquisition related costs as incurred. SFAS 141R is effective for fiscal years and interim periods within those fiscal years beginning on or after December 15, 2008 and will apply prospectively to business combinations completed on or after that date. We are currently evaluating the impact, if any, of SFAS 141R on our financial position, results of operations and cash flows.
In December 2007, the FASB issued SFAS No. 160 “Noncontrolling Interests in Consolidated Financial Statements,” an amendment of ARB 51. SFAS 160 requires noncontrolling interests in subsidiaries initially to be measured at fair value and classified as a separate component of equity. SFAS 160 also requires that when a parent company acquires control of a subsidiary, it must include 100% of the fair value of all of the acquired company’s assets and liabilities in its consolidated financial statements. SFAS 160 is effective for us for our financial year 2009. Management is currently assessing the impact of SFAS 160 on its consolidated financial position, results of operations and cash flows.
In March 2008, the FASB issued SFAS No. 161, “Disclosures About Derivative Instruments and Hedging Activities,” an amendment of FASB Statement No.133. The new standard requires enhanced disclosures to help investors better understand the effect of an entity’s derivative instruments and related hedging activities on its financial position, financial performance, and cash flows. Statement 161 is effective for financial statements issued for fiscal years and interim periods beginning after November 15, 2008, with early application encouraged. We will adopt SFAS No.161 on January 1, 2009.
59
| ITEM 6. | DIRECTORS, SENIOR MANAGEMENT AND EMPLOYEES |
| A. | Directors and Senior Management |
Directors and Executive Officers
The following table sets forth information regarding our directors and executive officers as of the date of this annual report.
| | | | |
Directors and Executive Officers | | Age | | Position |
Tingxiu Lu | | 46 | | Chairman |
Jianhua Zhao | | 53 | | Vice Chairman and Chief Technology Officer |
Ruennsheng Allen Wang | | 53 | | Director, Chief Executive Officer |
Fengming Zhang | | 42 | | Director, Vice President—Manufacturing Technology |
Alan Smith | | 64 | | Independent Director |
Xiaoqian Zhou | | 67 | | Independent Director |
Jian Li | | 55 | | Independent Director |
Steve Morgan | | 57 | | Independent Director |
Wenze Wang | | 66 | | Independent Director |
Kenneth Luk | | 56 | | Chief Financial Officer |
Aihua Wang | | 54 | | Vice President—Research and Development |
Richard Yumin Gu | | 44 | | Vice President—Sales and Marketing |
Fang Yang | | 37 | | Vice President—Strategy and Planning |
Directors
Mr. Tingxiu Lu is chairman of our board of directors and has been with our company since 2004. Since 2003, Mr. Lu has served as the chairman of the board of directors of China Electric Equipment Group Co., Ltd., or CEEG, a Chinese company that mainly manufactures power transformers. He has been chairman and general manager of Jiangsu CEEG Transformer Manufacturing Co., Ltd. since 2002, and has been a member of the supervisory board of Jiangsu CEEG Electrical Transmission and Distribution Equipment Co., Ltd. since 2003. Mr. Lu has been chairman of Jiangsu Xinde Assets Management Co., Ltd. and Nanjing Xinde Assets Management Co., Ltd., two investment management and investment holding companies, since 2006. From 1991 to 2003, Mr. Lu was the general manager of Jiangsu CEEG Electrical Equipment Manufacturing Co, Ltd, the predecessor of CEEG. Mr. Lu was awarded the China Excellent Entrepreneur award by the China Entrepreneur Confederation in 2005. He was also named as a 2005 Top Ten Distinguished Youth Entrepreneur of Jiangsu Province in 2005 by Jiangsu Province Development and Reform Commission and other government bodies. Mr. Lu graduated from an executive business management program at Tsinghua University in 2006.
Dr. Jianhua Zhaois vice chairman of our board of directors and chief technology officer of our company and has been with our company since 2004. From 2002 to June 2006, he was an associate professor of the Centre of Excellence for Advanced Silicon Photovoltaics and Photonics, formerly known as the Photovoltaics Special Research Centre, at the University of New South Wales in Australia, and also served as its deputy director from 1999 to June 2006. At the Photovoltaics Special Research Centre, he was a senior lecturer (senior research fellow) from 1991 to 2001. Dr. Zhao is a senior member of IEEE Electron Device Society, a member of Australia and New Zealand Solar Energy Society and a member of Chinese Renewable Energy Society. Dr. Zhao graduated from Nanjing Institute of Technology in 1978 and received his master’s degree from the same university in 1982, and received a Ph.D. degree in electrical engineering from the University of New South Wales in Australia in 1989. Dr. Zhao has published 65 papers in scientific journals, including one published in Nature magazine, 107 papers in international scientific conferences, and 32 research reports. Dr. Zhao is the husband of Dr. Aihua Wang.
Mr. Ruennsheng Allen Wang has been our chief executive officer since July 2007. Prior to joining us, Mr. Wang served as a senior vice president and the general manager of Operation Division, NEC
60
Telecommunications (China) Co., Ltd. from 2004 to 2007. From 1996 to 2004, he held various management positions with Motorola, first as the general manager of Hangzhou Motorola Cellular Equipment Co., Ltd. from 1996 to 2001, subsequently as a vice president of Motolora International Inc. in 2000, then as the general manager of CPAD Asia, Motorola PCS from 2001 to 2003 and finally as general manager of Motorola PCS ODM Taiwan Operations from 2003 to 2004. From 1993 to 1996, Mr. Wang served as a vice president of AT&T (China) Co., Ltd. Mr. Wang graduated with a bachelor degree in mechanical engineering from Taiwan University in 1977 and received his master’s degree in the same major from Yale University in 1981. He also received his master’s degree in computer science from Northwestern University in 1983. Mr. Wang received a Ph.D. degree from Northwestern University and an MBA from the University of Chicago in 1985 and 1992, respectively.
Dr. Fengming Zhang is a director and vice president of our company in charge of manufacturing technology and has been with our company since 2004. Dr. Zhang has been a director of CEEG (Shanghai) Science and Technology Co., Ltd., a solar module manufacturer since 2007. Dr. Zhang has been a professor at the Department of Physics of Nanjing University in China since 2002 and is currently a supervisor for Ph.D. students. Dr. Zhang has also been a professor of Fujian Normal University in China since 2005. From 1997 to 2002, he worked as a research scientist at Pacific Solar Pty Ltd in Australia. From 2001 to 2002, he worked with Wuxi Suntech Power Co., Ltd. as the director for research and development center. Dr. Zhang has published a number of articles and papers in solar power related journals. Dr. Zhang received a bachelor’s degree in physics from Shandong University China in 1986, a master degree in physics from the Institute of Physics of Chinese Academy of Sciences in 1989, and a Ph.D. degree in physics from the University of Newcastle in Australia in 1996. He is a professional committee member of Chinese Physical Society. Dr. Zhang was selected for the New Century Talent Support Program run by the PRC Ministry of Education in 2006.
Independent Directors
Mr. Alan Howard Smith has been an independent director of our company since May 2007. Mr. Smith currently acts as a director of approximately 20 companies, including several companies listed on the Stock Exchange of Hong Kong Limited, the Singapore Exchange Limited and the Irish Stock Exchange. He was the vice chairman at Credit Suisse First Boston, Asia Pacific from 1997 to 2001. Mr. Smith was elected a council member of the Stock Exchange of Hong Kong Limited on two occasions, from 1995 to 1996 and from 1988 to 1989, respectively. He was a member of the Hong Kong Special Administrative Region Government’s Economic Advisory Committee from 1994 to 2001, and was a member of the Hong Kong Government’s Standing Committee on Company Law Reform from 1988 to 1998. Mr. Smith graduated with a LL.B. (Honours) degree from Bristol University, England in 1964 and was admitted as a solicitor in England in 1967 and in Hong Kong in 1970. Mr. Smith is resigning from our board of directors effective June 30, 2008.
Mr. Xiaoqian Zhou has been an independent director of our company since May 2007. Mr. Zhou is an independent director of Xuji Electric Stock Co., Ltd. and Tebian Electric Appliance Stock Co., Ltd. He is a vice director of Chinese Energy Research Society and chairman of the Chinese Society for the Development of Power. Mr. Zhou has over 40 years of experience in the power industry in China. He was a consultant to the State Grid Corporation of China from 2001 to 2004, and was an assistant general manager of the same company from 1998 to 2001. From 1996 to 1999, Mr. Zhou was the general manager of China Grid Construction Co., Ltd. Mr. Zhou graduated from Zhejiang University with a major in thermal power equipment in 1964.
Ms. Jian Li has been an independent director of our company since May 2008. Ms. Li has worked in education with the Central University of Finance and Economics since 1983. Ms. Li is a professor, the head of department of finance, a doctoral supervisor and a supervisor of postdoctoral research station of Central University of Finance and Economics. She is also an independent director of Citic Securities Co., Ltd., a company listed on the Shanghai Stock Exchange. Ms. Li has been involved in the publishing of a number of academic papers both in China and overseas during the past ten years, mainly on finance and the capital markets. Ms. Li received her bachelor’s degree in finance and doctor’s degree in economics from the Central University of Finance and Economics and Xi’an Communication University in 1983 and 1997, respectively.
61
Mr. Steve Morgan has been an independent director of our company since May 2008. Mr. Morgan has been a senior partner and foreign legal advisor for Zhonglun W&D Law Firm in Beijing since 2007. Mr. Morgan was a special advisor on a number of projects for the Carlyle Group, Mitsubishi Corporation and Finmeccanica SpA. from 2004 to 2006, and was appointed as a Visiting Professor of the Graduate Business School of Seoul National University in 2007. From 2000 to 2004, he served as senior executive vice president for Hyundai Motor Company in Seoul and served in other executive positions in Hyundai group companies since 1998. Mr. Morgan graduated from Fordham College, New York, with a bachelor degree in political science in 1973 and received his juris doctorate from Northwestern University School of Law in 1976.
Mr. Wenze Wang has been our independent director since May 2008. Mr. Wang has been a executive vice chairman of China Investment Association since 2000. Mr. Wang was the Commissioner of the Finance and Economics Committee of the National People’s Congress from 2003 and resigned from this role in March 2008. From 1994 to 2003, Mr. Wang served as general manager of the State Development and Investment Corporation. Mr. Wang graduated from Shandong Technical College with a bachelor’s degree in thermal power in 1965.
Executive Officers
Mr. Kenneth Lukhas been our chief financial officer since December 2007. Prior to joining us, Mr. Luk served as corporate controller of Freescale Semiconductor Hong Kong Limited from 2004 to 2007. From 1990 to 2004, he held various management positions with Motorola Semiconductors Hong Kong Limited, first as a credit manager from 1990 to 1994, subsequently as a credit and marketing finance controller from 1994 to 2002, and finally as a sector controller from 2002 to 2004. Mr. Luk graduated with a bachelor of arts in economics from the University of Toronto in 1976 and received his MBA from York University in 1977.
Dr. Aihua Wang is a vice president of our company in charge of research and development and has been with our company since 2004. From 2000 to June 2006, she was a research fellow at the Centre of Excellence for Advanced Silicon Photovoltaics and Photonics, formerly known as the Photovoltaics Special Research Centre, at the University of New South Wales in Australia. At the Photovoltaics Special Research Centre, she was a project scientist from 1991 to 2000. She was an engineer at Applied Solar Energy, Inc. in California from 1990 to 1991. Dr. Wang published a number of research articles and papers on solar cells. Dr. Wang graduated from Nanjing Institute of Technology in China in 1978 and received a Ph.D. degree in electronic engineering from the University of New South Wales in Australia in 1992.
Mr. Richard Yumin Gu is a vice president of our company in charge of sales and marketing and has been with our company since January 2007. From 2001 to 2006, Mr. Gu was the general manager of Shanghai Ever-rich Electric Equipment Co. Ltd., a company engaging in the electric equipment business. From 1992 to 2001, Mr. Gu worked with various subsidiaries and a joint venture of DuPont, a multinational chemicals and health care conglomerate. From 1999 to 2001, he was a regional business manager of DuPont China Limited, serving for its department in charge of electrical insulation and advance fiber system business. From 1996 to 1999, he served as a technical consultant and marketing manager of DuPont Teijin Paper Asia Limited. From 1992 to 1996, he served as an account manager of DuPont China Holding Company Limited. Mr. Gu received his bachelor’s degree in electrical engineering from Xi’an Jiao Tong University in China and completed MBA correspondence courses with Auckland University of New Zealand in 1999.
Mr. Fang Yanghas been our vice president in charge of strategy and planning and special assistant to the chief executive officer since August 2007. Prior to joining us, Mr. Yang served as a director of the business management department and operation division with NEC Telecommunications (China) Co., Ltd. from 2004 to 2007. From 1995 to 2004, Mr. Yang worked as a director of sales and business management with Lucent Technologies (China) Co., Ltd., a communication equipment manufacturing company in China. Mr. Yang received his bachelor’s degree in engineering, his master in system engineering and MBA from Northwest Polytechnic University in Xi’an, China in 1992, 1995 and 1995, respectively.
62
The address of our directors and executive officers is c/o China Sunergy Co., Ltd., No. 123 Focheng West Road, Nanjing Jiangning Economic & Technical Development Zone, Nanjing, Jiangsu Province 211100, People’s Republic of China.
| B. | Compensation of Directors and Executive Officers |
For the years ended December 31, 2006 and 2007, the aggregate cash compensation that we paid to our executive officers was approximately $0.3 million and $0.7 million, respectively. There are no service contracts between us and our directors, except for those directors who are also our executive officers. For the year ended December 31, 2007, we paid an aggregate of US$45,000 for pension and other social insurance contribution for our senior executive officers. For option grants to our officers and directors, see Item 6, “Directors, Senior Management and Employees—Compensation of Directors and Executive Officers—Share Incentive Plan.”
Employment Agreements
We have entered into employment agreements with each of our executive officers. Under these agreements, each of our executive officers is employed for a specified time period. We may terminate the employment for cause, at any time, without remuneration, for certain acts of the employee, including but not limited to a conviction or plea of guilty to a felony, willful dishonesty to us and willful and continued failure to perform substantially all his agreed-to duties after a reasonable opportunity to cure the failure. An executive officer may terminate his employment at any time without penalty if there is any failure by us to comply with any material provisions of the employment agreement, any change in his duties or responsibilities in any material and adverse respect. Furthermore, either party may terminate the employment at any time without cause upon advance written notice to the other party except for Kenneth Luk, who has a one-year guaranteed term of employment with the Company. If we terminate the employment of an executive officer without cause, the executive officer will be entitled to a severance payment equal to a certain specified number of months of his or her then base salary.
Each executive officer has agreed to hold in confidence and not to use, except as required in the performance of his duties in connection with the employment, any confidential information relating to the business of our company, affiliates or customers. The executive officers have also agreed to disclose to us all inventions, designs and trade secrets which they conceive, develop or reduce to practice during the employment and to assign all right, title and interest in them to us.
Share Incentive Plan
In October 2006, our board of directors adopted a share incentive plan, or the First Plan, later amended in April 2007, to link the personal interests of our board members, employees and consultants to those of our shareholders by providing them with an incentive to generate superior returns for our shareholders, as well as to provide us with the flexibility to motivate, attract and retain the services of these individuals upon whose judgment, interest and special effort the successful conduct of our operations is dependent. The First Plan provides for the grant of options, referred to as “awards,” and we have reserved 2,500,000 shares for issuance under the First Plan. We adopted a second share incentive plan, or the Second Plan, after obtaining the approval by shareholders in February 2008. We have reserved 4,190,748 shares for issuance under the Second Plan. As of the date of this annual report, our board of directors has granted certain of our officers, employees and consultants an aggregate of 2,034,116 options and 3,476,086 restricted shares, excluding options and restricted shares forfeited pursuant to the above plans.
Administration. Our share incentive plans are administered by our compensation committee or, in its absence, by our board of directors. Our compensation committee will determine the provisions, terms and conditions of our awards.
Awards. Awards granted are evidenced by an award agreement that sets forth the terms, conditions and limitations for each award. Our First Plan only provides for awards in the form of options. Options provide for
63
the right to purchase our ordinary shares at a specified price, and usually will become exercisable in installments after the grant date. The option exercise price may be paid in cash, by check, by our ordinary shares which have been held by the option holder for such time as may be required to avoid adverse accounting treatment, by other property with value equal to the exercise price, through a broker assisted cash-less exercise or by such other methods as our compensation committee or board of directors may approve from time to time.
The following paragraphs briefly describe the principal features of the various awards that may be granted under the Second Plan.
| | • | | Options. Options provide for the right to purchase our ordinary shares at a price and period determined by our compensation committee in one or more installments after the grant date. |
| | • | | Restricted Shares. A restricted share award is the grant of our ordinary shares determined by our compensation committee. A restricted share is nontransferable, unless otherwise determined by our compensation committee at the time of award, and may be repurchased by us upon termination of employment or service during a restricted period. Our compensation committee shall also determine in the award agreement whether the participant will be entitled to vote the restricted shares or receive dividends on such shares. |
| | • | | Restricted Share Units. Restricted share units represent the right to receive our ordinary shares at a specified date in the future, subject to forfeiture of such right. If the restricted share unit has not been forfeited, then on the date specified in the award agreement, we shall deliver to the holder unrestricted ordinary shares which will be freely transferable. |
Termination of Plan. Unless terminated earlier, our First Plan and Second Plan will expire in 2016 and 2018, respectively. Our board of directors has the authority to amend or terminate our share incentive plans subject to shareholder approval to the extent necessary to comply with applicable law. However, no such action may impair the rights of any recipient of the awards unless agreed by the recipient and the share incentive plan administrator.
The following table summarizes, as of March 31, 2008, the outstanding options and restricted shares granted under our plans to several of our directors and executive officers and to other individuals. These options vest over a four-year period beginning in October 2006, November 2006, April 2007 or January 2008. These restricted shares vest over a three-year period beginning July 2007 or December 2007. Up to two thirds of the restricted shares granted to Mr. Ruennsheng Allen Wang will immediately vest in case of termination within his first two years of employment other than for cause.
| | | | | | | | | | | | |
Name | | Ordinary Shares
Underlying Options
Granted | | Restricted Shares | | | Exercise Price | | Grant Date | | Date of Expiration |
Ruennsheng Allen Wang | | — | | 2,397,301 | 1 | | | N/A | | February 2008 | | February 2018 |
Kenneth Luk | | — | | * | 1 | | | N/A | | February 2008 | | February 2018 |
Richard Yumin Gu | | * | | — | | | $ | 1.283 | | January 2008 | | January 2018 |
Fang Yang | | * | | — | | | $ | 1.283 | | January 2008 | | January 2018 |
Alan Howard Smith | | * | | — | | | $ | 1.283 | | April 2007 | | April 2017 |
Xiaoqian Zhou | | * | | — | | | $ | 1.283 | | April 2007 | | April 2017 |
Other individuals as a group | | * | | — | | | $ | 1.283 | | October 2006,
November
2006, April
2007 or
January 2008 | | October 2016,
November 2016,
April 2017 or
January 2018 |
| 1 | Restricted shares purchased at $0.001 per share. |
| * | Less than 1% of our outstanding ordinary shares. |
64
Board of Directors
Our board of directors currently has nine directors, all designated by the holders of our ordinary shares.
Under our amended articles of association, which became effective in May 2007, our board of directors consists of at least two directors. Our directors are elected by the holders of our ordinary shares.
A director is not required to hold any shares in the company by way of qualification. A director may vote with respect to any contract, proposed contract or arrangement in which he is materially interested. A director may exercise all the powers of the company to borrow money, mortgage its undertakings, property and uncalled capital, and issue debentures or other securities whenever money is borrowed or pledged as security for any obligation of the company or of any third party. Upon the completion of our initial public offering in May 2007, we established three committees under the board of directors: the audit committee, the compensation committee and the nominating committee. We have adopted a charter for each committee.
Committees of the Board of Directors
We have established three committees under the board of directors: the audit committee, the compensation committee and the corporate governance and nominating committee. In compliance with Rule 4350 of the Nasdaq Stock Market, Marketplace Rules, a majority of the members of our audit committee were independent directors during the one-year transition period after our ADSs are listed on the Nasdaq Global Market and all of the members of our audit committee are now independent directors. We have adopted a charter for each of the three committees. Each committee’s members and functions are described below.
Audit Committee. Our audit committee consists of Mr. Alan Howard Smith, Mr. Xiaoqian Zhou and Ms. Jian Li and is chaired by Alan Howard Smith. Mr. Smith, Mr. Zhou and Ms. Li satisfy the independence requirements of Rule 10A-3 under the Securities Exchange Act of 1934, as amended, and Rule 4350 of Nasdaq Stock Market, Marketplace Rules. The audit committee oversees our accounting and financial reporting processes and audits of the financial statements of our company. The audit committee is responsible for, among other things:
| | • | | selecting the independent auditors and pre-approving all auditing and non-auditing services permitted to be performed by the independent auditors; |
| | • | | reviewing with the independent auditors any audit problems or difficulties and management’s response; |
| | • | | reviewing and approving all proposed related party transactions, as defined in Item 404 of Regulation S-K under the Securities Act; |
| | • | | discussing the annual audited financial statements with management and the independent auditors; |
| | • | | reviewing major issues as to the adequacy of our internal controls and any special audit steps adopted in light of material control deficiencies; and |
| | • | | meeting separately and periodically with management and the independent auditors. |
Compensation Committee. Our compensation committee consists of Mr. Alan Howard Smith and Mr. Xiaoqian Zhou. Mr. Smith and Mr. Zhou satisfy the independence requirements of Rule 4350 of the Nasdaq Stock Market, Marketplace Rules. The compensation committee assists the board in reviewing and approving the
65
compensation structure, including all forms of compensation, relating to our directors and executive officers. Our chief executive officer may not be present at any committee meeting during which his compensation is deliberated. The compensation committee is responsible for, among other things:
| | • | | reviewing and approving the total compensation package for our senior executives; and |
| | • | | reviewing periodically and approving any long-term incentive compensation or equity plans, programs or similar arrangements, annual bonuses, employee pension and welfare benefit plans. |
Corporate Governance and Nominating Committee. Our corporate governance and nominating committee consists of Mr. Alan Howard Smith and Mr. Xiaoqian Zhou. Mr. Smith and Mr. Zhou satisfy the independence requirements of Rule 4350 of the Nasdaq Stock Market, Marketplace Rules. The corporate governance and nominating committee assists the board of directors in selecting individuals qualified to become our directors and in determining the composition of the board and its committees. The corporate governance and nominating committee is responsible for, among other things:
| | • | | identifying and recommending qualified candidates to the board for selection of directors nominees for election or re-election to the board of directors and committees of the board of directors, or for appointment to fill any vacancy; |
| | • | | reviewing annually with the board of directors the current composition of the board of directors with regards to characteristics such as independence, age, skills, experience and availability of service to us; and |
| | • | | advising the board of directors periodically with regard to significant developments in the law and practice of corporate governance as well as our compliance with applicable laws and regulations, and making recommendations to the board of directors on all matters of corporate governance and on any remedial actions to be taken. |
Duties of Directors
Under Cayman Islands law, our directors have a statutory duty of loyalty to act honestly in good faith with a view to our best interests. Our directors also have a duty to exercise the skill they actually possess with the care and diligence that a reasonably prudent person would exercise in comparable circumstances. In fulfilling their duty of care to us, our directors must ensure compliance with our memorandum and articles of association. A shareholder has the right to seek damages if a duty owed by our directors is breached.
Terms of Directors and Officers
Our shareholders have designated our directors into three classes, namely Class A directors, Class B directors and Class C directors, who shall retire from office and be eligible for re-election at the first, second and third annual general meeting after our initial public offering, respectively. Mr. Tingxiu Lu, Mr. Ruennsheng Allen Wang and Ms. Jian Li have been designated as Class A directors. Mr. Jianhua Zhao, Mr. Steve Morgan and Mr. Alan Howard Smith have been designated as Class B directors. Mr. Fengming Zhang, Mr. Xiaoqian Zhou and Mr. Wenze Wang have been designated as Class C directors. At each subsequent annual general meeting after the third annual general meeting, the directors of the class who have been longest in office shall retire and shall be eligible for re-election. A director may only be removed by the shareholders. Officers are elected by and serve at the discretion of the board of directors.
We had 228 and 1,193 employees as of December 31, 2005 and 2006, respectively. As of December 31, 2007, we had 1,607 full-time employees, consisting of 721 in manufacturing, 145 in equipment maintenance, 266 in quality assurance, 31 in purchasing, 86 in research and development, 41 in sales and marketing and 317 in
66
general and administrative. All of these employees are located in our facilities in Nanjing, except for four employees located in our offices in Shanghai and Germany. Our employees are not covered by any collective bargaining agreement. We consider our relations with our employees to be good.
From time to time, we also employ part-time employees and independent contractors to support our manufacturing, research and development and sales and marketing activities. We plan to hire additional employees as we expand.
The following table sets forth information, some of which has been obtained from public filings, with respect to the beneficial ownership of our ordinary shares as of the date of this report, by:
| | • | | each of our directors and executive officers who are also our shareholders; and |
| | • | | each person known to us to own beneficially more than 5.0% of our ordinary shares. |
| | | | |
| | | Ordinary Shares
Beneficially Owned |
| | | Number(1) | | %(2) |
Directors and Executive Officers: | | | | |
Tingxiu Lu(3) | | 39,184,200 | | 16.5 |
Jianhua Zhao(4) | | 20,304,000 | | 8.6 |
Aihua Wang(4) | | 20,304,000 | | 8.6 |
Fengming Zhang(5) | | 9,720,000 | | 4.1 |
Ruennsheng Allen Wang(6) | | * | | * |
Alan Smith(7) | | * | | * |
Xiaoqian Zhou(8) | | * | | * |
Kenneth Luk | | — | | — |
Richard Yumin Gu(9) | | * | | * |
Fang Yang | | — | | — |
All Directors and Executive Officers as a Group | | 69,391,920 | | 29.2 |
| | |
Principal Shareholders: | | | | |
Elite Shine Group Limited(10) | | 39,184,200 | | 16.5 |
Credit Suisse(11) | | 37,344,718 | | 15.7 |
Exuberance Investment Limited(12) | | 32,678,274 | | 13.7 |
Smooth King Investments Limited(13) | | 21,295,800 | | 9.0 |
Brightest Power Holdings Limited(14) | | 20,304,000 | | 8.5 |
PraxCapital Fund II, L.P(15) | | 17,492,742 | | 7.4 |
| (1) | Beneficial ownership is determined in accordance with the rules of the SEC and includes voting or investment power with respect to the securities. |
| (2) | For each person and group included in this table, percentage ownership is calculated by dividing the number of shares beneficially owned by such person or group the number of ordinary shares outstanding as of as of the date of this report plus the number of ordinary shares underlying share options held by such person or group that are exercisable within 60 days after the date of this annual report. |
| (3) | Includes 9,184,200 ordinary shares and 5,000,000 restricted ADSs, representing 30,000,000 ordinary shares, held by Elite Shine Group Limited, a British Virgin Islands company, which is 100% owned by Mr. Lu. The business address for Mr. Lu is No. 123 Focheng West Road, Nanjing Jiangning Economic & Technical Development Zone, Nanjing, Jiangsu Province 211100, People’s Republic of China. |
| (4) | Includes 10,704,000 ordinary shares and 1,600,000 restricted ADSs, representing 9,600,000 ordinary shares, held by Brightest Power Holdings Limited, a British Virgin Islands company, which is 100% owned by Dr. Zhao and Dr. Wang. Dr. Zhao and Dr. Wang are husband and wife, and their business address is |
67
| | No. 123 Focheng West Road, Nanjing Jiangning Economic & Technical Development Zone, Nanjing, Jiangsu Province 211100, People’s Republic of China. |
| (5) | Includes 3,720,000 ordinary shares and 1,000,000 restricted ADSs, representing 6,000,000 ordinary shares, held by Luck Great Investments Limited, a British Virgin Islands company, which is 100% owned by Dr. Zhang. Dr. Zhang’s business address is No. 123 Focheng West Road, Nanjing Jiangning Economic & Technical Development Zone, Nanjing, Jiangsu Province 211100, People’s Republic of China. |
| (6) | Represents restricted shares vested within 60 days after the date of this annul report. |
| (7) | Represents ordinary shares issued upon exercise of options held by Mr. Smith. Mr. Smith’s address is No. 123 Focheng West Road, Nanjing Jiangning Economic & Technical Development Zone, Nanjing, Jiangsu Province 211100, People’s Republic of China. |
| (8) | Represents ordinary shares issued upon exercise of options held by Mr. Zhou. Mr. Zhou’s address is No. 123 Focheng West Road, Nanjing Jiangning Economic & Technical Development Zone, Nanjing, Jiangsu Province 211100, People’s Republic of China. |
| (9) | Represents ordinary shares underlying ADSs held by Ms. Jian Yue Xue, the wife of Mr. Gu. |
| (10) | Elite Shine Group Limited is 100% owned by Mr. Lu. The address of Elite Shine Group Limited is P.O. Box 957, Offshore Incorporation Centre, Road Town, Tortola, British Virgin Islands. |
| (11) | Based on a Schedule 13G filed by Credit Suisse on June 2, 2008, this represents the shares that may be deemed to be beneficially owned by Credit Suisse and includes 32,678,274 shares that China Harvest Fund, L.P. beneficially owns because of Credit Suisse’s relationship to China Harvest Fund, L.P.. Credit Suisse disclaims beneficial ownership of these 32,678,274 shares. The ultimate parent company of Credit Suisse is Credit Suisse Group, a corporation formed under the laws of Switzerland. Credit Suisse Group disclaims beneficial ownership of shares beneficially owned by its direct or indirect subsidiaries, including Credit Suisse. Credit Suisse’s business address is Uetlibergstrasse 231, P.O. Box 900, CH 8070 Zurich, Switzerland. See footnote 12 for additional discussion of these shares. |
| (12) | Represents ordinary shares issued upon conversion of Series B preferred shares held by Exuberance Investment Limited, a British Virgin Islands company, with the registered address at P.O. Box 173, Kingston Chambers, Road Town, Tortola, British Virgin Islands. Exuberance Investment Limited is 97.83% owned by China Harvest Fund, L.P., a Cayman Islands exempted limited partnership, and 2.17% owned by China Harvest Parallel Fund I, L.P., a Cayman Islands exempted limited partnership, each with the registered address at the offices of M&C Corporate Services Limited, P.O. Box 309GT, Ugland House, South Church Street, George Town, Grand Cayman, Cayman Islands. The general partner of China Harvest Fund, L.P. and China Harvest Parallel Fund I, L.P. is China Renaissance Capital Investment, L.P., a Cayman Islands exempted limited partnership. Voting and investment power of shares beneficially held by China Harvest Fund, L.P. is exercised by the investment committee of China Renaissance Capital Investment, L.P. which consists of Mark Qiu, Hung Shih, Li Zhenzhi, Charles Pieper and Nicole Arnaboldi. The address for these committee members is c/o China Renaissance Capital Investment, L.P., M&C Corporate Services Limited, P.O. Box 309GT, Ugland House, South Church Street, George Town, Grand Cayman, Cayman Islands. |
| (13) | Smooth King Investments Limited is 100% owned by Ms. Yingchun Huang. The address of Smooth King Investments Limited is P.O. Box 957, Offshore Incorporation Centre, Road Town, Tortola, British Virgin Islands. |
| (14) | Brightest Power Holdings Limited is 100% owned by Dr. Zhao and Dr. Wang. The address of Brightest Power Holdings Limited is P.O. Box 957, Offshore Incorporation Centre, Road Town, Tortola, British Virgin Islands. |
| (15) | Represents ordinary shares underlying 2,915,457 ADSs held by PraxCapital Fund II, L.P., a Cayman Islands limited partnership, with the registered address at M&C Corporate Services Limited, P.O. Box 309GT, |
68
| | Ugland House, South Church St., George Town, Grand Cayman. The general partner of PraxCapital Fund II, L.P. is Prax Capital GP II, a Cayman Islands company. Prax Capital GP II is controlled by its board of directors, consisting of Jose Luis Artiga, Fernando R. Vila, Jeff Yao and Michael Xu. The address for these directors is c/o Prax Capital GP II, P.O. Box 309 GT, Ugland House, South Church Street, George Town, Grand Cayman, Cayman Islands. |
None of our shareholders has different voting rights from other shareholders. We are not aware of any arrangement that may, at a subsequent date, result in a change of control of our company.
| ITEM 7. | MAJOR SHAREHOLDERS AND RELATED PARTY TRANSACTIONS |
See Item 6, “Directors, Senior Management and Employees—Share Ownership.”
| B. | Related Party Transactions |
Restructuring
As Sunergy Nanjing is a company incorporated in China, PraxCapital Fund II, L.P., or PraxCapital, incorporated Sunergy BVI in the British Virgin Islands in January 2006 to facilitate its investment in our company offshore. PraxCapital contributed $13.1 million to Sunergy BVI in January 2006 to facilitate the subsequent restructuring steps, and Sunergy BVI issued one ordinary share to PraxCapital in January 2006 to complete Sunergy BVI’s incorporation procedures. Of the above $13.1 million contributed by PraxCapital, $10 million was further lent to Sunergy Nanjing to finance its operations, and the remaining $3.1 million was lent to the foreign shareholders of Sunergy Nanjing, namely Dr. Jianhua Zhao, Dr. Aihua Wang and Dr. Fengming Zhang, in March 2006.
Due to PRC legal restrictions on the direct exchange of onshore equity interests for offshore shares, Sunergy BVI, PraxCapital, Sunergy Nanjing and the shareholders of Sunergy Nanjing entered into a warrant purchase agreement in March 2006 to achieve the following goals: (a) Sunergy BVI would acquire all equity interests in Sunergy Nanjing for nominal consideration; (b) the shareholders of Sunergy Nanjing or their assignees would acquire ordinary shares of Sunergy BVI according to such shareholders’ proportionate ownership in Sunergy Nanjing, but the percentage of ordinary shares of Sunergy BVI to be owned by the foreign shareholders, namely Dr. Jianhua Zhao, Dr. Aihua Wang and Dr. Fengming Zhang, or their assignees, would be less than their original proportionate ownership in Sunergy Nanjing, because these foreign shareholders intended to effectively exchange a portion of the ordinary shares that they or their assignees would be entitled to, representing 3.2% of their original equity interests in Sunergy Nanjing, for the above $3.1 million lent to them, and (c) Sunergy BVI would issue Series A preferred shares to PraxCapital in consideration of its above contribution of $13.1 million.
As agreed under the warrant purchase agreement, in April 2006, Sunergy BVI purchased all of the outstanding equity interests in Sunergy Nanjing from the shareholders of Sunergy Nanjing. The foreign shareholders of Sunergy Nanjing, namely Dr. Jianhua Zhao, Dr. Aihua Wang and Dr. Fengming Zhang, three of our directors and executive officers, have released Sunergy BVI from its obligation to pay the purchase price of approximately $6.3 million. In accordance with the common practice in China, the PRC shareholder, Nanjing Xinde Assets Management Co., Ltd., or Xinde, an entity controlled by our chairman, Mr. Tingxiu Lu, was paid not less than its investment cost in Sunergy Nanjing, approximately $4.0 million. Under the above warrant purchase agreement, such amount was then contributed back to Sunergy Nanjing by Xinde as a cash advance to finance Sunergy Nanjing’s operations, and subsequently gifted to Sunergy Nanjing by Xinde in September 2006.
69
In April 2006, after Sunergy BVI acquired all of the outstanding equity interests in Sunergy Nanjing, pursuant to the above warrant purchase agreement, Sunergy BVI issued warrants to purchase an aggregate of 1,045,440 ordinary shares at the exercise price of $0.01 per share to the assignees of the original shareholders of Sunergy Nanjing as follows:
| | | | | | | | |
Shareholders of Sunergy Nanjing | | Relationship | | Assignees Who Received
the Warrant | | Number of
Shares
Underlying the
Warrants | | Relationship |
Dr. Jianhua Zhao | | our vice chairman and chief technology officer | | Brightest Power Holdings Limited | | 203,040 | | controlled by Dr. Jianhua Zhao and his wife, Dr. Aihua Wang |
| | | | |
Dr. Aihua Wang | | our vice president in charge of research and development | | Brightest Power Holdings Limited | | 203,040 | | controlled by Dr. Aihua Wang and her husband, Dr. Jianhua Zhao |
| | | | |
Dr. Fengming Zhang | | one of our directors, and our vice president in charge of manufacturing technology | | Luck Great Investments Limited | | 97,200 | | controlled by Dr. Fengming Zhang |
| | | Deutsche Bank AG acting through its London Branch | | 54,000 | | assignee |
| | | Talent Day Investments Limited | | 86,400 | | controlled by Mr. Chengrong Xu, our then vice president in charge of administration and human resources |
| | | | |
Xinde | | jointly owned by Mr. Tingxiu Lu, and Ms. Yingchun Huang | | Elite Shine Group Limited | | 391,842 | | controlled by Mr. Tingxiu Lu |
| | | Smooth King Investments Limited | | 212,958 | | controlled by Ms. Yingchun Huang |
In April 2006, with the exception of Deutsche Bank AG acting through its London Branch, or Deutsche Bank, the other assignees of the original shareholders of Sunergy Nanjing, whose relationship with our company or our affiliates are listed in the above table, requested Sunergy BVI to issue the ordinary shares underlying all the warrants that they held. As a result, 991,440 ordinary shares were issued to these assignees in April 2006, including 391,842 ordinary shares to Elite Shine Group Limited, 212,958 ordinary shares to Smooth King Investments Limited, 203,040 ordinary shares to Brightest Power Holdings Limited, 97,200 ordinary shares to Luck Great Investments Limited and 86,400 ordinary shares to Talent Day Investments Limited. According to the terms of the warrants, each of the above warrant holders should have paid the exercise price when the ordinary shares were issued to them. These warrant holders actually paid the exercise price of $0.01 per share in September 2006. In August 2006, 54,000 ordinary shares were issued upon Deutsche Bank’s exercise of the warrant that it held by paying Sunergy BVI the exercise price of $0.01 per share. These 1,045,440 ordinary shares in the aggregate issued upon the exercise of the warrants are just the same shares exchanged for China Sunergy’s 1,045,440 ordinary shares in August 2006, as discussed below.
70
After the above transactions, the foreign shareholders of Sunergy Nanjing effectively relinquished 3.2% of their equity interests in Sunergy Nanjing in consideration of Sunergy BVI’s above loan of $3.1 million. If these foreign shareholders had not relinquished such 3.2% equity interests, Sunergy BVI would have issued an aggregate of 1,080,000 ordinary shares to the assignees of the original shareholders of Sunergy Nanjing. The following table presents the number and percentage of ordinary shares that the assignees of the original shareholders of Sunergy Nanjing would be entitled to assuming there had not been the relinquishment of the 3.2% equity interests in Sunergy Nanjing, and the number of ordinary shares that these assignees actually received:
| | | | | | | | | |
Shareholders of Sunergy Nanjing | | Percentage
of Equity
Interest in
Sunergy
Nanjing
(%) | | | Number of
Ordinary
Shares the
Relevant
Assignees
Entitled to
Assuming No
Relinquishment | | Percentage of
Ordinary
Shares the
Relevant
Assignees
Entitled to
Assuming No
Relinquishment
(%) | | Number of
Ordinary
Shares the
Relevant
Assignees
Actually
Received |
Dr. Jianhua Zhao and Dr. Aihua Wang | | 20 | * | | 216,000 | | 20 | | 203,040 |
Dr. Fengming Zhang | | 24 | | | 259,200 | | 24 | | 237,600 |
Xinde | | 56 | | | 604,800 | | 56 | | 604,800 |
| * | Representing 15% equity interest in Sunergy Nanjing originally held by Dr. Jianhua Zhao, and 5% equity interest originally held by Dr. Aihua Wang. |
As shown above, due to the relinquishment of the 3.2% equity interests, the numbers of ordinary shares that the assignee of Dr. Jianhua Zhao and Dr. Aihua Wang and the assignees of Dr. Zhang actually received were reduced by 12,960 and 21,600, respectively, or 1.2% and 2.0%, respectively, of the 1,080,000 ordinary share that would have been issued assuming there had not been such relinquishment.
Immediately prior to the issuance of the above warrants, in April 2006, Sunergy BVI issued 128,473 Series A preferred shares to PraxCapital according to the above warrant purchase agreement and the one ordinary share previously issued to PraxCapital was cancelled.
Compensation Charges
In March 2006, two shareholders of Sunergy Nanjing, namely Mr. Huaijin Yang and Mr. Ted Szpitalak, transferred 10% equity interests in Sunergy Nanjing to two other shareholders of Sunergy Nanjing, namely Dr. Jianhua Zhao and Xinde. The above transfers were effected largely because Sunergy Nanjing’s joint venture contract prohibited the transferor shareholders from investing in enterprises engaging in business competitive with that of Sunergy Nanjing, and the transferor shareholders intended to focus on the solar power business of another company that they invested in. Except for Xinde’s contribution, to Sunergy Nanjing, of Mr. Huaijin Yang’s unfunded capital subscription of $540,000, there was no other consideration paid for the above equity transfers. We accounted for these transfers as contributions of capital by the transferors, followed by a non-pro rata dividend distribution to Sunergy Nanjing’s remaining shareholders. After the equity transfers, Dr. Jianhua Zhao, our then president, received more ownership interest than he would have received had the distribution been made on a pro rata basis, partly to compensate him for his services to Sunergy Nanjing. We recorded a compensation charge of approximately $3.7 million equal to the fair value of the excess ownership interest he received.
According to Sunergy Nanjing’s original articles of association, certain crystalline silicon solar cell technology was to be contributed for $1.4 million of Sunergy Nanjing’s capital. In November 2004, all the shareholders of Sunergy Nanjing agreed that the above technology to be contributed by its foreign shareholders, namely Dr. Jianhua Zhao, Dr. Aihua Wang, Dr. Fengming Zhang, Mr. Huaijin Yang and Mr. Ted Szpitalak, who were also our executive officers, was more valuable than the originally subscribed capital. Therefore, all the
71
shareholders amended the articles of association of Sunergy Nanjing, and the contribution method of $810,000 of Sunergy Nanjing’s capital subscribed by these foreign shareholders was changed from cash or equipment to technology. In March 2006, Sunergy Nanjing decided that it would need the thin-film solar cell technology owned by its then foreign shareholders, namely Dr. Jianhua Zhao, Dr. Aihua Wang and Dr. Fengming Zhang, who were also our executive officers. Therefore, all the shareholders amended the articles of association of Sunergy Nanjing, and the contribution method of $540,000 of Sunergy Nanjing’s capital subscribed by these foreign shareholders was changed from cash to technology. As the above technologies contributed were developed by individuals and there was no historic cost for such technologies, according to U.S. GAAP, we accounted for the above amendments to change the contribution method as forgiveness of shareholder loans. As the shareholders involved were also our executive officers, we recorded compensation charges of $810,000 and $540,000, respectively.
Issuance and Sale of Preferred Shares
In May 2006, Sunergy BVI sold 239,051 Series B preferred shares in a private placement for an aggregate consideration of $28.0 million. The investors in the Series B preferred shares were Exuberance Investment Limited, which purchased 192,095 shares, Gersec Trust Reg., which purchased 21,344 shares, and China Environmental Fund 2004, LP, which purchased 25,612 shares. This transaction was approved by Sunergy BVI’s board of directors and shareholders.
In September 2006, Sunergy sold 69,010 Series C preferred shares in a private placement for an aggregate consideration of $20.0 million. The investors in the Series C preferred shares were OZ Master Fund, Ltd., which purchased 18,517 shares, OZ Asia Master Fund, Ltd., which purchased 20,094 shares, OZ Global Special Investments Master Fund, L.P., which purchased 2,795 shares, and Credit Suisse Private Equity Partners Asia, L.P., which purchased 27,604 shares. This transaction was approved by Sunergy’s board of directors and shareholders.
The holders of Series A, Series B and Series C preferred shares were entitled to received dividends at an annual rate of 3%, which would accrue on a daily basis from the date of issuance, whether or not declared. Accrued and unpaid dividends would compound on a quarterly basis and be included in the calculation of the conversion ratio when the preferred shares converted into ordinary shares. All these preferred shares were convertible into our ordinary shares at any time and automatically converted into our ordinary shares upon completion of our initial public offering into the number of ordinary shares equal to the number of preferred shares multiplied by the quotient of (a) the original subscription price plus all accrued and unpaid dividends, divided by (b) the conversion price, subject to adjustments in the case of certain dilution events. The conversion prices previously equaled the original subscription prices, subject to certain earnings-based adjustments, in the event our 2006 and 2007 net earnings, as defined in our then amended and restated memorandum of association, were less than a predefined amount.
In March 2007, our shareholders adopted a third amended and restated memorandum and articles of association to (a) modify the conversion prices of our Series A, Series B and Series C preferred shares, which were revised to $38.66, $44.37 and $175.59, respectively, subject to adjustments in the case of certain dilution events, and (b) replace the definition of “qualified IPO” or “QIPO” with the definition of “IPO.” The purposes of these modifications were to (a) ensure that there would be no preferred share outstanding after the completion of our initial public offering, (b) fix the conversion prices of our Series A and Series B preferred shares according to the earnings-based adjustments based on our 2006 net earnings as provided in our previous memorandum and articles of association, and (c) re-set the conversion price of our Series C preferred shares and delete the provision on the adjustment of such conversion price based on our 2007 net earnings, in order to avoid any dilution caused by the possible earnings-based adjustment.
In March 2007, the conversion prices of our Series A and Series B preferred shares were reduced according to the provision in our then effective memorandum and articles of association on the conversion price adjustment based on our 2006 net income of $11.8 million. As our 2006 net income was reduced by non-cash compensation
72
charges of $4.7 million and the conversion prices of our Series A and Series B preferred shares were thus reduced, the ownership interests of our shareholders other than holders of our Series A and Series B preferred shares were diluted, which was previously not anticipated by our shareholders. Therefore, our shareholders mutually agreed for holders of our Series A and Series B preferred shares to sell a portion of their preferred shares to us for nominal consideration. The number of Series A and Series B shares sold was determined based on a calculation to offset the dilution impact of the adjustment of conversion prices caused by the non-cash compensation charges of $4.7 million. Accordingly, we purchased 48,238 Series A preferred Shares, 72,079 Series B preferred shares, 8,009 Series B preferred shares and 9,610 Series B preferred shares from PraxCapital, Exuberance Investment Limited, Gersec Trust Reg., and China Environmental Fund 2004, LP, respectively, with nominal consideration. According to Cayman Islands law, these Series A and Series B preferred shares were automatically cancelled upon our purchase.
All of our Series A, Series B and Series C preferred shares were converted into ordinary shares upon completion of our initial public offering. Holders of ordinary shares issued upon conversion of our Series A, Series B and Series C preferred shares are also entitled to certain registration rights, including demand registration, piggyback registration and Form F-3 or Form S-3 registration.
Share Swap
As part of our restructuring in anticipation of our initial public offering, in August 2006, we issued a total of 1,045,440 ordinary shares, 128,473 Series A preferred shares and 239,051 Series B preferred shares to certain existing shareholders of Sunergy BVI in exchange for all shares of equivalent classes that these shareholders previously held in Sunergy BVI.
Share Split
In April 2007, in anticipation of our initial offering, we effected a 100-for-one share split, as a result of which each of our ordinary share, Series A preferred share, Series B preferred share and Series C preferred share was subdivided into 100 ordinary shares, 100 Series A preferred shares, 100 Series B preferred shares and 100 Series C preferred shares, respectively. The conversion prices of our Series A, Series B and Series C preferred shares were correspondingly modified to one-hundredth of the previous conversion prices.
Transactions with Certain Directors, Shareholders and Affiliates
During the years ended December 31, 2005 and 2006, we made non-trade cash advances to related parties with common ultimate investors to meet the temporary liquidity needs of these related parties. As of December 31, 2005 and 2006, non-trade amounts due from these related parties were $14.0 million, and $0.4 million, respectively, including (a) cash advances to several entities controlled by Mr. Tingxiu Lu, our chairman, namely Jiangsu CEEG Transformer Manufacturing Co., Ltd., China Electric Equipment Group Co., Ltd., Jiangsu CEEG Electrical Transmission and Distribution Equipment Co., Ltd., CEEG Nanjing International Trade Co., Ltd., Jiangsu CEEG Electrical Equipment Manufacturing Co, Ltd and CEEG Nanjing Electronic Technology Co., Ltd., and (b) cash advances to Jiangsu Tianhua Photo-electronic Technology Co., Ltd., an entity controlled by Dr. Jianhua Zhao, our vice chairman and chief technology officer.
We also received non-trade cash advances from related parties with common ultimate investors for our temporary liquidity needs or for our bank deposits to secure notes payable used for our related parties’ settlement purposes according to the local banking practice. As of December 31, 2005, 2006 and 2007, amounts due to these related parties were $28.4 million, nil and nil, respectively, including cash advances provided by several entities controlled by Mr. Tingxiu Lu, our chairman, namely Jiangsu CEEG Electrical Equipment Manufacturing Co, Ltd, Jiangsu CEEG Electrical Transmission and Distribution Equipment Co., Ltd., China Electric Equipment Group Co., Ltd., Nanjing Xinde Assets Management Co., Ltd., CEEG Nanjing International Trade Co., Ltd., CEEG Jiangsu (Nanjing) Transformer Manufacturing Co., Ltd. and CEEG (Jiangsu) Jueyuan New Materials Co., Ltd.
73
In August 2006, Sunergy Nanjing entered into an agreement to lease warehouse premises of 3,000 square meters from CEEG Jiangsu (Nanjing) Transformer Manufacturing Co., Ltd. for a term until September 2011. The tenancy agreement provides for annual rental payments of $8,000. The rental expense in the year ended December 31, 2006 and 2007 was $2,000 and $8,000, respectively.
In 2006 and 2007, we purchased raw materials from CEEG Nanjing International Trade Co., Ltd. in the amount of $6.5 million and $1.2 million, respectively, and we also sold solar cells to CEEG Nanjing International Trade Co., Ltd. in the amount of $4.8 million and $3.2 million, respectively. In 2006, we also sold solar cells to Jiangsu East China Micro-ware Equipment Co., Ltd., an entity controlled by our chairman in the amounts of $56,000. In 2007, we purchased raw materials from CEEG (Nanjing) Solar Research Institute, an entity controlled by our chairman, in the amount of $0.2 million, and sold solar cells and solar modules to CEEG (Nanjing) Solar Research Institute in the amount of $1.5 million. In addition, we also purchased raw materials from CEEG (Nanjing) Semiconductor Co., Ltd., another entity controlled by our chairman, in the amount of $1.4 million, and sold off-specification wafers to CEEG (Nanjing) Semiconductor Co., Ltd. in amount of $0.6 million in 2007. During the same period, we sold solar cells to CEEG (Shanghai) Solar Science and Technology Co., Ltd., CEEG (Nanjing) New Energy Co., Ltd., another two entities controlled by our chairman, in the amount of $5.2 million and $42,000, respectively. We also outsourced the production of solar modules from our solar cells under processing arrangements with CEEG (Shanghai) Solar Science and Technology Co., Ltd and procured the solar modules from CEEG (Shanghai) Solar Science and Technology Co., Ltd. in amount of $0.7 million in 2007. In January 2008, we also entered into a sales contract with CEEG (Shanghai) Solar Science and Technology Co., Ltd., under which it agreed to purchase 10 MW of solar cells from January 2008 to June 2008. The prices under this contract for deliveries from January to March 2008 are fixed, and the prices for subsequent deliveries are subject to renegotiation every three months.
We also made cash advances to directors in respect of travel expenses, amounting to $6,000, $1,000 and nil as of December 31, 2005, 2006 and 2007, respectively. Expense reimbursements payable to directors amounted to $9,000, $4,000 and nil, as of December 31, 2005, 2006 and 2007, respectively.
China Electric Equipment Group Co., Ltd. and Jiangsu CEEG Electrical Transmission and Distribution Equipment Co., Ltd. have guaranteed most of our bank borrowings. As of December 31, 2005 and 2006, we had $30.4 million and $76.1 million, respectively, in outstanding borrowings guaranteed by them. As of December 31, 2007, we had $63.0 million in outstanding borrowing guaranteed by China Electric Equipment Group Co., Ltd. In February 2008, Mr. Tingxiu Lu, our chairman, also entered into an agreement to guarantee approximately RMB30 million of our bank borrowings, which will be due in August 2008.
CEEG and Sunergy Nanjing entered into an agreement on December 18, 2006, pursuant to which CEEG has undertaken to guarantee bank borrowings of Sunergy Nanjing for up to RMB1 billion, subject to adjustment in the event of the material change of CEEG’s credit or operation status, for one year after our initial public offering. CEEG agreed to provide such guarantee free of charge, or at a fee according to the market standard for similar transactions, but not exceeding 0.1% of the principal borrowing amount. This agreement has expired, and the two parties entered into another agreement under which CEEG agreed to guarantee free of charge bank borrowings by Sunergy Nanjing of up to RMB1 billion. The new agreement has a term of two years from May 17, 2008 to May 16, 2010.
CEEG and Sunergy Nanjing also entered into an agreement on December 20, 2006, pursuant to which CEEG granted Sunergy Nanjing an option to purchase, prior to December 31, 2007, the right to use a parcel of land of approximately 26,000 square meters at a price of approximately $0.5 million, equivalent to the original cost for CEEG to acquire such right. On July 23, 2007, CEEG and Sunergy Nanjing entered into an land use right transfer agreement to purchase the land use right to the forgoing parcel of land at a price of approximately $1.2 million, which was equivalent to the valuation price. Sunergy Nanjing agreed to enhance the purchase consideration to avoid that the land be compulsorily acquired by the government due to the price being significantly lower than the valuation price.
74
In November 2007, Sunergy BVI and CEEG jointly incorporated China Sunergy (Shanghai) Co., Ltd., or Sunergy Shanghai., in which we hold 95% interest, while CEEG holds 5% interest. According to our current plan, Sunergy Shanghai will primarily engage in solar power research and development activities.
In November 2007, we entered into a cooperation construction agreement with CEEG to construct a transformer station located in CEEG Nanjing Science and Technology Park in order to meet the increased electricity requirement resulting from our expanded manufacturing capacity. The estimated expenses under the agreement are approximately $4.8 million, 50% of which will be shared by the two parties according to the proportion of electricity capacity they use, while the remaining 50% of which will be borne by the Administrative Commission of Nanjing Jiangning Economic & Technical Development Zone. In December 2007, we entered into two agreements with CEEG, under which we purchased electric transformers and high-voltage switch cabinet in the amount of approximately $0.2 million and $0.6 million, respectively.
| C. | Interests of Experts and Counsel |
Not applicable.
| ITEM 8. | FINANCIAL INFORMATION |
| A. | Consolidated Statements and Other Financial Information |
We have appended consolidated financial statements filed as part of this annual report.
Legal Proceedings
We are a named defendant in three purported class actions currently pending in the United States District Court for the Southern District of New York—Brown v. China Sunergy Co., Ltd. et al., Case No. 07-CV-07895 (DAB),Sheshtawy v. China Sunergy Co., Ltd. et al., Case No. 07-CV-08656 (DAB), andGiombetti v. China Sunergy Co., Ltd. et al., Case No. 07-CV-09689 (DAB). As of the date of this report, the District Court has not appointed a lead plaintiff and consolidated the cases, though a motion is on file concerning this matter.
All three complaints purport to state class action claims against us in connection with our initial public offering and seek unspecified damages. Specifically, plaintiffs allege that we made false and misleading statements in our initial public offering registration statement and prospectus regarding, among other things, the procurement of polysilicon.
Several of our directors and officers, along with the investment banks that underwrote our initial public offering, are also named defendants in one or more of the pending cases. We believe the cases are without merit and intend to defend the actions vigorously.
In April 2008, the Nanjing Intermediate People’s Court issued a judgment in our favor for the first instance trial of our claim against Wuxi Zhuriyi International Trade Co., Ltd. Wuxi Zhuriyi International Trade Co., Ltd. was required to return our prepayment, pay us two times of the deposit and liquidated damages for its failure to perform its contractual obligations to deliver us silicon raw materials. In addition, we filed civil litigation with the Nanjing Intermediate People’s Court against Suzhou Shenlong PV Technology Co., Ltd. for its failure to perform its contractual obligations to deliver us silicon wafers.
Dividend Policy
We have never declared or paid any dividends, nor do we have any present plan to pay any cash dividends on our ordinary shares in the foreseeable future. We currently intend to retain most, if not all, of our available funds and any future earnings to operate and expand our business.
75
We are a holding company incorporated in the Cayman Islands. We rely on dividends paid by our direct and indirect subsidiaries, Sunergy BVI, Sunergy Hong Kong and Sunergy Nanjing, for our cash needs, including the payment of dividends to the holders of our ADSs and debt service on any debt we may incur through our Cayman holding company. The payment of dividends by entities organized in China is subject to limitations. Regulations in the PRC currently permit payment of dividends only out of accumulated profits as determined in accordance with PRC accounting standards and regulations. Sunergy Nanjing is also required to set aside at least 10% of its after-tax profit based on PRC accounting standards each year to its general reserves until the cumulative amount of such reserves reaches 50% of its registered capital. These reserves are not distributable as cash dividends. Sunergy Nanjing is also required to allocate a portion of its after-tax profits, as determined by its board of directors, to its staff welfare and bonus funds, which may not be distributed to equity owners. In addition, if Sunergy Nanjing or Sunergy BVI incurs debt on its own behalf in the future, the instruments governing the debt may restrict its ability to pay dividends or make other distributions to us.
Our board of directors has complete discretion on whether to pay dividends, subject to the approval of our shareholders. Even if our board of directors decides to pay dividends, the form, frequency and amount will depend upon our future operations and earnings, capital requirements and surplus, general financial condition, contractual restrictions and other factors that the board of directors may deem relevant. Any dividend we declare will be paid to the holders of ADSs, subject to the terms of the deposit agreement, to the same extent as holders of our ordinary shares, subject to the terms of the deposit agreement, including the fees and expenses payable under. Cash dividends on our ordinary shares, if any, will be paid in U.S. dollars.
We have not experienced any significant changes since the date of our audited consolidated financial statements included in this annual report.
| ITEM 9. | THE OFFER AND LISTING |
| A. | Offering and Listing Details. |
Our ADSs, each representing six of our ordinary shares, have been listed on the Nasdaq Global Market since May 17, 2007. Our ADSs trade under the symbol “CSUN.”
Since May 17, 2007, the closing price of our ADSs on the Nasdaq Global Market has ranged from US$5.05 to US$17.88 per ADS. For the year ended December 31, 2007, the closing price ranged from US$5.05 to US$17.88 per ADS.
76
The following table provides the high and low closing prices for our ADSs on the Nasdaq Global Market for the period indicated.
| | | | |
| | | Trading Price |
| | | High | | Low |
| | | US$ | | US$ |
Quarterly High and Low | | | | |
Second Quarter 2007 (from May 17, 2007) | | 16.56 | | 10.89 |
Third Quarter 2007 | | 13.97 | | 5.05 |
Fourth Quarter 2007 | | 17.88 | | 6.81 |
First Quarter 2008 | | 17.71 | | 6.49 |
| | |
Monthly Highs and Lows | | | | |
December 2007 | | 17.88 | | 9.26 |
January 2008 | | 17.71 | | 8.86 |
February 2008 | | 9.8 | | 7.05 |
March 2008 | | 7.73 | | 6.49 |
April 2008 | | 9.62 | | 7.49 |
May 2008 | | 14.29 | | 8.18 |
June 2008 (through June 5, 2008) | | 12.31 | | 11.59 |
Not applicable.
Our ADSs, each representing six of ordinary shares, have been listed on the Nasdaq Global Market since May 17, 2007 and have been trading under the symbol “CSUN.”
Not applicable.
Not applicable.
Not applicable.
| ITEM 10. | ADDITIONAL INFORMATION |
Not applicable.
77
| B. | Memorandum and Articles of Association |
We incorporate by reference into this annual report the description of our amended and restated memorandum of association contained in our F-1 registration statement (File No. 333-142367) originally filed with the SEC on April 25, 2007, as amended. Our shareholders adopted our amended and restated memorandum and articles of association by a special resolution on April 24, 2007.
We have not entered into any material contracts other than in the ordinary course of business and other than those described in Item 4, “Information on the Company” or elsewhere in this annual report on Form 20-F.
China’s government imposes control over the convertibility of RMB into foreign currencies. The conversion of RMB into foreign currencies, including U.S. dollars, has been based on rates announced by the People’s Bank of China. On July 21, 2005, the PRC government changed its decade-old policy of pegging the value of the Renminbi to the U.S. dollar. Under the new policy, the Renminbi is permitted to fluctuate within a narrow and managed band against a basket of certain foreign currencies. This change in policy has resulted in an approximately 15.3% appreciation of the RMB against the U.S. dollar between July 21, 2005 and March 31, 2008. While the international reaction to the RMB revaluation has generally been positive, there remains significant international pressure on the PRC government to adopt an even more flexible currency policy, which could result in a further and more significant appreciation of the RMB against the U.S. dollar.
Pursuant to the Foreign Exchange Control Regulations issued by the State Council on January 29, 1996, and effective as of April 1, 1996 (and amended on January 14, 1997) and the Administration of Settlement, Sale and Payment of Foreign Exchange Regulations which came into effect on July 1, 1996 regarding foreign exchange control, or the Regulations, conversion of RMB into foreign exchange by foreign investment enterprises for current account items, including the distribution of dividends and profits to foreign investors of joint ventures, is permissible. Foreign investment enterprises are permitted to remit foreign exchange from their foreign exchange bank account in China on the basis of, inter alia, the terms of the relevant joint venture contracts and the board resolutions declaring the distribution of the dividend and payment of profits. On January 14, 1997, the State Council amended the Foreign Exchange Control Regulations and added, among other things, an important provision, as Article 5 provides that the State shall not impose restrictions on recurring international current account payments and transfers. Conversion of RMB into foreign currencies and remittance of foreign currencies for capital account items, including direct investment, loans, security investment, is still subject to the approval of SAFE, in each such transaction.
Under the Regulations, foreign investment enterprises are required to open and maintain separate foreign exchange accounts for capital account items (but not for other items). In addition, foreign investment enterprises may only buy, sell and/or remit foreign currencies at those banks authorized to conduct foreign exchange business upon the production of valid commercial documents and, in the case of capital account item transactions, document approval from SAFE.
Currently, foreign investment enterprises are required to apply to SAFE for “foreign exchange registration certificates for foreign investment enterprises” (which are granted to foreign investment enterprises, upon fulfilling specified conditions and which are subject to review and renewal by SAFE on an annual basis). With such foreign exchange registration certificates and required underlying transaction documents, or with approval documents from the SAFE if the transactions are under capital account (which are obtained on a transaction-by-transaction basis), foreign-invested enterprises may enter into foreign exchange transactions at banks authorized to conduct foreign exchange business to obtain foreign exchange for their needs.
78
The following summary of the material Cayman Islands and United States federal income and estate tax consequences of an investment in our ADSs or ordinary shares is based upon laws and relevant interpretations thereof in effect as of the date of this annual report on Form 20-F, all of which are subject to change. This summary does not deal with all possible tax consequences relating to an investment in our ADSs or ordinary shares, such as the tax consequences under state, local, non-U.S., and non-Cayman Islands tax laws.
Cayman Islands Taxation
The Cayman Islands currently levies no taxes on individuals or corporations based upon profits, income, gains or appreciation and there is no taxation in the nature of inheritance tax or estate duty. There are no other taxes likely to be material to the Company levied by the Government of the Cayman Islands except for stamp duties which may be applicable on instruments executed in, or brought within the jurisdiction of the Cayman Islands. The Cayman Islands is not party to any double tax treaties. There are no exchange control regulations or currency restrictions in the Cayman Islands.
United States Federal Income Taxation
The following discussion describes the material U.S. federal income tax consequences to U.S. Holders (defined below) under present law of an investment in the ADSs or ordinary shares. This summary applies only to U.S. Holders that hold the ADSs or ordinary shares as capital assets and that have the U.S. dollar as their functional currency. This discussion is based on the tax laws of the United States as in effect on the date of this report and on U.S. Treasury regulations in effect or, in some cases, proposed, as of the date of this report, as well as judicial and administrative interpretations thereof available on or before such date. All of the foregoing authorities are subject to change, which change could apply retroactively and could affect the tax consequences described below.
The following discussion does not deal with the tax consequences to any particular investor or to persons in special tax situations such as:
| | • | | financial institutions; |
| | • | | traders that elect to mark to market; |
| | • | | persons liable for alternative minimum tax; |
| | • | | regulated investment companies or real estate investment trusts; |
| | • | | persons holding an ADS or ordinary share as part of a straddle, hedging, conversion or integrated transaction; |
| | • | | persons who acquired ADSs or ordinary shares pursuant to the exercise of any employee stock options or otherwise as compensation; |
| | • | | persons that actually or constructively own 10% or more of our voting stock; or |
| | • | | persons holding ADSs or ordinary shares through partnerships or other pass-through entities. |
79
INVESTORS ARE URGED TO CONSULT THEIR TAX ADVISORS ABOUT THE APPLICATION OF THE U.S. FEDERAL TAX RULES TO THEIR PARTICULAR CIRCUMSTANCES AS WELL AS THE STATE AND LOCAL AND FOREIGN TAX CONSEQUENCES TO THEM OF THE PURCHASE, OWNERSHIP AND DISPOSITION OF ADSS OR ORDINARY SHARES.
The discussion below of the United States federal income tax consequences to “U.S. Holders” will apply if you are the beneficial owner of ADSs or ordinary shares and you are, for U.S. federal income tax purposes,
| | • | | an individual who is a citizen or resident of the United States; |
| | • | | a corporation (or other entity taxable as a corporation for U.S. federal income tax purposes) organized under the laws of the United States, any state or the District of Columbia; |
| | • | | an estate whose income is subject to U.S. federal income taxation regardless of its source; or |
| | • | | a trust that (1) is subject to the primary supervision of a court within the United States and the control of one or more U.S. persons or (2) has a valid election in effect under applicable U.S. Treasury regulations to be treated as a U.S. person. |
The discussion below assumes that the representations contained in the deposit agreement are true and that the obligations in the deposit agreement and any related agreement will be complied with in accordance with their terms. If you hold ADSs, you should be treated as the beneficial owner of the underlying ordinary shares represented by those ADSs for U.S. federal income tax purposes.
Taxation of Dividends and Other Distributions on the ADSs or Ordinary Shares
Subject to the passive foreign investment company rules discussed below, the gross amount of all our distributions to you with respect to the ADSs or ordinary shares (including the amount of any taxes withheld therefrom) generally will be included in your gross income as ordinary dividend income on the date of actual or constructive receipt by the depositary, in the case of ADSs, or by you, in the case of ordinary shares, but only to the extent that the distribution is paid out of our current or accumulated earnings and profits (as determined under U.S. federal income tax principles). Such dividends will not be eligible for the dividends-received deduction allowed to corporations in respect of dividends received from other U.S. corporations.
With respect to non-corporate U.S. Holders, including individual U.S. Holders, for taxable years beginning before January 1, 2011, under the currently law, dividends will be “qualified dividend income” that is taxed at the lower applicable capital gains rate provided that certain conditions are satisfied, including (1) the ADSs or ordinary shares are readily tradable on an established securities market in the United States or, in the event we are deemed to be a Chinese “resident enterprise” under PRC tax law, we are eligible for the benefits of the income tax treaty between the United States and the PRC, (2) we are not a passive foreign investment company (as discussed below) for either our taxable year in which the dividend is paid or the preceding taxable year, and (3) certain holding period requirements are met. United States Treasury Department guidance indicates that our ADSs, which are listed on the Nasdaq Global Market, (but not our ordinary shares) are readily tradable on an established securities market in the United States. There can be no assurance that our ADSs will be considered readily tradable on an established securities market in later years. You should consult your tax advisors regarding the availability of the lower rate for dividends paid with respect to our ADSs or ordinary shares and any possible change in law relating to the availability of such lower rate for dividends paid by us.
Dividends will constitute foreign source income for foreign tax credit limitation purposes. If the dividends are qualified dividend income (as discussed above), the amount of the dividend taken into account for purposes of calculating the foreign tax credit limitation will in general be limited to the gross amount of the dividend, multiplied by the reduced rate divided by the highest rate of tax normally applicable to dividends. The limitation on foreign taxes eligible for credit is calculated separately with respect to specific classes of income. For this purpose, dividends distributed by us with respect to the ADSs or ordinary shares will be “passive category
80
income” or, in the case of certain U.S. Holders, “general category income.” In addition, subject to certain conditions and limitations, PRC withholding taxes on dividends may be treated as foreign taxes eligible for credit against your U.S. federal income tax liability.
To the extent that the amount of the distribution exceeds our current and accumulated earnings and profits (determined under U.S. federal income tax principles), it will be treated first as a tax-free return of your tax basis in your ADSs or ordinary shares, and to the extent the amount of the distribution exceeds your tax basis, the excess will be taxed as capital gain. We do not intend to calculate our earnings and profits under U.S. federal income tax principles. Therefore, a U.S. Holder should expect that a distribution will generally be treated as a dividend even if that distribution would otherwise be treated as a non-taxable return of capital or as capital gain under the rules described above.
Taxation of Disposition of ADSs or Ordinary Shares
Subject to the passive foreign investment company rules discussed below, you will recognize taxable gain or loss on any sale, exchange or other taxable disposition of an ADS or ordinary share equal to the difference between the amount realized (in U.S. dollars) for the ADS or ordinary share and your tax basis (in U.S. dollars) in the ADS or ordinary share. The gain or loss generally will be capital gain or loss. If you are non-corporate U.S. Holder, such as an individual U.S. Holder, who has held the ADS or ordinary share for more than one year, you will be eligible for reduced tax rates. The deductibility of capital losses is subject to limitations. Any such gain or loss that you recognize will generally be treated as United States source gain or loss for foreign tax credit limitation purposes, subject to exceptions and limitations.
Any such gain or loss that you recognize will generally be treated as United States source income or loss. However, in the event we are deemed to be a Chinese “resident enterprise” under PRC tax law, we may be eligible for the benefits of the income tax treaty between the United States and the PRC. Under that treaty, if the PRC tax were to be imposed in any gain from the disposition of the ADSs or ordinary shares, a U.S. Holder that is eligible for the benefits of the treaty may elect to treat such gain as PRC source income. You should consult your tax advisor regarding the proper treatment of gain or loss in your particular circumstances, including the effects of any applicable income tax treaties.
Passive Foreign Investment Company
A non-U.S. corporation is considered to be a PFIC for any taxable year if, applying certain look-through rules, either:
| | • | | at least 75% of its gross income is passive income; or |
| | • | | at least 50% of the value of its assets (based on an average of the quarterly values of the assets during a taxable year) is attributable to assets that produce or are held for the production of passive income. |
Based on the market value of our ADSs and ordinary shares and the composition of our assets and income and our operations, we believe we were not a “passive foreign investment company,” or PFIC, for U.S. federal income tax purposes for our taxable year ending December 31, 2007. In addition, we do not expect to be a PFIC for U.S. federal income tax purposes for our current taxable year ending December 31, 2008 or the foreseeable future. However, our PFIC status is a factual determination made after the close of each taxable year, and accordingly we cannot assure you that we will not be treated as a PFIC in our current taxable year or future taxable years.
81
If we are a PFIC for any taxable year during which you hold ADSs or shares, you will be subject to special tax rules with respect to any “excess distribution” that you receive and any gain you realize from a sale or other disposition (including a pledge) of the ADSs or ordinary shares, unless you make a “mark-to-market” election as discussed below. Under these special tax rules:
| | • | | the excess distribution or gain will be allocated ratably over your holding period for the ADSs or ordinary shares, |
| | • | | the amount allocated to the current taxable year, and any taxable year prior to the first taxable year in which we were a PFIC, will be treated as ordinary income, and |
| | • | | the amount allocated to each other year will be subject to the highest tax rate in effect for that year and the interest charge generally applicable to underpayments of tax will be imposed on the resulting tax attributable to each such year. |
If we are a PFIC for any year during which you hold ADSs or ordinary shares, we generally will continue to be treated as a PFIC with respect to you for all succeeding years during which you hold ADSs or shares. If we cease to be a PFIC, you may avoid some of the adverse effects of the PFIC regime by making a deemed sale election with respect to the ADSs or ordinary shares, as applicable.
If a U.S. holder makes a mark-to-market election, such holder generally will include as ordinary income the excess, if any, of the fair market value of the ADSs or shares at the end of each taxable year over their adjusted basis, and will be permitted an ordinary loss in respect of the excess, if any, of the adjusted basis of the ADSs or shares over their fair market value at the end of the taxable year (but only to the extent of the net amount of previously included income as a result of the mark-to-market election). Any gain recognized on the sale or other disposition of ADSs or shares will be treated as ordinary income. The mark-to-market election is available only for “marketable stock,” which is stock that is traded in other than de minimis quantities on at least 15 days during each calendar quarter on a qualified exchange or other market, as defined in applicable U.S. Treasury regulations. You are urged to consult your tax advisor regarding the application of the PFIC rules to your investment in ADSs or ordinary shares.
Information Reporting and Backup Withholding
Dividend payments with respect to ADSs or ordinary shares and proceeds from the sale, exchange or redemption of ADSs or ordinary shares may be subject to information reporting to the Internal Revenue Service and possible U.S. backup withholding at a current rate of 28%, unless the conditions of an applicable exception are satisfied. Backup withholding will not apply to a U.S. Holder who furnishes a correct taxpayer identification number and makes any other required certification or who is otherwise exempt from backup withholding. U.S. Holders who are required to establish their exempt status generally must provide such certification on Internal Revenue Service Form W-9. U.S. Holders should consult their tax advisors regarding the application of the U.S. information reporting and backup withholding rules.
Backup withholding is not an additional tax. Amounts withheld as backup withholding may be credited against your U.S. federal income tax liability, and you may obtain a refund of any excess amounts withheld under the backup withholding rules by timely filing the appropriate claim for refund with the Internal Revenue Service and furnishing any required information.
| F. | Dividends and Paying Agents |
Not Applicable.
Not Applicable.
82
We previously filed with the SEC our registration statement on Form F-1 (Registration No. 333-144282, as amended) and prospectus under the Securities Act of 1933, with respect to our ordinary shares. We have also filed with the SEC a related registration statement on F-6 (Registration No. 333-142574) to register the ADSs.
We are subject to periodic reporting and other informational requirements of the Exchange Act as applicable to foreign private issuers. Accordingly, we will be required to file reports, including annual reports on Form 20-F, and other information with the SEC. As a foreign private issuer, we are exempt from the rules of the Exchange Act prescribing the furnishing and content of proxy statements to shareholders. All information filed with the SEC can be inspected and copied at the public reference facilities maintained by the SEC at 100 F Street, N.E., Washington, D.C. 20549. You can request copies of these documents, upon payment of a duplicating fee, by writing to the SEC. Please call the SEC at 1-800-SEC-0330 for further information on the operation of the public reference rooms. You may also obtain additional information over the Internet at the SEC’s website atwww.sec.gov.
Our financial statements have been prepared in accordance with U.S. GAAP.
We will furnish our shareholders with annual reports, which will include a review of operations and annual audited consolidated financial statements prepared in conformity with U.S. GAAP.
For a listing of our subsidiaries, see Item 4, “Information on the Company—Organizational Structure.”
| ITEM 11. | QUANTITATIVE AND QUALITATIVE DISCLOSURES ABOUT MARKET RISK |
Inflation
Since our inception, inflation in China has not materially impacted our results of operations. According to the National Bureau of Statistics of China, the change of consumer price index in China was 3.9%, 1.8%, 1.5% and 4.8% in 2004, 2005, 2006 and 2007, respectively.
Foreign Exchange Risk
A substantial portion of our sales is currently denominated in Renminbi and Euros, with the remainder in U.S. dollars, while a substantial portion of our costs and expenses is denominated in U.S. dollars and Renminbi, with the remainder in Euros. Therefore, fluctuations in currency exchange rates could have a significant impact on our financial stability due to a mismatch among various foreign currency-denominated sales and costs. Fluctuations in exchange rates, particularly among the U.S. dollar, Renminbi and Euro, affect our gross and net profit margins and could result in foreign exchange and operating losses.
Our exposure to foreign exchange risk primarily relates to currency gains or losses resulting from timing differences between signing of sales contracts and settling of these contracts. Furthermore, we translate monetary assets and liabilities denominated in other currencies into Renminbi, the functional currency of our operating subsidiary, at the rates of exchange in effect at each balance sheet date. We recorded these exchange gains and losses in the statements of operations. We recorded net foreign currency losses of $0.2 million, $1.3 million and $1.2 million in 2005, 2006 and 2007, respectively. We have not used any forward contracts, currency options or borrowings to hedge our exposure to foreign currency exchange risk. We cannot predict the impact of future exchange rate fluctuations on our results of operations and may incur net foreign currency losses in the future. As our sales denominated in foreign currencies, such as U.S. dollars and Euros, continue to grow, we will consider using arrangements to hedge our exposure to foreign currency exchange risk.
83
Our financial statements are expressed in U.S. dollars but the functional currency of our operating subsidiary is Renminbi. The value of your investment in our ADSs will be affected by the foreign exchange rate between U.S. dollars and Renminbi. To the extent our operating subsidiary holds assets denominated in U.S. dollars, any appreciation of the Renminbi against the U.S. dollar could result in a increase to our financial results. On the other hand, a decline in the value of Renminbi against the U.S. dollar could reduce the U.S. dollar equivalent amounts of our financial results, the value of your investment in our company and the dividends we may pay in the future, if any, all of which may have a material adverse effect on the prices of our ADSs.
Interest Rate Risk
Our exposure to interest rate risk primarily relates to interest expenses incurred by our short-term and long-term borrowings, as well as interest income generated by excess cash invested in demand deposits with original maturities of three months or less. Such interest-earning instruments carry a degree of interest rate risk. We have not used any derivative financial instruments to manage our interest rate risk exposure. We have not been exposed nor do we anticipate being exposed to material risks due to changes in interest rates, because most of our borrowings bear fixed interest rates. However, our future interest expense may increase due to changes in market interest rates.
| ITEM 12. | DESCRIPTION OF SECURITIES OTHER THAN EQUITY SECURITIES |
Not Applicable.
84
II. PART II
| ITEM 13. | DEFAULTS, DIVIDEND ARREARAGES AND DELINQUENCIES |
Not Applicable.
| ITEM 14. | MATERIAL MODIFICATIONS TO THE RIGHTS OF SECURITY HOLDERS AND USE OF PROCEEDS |
In May 2007, we completed an initial public offering of 9,775,000 ADSs on the Nasdaq Global Market at $11.00 per ADS. We received net proceeds after expenses of approximately $95.9 million. The net proceeds from our public offering on NASDAQ were allocated as follows:
| | • | | approximately $51 million for purchasing raw materials and other working capital requirements; and |
| | • | | approximately $20 million for modifying our existing solar cell manufacturing lines and expanding our solar cell manufacturing facilities. |
Of the remaining amount of the net proceeds, approximately $20 million has been pledged to procure RMB bank loans for our working capital requirements.
As of December 31, 2007, our cash resources amount to $60.5 million, comprised of cash on hand and demand deposits.
| ITEM 15. | CONTROLS AND PROCEDURES |
Evaluation of Disclosure Controls and Procedures
Our management, with the participation of our chief executive officer and chief financial officer, has performed an evaluation of the effectiveness of our disclosure controls and procedures within the meaning of Rules 13a-15(e) and 15d-15(e) of the Exchange Act as of the end of the period covered by this report. Based on such evaluation, our management has concluded that, as of the end of the period covered by this annual report, our disclosure controls and procedures were effective.
Internal Control over Financial Reporting
This annual report does not include a report of management’s assessment regarding internal control over financial reporting and attestation report of the company’s registered public accounting firm due to a transition period established by rules of the SEC for newly public companies.
Changes in Internal Control
There were changes in our internal control over financial reporting that occurred during the period covered by this annual report on Form 20-F that have materially affected, or are reasonably likely to materially affect, our internal controls over financial reporting.
Prior to our initial public offering in May 2007, we were a young, private company with limited accounting and other resources with which to adequately address our internal controls and procedures. During the audits of our financial statements as of our financial statements as of and for the periods ended December 31, 2004, 2005 and 2006, we and our auditors became aware of certain deficiencies in our internal controls, including a material weakness and a number of significant deficiencies. The material weakness was insufficient resources in our accounting department to properly identify adjustments, analyze transactions and prepare financial statements in accordance with U.S. GAAP. Significant deficiencies included issues relating to segregation of duties, reconciliations between sub-ledger and the general ledger, management of inventory and fixed assets, recording of construction-in-progress, salary expense recording and transaction balance reconciliations. In addition, our
85
independent registered public accounting firm identified a treasury and cash flow planning deficiency. These deficiencies could adversely affect our ability to record, process, summarize and report financial data consistent with the assertions of management in the financial statements and could negatively affect our ability to comply with the requirements of U.S. GAAP. During 2007, we took measures to remediate the above material weaknesses and other control deficiencies, including recruiting additional finance and accounting personnel, implementing additional control procedures, and reinforcing the existing controls. We cannot yet conclude that the implementation of the above measures will fully address the difficulties in our internal control over financial reporting.
In connection with the audit of our financial statements as of and for the period ended December 31, 2007, we and our auditors identified several significant deficiencies in connection with access control on important transactions in our enterprise resource planning, or ERP, system, our management of inventory and fixed assets, recording of construction-in-progress, bad debt provision and ERP software application development; we did not, however, note any material weakness in internal control over financial reporting that would result in material audit adjustments to our financial statements and corrections to our footnote disclosures.
It is important to note that neither we nor our independent registered public accounting firm undertook a comprehensive assessment of our internal controls for purposes of identifying reporting deficiencies in our internal control over financial reporting, as we and they will be required to do beginning with our annual report on Form 20-F for the fiscal year ending December 31, 2008. We believe it is possible that, had we performed a formal assessment of our internal control over financial reporting or had our independent registered public accounting firm performed an audit of our internal control over financial reporting, additional deficiencies may have been identified.
We plan to remediate the remaining factors that caused our control deficiencies in time to meet the deadline for compliance with the requirements of Section 404 of the Sarbanes-Oxley Act. We have engaged an external consultant to assist us in evaluating, designing, implementing and testing our internal controls over financial reporting intended to comply with the requirements of Section 404.
| ITEM 16A. AUDIT | COMMITTEE FINANCIAL EXPERT |
Our board of directors has determined that Jian Li, an independent director and member of our audit committee, is an audit committee financial expert.
Our board of directors has adopted a code of ethics that applies to our directors, officers, employees and agents, including certain provisions that specifically apply to our chief executive officer, chief financial officer, senior finance officer, controller, vice presidents and any other persons who perform similar functions for us. We hereby undertake to provide to any person without charge, a copy of our code of business conduct and ethics within ten working days after we receive such person’s written request.
| ITEM 16C. PRINCIPAL | ACCOUNTANT FEES AND SERVICES |
The following table sets forth the aggregate fees by categories specified below in connection with certain professional services rendered by Deloitte Touche Tohmatsu CPA Ltd., our principal external auditors, for the periods indicated. We did not pay any tax related or other fees to our auditors during the periods indicated below.
| | | | | | | | | | |
| | | 2004 | | 2005 | | 2006 | | 2007 |
Audit fees(1) | | — | | — | | $ | 450,000 | | $ | 480,000 |
Audit-related fees(2) | | — | | — | | $ | 300,000 | | $ | 300,000 |
Tax fees | | — | | — | | | — | | | — |
All other fees | | — | | — | | | — | | | — |
| (1) | “Audit fees” means the aggregate fees billed in each of the fiscal years listed for professional services rendered by our principal auditors for the audit of our annual financial statements. |
86
| (2) | “Audit-related fees” means the aggregate fees billed in each of the fiscal years listed for assurance and related services by our principal auditors that are reasonably related to the performance of the audit or review of our financial statements and are not reported under “Audit fees.” Services comprising the fees disclosed under the category of “Audit-related fees” involve principally the issue of comfort letter, rendering of listing advice, and other audit-related services for the years ended December 31, 2004, December 31, 2005, December 31, 2006 and December 31, 2007. |
We engaged Deloitte Touche Tohmatsu CPA Ltd. in 2006. Total service fees billed to 2006 related to these professional services in 2004, 2005, 2006 and 2007 amounted to nil, nil, $750,000 and $780,000, respectively.
The policy of our audit committee is to pre-approve all audit and non-audit services provided by Deloitte Touche Tohmatsu CPA Ltd., including audit services, audit-related services, tax services and other services as described above, other than those for de minimus services which are approved by the Audit Committee prior to the completion of the audit.
| ITEM 16D. EXEMPTIONS | FROM THE LISTING STANDARDS FOR AUDIT COMMITTEES |
We are in compliance with the Nasdaq corporate governance rules with respect to the audit committee.
| ITEM 16E. PURCHASES | OF EQUITY SECURITIES BY THE ISSUER AND AFFILIATED PURCHASERS |
Not Applicable.
87
III. PART III
| ITEM 17. | FINANCIAL STATEMENTS |
We have elected to provide financial statements pursuant to Item 18.
| ITEM 18. | FINANCIAL STATEMENTS |
The consolidated financial statements of China Sunergy and its subsidiaries are included at the end of this annual report.
| | |
Exhibit
Number | | Description of Document |
| 1.1 | | Amended and Restated Memorandum and Articles of Association of the Registrant (incorporated by reference to Exhibit 3.2 from our Registration Statement on Form F-1 (file no. 333-142367) filed with the Securities and Exchange Commission on April 25, 2007). |
| |
| 2.1 | | Registrant’s Specimen American Depositary Receipt (included in Exhibit 2.3). |
| |
| 2.2 | | Registrant’s Specimen Certificate for Ordinary shares (incorporated by reference to Exhibit 4.2 from our Registration Statement on Form F-1 (file no. 333-142367) filed with the Securities and Exchange Commission on April 25, 2007). |
| |
| 2.3 | | Form of Deposit Agreement among the Registrant, JPMorgan Chase Bank, N.A. as depositary, and holders of the American Depositary Receipts (incorporated by reference to Exhibit 4.3 from our Registration Statement on Form F-1 Amendment No. 2 (file no. 333-142367) filed with the Securities and Exchange Commission on April 25, 2007). |
| |
| 4.1 | | Subscription Agreement among the Registrant and other parties therein dated as of September 17, 2006 (incorporated by reference to Exhibit 4.4 from our Registration Statement on Form F-1 (file no. 333-142367) filed with the Securities and Exchange Commission on April 25, 2007). |
| |
| 4.2 | | Shareholders Agreement among the Registrant and other parties therein dated as of September 26, 2006, amended as of October 24, 2006, March 22, 2007 and April 24, 2007 (incorporated by reference to Exhibit 4.5 from our Registration Statement on Form F-1 (file no. 333-142367) filed with the Securities and Exchange Commission on April 25, 2007). |
| |
| 4.3 | | Registration Rights Agreement among the Registrant and other parties therein dated as of September 26, 2006 (incorporated by reference to Exhibit 4.6 from our Registration Statement on Form F-1 (file no. 333-142367) filed with the Securities and Exchange Commission on April 25, 2007). |
| |
| 4.4 | | Sale and Purchase Agreement among the Registrant, Sunergy BVI and other parties therein dated as of August 29, 2006 (incorporated by reference to Exhibit 4.7 from our Registration Statement on Form F-1 (file no. 333-142367) filed with the Securities and Exchange Commission on April 25, 2007). |
| |
| 4.5 | | Agreement for the Transfer and Assumption of Obligations among the Registrant, Sunergy BVI and other parties therein dated as of August 29, 2006 (incorporated by reference to Exhibit 4.8 from our Registration Statement on Form F-1 (file no. 333-142367) filed with the Securities and Exchange Commission on April 25, 2007). |
| |
| 4.6 | | Subscription Agreement among the Sunergy BVI, Sunergy Nanjing and other parties therein dated as of April 4, 2006 (incorporated by reference to Exhibit 4.9 from our Registration Statement on Form F-1 (file no. 333-142367) filed with the Securities and Exchange Commission on April 25, 2007) |
88
| | |
Exhibit
Number | | Description of Document |
| 4.7 | | Warrant Purchase Agreement among the Sunergy BVI, Sunergy Nanjing and other parties therein dated as of March 8, 2006 (incorporated by reference to Exhibit 4.10 from our Registration Statement on Form F-1 (file no. 333-142367) filed with the Securities and Exchange Commission on April 25, 2007). |
| |
| 4.8 | | Amended Share Incentive Plan, including form of Share Option Award Agreement (incorporated by reference to Exhibit 10.1 from our Registration Statement on Form F-1 (file no. 333-142367) filed with the Securities and Exchange Commission on April 25, 2007). |
| |
| 4.9* | | Second Share Incentive Plan, including form of Restricted Share Award Agreement. |
| |
| 4.10 | | Form of Indemnification Agreement between the Registrant and its directors (incorporated by reference to Exhibit 10.2 from our Registration Statement on Form F-1 (file no. 333-142367) filed with the Securities and Exchange Commission on April 25, 2007). |
| |
| 4.11* | | Form of Employment Agreement between the Registrant and a Senior Executive Officer of the Registrant. |
| |
| 4.12* | | Form of Director Agreement between the Registrant and certain independent directors. |
| |
| 4.13 | | English Translation of Authorization License for Usage of Trademark between China Electric Equipment Group Co., Ltd. and Sunergy Nanjing dated as of June 7, 2006 (incorporated by reference to Exhibit 10.4 from our Registration Statement on Form F-1 (file no. 333-142367) filed with the Securities and Exchange Commission on April 25, 2007). |
| |
| 4.14 | | English Translation of Trademark License Agreement between China Electric Equipment Group Co., Ltd. and Sunergy Nanjing dated as of March 15, 2006 (incorporated by reference to Exhibit 10.5 from our Registration Statement on Form F-1 (file no. 333-142367) filed with the Securities and Exchange Commission on April 25, 2007). |
| |
| 4.15 | | English Translation of License Authorization for Usage of Trademark between China Electric Equipment Group Co., Ltd. and Sunergy Nanjing dated as of February 9, 2006 (incorporated by reference to Exhibit 10.6 from our Registration Statement on Form F-1 (file no. 333-142367) filed with the Securities and Exchange Commission on April 25, 2007). |
| |
| 4.16 | | English Translation of Purchase Contract (Contract No: JS-0500747) Jiangsu between CEEG Electrical Transmission and Distribution Equipment Co., Ltd. and Sunergy Nanjing dated as of December 1, 2005 (incorporated by reference to Exhibit 10.7 from our Registration Statement on Form F-1 (file no. 333-142367) filed with the Securities and Exchange Commission on April 25, 2007). |
| |
| 4.17 | | English Translation of Purchase Contract (Contract No: JS-0500748) Jiangsu between CEEG Electrical Transmission and Distribution Equipment Co., Ltd. and Sunergy Nanjing dated as of December 1, 2005 (incorporated by reference to Exhibit 10.9 from our Registration Statement on Form F-1 (file no. 333-142367) filed with the Securities and Exchange Commission on April 25, 2007). |
| |
| 4.18 | | English Translation of Industrial Product Sales Contract between CEEG Nanjing International Trade Co., Ltd. And Sunergy Nanjing undated (incorporated by reference to Exhibit 10.10 from our Registration Statement on Form F-1 (file no. 333-142367) filed with the Securities and Exchange Commission on April 25, 2007). |
| |
| 4.19 | | English Translation of Sales Contract between Jiangsu East China Micro-wave Equipment Co., Ltd. and Sunergy Nanjing dated as of April 21, 2006 (incorporated by reference to Exhibit 10.11 from our Registration Statement on Form F-1 (file no. 333-142367) filed with the Securities and Exchange Commission on April 25, 2007). |
89
| | |
Exhibit
Number | | Description of Document |
| 4.20 | | English Translation of Sales Contract between Jiangsu East China Micro-wave Equipment Co., Ltd. and Sunergy Nanjing dated as of June 14, 2006 (incorporated by reference to Exhibit 10.12 from our Registration Statement on Form F-1 (file no. 333-142367) filed with the Securities and Exchange Commission on April 25, 2007). |
| |
| 4.21 | | English Translation of Sales Contract between CEEG Nanjing International Trade Co., Ltd. and Sunergy Nanjing dated as of September 12, 2006 (incorporated by reference to Exhibit 10.13 from our Registration Statement on Form F-1 (file no. 333-142367) filed with the Securities and Exchange Commission on April 25, 2007). |
| |
| 4.22 | | English Translation of Sales Contract between CEEG Nanjing International Trade Co., Ltd. and Sunergy Nanjing dated as of July 11, 2006 (incorporated by reference to Exhibit 10.14 from our Registration Statement on Form F-1 (file no. 333-142367) filed with the Securities and Exchange Commission on April 25, 2007). |
| |
| 4.23 | | English Translation of Sales Contract between CEEG Nanjing International Trade Co., Ltd. and Sunergy Nanjing dated as of April 3, 2006 (incorporated by reference to Exhibit 10.15 from our Registration Statement on Form F-1 (file no. 333-142367) filed with the Securities and Exchange Commission on April 25, 2007). |
| |
| 4.24 | | English Translation of Sales Contract between CEEG Nanjing International Trade Co., Ltd. and Sunergy Nanjing dated as of April 10, 2006 (incorporated by reference to Exhibit 10.16 from our Registration Statement on Form F-1 (file no. 333-142367) filed with the Securities and Exchange Commission on April 25, 2007). |
| |
| 4.25 | | English Translation of Sales Contract between CEEG Nanjing International Trade Co., Ltd. and Sunergy Nanjing dated as of March 3, 2006 (incorporated by reference to Exhibit 10.17 from our Registration Statement on Form F-1 (file no. 333-142367) filed with the Securities and Exchange Commission on April 25, 2007). |
| |
| 4.26 | | English Translation of Sales Contract between CEEG Nanjing International Trade Co., Ltd. and Sunergy Nanjing dated as of August 17, 2006 (incorporated by reference to Exhibit 10.18 from our Registration Statement on Form F-1 (file no. 333-142367) filed with the Securities and Exchange Commission on April 25, 2007). |
| |
| 4.27 | | English Translation of Sales Contract between CEEG Nanjing International Trade Co., Ltd. and Sunergy Nanjing dated as of August 31, 2006 (incorporated by reference to Exhibit 10.19 from our Registration Statement on Form F-1 (file no. 333-142367) filed with the Securities and Exchange Commission on April 25, 2007). |
| |
| 4.28 | | English Translation of Sales Contract between CEEG Nanjing International Trade Co., Ltd. and Sunergy Nanjing dated as of November 14, 2006 (incorporated by reference to Exhibit 10.20 from our Registration Statement on Form F-1 (file no. 333-142367) filed with the Securities and Exchange Commission on April 25, 2007). |
| |
| 4.29 | | English Translation of Sales Contract between CEEG Nanjing International Trade Co., Ltd. and Sunergy Nanjing dated as of February 2, 2007 (incorporated by reference to Exhibit 10.21 from our Registration Statement on Form F-1 (file no. 333-142367) filed with the Securities and Exchange Commission on April 25, 2007). |
| |
| 4.30 | | English Translation of Long-term Sales Contract between CEEG Nanjing International Trade Co., Ltd. and Sunergy Nanjing undated (incorporated by reference to Exhibit 10.22 from our Registration Statement on Form F-1 (file no. 333-142367) filed with the Securities and Exchange Commission on April 25, 2007). |
90
| | |
Exhibit
Number | | Description of Document |
| 4.31 | | English Translation of Sales Contract between CEEG Nanjing International Trade Co., Ltd. and Sunergy Nanjing dated as of March 5, 2007 (incorporated by reference to Exhibit 10.24 from our Registration Statement on Form F-1 (file no. 333-142367) filed with the Securities and Exchange Commission on April 25, 2007). |
| |
| 4.32 | | English Translation of Purchase Contract between Jiangsu Zhongneng and Sunergy Nanjing dated as of March 1, 2007 (incorporated by reference to Exhibit 10.13 from our Registration Statement on Form F-1 (file no. 333-142367) filed with the Securities and Exchange Commission on April 25, 2007). |
| |
| 4.33 | | English Translation of Long-term Sales Contract between ET Solar Industry Limited and Sunergy Nanjing dated as of February 5, 2007 (incorporated by reference to Exhibit 10.25 from our Registration Statement on Form F-1 (file no. 333-142367) filed with the Securities and Exchange Commission on April 25, 2007). |
| |
| 4.34 | | English Translation of Long-term Sales Contract between Wuxi Guofei Green Energy Source Co., Ltd. and Sunergy Nanjing dated as of February 5, 2007 (incorporated by reference to Exhibit 10.26 from our Registration Statement on Form F-1 (file no. 333-142367) filed with the Securities and Exchange Commission on April 25, 2007). |
| |
| 4.35 | | English Translation of Loan Contract between Nanjing City Commercial Bank and Sunergy Nanjing dated as of February 7, 2007 (incorporated by reference to Exhibit 10.27 from our Registration Statement on Form F-1 (file no. 333-142367) filed with the Securities and Exchange Commission on April 25, 2007). |
| |
| 4.36 | | English Translation of Pledge Contract between Nanjing City Commercial Bank and Sunergy Nanjing dated as of February 5, 2007 (incorporated by reference to Exhibit 10.28 from our Registration Statement on Form F-1 (file no. 333-142367) filed with the Securities and Exchange Commission on April 25, 2007). |
| |
| 4.37 | | English Translation of Collateral Escrow Agreement among Nanjing City Commercial Bank , Sunergy Nanjing and Jiangsu Yuanli Ruide Assets Escrow Co., Ltd. dated as of February 5, 2007 (incorporated by reference to Exhibit 10.29 from our Registration Statement on Form F-1 (file no. 333-142367) filed with the Securities and Exchange Commission on April 25, 2007). |
| |
| 4.38 | | English Translation of Loan Contract between Nanjing Bank of Communications and Sunergy Nanjing dated as of November 30, 2006 (incorporated by reference to Exhibit 10.30 from our Registration Statement on Form F-1 (file no. 333-142367) filed with the Securities and Exchange Commission on April 25, 2007). |
| |
| 4.39 | | English Translation of Guarantee Contract between China Electric Equipment Group Co., Ltd. and Bank of Communications dated as of November 30, 2006 (incorporated by reference to Exhibit 10.31 from our Registration Statement on Form F-1 (file no. 333-142367) filed with the Securities and Exchange Commission on April 25, 2007). |
| |
| 4.40 | | English Translation of Form of Loan Contract between Sunergy Nanjing and Industrial and Commercial Bank of China (incorporated by reference to Exhibit 10.32 from our Registration Statement on Form F-1 (file no. 333-142367) filed with the Securities and Exchange Commission on April 25, 2007). |
| |
| 4.41 | | English Translation of Form of Pledge Contract between Industrial and Commercial Bank of China (incorporated by reference to Exhibit 10.33 from our Registration Statement on Form F-1 (file no. 333-142367) filed with the Securities and Exchange Commission on April 25, 2007). |
91
| | |
Exhibit
Number | | Description of Document |
| 4.42 | | English Translation of Form of Commodity Financing Pledge Supervision Agreement among Industrial and Commercial Bank of China, Sunergy Nanjing and Jiangsu Yuanli Ruide Assets Supervision Co., Ltd. (incorporated by reference to Exhibit 10.34 from our Registration Statement on Form F-1 (file no. 333-142367) filed with the Securities and Exchange Commission on April 25, 2007). |
| |
| 4.43 | | English Translation of Security Undertaking Agreement between China Electric Equipment Group Co., Ltd. and Sunergy Nanjing dated as of December 18, 2006 (incorporated by reference to Exhibit 10.35 from our Registration Statement on Form F-1 (file no. 333-142367) filed with the Securities and Exchange Commission on April 25, 2007). |
| |
| 4.44 | | English Translation of Land Use Right Agreement between China Electric Equipment Group Co., Ltd. and Sunergy Nanjing dated as of December 20, 2006 (incorporated by reference to Exhibit 10.36 from our Registration Statement on Form F-1 (file no. 333-142367) filed with the Securities and Exchange Commission on April 25, 2007). |
| |
| 4.45 | | English Translation of Property Lease Contract between CEEG (Nanjing) Special Transformers Co., Ltd. and Sunergy Nanjing dated as of August 29, 2006 (incorporated by reference to Exhibit 10.37 from our Registration Statement on Form F-1 (file no. 333-142367) filed with the Securities and Exchange Commission on April 25, 2007). |
| |
| 4.46 | | English Translation of Agreement between CEEG (Nanjing) Special Transformers Co., Ltd. and Sunergy Nanjing dated February 22, 2007 (incorporated by reference to Exhibit 10.38 from our Registration Statement on Form F-1 (file no. 333-142367) filed with the Securities and Exchange Commission on April 25, 2007). |
| |
| 4.47 | | Series A and Series B Preferred Shares Sale and Purchase Agreement dated as of March 22, 2007 (incorporated by reference to Exhibit 10.39 from our Registration Statement on Form F-1 (file no. 333-142367) filed with the Securities and Exchange Commission on April 25, 2007). |
| |
| 4.48 | | English Translation of Sales Contract between CEEG Nanjing International Trade Co., Ltd. and Sunergy Nanjing dated as of March 27, 2007 (incorporated by reference to Exhibit 10.40 from our Registration Statement on Form F-1 (file no. 333-142367) filed with the Securities and Exchange Commission on April 25, 2007). |
| |
| 4.49 | | English Translation of Lease Contract between China Electric Equipment Group Co., Ltd and Sunergy Nanjing dated as of April 1, 2007 (incorporated by reference to Exhibit 10.41 from our Registration Statement on Form F-1 (file no. 333-142367) filed with the Securities and Exchange Commission on April 25, 2007). |
| |
| 4.50* | | English Translation of Joint Venture Contract between Sunergy BVI and CEEG in 2007. |
| |
| 4.51* | | English Translation of Land Use Right Transfer Agreement between China Electric Equipment Group Co., Ltd. and Sunergy Nanjing dated as of July 23, 2007. |
| |
| 4.52* | | English Translation of Form of Equipment Purchase Contract between China Electric Equipment Group Co., Ltd and Sunergy Nanjing. |
| |
| 4.53* | | English Translation of Form of Guarantee Contract between China Electric Equipment Group Co., Ltd. and Bank of Communications. |
| |
| 4.54* | | English Translation of Comprehensive Credit Granting Contract between Sunergy Nanjing and China Citic Bank dated as of January 9, 2008. |
| |
| 4.55* | | English Translation of Maximum Guarantee Contract between China Electric Equipment Group Co., Ltd. and China Citic Bank dated as of January 9, 2008. |
92
| | |
Exhibit
Number | | Description of Document |
| 4.56* | | English Translation of Maximun Guarantee Contract between China Electric Equipment Group Co., Ltd. and Huaxia Bank dated as of May 31, 2007. |
| |
| 4.57* | | English Translation of Form of Guarantee Contract between China Electric Equipment Group Co., Ltd. and Industrial and Commercial Bank of China. |
| |
| 4.58* | | English Translation of Maximum Guarantee Contract between China Electric Equipment Group Co., Ltd. and Evergrowing Bank dated as of November 1, 2007. |
| |
| 4.59* | | English Translation of Guarantee Contract among China Electric Equipment Group, Tingxiu Lu and Agriculture Bank of China dated as of December 27, 2007. |
| |
| 4.60* | | English Translation of Guarantee Contract between China Electric Equipment Group Co., Ltd. and Nanjing Jiangning Rural Credit Cooperative dated as of January 24, 2008. |
| |
| 4.61* | | English Translation of Guarantee Contract between China Construction Bank and China Electric Equipment Group Co., Ltd. dated as of November 15, 2007 |
| |
| 4.62* | | English Translation of Guarantee Contract between Tingxiu Lu and Bank of Shanghai dated as of February 2, 2008. |
| |
| 4.63* | | English Translation of Guarantee Contract between China Electric Equipment Group Co., Ltd. and Bank of Shanghai dated as of February 2, 2008. |
| |
| 4.64* | | English Translation of Credit Granting Contract between Sunergy Nanjing and China Merchant Bank dated as of January 18, 2008. |
| |
| 4.65* | | English Translation of Agreement on Co-Construction Transformer Substation between China Electric Equipment Group Co., Ltd. dated as of November 2, 2007. |
| |
| 4.66†* | | Sales Contract between Aleo Solar AG and Sunergy Nanjing dated as of October 4, 2007 as well as Supplementary Contract dated as of January 21, 2008. |
| |
| 4.67* | | English Translation of Sales Contract between CEEG Nanjing International Trade Co., Ltd. and Sunergy Nanjing dated as of October 15, 2007. |
| |
| 4.68* | | English Translation of Purchase Contract between CEEG (Nanjing) Semiconductor Material Co., Ltd. and Sunergy Nanjing dated as of December 11, 2007. |
| |
| 4.69* | | English Translation of Form of Purchase Contract between CEEG (Nanjing) Semiconductor Material Co., Ltd. and Sunergy Nanjing. |
| |
| 4.70* | | English Translation of Purchase Contract between CEEG (Nanjing) Semiconductor Material Co., Ltd. and Sunergy Nanjing dated as of December 29, 2007. |
| |
| 4.71* | | English Translation of Sales Contract between CEEG (Nanjing) Semiconductor Material Co., Ltd. and Sunergy Nanjing dated as of November 20, 2007. |
| |
| 4.72* | | English Translation of Purchase Contract between CEEG (Nanjing) Solar Research Institute and Sunergy Nanjing dated as of November 28, 2007. |
| |
| 4.73* | | English Translation of Form of Sales Contract between CEEG (Shanghai) Solar Science and Technology Co., Ltd. and Sunergy Nanjing. |
| |
| 4.74* | | English Translation of Long-term Sales Contract between CEEG (Shanghai) Solar Science and Technology Co., Ltd. and Sunergy Nanjing dated as of January 10, 2008 |
93
| | |
Exhibit
Number | | Description of Document |
| 4.75* | | English Translation of Purchase Contract between CEEG (Shanghai) Solar Science and Technology Co., Ltd. and Sunergy Nanjing dated as of November 28, 2007. |
| |
| 4.76* | | English Translation of Module Processing Contract between CEEG (Shanghai) Solar Science and Technology Co., Ltd. and Sunergy Nanjing dated as of December 19, 2007. |
| |
| 4.77* | | English Translation of Security Agreement between China Electric Equipment Group Co., Ltd. and Sunergy Nanjing. |
| |
| 8.1* | | Subsidiaries of the Registrant. |
| |
| 11.1 | | Code of Business Conduct and Ethics of the Registrant (incorporated by reference to Exhibit 99.1 from our Registration Statement on Form F-1 (file no. 333-142367) filed with the Securities and Exchange Commission on April 25, 2007). |
| |
| 12.1* | | CEO Certification Pursuant to Section 302 of the Sarbanes-Oxley Act of 2002. |
| |
| 12.2* | | CFO Certification Pursuant to Section 302 of the Sarbanes-Oxley Act of 2002. |
| |
| 13.1* | | CEO Certification Pursuant to Section 906 of the Sarbanes-Oxley Act of 2002. |
| |
| 13.2* | | CFO Certification Pursuant to Section 906 of the Sarbanes-Oxley Act of 2002. |
| |
| 15.1* | | Consent of Conyers Dill & Pearman. |
| |
| 15.2* | | Consent of Jun He Law Offices. |
| |
| 15.3* | | Consent of Deloitte Touche Tohmatsu, Independent Registered Public Accounting Firm. |
| * | Filed with this Annual Report on Form 20-F. |
| † | Confidential treatment has been requested with respect to portions of this exhibit and such confidential treatment portions have been deleted and replaced with “****” and filed separately with the Securities and Exchange Commission pursuant to Rule 406 under the Securities Act of 1933. |
94
SIGNATURES
The registrant hereby certifies that it meets all of the requirements for filing its annual report on Form 20-F and that it has duly caused and authorized the undersigned to sign this annual report on its behalf.
| | |
| CHINA SUNERGY CO., LTD. |
| |
| By | | /S/ RUENNSHENG ALLEN WANG |
| Name: | | Ruennsheng Allen Wang |
| Title: | | Chief Executive Officer |
Date: June 6, 2008
95
CHINA SUNERGY CO., LTD.
INDEX TO CONSOLIDATED FINANCIAL STATEMENTS
F-1
REPORT OF INDEPENDENT REGISTERED PUBLIC ACCOUNTING FIRM
TO THE BOARD OF DIRECTORS AND SHAREHOLDERS OF
CHINA SUNERGY CO., LTD.
We have audited the accompanying consolidated balance sheets of China Sunergy Co., Ltd. and subsidiaries (the “Group”) as of December 31, 2005, 2006 and 2007, and the related consolidated statements of operations, shareholders’ equity and comprehensive income (loss), and cash flows for each of the three years in the period ended December 31, 2007 and the related financial statement schedule included in Schedule I. These financial statements and financial statement schedule are the responsibility of the Company’s management. Our responsibility is to express an opinion on the financial statements and financial statement schedule based on our audits.
We conducted our audits in accordance with the standards of the Public Company Accounting Oversight Board (United States). Those standards require that we plan and perform the audit to obtain reasonable assurance about whether the financial statements are free of material misstatement. The Company is not required to have, nor were we engaged to perform, an audit of its internal control over financial reporting. Our audit included consideration of internal control over financial reporting as a basis for designing audit procedures that are appropriate in the circumstances, but not for the purpose of expressing an opinion on the effectiveness of the Group’s internal control over financial reporting. Accordingly, we express no such opinion. An audit also includes examining, on a test basis, evidence supporting the amounts and disclosures in the financial statements, assessing the accounting principles used and significant estimates made by management, as well as evaluating the overall financial statement presentation. We believe that our audits provide a reasonable basis for our opinion.
In our opinion, such consolidated financial statements present fairly, in all material respects, the financial position of China Sunergy Co., Ltd. and subsidiaries as of December 31, 2005, 2006 and 2007, and the results of their operations and their cash flows for each of the three years in the period ended December 31, 2007 in conformity with accounting principles generally accepted in the United States of America. Also, in our opinion, such financial statement schedule, when considered in relation to the basic consolidated financial statements taken as a whole, presents fairly in all material respects, the information set forth therein.
Deloitte Touche Tohmatsu CPA Ltd.
Shanghai, China
May 19, 2008
F-2
CHINA SUNERGY CO., LTD.
CONSOLIDATED BALANCE SHEETS
(In U.S. dollars)
| | | | | | |
| | | December 31, |
| | | 2005 | | 2006 | | 2007 |
| | | $ | | $ | | $ |
ASSETS | | | | | | |
Current assets: | | | | | | |
Cash and cash equivalents | | 2,765,387 | | 14,749,575 | | 60,457,666 |
Restricted cash | | 21,958,666 | | 4,952,473 | | 23,473,400 |
Inventories | | 6,647,035 | | 44,331,156 | | 56,091,909 |
Accounts receivable, net of allowance for doubtful accounts of, $nil, $nil and $nil in 2005, 2006 and 2007, respectively | | 1,705,390 | | 43,048,151 | | 26,817,355 |
Advances to suppliers, net of allowance for doubtful accounts of $nil, $nil and $1,109,602 in 2005, 2006 and 2007, respectively | | 17,408,297 | | 26,281,257 | | 79,912,181 |
Amounts due from related parties | | 14,104,283 | | 1,976,410 | | 2,111,890 |
Current deferred tax assets | | — | | — | | 527,361 |
Prepaid expenses and other current assets | | 280,858 | | 1,081,935 | | 16,315,963 |
| | | | | | |
Total current assets | | 64,869,916 | | 136,420,957 | | 265,707,725 |
Property, plant and equipment, net | | 13,413,907 | | 38,729,631 | | 52,928,765 |
Intangible assets, net | | 943,674 | | 1,026,447 | | 2,179,486 |
Non-current deferred tax assets | | 79,757 | | 150,431 | | 328,574 |
| | | | | | |
TOTAL ASSETS | | 79,307,254 | | 176,327,466 | | 321,144,550 |
| | | | | | |
F-3
CHINA SUNERGY CO., LTD.
CONSOLIDATED BALANCE SHEETS—(Continued)
(In U.S. dollars)
| | | | | | | | |
| | | December 31, | |
| | | 2005 | | | 2006 | | 2007 | |
| | | $ | | | $ | | $ | |
LIABILITIES, MEZZANINE EQUITY AND SHAREHOLDERS’ EQUITY | | | | | | | | |
Current liabilities: | | | | | | | | |
Short-term bank borrowings | | 21,684,717 | | | 69,262,771 | | 121,841,022 | |
Current portion of long-term borrowings | | — | | | 8,673,886 | | — | |
Accounts payable | | 3,215,822 | | | 11,845,496 | | 7,157,113 | |
Accrued expenses and other current liabilities | | 924,154 | | | 1,368,368 | | 2,344,176 | |
Advances from customers | | 11,131,870 | | | 949,915 | | 4,892,450 | |
Amounts due to related parties | | 28,436,868 | | | 3,742 | | 8,214 | |
| | | | | | | | |
Total current liabilities | | 65,393,431 | | | 92,104,178 | | 136,242,975 | |
Long-term bank borrowings | | 8,673,886 | | | — | | — | |
Other liabilities | | — | | | 157,595 | | 1,053,482 | |
| | | | | | | | |
Total liabilities | | 74,067,317 | | | 92,261,773 | | 137,296,457 | |
| | | | | | | | |
Commitments and contingencies (Note 16) | | | | | | | | |
| | | |
Mezzanine equity: | | | | | | | | |
Series A redeemable convertible preferred shares ($0.0001 par value; 12,847,300 shares authorized, nil, 12,847,340 and nil shares issued and outstanding as of December 31, 2005, 2006 and 2007, respectively) | | — | | | 13,227,862 | | — | |
Series B redeemable convertible preferred shares ($0.0001 par value; 23,905,100 shares authorized, nil, 23,905,100 and nil shares issued and outstanding as of December 31, 2005 2006 and 2007, respectively) | | — | | | 28,501,788 | | — | |
Series C redeemable convertible preferred shares ($0.0001 par value; 6,901,000 shares authorized, nil, 6,901,000 and nil shares issued and outstanding as of December 31, 2005 2006 and 2007, respectively) | | — | | | 20,056,093 | | — | |
| | | |
Shareholders’ equity: | | | | | | | | |
Ordinary shares (par value $0.0001; 463,247,600 shares authorized, nil, 104,544,000 and 237,332,777 shares issued and outstanding as of December 31, 2005, 2006 and 2007, respectively) | | — | | | 10,454 | | 23,733 | |
Additional paid-in capital | | 9,450,000 | | | 20,144,945 | | 178,361,461 | |
Subscription receivable | | (3,052,020 | ) | | — | | — | |
Accumulated deficit | | (1,266,067 | ) | | — | | (4,854,650 | ) |
Accumulated other comprehensive income | | 108,024 | | | 2,124,551 | | 10,317,549 | |
| | | | | | | | |
Total shareholders’ equity | | 5,239,937 | | | 22,279,950 | | 183,848,093 | |
| | | | | | | | |
TOTAL LIABILITIES, MEZZANINE EQUITY AND SHAREHOLDERS’ EQUITY | | 79,307,254 | | | 176,327,466 | | 321,144,550 | |
| | | | | | | | |
The accompanying notes are an integral part of these consolidated financial statements.
F-4
CHINA SUNERGY CO., LTD.
CONSOLIDATED STATEMENTS OF OPERATIONS
(In U.S. dollars, except share data)
| | | | | | | | | | | | |
| | | Years ended December 31, | |
| | | 2005 | | | 2006 | | | 2007 | |
| | | $ | | | $ | | | $ | |
Net revenues | | | 13,749,667 | | | | 149,520,944 | | | | 234,907,901 | |
Cost of revenues | | | (11,795,673 | ) | | | (122,889,246 | ) | | | (216,880,921 | ) |
| | | | | | | | | | | | |
Gross profit | | | 1,953,994 | | | | 26,631,698 | | | | 18,026,980 | |
| | | | | | | | | | | | |
Selling expenses | | | (38,461 | ) | | | (1,014,442 | ) | | | (1,644,234 | ) |
General and administrative expenses | | | (1,583,632 | ) | | | (9,900,617 | ) | | | (13,664,204 | ) |
Research and development expenses | | | (48,525 | ) | | | (545,783 | ) | | | (2,555,073 | ) |
| | | | | | | | | | | | |
Total operating expenses | | | (1,670,618 | ) | | | (11,460,842 | ) | | | (17,863,511 | ) |
| | | | | | | | | | | | |
Income from operations | | | 283,376 | | | | 15,170,856 | | | | 163,469 | |
Interest expense | | | (620,399 | ) | | | (3,002,054 | ) | | | (7,394,229 | ) |
Interest income | | | 113,604 | | | | 419,720 | | | | 1,577,194 | |
Other income (expense), net | | | (163,332 | ) | | | (844,814 | ) | | | 93,412 | |
| | | | | | | | | | | | |
(Loss) income before income taxes | | | (386,751 | ) | | | 11,743,708 | | | | (5,560,154 | ) |
Tax benefit | | | 79,757 | | | | 70,674 | | | | 705,504 | |
| | | | | | | | | | | | |
Net (loss) income | | | (306,994 | ) | | | 11,814,382 | | | | (4,854,650 | ) |
| | | |
Dividend on Series A redeemable
convertible preferred shares | | | — | | | | (13,377,452 | ) | | | (154,723 | ) |
Dividend on Series B redeemable
convertible preferred shares | | | — | | | | (28,551,788 | ) | | | (330,229 | ) |
Dividend on Series C redeemable
convertible preferred shares | | | — | | | | (7,097,263 | ) | | | (233,125 | ) |
| | | | | | | | | | | | |
Net loss attributable to holders of ordinary shares | | | (306,994 | ) | | | (37,212,121 | ) | | | (5,572,727 | ) |
| | | | | | | | | | | | |
Net loss per share: | | | | | | | | | | | | |
Basic | | $ | (0.00 | ) | | $ | (0.36 | ) | | $ | (0.04 | ) |
| | | | | | | | | | | | |
Diluted | | $ | (0.00 | ) | | $ | (0.36 | ) | | $ | (0.04 | ) |
| | | | | | | | | | | | |
Shares used in computation: | | | | | | | | | | | | |
Basic | | | 108,000,000 | | | | 103,583,178 | | | | 185,165,757 | |
| | | | | | | | | | | | |
Diluted | | | 108,000,000 | | | | 103,583,178 | | | | 185,165,757 | |
| | | | | | | | | | | | |
The accompanying notes are an integral part of these consolidated financial statements.
F-5
CHINA SUNERGY CO., LTD.
CONSOLIDATED STATEMENTS OF SHAREHOLDERS’ EQUITY AND COMPREHENSIVE INCOME (LOSS)
(In U.S. dollars, except share data)
| | | | | | | | | | | | | | | | | | | | | |
| | | Ordinary shares | | Additional
paid-in
capital | | | Subscription
receivable | | | Accumulated
(deficit) | | | Accumulated
other
comprehensive
income | | Total | | | Comprehensive
(loss) income | |
| | | Number | | $ | | $ | | | $ | | | $ | | | $ | | $ | | | $ | |
Balance at January 1, 2005 | | — | | — | | 9,450,000 | | | (5,297,811 | ) | | (959,073 | ) | | 23 | | 3,193,139 | | | | |
| | | | | | | | |
Contribution from shareholders | | — | | — | | — | | | 2,245,791 | | | — | | | — | | 2,245,791 | | | | |
Net loss | | — | | — | | — | | | — | | | (306,994 | ) | �� | — | | (306,994 | ) | | (306,994 | ) |
Foreign currency translation adjustments | | — | | — | | — | | | — | | | — | | | 108,001 | | 108,001 | | | 108,001 | |
| | | | | | | | | | | | | | | | | | | | | |
Balance at December 31, 2005 | | — | | — | | 9,450,000 | | | (3,052,020 | ) | | (1,266,067 | ) | | 108,024 | | 5,239,937 | | | (198,993 | ) |
| | | | | | | | | | | | | | | | | | | | | |
Reorganization | | | | | | | | | | | | | | | | | | | | | |
Contribution from shareholders | | — | | — | | — | | | 2,512,020 | | | — | | | — | | 2,512,020 | | | | |
Excess of prorata distribution to shareholders | | — | | — | | 3,708,844 | | | — | | | — | | | — | | 3,708,844 | | | | |
Forgiveness of shareholder receivable | | — | | — | | — | | | 540,000 | | | — | | | — | | 540,000 | | | | |
Purchase and retirement of treasury shares | | — | | — | | (2,701,792 | ) | | — | | | — | | | — | | (2,701,792 | ) | | | |
Distribution on reorganization | | — | | — | | — | | | (4,046,811 | ) | | — | | | — | | (4,046,811 | ) | | | |
Issuance of ordinary shares | | 99,144,000 | | 9,914 | | — | | | — | | | — | | | — | | 9,914 | | | | |
Exercise of warrant | | 5,400,000 | | 540 | | — | | | — | | | — | | | — | | 540 | | | | |
Return of distribution on reorganization | | — | | — | | — | | | 4,046,811 | | | — | | | — | | 4,046,811 | | | | |
Series A beneficial conversion Feature | | — | | — | | 13,110,400 | | | — | | | — | | | — | | 13,110,400 | | | | |
Series B beneficial conversion Feature | | — | | — | | 27,999,948 | | | — | | | — | | | — | | 27,999,948 | | | | |
Series C beneficial conversion Feature | | — | | — | | 6,941,170 | | | — | | | — | | | — | | 6,941,170 | | | | |
Dividend on Series A redeemable convertible preferred shares | | — | | — | | (2,829,137 | ) | | — | | | (10,548,315 | ) | | — | | (13,377,452 | ) | | | |
Dividend on Series B redeemable convertible preferred shares | | — | | — | | (28,551,788 | ) | | — | | | — | | | — | | (28,551,788 | ) | | | |
Dividend on Series C redeemable convertible preferred shares | | — | | — | | (7,097,263 | ) | | — | | | — | | | — | | (7,097,263 | ) | | | |
Share-based compensation | | — | | — | | 114,563 | | | — | | | — | | | — | | 114,563 | | | | |
Net income | | — | | — | | — | | | — | | | 11,814,382 | | | — | | 11,814,382 | | | 11,814,382 | |
Foreign currency translation adjustments | | — | | — | | — | | | — | | | — | | | 2,016,527 | | 2,016,527 | | | 2,016,527 | |
| | | | | | | | | | | | | | | | | | | | | |
Balance at December 31, 2006 | | 104,544,000 | | 10,454 | | 20,144,945 | | | — | | | — | | | 2,124,551 | | 22,279,950 | | | 13,830,909 | |
| | | | | | | | | | | | | | | | | | | | | |
Issuance of ordinary shares upon initial public offering net of issuance cost of $11,616,804 | | 58,650,000 | | 5,865 | | 95,902,331 | | | — | | | — | | | — | | 95,908,196 | | | | |
Dividend on Series A redeemable convertible preferred shares | | — | | — | | (154,723 | ) | | — | | | — | | | — | | (154,723 | ) | | | |
Dividend on Series B redeemable convertible preferred shares | | — | | — | | (330,229 | ) | | — | | | — | | | — | | (330,229 | ) | | | |
Dividend on Series C redeemable convertible preferred shares | | — | | — | | (233,125 | ) | | — | | | — | | | — | | (233,125 | ) | | | |
Conversion of Series A, B and C redeemable convertible preferred shares into ordinary shares | | 74,138,777 | | 7,414 | | 62,496,406 | | | — | | | — | | | — | | 62,503,820 | | | | |
Share-based compensation | | — | | — | | 535,856 | | | — | | | — | | | — | | 535,856 | | | | |
Net loss | | — | | — | | — | | | — | | | (4,854,650 | ) | | — | | (4,854,650 | ) | | (4,854,650 | ) |
Foreign currency translation adjustments | | — | | — | | — | | | — | | | — | | | 8,192,998 | | 8,192,998 | | | 8,192,998 | |
| | | | | | | | | | | | | | | | | | | | | |
Balance at December 31, 2007 | | 237,332,777 | | 23,733 | | 178,361,461 | | | — | | | (4,854,650 | ) | | 10,317,549 | | 183,848,093 | | | 3,338,348 | |
| | | | | | | | | | | | | | | | | | | | | |
The accompanying notes are an integral part of these consolidated financial statements.
F-6
CHINA SUNERGY CO., LTD.
CONSOLIDATED STATEMENTS OF CASH FLOWS
(In U.S. dollars)
| | | | | | | | | |
| | | Years ended December 31, | |
| | | 2005 | | | 2006 | | | 2007 | |
| | | $ | | | $ | | | $ | |
Operating activities: | | | | | | | | | |
Net loss attributable to holders of ordinary shares | | (306,994 | ) | | (37,212,121 | ) | | (5,572,727 | ) |
Dividend on Series A redeemable
convertible preferred shares | | — | | | 13,377,452 | | | 154,723 | |
Dividend on Series B redeemable
convertible preferred shares | | — | | | 28,551,788 | | | 330,229 | |
Dividend on Series C redeemable
convertible preferred shares | | — | | | 7,097,263 | | | 233,125 | |
| | | | | | | | | |
Net (loss) income | | (306,994 | ) | | 11,814,382 | | | (4,854,650 | ) |
| | | |
Adjustments to reconcile net (loss) income to net cash used in operating activities: | | | | | | | | | |
Depreciation and amortization | | 321,525 | | | 1,798,331 | | | 4,315,613 | |
Bad debt provision | | — | | | — | | | 1,134,926 | |
Inventory write-down | | — | | | — | | | 1,661,594 | |
Share-based compensation | | — | | | 114,563 | | | 535,856 | |
Forgiveness of shareholder receivable | | — | | | 540,000 | | | — | |
Provision for warranty costs | | — | | | 157,595 | | | 80,505 | |
Excess of prorata distribution to shareholders | | — | | | 3,708,844 | | | — | |
Purchase and retirement of treasury shares | | — | | | 408,608 | | | — | |
Loss from disposal of property, plant and equipment | | — | | | 61,677 | | | 54,397 | |
| | | |
Changes in operating assets and liabilities: | | | | | | | | | |
Inventories | | (6,617,524 | ) | | (37,684,121 | ) | | (13,422,347 | ) |
Accounts receivable | | (1,705,390 | ) | | (41,342,761 | ) | | 16,230,796 | |
Advances to suppliers | | (17,408,297 | ) | | (8,872,960 | ) | | (54,740,526 | ) |
Prepaid expenses and other current assets | | (268,430 | ) | | (801,077 | ) | | (15,259,352 | ) |
Amounts due from related parties | | — | | | (1,925,286 | ) | | (135,480 | ) |
Accounts payable | | 1,462,312 | | | 5,495,031 | | | (3,402,165 | ) |
Accrued expenses and other current liabilities | | 328,881 | | | 560,976 | | | 917,413 | |
Advances from customers | | 11,131,870 | | | (10,181,955 | ) | | 3,942,535 | |
Amount due to related parties | | — | | | — | | | 4,472 | |
Deferred other income | | — | | | — | | | 815,382 | |
Interest and income tax payable | | 54,000 | | | 71,773 | | | 58,395 | |
Deferred tax assets | | (79,757 | ) | | (70,674 | ) | | (705,504 | ) |
| | | | | | | | | |
Net cash used in operating activities | | (13,087,804 | ) | | (76,147,054 | ) | | (62,768,140 | ) |
| | | | | | | | | |
Investing activities: | | | | | | | | | |
Purchases of property, plant and equipment | | (10,390,275 | ) | | (23,143,893 | ) | | (15,568,560 | ) |
Proceeds from disposal of property, plant and equipment | | — | | | 2,505 | | | 110 | |
Purchase of intangibles | | — | | | (1,727,780 | ) | | (1,182,432 | ) |
Proceeds from government grant | | — | | | 1,105,538 | | | — | |
Change in restricted cash | | (19,942,409 | ) | | 17,006,193 | | | (18,520,927 | ) |
| | | | | | | | | |
Net cash used in investing activities | | (30,332,684 | ) | | (6,757,437 | ) | | (35,271,809 | ) |
| | | | | | | | | |
F-7
CHINA SUNERGY CO., LTD.
CONSOLIDATED STATEMENTS OF CASH FLOWS—(Continued)
(In U.S. dollars)
| | | | | | | | | |
| | | Years ended December 31, | |
| | | 2005 | | | 2006 | | | 2007 | |
| | | $ | | | $ | | | $ | |
Financing activities: | | | | | | | | | |
Proceeds from investor upon formation of the Company | | — | | | 13,110,400 | | | — | |
Issuance cost of Series A redeemable convertible preference shares | | — | | | (99,590 | ) | | — | |
Proceeds from issuance of Series B redeemable
convertible preference shares | | — | | | 27,999,948 | | | — | |
Proceeds from issuance of Series C redeemable
convertible preference shares | | — | | | 20,000,000 | | | — | |
Proceeds from issuance of ordinary shares | | — | | | 10,454 | | | 107,525,000 | |
Issuance cost of ordinary shares | | — | | | — | | | (11,616,804 | ) |
Cash contributions received from shareholders | | 2,245,791 | | | 2,512,020 | | | — | |
Distribution on reorganization | | — | | | (4,046,811 | ) | | — | |
Return of distribution on reorganization | | — | | | 4,046,811 | | | — | |
Purchase and retirement of treasury share | | — | | | (3,110,400 | ) | | — | |
Amounts due from related parties | | (11,848,165 | ) | | 14,053,159 | | | — | |
Amounts due to related parties | | 26,102,216 | | | (28,433,126 | ) | | — | |
Proceeds from short-term bank borrowings | | 25,040,263 | | | 80,087,689 | | | 168,006,462 | |
Proceeds from long-term bank borrowings | | 6,821,417 | | | — | | | — | |
Repayment of bank borrowings | | (3,622,041 | ) | | (34,007,393 | ) | | (128,882,001 | ) |
| | | | | | | | | |
Net cash provided by financing activities | | 44,739,481 | | | 92,123,161 | | | 135,032,657 | |
| | | | | | | | | |
Effect of exchange rate changes | | 414,605 | | | 2,765,518 | | | 8,715,383 | |
| | | | | | | | | |
Net increase in cash and cash equivalents | | 1,733,598 | | | 11,984,188 | | | 45,708,091 | |
| | | |
Cash and cash equivalents at the beginning of the year | | 1,031,789 | | | 2,765,387 | | | 14,749,575 | |
| | | | | | | | | |
Cash and cash equivalents at the end of the year | | 2,765,387 | | | 14,749,575 | | | 60,457,666 | |
| | | | | | | | | |
Supplemental disclosure of cash flow information: | | | | | | | | | |
Interest paid | | 620,399 | | | 3,002,054 | | | 7,210,061 | |
| | | | | | | | | |
Income taxes paid | | — | | | — | | | — | |
| | | | | | | | | |
Supplemental disclosure of non-cash investing activities: | | | | | | | | | |
Purchase of property, plant and equipment included in accounts payable | | 1,032,578 | | | 4,721,828 | | | 1,286,218 | |
| | | | | | | | | |
Supplemental disclosure of non-cash financing activities: | | | | | | | | | |
Exchange of investor contribution for Series A redeemable convertible preference shares | | — | | | 13,010,810 | | | — | |
Redeemable convertible preference shares issuance costs included in accrued expenses and other current liabilities | | — | | | 200,000 | | | — | |
| | | | | | | | | |
The accompanying notes are an integral part of the consolidated financial statements.
F-8
CHINA SUNERGY CO., LTD.
NOTES TO THE CONSOLIDATED FINANCIAL STATEMENTS
FOR THE YEARS ENDED DECEMBER 31, 2005, 2006 AND 2007
(In U.S. dollars, except share data and unless otherwise stated)
1. ORGANIZATION AND PRINCIPAL ACTIVITIES
China Sunergy Co., Ltd. (the “Company”) was incorporated under the laws of the Cayman Islands on August 4, 2006.
The Company entered into an agreement with the equity owners of China Sunergy Co., Ltd., a company incorporated under the laws of the British Virgin Islands, (“China Sunergy BVI”) to initiate a restructuring process, whereby the Company acquired a 100% interest in China Sunergy BVI. The restructuring process was completed on August 30, 2006. This transaction has been accounted for as a legal reorganization as there was no change in the ownership structure between the Company and China Sunergy BVI.
On April 26, 2006, China Sunergy BVI issued 1,045,440 warrants on a pro rata basis to the shareholders, or their assignees, that owned 100% of China Sunergy (Nanjing) Co., Ltd. (“Sunergy Nanjing”) in exchange for their equity interests (see Note 7). This transaction has been accounted for as a legal reorganization with all share and per share data being restated to give retroactive effect to this transaction. Of the 1,045,440 warrants, 991,440 warrants were exercised immediately into ordinary shares, and the remaining 54,000 warrants were exercised in August 2006.
In April 2007, the Company effected a 100-for-one share split, as a result of which each of the ordinary share, Series A preferred share, Series B preferred share and Series C preferred share was subdivided into 100 ordinary shares, 100 Series A preferred shares, 100 Series B preferred shares and 100 Series C preferred shares, respectively. This share split has been retroactively reflected for all periods presented.
On December 7, 2007, China Sunergy Hong Kong Co., Ltd. (“Sunergy Hong Kong”) was incorporated in Hong Kong under China Sunergy BVI. In the same month, China Sunergy BVI swapped all of the equity interests in Sunergy Nanjing to Sunergy Hong Kong, who became Sunergy Nanjing’s direct holding company.
The Company and its subsidiaries (collectively referred to as the “Group”) are principally engaged in the design, development, manufacturing and marketing of solar cells in the People’s Republic of China (the “PRC”) and overseas markets. During the periods covered by the consolidated financial statements, substantially all of the Group’s business was conducted through Sunergy Nanjing.
As of December 31, 2007, the Company’s subsidiaries include the following entities:
| | | | | | | | | |
Subsidiaries’ Name | | Principal Activities | | Date of
Incorporation | | Percentage of
Ownership | | | Place of Incorporation |
China Sunergy Co., Ltd. | | Investment Holding | | January 27, 2006 | | 100 | % | | British Virgin Islands |
| | | | |
China Sunergy (Hong Kong) Co., Limited | | Investment Holding | | December 7, 2007 | | 100 | % | | Hong Kong |
| | | | |
China Sunergy Europe Gmbh | | Marketing Service | | November 27, 2007 | | 100 | % | | Germany |
| | | | |
China Sunergy (Nanjing) Co., Ltd. (previously named as CEEG (Nanjing) PV-Tech Co., Ltd) | | Solar cells
manufacturing | | August 2, 2004 | | 100 | % | | PRC |
| | | | |
China Sunergy (Shanghai) Co., Ltd. (previously named as CEEG (Shanghai) PV-Tech Co., Ltd) | | Solar cells
manufacturing | | November 1, 2007 | | 95 | % | | PRC |
F-9
CHINA SUNERGY CO., LTD.
NOTES TO CONSOLIDATED FINANCIAL STATEMENTS—(Continued)
FOR THE YEARS ENDED DECEMBER 31, 2005, 2006 AND 2007
(In U.S. dollars, except share data and unless otherwise stated)
2. SUMMARY OF PRINCIPAL ACCOUNTING POLICIES
(a) Basis of presentation
The consolidated financial statements of the Group have been prepared in accordance with accounting principles generally accepted in the United States of America (“US GAAP”).
(b) Basis of consolidation
The consolidated financial statements include the assets, liabilities revenues and expenses of the Group. All significant intercompany transactions and balances have been eliminated on consolidation.
(c) Use of estimates
The preparation of financial statements in conformity with US GAAP requires management to make estimates and assumptions that affect the reported amounts of assets and liabilities, disclosure of contingent assets and liabilities at the date of the financial statements and the reported amount of revenues and expenses during the reporting period. Actual results could differ from those estimates. The Group bases its estimates on historical experience and various other factors believed to be reasonable under the circumstances, the results of which form the basis for making judgments about the carrying value of assets and liabilities that are not readily apparent from other sources. Significant accounting estimates reflected in the consolidated financial statements include inventory valuation, allowance on accounts receivable and supplier advances, provision of warranty costs, and the useful lives of and impairment for property, plant and equipment and intangible assets.
(d) Cash and cash equivalents and restricted cash
Cash and cash equivalents consist of cash on hand and demand deposits, which are unrestricted as to withdrawal and use, and which have original maturities of three months or less.
Restricted cash represents bank deposits for securing letter of credit and bank guarantee that are not available for use in operations.
(e) Inventories
Inventories are stated at the lower of cost or market value. Cost is determined using the weighted-average method.
The Group outsourced portions of its manufacturing process, including cutting ingots into wafers. These outsourcing arrangements do not include transfer of title of the raw material inventory (silicon or ingots) to the third-party manufacturers. Such raw materials are recorded as raw material inventory when purchased from suppliers and while in the possession of the third-party manufacturers. Upon receipt of the processed inventory, it is reclassified to work-in-progress inventory and a processing fee is paid to the third-party manufacturers.
(f) Property, plant and equipment
Property, plant and equipment are recorded at cost less accumulated depreciation and amortization. Depreciation and amortization are provided on a straight-line basis over the following estimated useful lives:
| | |
Buildings | | 20 years |
Machinery | | 10 years |
Furniture, fixtures and equipment | | 5 years |
Motor vehicles | | 5 years |
F-10
CHINA SUNERGY CO., LTD.
NOTES TO CONSOLIDATED FINANCIAL STATEMENTS—(Continued)
FOR THE YEARS ENDED DECEMBER 31, 2005, 2006 AND 2007
(In U.S. dollars, except share data and unless otherwise stated)
Costs incurred in constructing new facilities, including progress payments and other costs related to construction, are capitalized. Interest cost incurred and capitalized in respect of construction of new facilities amounted to $410,536, $nil, and $nil for the years ended December 31, 2005, 2006 and 2007, respectively.
(g) Intangible assets
Land use rights are recorded at cost less accumulated amortization. Amortization is provided on a straight-line basis over 50 years based on the terms of the land use right agreement.
(h) Impairment of long-lived assets
The Group evaluates its long-lived assets and finite lived intangibles for impairment whenever events or changes in circumstances indicate that the carrying amount of an asset may not be recoverable. When these events occur, the Group measures impairment by comparing the carrying amount of the assets to future undiscounted net cash flows expected to result from the use of the assets and their eventual disposition. If the sum of the expected undiscounted cash flows is less than the carrying amount of the assets, the Group would recognize an impairment loss equal to the excess of the carrying amount over the fair value of the assets.
(i) Income taxes
Deferred income taxes are recognized for temporary differences between the tax basis of assets and liabilities and their reported amounts in the financial statements, net operating loss carryforwards and credits by applying enacted statutory tax rates applicable to future years. Deferred tax assets are reduced by a valuation allowance when, in the opinion of management, it is more likely than not that some portion or all of the deferred tax assets will not be realized. Current income taxes are provided for in accordance with the laws of the relevant taxing authorities. The components of the deferred tax assets and liabilities are individually classified as current and non-current based on the characteristics of the underlying assets and liabilities, or the expected timing of their use when they do not relate to a specific asset or liability.
(j) Revenue recognition
Sales of solar cells and modules are recorded when persuasive evidence of an arrangement exists, delivery has occurred, the fee is fixed or determinable, and collectibility is reasonably assured. Customers do not have any rights of return. A portion of the Group’s sales to domestic customers require the customers to prepay before delivery has occurred. Such prepayments are recorded as advances from customers in the consolidated balance sheets until delivery has occurred. A majority of the Group’s contracts with overseas customers are written such that the customer takes title and assumes the risks and rewards of ownership of the products upon shipment. Accordingly, the Group recognizes revenue upon documentary evidence of shipment, assuming all other criteria have been met.
(k) Buy-and-sell arrangements
The Group has buy-and-sell arrangements with certain raw material vendors wherein the Group sells finished goods, comprised of solar cells, and acquires raw materials in the form of silicon wafers. These arrangements are with counterparties in the same line of business as the Group and are executed as a means of securing a consistent supply of silicon wafer raw materials. The Group records such transactions at fair value.
F-11
CHINA SUNERGY CO., LTD.
NOTES TO CONSOLIDATED FINANCIAL STATEMENTS—(Continued)
FOR THE YEARS ENDED DECEMBER 31, 2005, 2006 AND 2007
(In U.S. dollars, except share data and unless otherwise stated)
During the years ended December 31, 2005, 2006 and 2007, the Group purchased $3,262,140, $35,538,653 and $15,173,393 of raw materials and sold $8,235,024, $47,157,841 and $10,517,112 of finished goods, respectively, under these buy-and-sell arrangements.
(l) Cost of revenue
Cost of revenue includes production and indirect costs, as well as shipping and handling costs for products sold and warranty costs.
(m) Research and development
Research and development costs are expensed when incurred.
(n) Advertising expenses
Advertising expenses are charged to the statements of operations in the period incurred. The Group incurred advertising expenses amounting to $45,030, $231,514 and $363,237 for the years ended December 31, 2005, 2006 and 2007, respectively.
(o) Warranty cost
For solar cells, the Group warrants its products against specified declines in the initial minimum power generation capacity for up to 20 years after sales have taken place. The Group has the right to repair or replace the solar cells based on the specific nature of the defect claims under the terms of the warranty policy. The Group maintains warranty reserves to cover potential liabilities that could arise under these warranties. Due to limited warranty claims to date, the Group accrues the estimated costs of warranties at 0.5% of solar cell sales. Since the beginning of 2007, however, the Group has aborted such warranty terms in solar cell sales contracts signed in 2007.
Beginning in 2007, the Group began selling modules. Generally, the warranty is for a period of between 20 to 25 years and covers the modules sold by the Group. The Group estimates and accrues the costs of warranties at 1% of module sales.
Due to very limited claims occurred to date, the warranty provisions for cells and modules are mainly based on an assessment competitors’ accrual history and industry practice. Actual warranty costs are accumulated and charged against the accrued warranty liability. To the extent that accrual warranty costs differ from the estimates, the Group will prospectively revise its accrual rate.
(p) Government grants
Government grants are recognized when received and all the conditions for their receipt have been met. Government grants are recognized as income in the period in which the related expenditures are recorded. Capital grants for the acquisition of equipment are recorded as a liability until earned and then offset against the related capital assets.
F-12
CHINA SUNERGY CO., LTD.
NOTES TO CONSOLIDATED FINANCIAL STATEMENTS—(Continued)
FOR THE YEARS ENDED DECEMBER 31, 2005, 2006 AND 2007
(In U.S. dollars, except share data and unless otherwise stated)
(q) Foreign currency translation
The functional and reporting currency of the Company is the United States dollar (“US dollar”). Monetary assets and liabilities denominated in other currencies other than the US dollar are translated into US dollar at the rates of exchange in effect at the balance sheet dates. Transactions dominated in currencies other than the US dollar during the year are converted into US dollar at the applicable rates of exchange prevailing when the transactions occur. Transaction gains and losses are recorded in the statements of operations.
The financial records of the Group’s subsidiaries are maintained in their local currencies. Assets and liabilities are translated at the exchange rates at the balance sheet date, equity accounts are translated at historical exchange rates and revenue, expenses, gains and losses are translated at the average rate for the period. Translation adjustments are reported as cumulative translation adjustments and are shown as a separate component of other comprehensive income in the statements of shareholders’ equity.
(r) Comprehensive income (loss)
Comprehensive income (loss) includes all changes in equity except those resulting from investments by owners and distributions to owners and is comprised of net income (loss) and foreign currency translation adjustments.
(s) Foreign currency risk
The functional currency of the Group’s subsidiaries which operate in the PRC is Renminbi (“RMB”). The RMB is not a freely convertible currency. The PRC State Administration for Foreign Exchange, under the authority of the People’s Bank of China, controls the conversion of RMB into foreign currencies. The value of the RMB is subject to changes in central government policies and to international economic and political developments affecting supply and demand in the China foreign exchange trading system market. The Group’s aggregate amount of cash and cash equivalents and restricted cash denominated in RMB amounted to $22,810,286, $5,420,911 and $41,036,439 at December 31, 2005, 2006 and 2007, respectively.
(t) Concentration of credit risk
Financial instruments that potentially expose the Group to significant concentrations of credit risk consist principally of cash and cash equivalents, accounts receivable and advance to suppliers. The Group places its cash and cash equivalents with financial institutions with high-credit ratings and quality.
The Group performs ongoing credit evaluations of customers and suppliers and generally does not require collateral or other security from its customers. The Group establishes an allowance for doubtful accounts primarily based upon the age of the receivables and advances and factors surrounding the credit risk of specific customers and suppliers.
The Group recognized bad debt provision of $nil, $nil and $1,134,926 for the year ended December 31, 2005, 2006 and 2007, respectively.
(u) Fair value of financial instruments
The carrying amounts of accounts receivable, accounts payable and short-term borrowings approximate their fair values due to the short-term maturity of these instruments.
F-13
CHINA SUNERGY CO., LTD.
NOTES TO CONSOLIDATED FINANCIAL STATEMENTS—(Continued)
FOR THE YEARS ENDED DECEMBER 31, 2005, 2006 AND 2007
(In U.S. dollars, except share data and unless otherwise stated)
The fair value of the long-term bank borrowings was approximately $8,712,445 as at December 31, 2005, based on discounted cash flows. There were no long-term bank borrowings at December 31, 2006 and 2007.
(v) Net loss per share
Basic loss per share is computed by dividing loss attributable to holders of ordinary shares by the weighted-average number of ordinary shares outstanding during the year. Diluted loss per ordinary share reflects the potential dilution that could occur if securities or other contracts to issue ordinary shares were exercised or converted into ordinary shares. Generally, ordinary share equivalents are excluded from the computation in loss periods as their effects would be anti-dilutive.
There were no potentially dilutive securities during the year ended December 31, 2005. For the year ended December 31, 2006, the series A, series B and series C redeemable convertible preference shares of 12,847,300, 23,905,100 and 6,901,000, respectively, as well as 54,000 warrants and 1,467,200 share options were excluded from the calculation of dilutive EPS as their effects would have been anti-dilutive. For the year ended December 31, 2007, 1,586,900 share options were excluded from the calculation of dilutive EPS as their effects would have been anti-dilutive.
The terms of the series A, series B and series C preferred share subscription agreements allow for the preferred shareholders to participate equally with the common shareholders with regards to any dividends declared and payable, after the payment of preferred shares dividends. The subscription agreements do not require the preferred shareholders to participate in losses of the Company. Accordingly, the Company presents earnings per share using the two-class method when the operations of the company result in earnings, and not losses, for any given period.
Upon the consummation of the Group’s initial public offering on May 22, 2007, the series A, series B and series C redeemable convertible preference shares were automatically converted into ordinary shares. The two class method of computing earnings per share ceased to apply on the conversion date.
The following table sets forth the computation of basic and diluted income per share for the periods indicated:
| | | | | | | | | | | | |
| | | Years ended December 31, | |
| | | 2005 | | | 2006 | | | 2007 | |
| | | $ | | | $ | | | $ | |
Net loss attributable to ordinary shareholders—basic and diluted | | $ | (306,994 | ) | | $ | (37,212,121 | ) | | $ | (5,572,727 | ) |
Allocation of undistributed earnings to preferred shares for participating rights to dividends* | | $ | — | | | $ | — | | | $ | 950,009 | |
| | | | | | | | | | | | |
Net loss attributable to ordinary shareholders | | $ | (306,994 | ) | | $ | (37,212,121 | ) | | $ | (6,522,736 | ) |
| | | | | | | | | | | | |
Weighted-average ordinary shares outstanding—basic | | | 108,000,000 | | | | 103,583,178 | | | | 185,165,757 | |
| | | | | | | | | | | | |
Weighted-average ordinary shares outstanding—diluted | | | 108,000,000 | | | | 103,583,178 | | | | 185,165,757 | |
| | | | | | | | | | | | |
Net loss per share: | | | | | | | | | | | | |
Basic | | $ | (0.00 | ) | | $ | (0.36 | ) | | $ | (0.04 | ) |
| | | | | | | | | | | | |
Diluted | | $ | (0.00 | ) | | $ | (0.36 | ) | | $ | (0.04 | ) |
| | | | | | | | | | | | |
| * | Reflects the allocation of net income of $1,826,535 for the period from January 1, 2007 to May 22, 2007, the date on which the preference shares were converted into ordinary shares. |
F-14
CHINA SUNERGY CO., LTD.
NOTES TO CONSOLIDATED FINANCIAL STATEMENTS—(Continued)
FOR THE YEARS ENDED DECEMBER 31, 2005, 2006 AND 2007
(In U.S. dollars, except share data and unless otherwise stated)
(w) Share-based compensation
The Group has adopted SFAS No. 123 R, “Share-based Payment,” which requires that share-based payment transactions with employees, such as restricted shares or stock options, be measured based on the grant-date fair value of the equity instrument issued and recognized as compensation expense over the requisite service period, which is generally the vesting period, with a corresponding addition to paid-in capital.
(x) Recently issued accounting pronouncements
In September 2006, the FASB issued SFAS No. 157, “Fair Value Measurement” (“SFAS 157”), which defines fair value, establishes a framework for measuring fair value and expands disclosures about assets and liabilities measured at fair value. The Group will be required to adopt SFAS 157 for fiscal year beginning January 1, 2008. The Group is currently evaluating the impact, if any, of SFAS 157 on its consolidated financial position, results of operations and cash flows.
In February 2007, the FASB issued SFAS No. 159, “The Fair Value Option for Financial Assets and Financial Liabilities” (“SFAS 159”). SFAS No. 159 permits entities to choose to measure many financial instruments and certain other items at fair value. SFAS 159 is effective for fiscal years beginning after November 15, 2007. The Group is currently evaluating the impact, if any, of SFAS 159 on its consolidated financial position, results of operations and cash flows.
In December 2007, the FASB issued SFAS No. 141 (revised 2007), “Business Combinations” (“SFAS 141R”), which replaces SFAS No. 141, “Business Combinations.” The statement retains the purchase method of accounting for acquisitions, but requires a number of changes, including changes in the way assets and liabilities are recognized in purchase accounting. It also changes the recognition of assets acquired and liabilities assumed arising from contingencies, requires the capitalization of in-process research and development at fair value, and requires the expensing of acquisition related costs as incurred. SFAS 141R is effective for fiscal years and interim periods within those fiscal years beginning on or after December 15, 2008 and will apply prospectively to business combinations completed on or after that date. The Group is currently evaluating the impact, if any, of SFAS 141R on its consolidated financial position, results of operations and cash flows.
In December 2007, the FASB issued SFAS No. 160 “Noncontrolling Interests in Consolidated Financial Statements,” an amendment of ARB 51 (“SFAS 160”). SFAS 160 requires noncontrolling interests in subsidiaries initially to be measured at fair value and classified as a separate component of equity. SFAS 160 also requires that when a parent company acquires control of a subsidiary, it must include 100% of the fair value of all of the acquired company’s assets and liabilities in its consolidated financial statements. SFAS 160 is effective for the Group for fiscal 2009. The Group is currently assessing the impact of SFAS 160 on its consolidated financial position and results of operations and cash flows.
In March 2008, the FASB issued SFAS No. 161,” Disclosures About Derivative Instruments and Hedging Activities,” an amendment of FASB Statement No.133 (“SFAS 161”). SFAS 161 requires enhanced disclosures to help investors better understand the effect of an entity’s derivative instruments and related hedging activities on its financial position, financial performance, and cash flows. Statement 161 is effective for financial statements issued for fiscal years and interim periods beginning after November 15, 2008, with early application encouraged. The Group will adopt SFAS 161 on January 1, 2009.
F-15
CHINA SUNERGY CO., LTD.
NOTES TO CONSOLIDATED FINANCIAL STATEMENTS—(Continued)
FOR THE YEARS ENDED DECEMBER 31, 2005, 2006 AND 2007
(In U.S. dollars, except share data and unless otherwise stated)
3. INVENTORIES
Inventories consist of the following:
| | | | | | |
| | | At December 31, |
| | | 2005 | | 2006 | | 2007 |
| | | $ | | $ | | $ |
Raw materials | | 5,257,978 | | 37,579,053 | | 33,659,206 |
Work-in-process | | 433,334 | | 472,173 | | 117,437 |
Finished goods | | 955,723 | | 6,279,930 | | 22,315,266 |
| | | | | | |
Inventories | | 6,647,035 | | 44,331,156 | | 56,091,909 |
| | | | | | |
4. PROPERTY, PLANT AND EQUIPMENT, NET
Property, plant and equipment, net consist of the following:
| | | | | | | | | |
| | | At December 31, | |
| | | 2005 | | | 2006 | | | 2007 | |
| | | $ | | | $ | | | $ | |
Buildings | | 4,958,741 | | | 6,434,679 | | | 6,779,011 | |
Plant and machinery | | 5,555,469 | | | 33,046,676 | | | 40,871,028 | |
Furniture, fixtures and equipment | | 375,438 | | | 889,649 | | | 1,881,422 | |
Motor vehicles | | 81,681 | | | 212,359 | | | 393,571 | |
| | | | | | | | | |
| | 10,971,329 | | | 40,583,363 | | | 49,925,032 | |
Less: Accumulated depreciation | | (299,830 | ) | | (2,108,022 | ) | | (6,622,316 | ) |
| | | | | | | | | |
| | 10,671,499 | | | 38,475,341 | | | 43,302,716 | |
Construction in process | | 2,742,408 | | | 254,290 | | | 9,626,049 | |
| | | | | | | | | |
Property, plant and equipment, net | | 13,413,907 | | | 38,729,631 | | | 52,928,765 | |
| | | | | | | | | |
Depreciation expense was $298,607, $1,773,603 and $4,286,220 for the years ended December 31, 2005, 2006 and 2007, respectively.
The construction in process primarily relates to the construction of four new production lines.
5. INTANGIBLE ASSETS, NET
Amortized intangible assets, net consist of the following:
| | | | | | | | | |
| | | At December 31, | |
| | | 2005 | | | 2006 | | | 2007 | |
| | | $ | | | $ | | | $ | |
Cost | | 966,592 | | | 1,074,093 | | | 2,256,525 | |
Less: Accumulated amortization | | (22,918 | ) | | (47,646 | ) | | (77,039 | ) |
| | | | | | | | | |
Intangible assets, net | | 943,674 | | | 1,026,447 | | | 2,179,486 | |
| | | | | | | | | |
F-16
CHINA SUNERGY CO., LTD.
NOTES TO CONSOLIDATED FINANCIAL STATEMENTS—(Continued)
FOR THE YEARS ENDED DECEMBER 31, 2005, 2006 AND 2007
(In U.S. dollars, except share data and unless otherwise stated)
The intangible assets at December 31, 2005 and 2006 represent rights to usage of land in the PRC for a period of 50 years, effective from November 12, 2004. Sunergy Nanjing paid $483,296 in 2004 and $1,727,780 in 2006, in respect of the rights, and subsequently received a government grant of $1,105,538 in 2006 as an incentive for local capital investment. The Group has presented the cost of the rights paid, net of the grants received.
In addition, Sunergy Nanjing purchased a right to use a parcel of land, approximately 26,000 square meters, from a related party, China Electric Equipment Group Co., Ltd, or CEEG, in August 2007, at a consideration approximately $1.2 million. The land use right represents rights to usage of land in the PRC for a period of 46 years, effective from August 21, 2007.
Amortization expense was $22,918, $24,728 and $29,393 for the year ended December 31, 2005, 2006 and 2007.
For 2008, 2009, 2010, 2011 and 2012, the Group will record annual amortization expense of approximately $47,004.
6. BANK BORROWINGS
| | | | | | |
| | | At December 31, |
| | | 2005 | | 2006 | | 2007 |
| | | $ | | $ | | $ |
Short-term bank borrowings | | 21,684,717 | | 69,262,771 | | 121,841,022 |
Current portion of long-term borrowings | | — | | 8,673,886 | | — |
Long-term bank borrowing | | 8,673,886 | | — | | — |
| | | | | | |
Total | | 30,358,603 | | 77,936,657 | | 121,841,022 |
| | | | | | |
The short-term bank borrowings outstanding as of December 31, 2005, 2006 and 2007 bore an average interest rate of 5.667%, 5.933% and 6.266% per annum, respectively. These loans represent borrowings of Sunergy Nanjing from various financial institutions and represent the maximum amount available under each facility. Each of these borrowings has a term of one year, and expires at various times throughout the year.
On November 18, 2004, Sunergy Nanjing entered into an unsecured loan agreement with Nanjing Commercial Bank for $6,149,303, due in November 2007. $1,812,360 was drawn down on November 25, 2004, and the remaining $4,336,943 was drawn down on January 4, 2005. The loan is subject to interest at a rate of 6.336% per annum.
On October 31, 2005, Sunergy Nanjing entered into an unsecured loan agreement with Bank of Communications for an amount of $2,524,583, due in October 2007. The loan is subject to interest at a rate of 6.336% per annum.
At December 31, 2007, approximately $28.7 million and $16.4 million of the short-term bank borrowings are secured by raw materials and a standby letter of credit from an off-shore bank, respectively. The remaining short-term borrowings are guaranteed by China Electric Equipment Group Co., Ltd., which is a related party, and Wuxi Guofei Green Energy Co., Ltd.
F-17
CHINA SUNERGY CO., LTD.
NOTES TO CONSOLIDATED FINANCIAL STATEMENTS—(Continued)
FOR THE YEARS ENDED DECEMBER 31, 2005, 2006 AND 2007
(In U.S. dollars, except share data and unless otherwise stated)
7. RESTRUCTURING
In April 2006, China Sunergy BVI underwent a legal reorganization as discussed in Note 1. To effect the reorganization, the following occurred either at or near the date of reorganization:
| | • | | China Sunergy BVI was formed by a single shareholder who contributed $13.1 million in cash in exchange for one common share of China Sunergy BVI. |
| | • | | China Sunergy BVI issued loans to Sunergy Nanjing and three of its founding shareholders (the “Loans”) for $10 million and $3.1 million, respectively. Approximately $2.0 million of the $3.1 million received by the founding shareholders was immediately contributed to Sunergy Nanjing in satisfaction of outstanding capital contribution requirements. |
| | • | | Two shareholders (the “Transferors”) transferred 10% of their ownership interest in Sunergy Nanjing to two of the remaining three beneficial shareholders of Sunergy Nanjing (the “Transferees”), who were directors and officers of Sunergy Nanjing, one of which assumed the Transferors unfunded capital contribution requirement of $540,000. China Sunergy accounted for this transaction as a contribution of capital by the Transferors followed by a non prorata dividend distribution to the Transferees. As a result, China Sunergy BVI recorded a compensation charge of approximately $3.7 million, equal to the fair value of the interest received by one of the Transferees in excess of what that Transferee would have received had the distribution been made on a prorata basis. |
| | • | | The Loans were effectively converted into 12,847,300 shares of Series A redeemable convertible preference shares (“Series A Shares”). This resulted in the three founding shareholders relinquishing a 3.2% ownership interest in Sunergy Nanjing (3,456,000 common shares of China Sunergy BVI on a post-restructuring basis), in exchange for the $3.1 million in loans outstanding. The fair value of the 3.2% ownership interest has been recorded as a reduction in additional paid-in capital. The excess of the $3.1 million in loans outstanding over the fair value of the 3.2% ownership interest received of $408,608 has been recorded as compensation expense. China Sunergy BVI effectively reclassified the carrying value of the Loans to Series A Shares. |
| | • | | China Sunergy BVI acquired all of Sunergy Nanjing’s ownership interests for approximately $4.04 million. Substantially all of this was paid to Sunergy Nanjing’s Chinese shareholder in order to comply with established regulatory practice, which requires that Chinese shareholders be paid not less than net asset value or investment cost for their equity interest in Sunergy Nanjing. A nominal amount was paid to the remaining shareholders. Under agreement, the Chinese shareholder remitted the $4.04 million to Sunergy Nanjing in August 2006. As a result, China Sunergy BVI will have paid nominal consideration to all Sunergy Nanjing shareholders for all of their equity interests in Sunergy Nanjing. |
| | • | | China Sunergy BVI issued 1,045,440 warrants (the “Warrants”), exercisable into 104,544,000 ordinary shares to the shareholders of Sunergy Nanjing to purchase China Sunergy BVI’s common shares at a nominal exercise price. The Warrants do not confer any voting rights or rights to dividends to the holders thereof. |
| | • | | The Transferors effectively sold 54,000 Warrants to an unrelated third-party for proceeds of approximately $5.2 million. The Warrants were exercised into common shares of China Sunergy BVI in August 2006. |
F-18
CHINA SUNERGY CO., LTD.
NOTES TO CONSOLIDATED FINANCIAL STATEMENTS—(Continued)
FOR THE YEARS ENDED DECEMBER 31, 2005, 2006 AND 2007
(In U.S. dollars, except share data and unless otherwise stated)
8. REDEEMABLE CONVERTIBLE PREFERRED SHARES
As discussed in Note 7, in April 2006, China Sunergy BVI issued 12,847,300 Series A redeemable convertible preferred shares, par value $0.0001 per share (the “Series A Shares”). China Sunergy BVI incurred issuance costs of $149,590 which it has deducted from the carrying value of the loans and, correspondingly, the Series A shares. In May 2006, China Sunergy BVI issued 23,905,100 Series B redeemable convertible preferred shares, par value $0.0001 per share (the “Series B Shares”), China Sunergy BVI incurred issuance costs of $50,000 which it has deducted from the carrying value of the Series B shares.
In September 2006, the Company issued 6,901,000 Series C redeemable convertible preferred shares, par value $0.0001 per share (the “Series C Shares”) (collectively with the Series A and Series B Shares, the “Preferred Shares”), and incurred issuance costs of $100,000 which it has deducted from the carrying value of the Series C shares.
Dividends
The Preferred Shares are entitled to dividends at an annual rate of 3% of the original issue price, compounded quarterly, whether or not declared by the Board of Directors of the Company. After payment of the Preferred Shares dividend, holders of Preferred Shares are entitled to participate in dividends paid to holders of ordinary shares on an as-converted basis.
Conversion
The preferred shares, plus all accrued but unpaid dividends thereon were originally convertible into ordinary shares at pre-set conversion prices, at the option of the holder at any time after the date of issuance of such shares. The preferred shares are automatically converted upon the consummation of an initial public offering (“IPO”) or by obtaining the necessary written consent from the holders of the Preferred Shares. An IPO refers to an initial public offering duly approved by the Company’s board of directors. The conversion price is subject to adjustment for dilution, the issuance of additional equity securities with a conversion price lower than that of the Preferred Shares, upon certain distributions made by the Company and upon an earnings adjustment in the event the Company’s 2006 (for series A and B); and 2007 (for series C) net earnings as defined under the agreement, is less than a predefined amount.
For each of the Preferred Shares, the Group recognized an initial beneficial conversion feature (“BCF”) based on the conversion price that would be in effect assuming the Group would not generate any additional income or issue any additional ordinary shares on A, series B and series C issuance dates, the Group’s earnings were below the pre-defined amounts. As such, the Group assumed that if there are no changes to the current circumstances other than the passage of time the conversion price would be (i) approximately $0.0001 per share for both the series A and series B shares as there was no floor on the conversion price adjustment, and (ii) $1.76 for the series C shares, representing the adjustment floor (collectively the “Effective Conversion Price”). Based on this, the Group recorded a BCF, limited to proceeds received upon issuance, for the series A, series B and series C preferred shares of $13,110,400, $27,999,948 and $6,941,170 respectively, during the year ended December 31, 2006. This amount was amortized immediately as a dividend to holders of the preferred shares as the Preferred Shares were convertible upon issuance.
F-19
CHINA SUNERGY CO., LTD.
NOTES TO CONSOLIDATED FINANCIAL STATEMENTS—(Continued)
FOR THE YEARS ENDED DECEMBER 31, 2005, 2006 AND 2007
(In U.S. dollars, except share data and unless otherwise stated)
As the Group’s 2006 net earnings were less than the pre-defined earnings target, the conversion prices of the series A and series B shares were adjusted to $0.39 and $0.44, respectively (collectively the “Adjusted Conversion Price”), effective December 31, 2006. The Adjusted Conversion Price was greater than the Effective Conversion Price, resulting in an adjusted BCF (intrinsic value) that is lower than the BCF (intrinsic value) recognized at issuance of the series A and series B shares. As the BCF had been fully amortized and there was no incremental BCF to recognize based on the Adjusted Conversion Price, no further adjustment was required.
In March 2007, our shareholders adopted a third amended and restated memorandum and articles of association to (a) modify the conversion prices of our Series A, Series B and Series C preferred shares, which were revised to $.39, $.44 and $1.76, respectively, subject to adjustments in the case of certain dilution events, and (b) replace the definition of “qualified IPO” or “QIPO” with the definition of “IPO.” The purposes of these modifications were to (a) ensure that there would be no preferred share outstanding after the completion of our initial public offering, (b) fix the conversion prices of our Series A and Series B preferred shares according to the earnings-based adjustments based on our 2006 net earnings as provided in our previous memorandum and articles of association, and (c) re-set the conversion price of our Series C preferred shares and delete the provision on the adjustment of such conversion price based on our 2007 net earnings, in order to avoid any dilution caused by the possible earnings-based adjustment. Such modifications did not have a significant impact on expected cash flows and, as such, did not impact our consolidated financial statements.
In March 2007, our shareholders mutually agreed for holders of our Series A and Series B preferred shares to sell a portion of their preferred shares to the Group for nominal consideration. The number of Series A and Series B shares sold was determined based on a calculation to offset the dilution impact of the adjustment of conversion prices caused by non-cash compensation charges of $4.7 million. Accordingly, we purchased 48,238 Series A preferred Shares, 72,079 Series B preferred shares, 8,009 Series B preferred shares and 9,610 Series B preferred shares from PraxCapital, Exuberance Investment Limited, Gersec Trust Reg., and China Environmental Fund 2004, LP, respectively, with nominal consideration. According to Cayman Islands law, these Series A and Series B preferred shares were automatically cancelled upon our purchase.
All the outstanding Series A, Series B and Series C redeemable convertible preferred shares of 12,847,300, 23,905,100 and 6,901,000 were automatically converted into 74,138,777 ordinary shares upon the consummation of the Group’s initial public offering on May 22, 2007.
Redemption
The Preferred Shares may redeem at any time after the occurrence of a redemption event, which includes (i) March 31, 2008 with respect to the Series A Shares, May 6, 2009 with respect to the Series B Shares and September 26, 2009 with respect to the Series C Shares (ii) a breach in the Preferred Share agreements by the Company or its founders, (iii) a non-competition breach by the founders or (iv) the commencement of a liquidation procedure or related action. The Company is only obligated to redeem 9,799,300 of the Series A Shares upon the occurrence of events (iii) or (iv) above. The Company has the ability to request a one year extension of the redemption date upon the occurrence of event (i) above, the extension of which requires the approval of the majority of the holders of the Series A, Series B or Series C Shares, respectively. The redemption amount must be paid in cash and is that amount which would provide the holder with an internal rate of return of 15% for Series A and Series B Shares and 12% for Series C Shares.
F-20
CHINA SUNERGY CO., LTD.
NOTES TO CONSOLIDATED FINANCIAL STATEMENTS—(Continued)
FOR THE YEARS ENDED DECEMBER 31, 2005, 2006 AND 2007
(In U.S. dollars, except share data and unless otherwise stated)
Voting rights
Each Preferred Share has voting rights equivalent to the number of ordinary shares into which it is convertible.
9. SUBSCRIPTION RECEIVABLE
In November 2004 and March 2006, Sunergy Nanjing modified its existing articles of incorporation. Such modifications had the effect of reducing the cash capital contribution requirements of certain of its shareholders, who were also employees. The Company has accounted for this as forgiveness of a shareholder loan and has recorded compensation charges of $810,000 and $540,000, respectively.
As described in Note 7, in April 2006, China Sunergy BVI acquired all of Sunergy Nanjing ownership interests for $4,046,811 which was paid to Sunergy Nanjing Chinese shareholder as a distribution on reorganization. Under the terms of an agreement, the Chinese shareholder was required to remit these funds, and did so in August 2006, to Sunergy Nanjing.
10. MAINLAND CHINA CONTRIBUTION PLAN
Full time employees of the Group in the PRC participate in a government-mandated multiemployer defined contribution plan pursuant to which certain pension benefits, medical care, unemployment insurance, employee housing fund and other welfare benefits are provided to employees. PRC labor regulations require the Group to accrue for these benefits based on certain percentages of the employees’ salaries. The total contribution for such employee benefits was $10,034, $278,235 and $636,913 for the years ended December 31, 2005, 2006 and 2007, respectively.
11. PROFIT APPROPRIATION
Pursuant to laws applicable to entities incorporated in the PRC, Sunergy Nanjing is prohibited from distributing its statutory capital and must make appropriations from PRC GAAP after-tax profit to other non-distributable reserve funds. These reserve funds include one or more of the following: (i) a general reserve, (ii) an enterprise expansion fund and (iii) a staff bonus and welfare fund. Subject to certain cumulative limits, the general reserve fund requires annual appropriation of 10% of after tax profit (as determined under accounting principles generally accepted in the PRC at each year-end); the appropriation to the other fund are at Sunergy Nanjing’s discretion. These reserve funds can only be used for specific purposes of enterprise expansion and staff bonus and welfare and are not distributable as cash dividends, loans or advances to the Company.
In 2006, Sunergy Nanjing made appropriations of $1,617,997 to the non-distributable general reserve fund. Due to a net loss in 2007 Sunergy Nanjing made no appropriation for 2007.
In 2007, with a board resolution on December 20, 2007, Sunergy Nanjing declared a dividend of $15,827,573 to the then shareholder, China Sunergy BVI, for the profit made in 2006.
As a result of these PRC laws and regulations, Sunergy Nanjing is restricted in its ability to transfer the registered capital to the Company in the form of dividends, loans or advances. The restricted portion amounted to $75,937,235, as of December 31, 2007.
F-21
CHINA SUNERGY CO., LTD.
NOTES TO CONSOLIDATED FINANCIAL STATEMENTS—(Continued)
FOR THE YEARS ENDED DECEMBER 31, 2005, 2006 AND 2007
(In U.S. dollars, except share data and unless otherwise stated)
12. OTHER INCOME (EXPENSE), NET
| | | | | | | | | |
| | | Years ended December 31, | |
| | | 2005 | | | 2006 | | | 2007 | |
| | | $ | | | $ | | | $ | |
Foreign currency exchange loss, net | | (184,366 | ) | | (1,250,644 | ) | | (1,173,159 | ) |
Government grants | | 24,471 | | | 583,569 | | | 1,660,567 | |
Others | | (3,437 | ) | | (177,739 | ) | | (393,996 | ) |
| | | | | | | | | |
| | (163,332 | ) | | (844,814 | ) | | (93,412 | ) |
| | | | | | | | | |
13. INCOME TAXES
Tax benefit comprises:
| | | | | | |
| | | Years ended December 31, |
| | | 2005 | | 2006 | | 2007 |
| | | $ | | $ | | $ |
Current tax. | | — | | — | | — |
Deferred tax benefit | | 79,757 | | 70,674 | | 705,504 |
| | | | | | |
| | 79,757 | | 70,674 | | 705,504 |
| | | | | | |
China Sunergy Cayman and China Sunergy BVI are tax-exempted companies incorporated in the Cayman Islands and British Virgin Islands, respectively. China Sunergy Hong Kong is subject to 17.5% income tax rate.
Sunergy Nanjing is governed by the Income Tax Law of PRC Concerning Foreign Investment and Foreign Enterprise and various local income tax laws (the “Income Tax Laws”). Pursuant to the PRC Income Tax Laws, foreign-invested manufacturing enterprises are subject to income tax at a statutory rate of 33% (30% of state income tax plus 3% local income tax) on PRC taxable income. However, Sunergy Nanjing is a foreign-invested manufacturing enterprise established within a coastal economic zone, and is thus entitled to a preferential tax rate of 24%.
Foreign-invested manufacturing enterprises are entitled to tax exemption from income tax for its first two profitable years of operation, after taking into account any tax losses brought forward from prior years, and a 50% tax deduction for the succeeding three years thereafter. As a result, Sunergy Nanjing exempt from income tax for the two years ended December 31, 2006 and 2007 and will enjoy a 50% of tax deduction for the three years ending December 31, 2008, 2009 and 2010.
On March 16, 2007, the National People’s Congress approved and promulgated a new tax law, China’s Unified Enterprise Income Tax Law (“new PRC tax law”), which will take effect beginning January 1, 2008. Under the new tax law, FIEs and domestic companies are subject to a uniform tax rate of 25%. The new law provides a five-year transition period from its effective date for those enterprises which were established before the promulgation date of the new tax law and which were entitled to a preferential lower tax rate under the then effective tax laws or regulations. As a result, Sunergy Nanjing is subject to income tax at a statutory rate of 25% on PRC taxable income from year 2008. However, due to its 50% reduction tax holiday, the applicable income tax rate for Sunergy Nanjing 12.5% for the three years ending December 31, 2008, 2009 and 2010.
F-22
CHINA SUNERGY CO., LTD.
NOTES TO CONSOLIDATED FINANCIAL STATEMENTS—(Continued)
FOR THE YEARS ENDED DECEMBER 31, 2005, 2006 AND 2007
(In U.S. dollars, except share data and unless otherwise stated)
In July 2006, the Financial Accounting Standards Board (FASB) issued FASB Interpretation No. 48, “Accounting for Uncertainty in Income Taxes—an interpretation of FASB Statement No. 109” (“FIN 48”), which clarifies the accounting and disclosure for uncertainty in tax positions, as defined in that statement. FIN 48 prescribes a more-likely-than-not threshold for financial statement recognition and measurement of tax position taken or expected to taken in a tax return. This interpretation also provides guidance on derecognition of income tax assets and liabilities, classification of current and deferred income tax assets and liabilities, accounting for interest and penalties associated with tax positions, accounting for income taxes in interim periods and income tax disclosures.
The Company adopted the provisions of FIN 48 effective January 1, 2007. Based on its FIN 48 analysis documentation, the Company has made its assessment of the level of tax authority for each tax position (including the potential application of interest and penalties) based on the technical merits. The adoption of FIN 48 did not have any impact on the Company total liabilities or shareholders’ equity. The Company has no material uncertain tax position as of December 31, 2007 or unrecognized tax benefit which would favorably affect the effective income tax expense. As of January 1 and December 31, 2007, the amount of interest and penalties related to uncertain tax positions is immaterial. The Company does not anticipate any significant increases or decreases to its liabilities for unrecognized tax benefits within the next 12 months.
The principal components of the deferred income tax assets are as follows:
| | | | | | |
| | | At December 31, |
| | | 2005 | | 2006 | | 2007 |
| | | $ | | $ | | $ |
Deferred tax assets: | | | | | | |
Pre-operating expense | | 58,573 | | 58,573 | | 61,179 |
Depreciation of property, plant and equipment | | 8,011 | | 49,307 | | 151,570 |
Warranty costs | | — | | 42,551 | | 56,121 |
Inventory provision | | — | | — | | 242,686 |
Bad debts provision | | — | | — | | 137,134 |
Tax losses carried forward | | 13,173 | | — | | 147,541 |
Others | | — | | — | | 59,704 |
| | | | | | |
Total deferred tax assets | | 79,757 | | 150,431 | | 855,935 |
| | | | | | |
Analysis as: | | | | | | |
Current | | 13,173 | | — | | 527,361 |
Non-current | | 66,584 | | 150,431 | | 328,574 |
| | | | | | |
Total deferred tax assets | | 79,757 | | 150,431 | | 855,935 |
| | | | | | |
The tax losses available for carry forward in 2005 and 2007 amounted to approximately $48,790 and $1,180,328, and will expire in 2010 and 2012 respectively.
F-23
CHINA SUNERGY CO., LTD.
NOTES TO CONSOLIDATED FINANCIAL STATEMENTS—(Continued)
FOR THE YEARS ENDED DECEMBER 31, 2005, 2006 AND 2007
(In U.S. dollars, except share data and unless otherwise stated)
Reconciliation between the provision for income tax computed by applying the PRC enterprise income tax of 33% to income before income taxes and the actual provision for income tax is as follows:
| | | | | | | | | | | | |
| | | Years ended December 31, | |
| | | 2005 | | | 2006 | | | 2007 | |
PRC enterprise income tax | | | 33.0 | % | | | 33.0 | % | | | 33.0 | % |
Expense not deductible for tax purposes | | | | | | | | | | | | |
Forgiveness of shareholder receivable | | | — | | | | 1.5 | % | | | — | |
Excess of prorata distribution to shareholders | | | — | | | | 10.2 | % | | | — | |
Purchase and retirement of treasury shares | | | — | | | | 1.1 | % | | | — | |
Return of distribution on reorganization | | | — | | | | 11.1 | % | | | — | |
Government grants | | | — | | | | 3.0 | % | | | — | |
50% additional deduction of R&D expense | | | — | | | | — | | | | (11.7 | )% |
Other expense non-deductible for tax purposes | | | 3.0 | % | | | 0.2 | % | | | 1.3 | % |
Effect of tax rate change | | | — | | | | — | | | | 0.1 | % |
Tax exemption granted to the Company | | | (15.0 | )% | | | (60.7 | )% | | | (10.0 | )% |
| | | | | | | | | | | | |
| | | 21 | % | | | (0.6 | )% | | | 12.7 | % |
| | | | | | | | | | | | |
Gross tax exemption | | $ | 667,705 | | | $ | 22,163,865 | | | $ | 3,117,790 | |
| | | | | | | | | | | | |
Tax exemption per share—basic | | $ | 0.01 | | | $ | 0.17 | | | $ | 0.02 | |
| | | | | | | | | | | | |
Tax exemption per share—diluted | | $ | 0.01 | | | $ | 0.17 | | | $ | 0.02 | |
| | | | | | | | | | | | |
Undistributed earnings of the Company’s PRC subsidiaries of approximately $12.8 million at December 31, 2007, are considered to be indefinitely reinvested and, accordingly, no provision for income taxes have been provided thereon. Upon distribution of those earnings in the form of dividends or otherwise in the future, the Company would be subject to the then applicable PRC tax laws and regulations.
14. SHARE BASED COMPENSATION
Prior to 2006, the Company did not grant share options to employees, officers, directors or individual consultants and/or advisors who rendered services to the Group.
In October 2006, the Company adopted the Share Incentive Plan (the “Plan”) which allows the Company to offer share incentive awards to employees, officers, directors, individual consultants or advisors who rendered services to the Group, pursuant to which 1,366,400 ordinary shares were authorized and granted. Under the Plan, options are granted with an exercise price equal to 70% of the fair market value of the underlying shares, as determined by the Board of Directors at the date of grant and expire after 10 years, with vesting occurring 25% upon each anniversary of the grant. The proceeds from the exercise of the options by the grantee will be equity settled by cash or other method as permitted and set forth in the plan.
On April 24, 2007, the Company amended and restated the above Share Incentive Plan, which approved the issuance of up 2,500,000 ordinary shares of the Company pursuant to awards of options. Under the plan, additional 684,500 ordinary shares were granted at an exercise price equal to 70% of the IPO offering price per ordinary share.
F-24
CHINA SUNERGY CO., LTD.
NOTES TO CONSOLIDATED FINANCIAL STATEMENTS—(Continued)
FOR THE YEARS ENDED DECEMBER 31, 2005, 2006 AND 2007
(In U.S. dollars, except share data and unless otherwise stated)
The Group adopted the provisions of SFAS 123-R and recorded $nil, $114,563 and $535,856 as compensation expense in accordance with its provisions for the year ended December 31, 2005, 2006 and 2007, respectively.
The derived fair value of the ordinary shares underlying the options was determined by the Company, with references to a retrospective third-party valuation as of September 30, 2006 by, an independent appraiser, using generally accepted valuation methodologies, including a weighted average equity value derived by using a combination of the discounted cash flow method, a method within the income approach whereby the present value of future expected net cash flows is calculated using a discount rate and the guideline companies method, which incorporates certain assumptions including the market performance of comparable listed companies as well as the financial results and growth trends of the Group, to derive the total equity value of the Group. The valuation model allocated the equity value between the ordinary shares and the preferred shares and determined the fair value of ordinary shares based on the option-pricing method under the enterprise value allocation method. Under this method, the ordinary shares have value only if the funds available for distribution to shareholders exceed the value of the liquidation preference at the time of a liquidity event (for example, merger or sale). The ordinary shares are considered to be a call option with claim on the enterprise at an exercise price equal to the remaining value immediately after the preferred shares are liquidated.
The fair value of each award is estimated on the date of grant using the binomial option-pricing formula that uses the assumptions noted below. Expected volatilities are based on the average volatility of comparable companies with the time period commensurate with the expected time period. The Group uses historical data to estimate option exercise and employee termination within the pricing formula. The expected term of options granted represents the period of time that options granted are expected to be outstanding. The risk-free rate for periods within the contractual life of the option is based on the yield of US Treasury Bond.
| | | | | | |
| | | 2006 | | | 2007 | |
Average risk-free rate of return | | 4.77 | % | | 4.63 | % |
Weighted average expected term | | 3.4 years | | | 3.88 years | |
Volatility rate | | 65 | % | | 61 | % |
Dividend yield | | 0 | % | | 0 | % |
The weighted average grant-date fair value of options granted during year 2006 and 2007 was $1.34 and $0.96 per share, respectively. There were no options vested or exercised during the year ended December 31, 2006. Total fair value of options vested during the year ended December 31, 2007 is $369,840.
In November 2007, the Company modified the exercise price of all the options granted in 2006 from $1.988 to $1.283 per ordinary share. The total incremental compensation expense resulting from the modification was $139,600, which will be amortized over the remaining requisite service period of 2.95 years.
All the amounts below reflect the modification of exercise prices of options.
F-25
CHINA SUNERGY CO., LTD.
NOTES TO CONSOLIDATED FINANCIAL STATEMENTS—(Continued)
FOR THE YEARS ENDED DECEMBER 31, 2005, 2006 AND 2007
(In U.S. dollars, except share data and unless otherwise stated)
A summary of the option activities is follows:
| | | | | | | | | |
| | | Number of
Options | | | Weighted average
exercise price | | Weighted average
remaining
contract term | | Aggregate
intrinsic value |
Outstanding at January 1, 2007 | | 1,323,600 | | | 1.283 | | — | | — |
Granted | | 684,500 | | | 1.283 | | — | | — |
Forfeited | | (421,200 | ) | | 1.283 | | — | | — |
Exercised | | — | | | — | | — | | — |
| | | | | | | | | |
Outstanding at December 31, 2007 | | 1,586,900 | | | 1.283 | | 8.94 | | 1,554,791 |
| | | | | | | | | |
Options vested or expected to vest at December 31, 2007 | | 1,572,270 | | | 1.283 | | 8.94 | | 1,172,847 |
| | | | | | | | | |
Options exercisable at December 31, 2007 | | 276,000 | | | 1.283 | | 8.75 | | 211,232 |
| | | | | | | | | |
As of December 31, 2007, there was $1,856,288 of total unrecognized compensation expense related to unvested share-based compensation arrangements granted under the plan, which is expected to be recognized over a weighted-average period of 2.88 years.
15. RELATED PARTY TRANSACTIONS AND BALANCES
Related party balances
Amounts due from related parties:
| | | | | | |
| | | Years ended December 31, |
| | | 2005 | | 2006 | | 2007 |
| | | $ | | $ | | $ |
Balances with directors | | 59,508 | | 768 | | — |
Trade related balances | | — | | 1,535,648 | | 2,111,890 |
Non-trade related balances | | 14,044,775 | | 439,994 | | — |
| | | | | | |
Amounts due from related parties | | 14,104,283 | | 1,976,410 | | 2,111,890 |
| | | | | | |
Balances with directors pertain to cash advances to directors in respect of travel expenses.
Trade related balances pertain to receivables and prepayments in respect of sales and inventory purchases to/from related parties with common ultimate investors. Details of trade related balances with such parties are as follows:
| | | | | | |
| | | At December 31, |
Name of related party | | 2005 | | 2006 | | 2007 |
| | | $ | | $ | | $ |
CEEG (Nanjing) International Trading Co., Ltd. | | — | | 1,535,648 | | 90,321 |
CEEG (Nanjing) Semiconductor Co., Ltd. | | — | | — | | 441,627 |
CEEG (Shanghai) Solar Science and Technology Co., Ltd. | | — | | — | | 1,159,337 |
CEEG (Nanjing) Solar Research Institute | | — | | — | | 420,605 |
| | | | | | |
| | — | | 1,535,648 | | 2,111,890 |
| | | | | | |
F-26
CHINA SUNERGY CO., LTD.
NOTES TO CONSOLIDATED FINANCIAL STATEMENTS—(Continued)
FOR THE YEARS ENDED DECEMBER 31, 2005, 2006 AND 2007
(In U.S. dollars, except share data and unless otherwise stated)
In 2005, non-trade related balances pertain to cash advances to related parties with common ultimate investors. Such cash advances are unsecured, interest-free, and have no fixed repayment terms. Details of cash advances to such parties are as follows:
| | | | | | |
| | | At December 31, |
Name of related party | | 2005 | | 2006 | | 2007 |
| | | $ | | $ | | $ |
Jiangsu CEEG Transformer Manufacturing Co., Ltd. | | 8,092,643 | | — | | — |
Jiangsu CEEG Electrical Transmission and Distribution Equipment
Co., Ltd. | | 4,712,926 | | — | | — |
Jiangsu CEEG Electrical Equipment Manufacturing Co., Ltd. | | 1,139,997 | | — | | — |
CEEG Nanjing Electronic Technology Co., Ltd. | | 11,231 | | — | | — |
Jiangsu Tianhua Photo-electronic Technology Co., Ltd. | | 87,978 | | — | | — |
| | | | | | |
| | 14,044,775 | | — | | — |
| | | | | | |
In 2006, the non-trade related balance pertains to payments of $212,684 made on behalf of CEEG (Nanjing) Special Transformer Manufacturing Co., Ltd in respect of purchase of fixed assets, and $227,310 made on behalf of CEEG Nanjing International Trade Co., Ltd. in respect of purchase of inventories.
Amounts due to related parties:
| | | | | | |
| | | At December 31, |
| | | 2005 | | 2006 | | 2007 |
| | | $ | | $ | | $ |
Balances with directors | | 9,348 | | 3,742 | | — |
Trade-related balance | | — | | — | | 8,214 |
Non-trade related balances | | 28,427,520 | | — | | — |
| | | | | | |
Amounts due to related parties | | 28,436,868 | | 3,742 | | 8,214 |
| | | | | | |
Balances with directors pertain to expense reimbursements payable to directors.
Trade related balances pertain to rental payable to CEEG (Nanjing) Special Transformer Co., Ltd., a company with common ultimate investors.
F-27
CHINA SUNERGY CO., LTD.
NOTES TO CONSOLIDATED FINANCIAL STATEMENTS—(Continued)
FOR THE YEARS ENDED DECEMBER 31, 2005, 2006 AND 2007
(In U.S. dollars, except share data and unless otherwise stated)
Non-trade related balances pertain to cash advances from other related parties with common ultimate investors. Such cash advances are unsecured, interest-free, and have no fixed repayment terms. Details of cash advances from such parties are as follows:
| | | | | | |
| | | At December 31, |
Name of related party | | 2005 | | 2006 | | 2007 |
| | | $ | | $ | | $ |
CEEG Nanjing International Trade Co., Ltd. | | 1,485,212 | | — | | — |
China Electric Equipment Group Co., Ltd. | | 4,027,455 | | — | | — |
Jiangsu CEEG Electrical Equipment Manufacturing Co., Ltd. | | 9,011,852 | | — | | — |
CEEG (Jiangsu) Jueyuan New Materials Co., Ltd. | | 272,608 | | — | | — |
Jiangsu CEEG Electrical Transmission and Distribution Equipment
Co., Ltd. | | 13,630,393 | | — | | — |
| | | | | | |
| | 28,427,520 | | — | | — |
| | | | | | |
Related party transactions
Other than as disclosed in note 6, details of related party transactions are as follow:
Sales to related parties with common ultimate investors:
| | | | | | |
| | | Years ended December 31, |
Name of related party | | 2005 | | 2006 | | 2007 |
| | | $ | | $ | | $ |
CEEG Nanjing International Trade Co., Ltd. | | — | | 4,772,552 | | 3,234,428 |
Jiangsu East China Micro-ware Equipment Co., Ltd. | | — | | 55,685 | | — |
CEEG (Shanghai) Solar Science and Technology Co., Ltd. | | — | | — | | 5,192,155 |
CEEG (Nanjing) Solar Research Institute | | — | | — | | 1,521,110 |
CEEG (Nanjing) New Energy Co., Ltd. | | — | | — | | 41,927 |
CEEG (Nanjing) Semiconductor Co., Ltd. | | — | | — | | 602,796 |
| | | | | | |
| | — | | 4,828,237 | | 10,592,416 |
| | | | | | |
Purchase of raw materials from related parties with common ultimate investors are as follows:
| | | | | | |
| | | Years ended December 31, |
Name of related party | | 2005 | | 2006 | | 2007 |
| | | $ | | $ | | $ |
CEEG (Nanjing) Solar Research Institute | | — | | — | | 155,374 |
CEEG Nanjing International Trade Co., Ltd. | | — | | 6,462,879 | | 1,166,712 |
CEEG (Shanghai) Solar Science and Technology Co., Ltd. | | — | | — | | 704,880 |
CEEG (Nanjing) Semiconductor Co., Ltd. | | — | | — | | 1,425,888 |
| | | | | | |
| | — | | 6,462,879 | | 3,452,854 |
| | | | | | |
F-28
CHINA SUNERGY CO., LTD.
NOTES TO CONSOLIDATED FINANCIAL STATEMENTS—(Continued)
FOR THE YEARS ENDED DECEMBER 31, 2005, 2006 AND 2007
(In U.S. dollars, except share data and unless otherwise stated)
In 2006, Sunergy Nanjing entered into a rental tenancy agreement with CEEG Jiangsu (Nanjing) Special Transformer Co., Ltd for the use of warehouse premises. The tenancy agreement provides for annual rental payments of $8,214, and has a remaining term of 4 years as of December 31, 2007. Rental expense for the years ended December 31, 2005, 2006 and 2007 was $nil, $1,921 and $7,940.
In 2007, Sunergy Nanjing purchased the right to use a parcel of land of approximately 26,000 square meters from China Electric Equipment Group Co., Ltd, or CEEG, for approximately $1.2 million. The land use right is with a period of 46 years, starting from August 21, 2007.
In October 2007, Sunergy Nanjing and CEEG entered into an agreement to jointly construct a transformer substation. The total budget investment for the construction is approximately $4.79 million, which will be funded 50% by the Jiangning Development Zone Administration Committee funds and 50% by Sunergy Nanjing and CEEG Group. Pursuant to the agreement, Sunergy Nanjing will contribute approximately $1.33 million, which represents 55.7% of the amount required to be contributed by Sunergy Nanjing and CEEG Group.
In December 2007, the Group entered into two agreements with CEEG, under which the Group would purchase electric transformers and high-voltage switch cabinet in the amount of approximately $0.2 million and $0.6 million, respectively.
16. COMMITMENTS AND CONTINGENCIES
a) Operating lease commitments
The Group has operating lease agreements principally for staff quarters and for warehouse premises in the PRC. Such leases have remaining terms within 60 months, and are renewable upon negotiation. Rental expense was $nil and $66,113 and $253,779 for the years ended December 31, 2005, 2006 and 2007, respectively.
Future minimum lease payments under non-cancelable operating lease agreements at December 31, 2007 were as follows:
Twelve-month period ending December 31,
| | | |
2008 | | $ | 142,629 |
2009 | | | 8,214 |
2010 | | | 8,214 |
2011 | | | 6,161 |
2012 | | | — |
| | | |
| | | 165,218 |
| | | |
b) Purchase commitments
| | | | | | |
| | | At December 31, |
| | | 2005 | | 2006 | | 2007 |
| | | $ | | $ | | $ |
Commitments to purchase property, plant and equipment | | 5,129,426 | | 3,571,400 | | 22,857,763 |
Commitments to purchase silicon raw materials | | 11,201,704 | | 114,714,909 | | 204,932,508 |
| | | | | | |
| | 16,331,130 | | 118,286,309 | | 227,790,271 |
| | | | | | |
F-29
CHINA SUNERGY CO., LTD.
NOTES TO CONSOLIDATED FINANCIAL STATEMENTS—(Continued)
FOR THE YEARS ENDED DECEMBER 31, 2005, 2006 AND 2007
(In U.S. dollars, except share data and unless otherwise stated)
c) Contingencies
The Group is subject to claims and legal proceedings that arise in the ordinary course of its business. Each of these matters is subject to various uncertainties, and it is possible that some of these matters may be decided unfavorably to the Group. The Group does not believe that any of these matters will have a material adverse affect on its business, assets or operations.
17. SEGMENT INFORMATION
The Group’s chief operating decision maker has been identified as the Chief Executive Officer, who reviews consolidated results when making decisions about allocating resources and assessing performance of the Group. Based on this assessment, the Group has determined that it operates in a single business segment that includes the design, development, and manufacture of solar cells and modules. The following table summarizes the Group’s net revenues generated from different geographic locations:
| | | | | | |
| | | Years ended December 31, |
| | | 2005 | | 2006 | | 2007 |
| | | $ | | $ | | $ |
Europe: | | | | | | |
—Germany | | 172,876 | | 14,893 | | 62,313,810 |
—Italy | | — | | 12,234,738 | | 8,980,140 |
—Netherlands | | 7,170 | | 8,956,669 | | — |
—Others | | — | | 175,084 | | 1,802,956 |
| | | | | | |
Europe total | | 180,046 | | 21,381,384 | | 73,096,906 |
PRC | | 13,487,121 | | 119,237,947 | | 151,057,878 |
South Africa | | 5,539 | | 3,712,425 | | 83,437 |
South Korea | | — | | 3,183,301 | | 6,418,664 |
Others | | 76,961 | | 2,005,887 | | 4,251,016 |
| | | | | | |
Total net revenues | | 13,749,667 | | 149,520,944 | | 234,907,901 |
| | | | | | |
Substantially all the identifiable assets of the Group are located in the PRC.
18. MAJOR CUSTOMERS
Details of the customers accounting for 10% or more of total net sales are as follows:
| | | | | | | | | |
| | | Years ended December 31, | |
Name of Customer | | 2005 | | | 2006 | | | 2007 | |
Company A | | 45 | % | | 17 | % | | 24 | % |
Company B | | — | | | * | | | 17 | % |
Company C | | * | | | 19 | % | | * | |
Company D | | * | | | 17 | % | | * | |
Company E | | 16 | % | | * | | | * | |
F-30
CHINA SUNERGY CO., LTD.
NOTES TO CONSOLIDATED FINANCIAL STATEMENTS—(Continued)
FOR THE YEARS ENDED DECEMBER 31, 2005, 2006 AND 2007
(In U.S. dollars, except share data and unless otherwise stated)
Accounts receivable from customers accounting for 10% or more of total gross accounts receivable are as follows:
| | | | | | | | | |
| | | December 31, | |
Name of Customer | | 2005 | | | 2006 | | | 2007 | |
Company A | | — | | | 44 | % | | 76 | % |
Company C | | 14 | % | | * | | | * | |
Company D | | * | | | 45 | % | | * | |
Company F | | — | | | — | | | 11 | % |
Company G | | 27 | % | | * | | | * | |
Company H | | 14 | % | | * | | | * | |
Company I | | 11 | % | | * | | | * | |
19. SUBSEQUENT EVENTS
On January 10, 2008, the Group granted options to purchase 716,226 ordinary shares to certain employees at an exercise price of US$1.283 per share. The options expire ten years from the date of grant, with one-fourth of the options vesting on each of the following four grant date anniversaries.
On February 5, 2008, the shareholders granted approval for its Second Share Incentive Plan (the “Plan”). The Plan is open to members of the China Sunergy board, as well as employees and consultants as determined by the compensation committee of the board. The maximum number of shares that may be issued pursuant to the Plan is 4,190,748. The Group granted 2,397,301 and 1,078,785 restricted common shares to its CEO and CFO on the same day, which fully vest in three years.
* * * * * *
F-31
ADDITIONAL INFORMATION—FINANCIAL STATEMENTS SCHEDULE 1
CHINA SUNERGY CO., LTD.
These financial statements have been prepared in conformity with accounting principles generally accepted in the United States.
Financial information of parent company
BALANCE SHEET
(In U.S. dollars)
| | | | | |
| | | December 31, | |
| | | 2006 | | 2007 | |
| | | $ | | $ | |
ASSETS | | | | | |
Current assets: | | | | | |
Cash | | 487,206 | | 5,866,420 | |
Restricted cash | | — | | 19,000,000 | |
Amount due from subsidiaries | | 3,500,000 | | 46,732,922 | |
Dividend receivable | | — | | 15,827,573 | |
Other receivables | | — | | 849,731 | |
| | | | | |
Total current assets | | 3,987,206 | | 88,276,646 | |
| | | | | |
Investments in subsidiaries | | 80,378,077 | | 97,370,678 | |
| | | | | |
Total assets | | 84,365,283 | | 185,647,324 | |
| | | | | |
| | |
LIABILITIES, MEZZANINE EQUITY AND SHAREHOLDERS’ EQUITY: | | | | | |
| | |
Liabilities: | | | | | |
Amount due to subsidiary | | 99,590 | | 983,849 | |
Other liabilities | | 200,000 | | 815,382 | |
| | | | | |
Total liabilities | | 299,590 | | 1,799,231 | |
| | | | | |
Mezzanine equity: | | | | | |
Series A redeemable convertible preferred shares ($0.0001 par value; 12,847,300 shares authorized, 12,847,340 and nil shares issued and outstanding as of December 31, 2006 and 2007, respectively) | | 13,227,862 | | — | |
Series B redeemable convertible preferred shares ($0.0001 par value; 23,905,100 shares authorized, 23,905,100 and nil shares issued and outstanding as of December 31, 2006 and 2007, respectively) | | 28,501,788 | | — | |
Series C redeemable convertible preferred shares ($0.0001 par value; 6,901,000 shares authorized, 6,901,000 and nil shares issued and outstanding as of December 31, 2006 and 2007, respectively) | | 20,056,093 | | — | |
| | |
Shareholders’ equity: | | | | | |
Ordinary shares (per value $0.0001; 463,247,600 shares authorized, 104,544,000 shares and 237,332,777 shares issued and outstanding as of December 31, 2006 and 2007, respectively) | | 10,454 | | 23,733 | |
Additional paid-in capital | | 20,144,945 | | 178,361,461 | |
Accumulated deficit | | — | | (4,854,650 | ) |
Accumulated other comprehensive income | | 2,124,551 | | 10,317,549 | |
| | | | | |
Total shareholders’ equity | | 22,279,950 | | 183,848,093 | |
| | | | | |
TOTAL LIABILITIES, MEZZANINE EQUITY AND SHAREHOLDERS’ EQUITY | | 84,365,283 | | 185,647,324 | |
| | | | | |
F-32
Financial information of parent company
STATEMENT OF OPERATIONS
(In U.S. dollars)
| | | | | | |
| | | Period from
January 27, 2006
(date of inception)
to December 31,
2006 | | | Year ended
December 31,
2007 | |
| | | $ | | | $ | |
General and administrative expenses | | (121,102 | ) | | (1,670,018 | ) |
| | | | | | |
Total operating expenses | | (121,102 | ) | | (1,670,018 | ) |
| | | | | | |
Loss from operations | | (121,102 | ) | | (1,670,018 | ) |
| | | | | | |
Interest income | | 30,239 | | | 1,062,420 | |
Equity in earnings of subsidiaries | | 14,388,238 | | | (4,408,014 | ) |
Other income (expense), net | | — | | | 160,962 | |
| | | | | | |
Income (loss) before income taxes | | 14,297,375 | | | (4,854,650 | ) |
Income taxes | | — | | | — | |
| | | | | | |
Net income (loss) | | 14,297,375 | | | (4,854,650 | ) |
Dividend on Series A redeemable convertible preferred shares | | (13,377,452 | ) | | (154,723 | ) |
Dividend on Series B redeemable convertible preferred shares | | (28,551,788 | ) | | (330,229 | ) |
Dividend on Series C redeemable convertible preferred shares | | (7,097,263 | ) | | (233,125 | ) |
| | | | | | |
Net loss attributable to holders of ordinary shares | | (34,729,128 | ) | | (5,572,727 | ) |
| | | | | | |
F-33
Financial information of parent company
STATEMENT OF CASH FLOWS
(In U.S. dollars)
| | | | | | |
| | | Period from
January 27, 2006
(date of inception)
to December 31,
2006 | | | Year ended
December 31,
2007 | |
| | | $ | | | $ | |
Operating activities: | | | | | | |
Net loss attributable to holders of ordinary shares | | (34,729,128 | ) | | (5,572,727 | ) |
Dividend on Series A redeemable convertible preferred shares | | 13,377,452 | | | 154,723 | |
Dividend on Series B redeemable convertible preferred shares | | 28,551,788 | | | 330,229 | |
Dividend on Series C redeemable convertible preferred shares | | 7,097,263 | | | 233,125 | |
| | | | | | |
Net income (loss) | | 14,297,375 | | | (4,854,650 | ) |
Adjustments to reconcile net income (loss) to net cash used in operating activities | | | | | | |
Equity in earnings of subsidiaries | | (14,388,238 | ) | | 4,408,014 | |
Share-based compensation | | 114,563 | | | 535,856 | |
Changes in operating assets and liabilities: | | | | | | |
Other receivables | | — | | | (849,731 | ) |
Other liabilities | | — | | | 615,382 | |
Amount due from subsidiary | | (3,500,000 | ) | | — | |
| | | | | | |
Net cash used in operating activities | | (3,476,300 | ) | | (145,129 | ) |
| | | | | | |
Investing activity: | | | | | | |
Investments in subsidiaries | | (57,157,296 | ) | | (29,035,190 | ) |
Amounts due from subsidiaries | | — | | | (43,232,922 | ) |
Increase in restricted cash | | — | | | (19,000,000 | ) |
| | | | | | |
Net cash used in investing activity | | (57,157,296 | ) | | (91,268,112 | ) |
| | | | | | |
Financing activities: | | | | | | |
Proceeds from investor upon formation of the Company | | 13,110,400 | | | — | |
Proceeds from issuance of Series B redeemable convertible preference shares | | 27,999,948 | | | — | |
Proceeds from issuance of Series C redeemable convertible preference shares | | 20,000,000 | | | — | |
Proceeds from issuance of ordinary shares | | 10,454 | | | 107,525,000 | |
Issuance cost of ordinary shares | | — | | | (11,616,804 | ) |
Amounts due to subsidiaries | | — | | | 884,259 | |
| | | | | | |
Net cash provided by financial activities | | 61,120,802 | | | 96,792,455 | |
| | | | | | |
Net increase in cash and cash equivalents | | 487,206 | | | 5,379,214 | |
Cash and cash equivalents at the beginning of the period/year | | — | | | 487,206 | |
| | | | | | |
Cash and cash equivalents at the end of the period/year | | 487,206 | | | 5,866,420 | |
| | | | | | |
Supplemental schedule of non-cash investing and financing activities: | | | | | | |
Dividend receivable from subsidiary | | — | | | 15,827,573 | |
F-34
Financial information of parent company
Note to Schedule 1
China Sunergy BVI undertook a restructuring in anticipation of an initial public offering involving a holding company (the “Company”) that was incorporated in the Cayman Islands on August 4, 2006. The Company became the ultimate holding company on August 30, 2006 by acquiring a 100% interest in China Sunergy BVI. This transaction was accounted for as a legal reorganization as there was no change in the ownership structure between the Company and China Sunergy BVI.
Subsequent to the issuance of the 2006 financial statements, management determined that the investment in subsidiaries and shareholders’ equity should have reflected the historical cost of the predecessor at the date of legal reorganization, January 27, 2006. Previously, such accounts reflected only the activity that occurred subsequent to the legal reorganization. As a result, the parent company balance sheet as of December 31, 2006 has been restated by increasing investment in subsidiaries and total shareholders’ equity by $8,591,624. There is no impact on the parent company statement of operations.
* * * * * *
F-35