UNITED STATES
SECURITIES AND EXCHANGE COMMISSION
SECURITIES AND EXCHANGE COMMISSION
Washington, D.C. 20549
FORM N-CSR
CERTIFIED SHAREHOLDER REPORT OF REGISTERED
MANAGEMENT INVESTMENT COMPANIES
MANAGEMENT INVESTMENT COMPANIES
INVESTMENT COMPANY ACT FILE NUMBER: 811-22047
| EXACT NAME OF REGISTRANT AS SPECIFIED IN CHARTER: | Calamos Global Dynamic Income Fund |
| ADDRESS OF PRINCIPAL EXECUTIVE OFFICES: | 2020 Calamos Court, Naperville, | |
| Illinois 60563-2787 | ||
| NAME AND ADDRESS OF AGENT FOR SERVICE: | John P. Calamos, Sr., President | |
| Calamos Advisors LLC | ||
| 2020 Calamos Court | ||
| Naperville, Illinois | ||
| 60563-2787 |
REGISTRANT’S TELEPHONE NUMBER, INCLUDING AREA CODE: (630) 245-7200
DATE OF FISCAL YEAR END: October 31, 2011
DATE OF REPORTING PERIOD: November 1, 2010 through April 30, 2011
| ITEM 1. | REPORTS TO SHAREHOLDERS |
Include a copy of the report transmitted to stockholders pursuant to Rule 30e-1 under the Act (17 CFR 270. 30e-1).
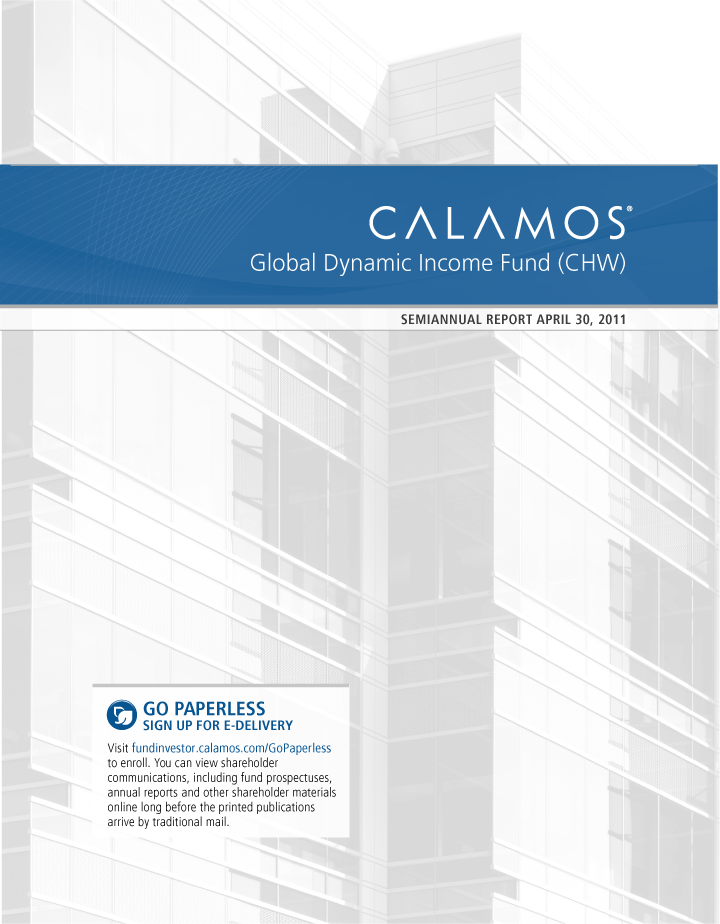
TABLE OF CONTENTS
| Letter to Shareholders | 1 | |
| The Calamos Closed-End Funds: An Overview | 5 | |
| Investment Team Discussion | 6 | |
| Schedule of Investments | 10 | |
| Statement of Assets and Liabilities | 18 | |
| Statement of Operations | 19 | |
| Statements of Changes In Net Assets | 20 | |
| Statement of Cash Flows | 21 | |
| Notes to Financial Statements | 22 | |
| Financial Highlights | 30 | |
| Report of Independent Registered Public Accounting Firm | 31 | |
| About Closed-End Funds | 32 | |
| Level Rate Distribution Policy | 33 | |
| Automatic Dividend Reinvestment Plan | 33 |

Experience and Foresight
About Calamos Investments
For more than 30 years, we have helped investors like you manage and build wealth to meet their long-term individual objectives by working to capitalize on the opportunities of the evolving global marketplace. We launched our first open-end mutual fund in 1985 and our first closed-end fund in 2002. Today, we manage five closed-end funds. Two are total-return oriented offerings, which seek current income, with increased emphasis on capital gains potential. Three are enhanced fixed-income offerings, which pursue high current income from income and capital gains. Calamos Global Dynamic Income Fund (CHW) falls into this category. Please see page 5 for a more detailed overview of our closed-end offerings.
We are dedicated to helping our clients build and protect wealth. We understand when you entrust us with your assets, you also entrust us with your achievements, goals and aspirations. We believe we best honor this trust by making investment decisions guided by integrity, by discipline, and by our conscientious research.
We believe that an active, risk-conscious approach is essential for wealth creation. In the 1970s, we pioneered low-volatility equity strategies, which seek to participate in equity market upside and mitigate some of the potential risks of equity market volatility. Our investment process seeks to manage risk at multiple levels and draws upon our experience investing through multiple market cycles.
We have a global perspective. We believe that globalization offers tremendous opportunities for countries and companies all over the world. In our view, this creates significant opportunities for investors. In our U.S., global and international portfolios, we are seeking to capitalize on the potential growth of the global economy.
We believe there are opportunities in all markets. Our history traces back to the 1970s, a period of significant volatility and economic concerns. We have invested through multiple market cycles, each with its own challenges. Out of this experience comes our belief that the flipside of volatility is opportunity.
Letter to Shareholders

JOHN P. CALAMOS, SR.
CEO/Co-CIO
Dear Fellow Shareholder:
Welcome to your semiannual report for the six-month period ended April 30, 2011. I encourage you to review this report carefully. It includes commentary and insights from the investment team, as well as a listing of portfolio holdings, financial data and highlights, and detailed information about the performance and allocation of your fund.
Calamos Global Dynamic Income Fund (CHW) is an enhanced fixed-income fund. We utilize dynamic asset allocation to pursue high current income, while also maintaining a focus on capital gains.
CHW’s enhanced fixed-income approach provided investors with steady monthly distributions, as well as total return.
We are pleased to report that CHW provided a steady stream of monthly distributions. Moreover, on an NAV basis, the fund’s total return surpassed both the global equity market and global fixed income market, as measured by the BofA Merrill Lynch Global Broad Market Index and the MSCI World Index, respectively. On a market price basis, the fund outperformed the global bond index and participated significantly in the gains of the global equity market, as measured by the aforementioned indices. We believe that these results—as well as the fund’s longer-term record—illustrate the benefits of dynamic asset allocation as part of an enhanced fixed-income strategy. In the Q&A beginning on page 6, we discuss the fund’s strategy and performance over the reporting period at greater length.
Steady and Competitive Distributions
CHW’s distribution policy reflects our long-term perspective, focus on consistency, and risk-aware approach. We recognize that many of our investors prefer consistent monthly distributions, instead of unpredictable ones. This fund has a level rate distribution policy, which means we seek to keep distributions the same from month to month. We and the fund’s Board of Directors are committed to providing distributions that we believe can be sustained over the long-term. In setting the fund’s distribution level, we consider the market and economic environment, prevailing interest rates and the opportunities we see in individual securities and asset classes. We discuss the level distribution policy at greater length on pages 5 and 33.
| CALAMOS GLOBAL DYNAMIC INCOME FUND SEMIANNUAL REPORT | 1 |
Letter to Shareholders
Prudent Use of Leverage
In this fund, we have the flexibility to employ leverage to enhance total return and to support the fund’s distribution rate. Leverage involves borrowing money and reinvesting the proceeds. During the reporting period, we believed the economic environment was favorable for the prudent use of leverage. Our use of leverage contributed favorably to overall performance, as we were able to achieve a higher return than our borrowing costs. We intend to continue to utilize leverage judiciously, as long as we believe it will serve the fund’s shareholders well.
As part of our emphasis on risk management, we employed interest rate swaps as a hedge against a potential rise in interest rates. We use these swaps to manage the borrowing costs associated with our leverage activities. Through these swaps, we essentially lock down an interest rate that we believe to be attractive. Currently, interest rates are at historically low levels throughout much of the fixed income market. However, given the current economic landscape, we believe that it is possible that rates could surge very quickly, even over a period of weeks, as was the case in the 1970s and 1980s. We believe the fund’s interest rate swaps could be a valuable tool to help protect the fund from increasing borrowing costs, should rates rise.
The Market and Economic Environment: Resilience Amid Volatility
During the reporting period, unexpected events unsettled the global markets. These included the earthquake and tsunami in Japan, as well as political turmoil and violence in the Middle East and North Africa. Other longer-running concerns persisted, such as the debt burdens of developed nations, commodity prices, inflationary pressures, and evolving geopolitical relationships between established and rising powers.
Yet, on the whole, global markets demonstrated considerable resilience, as market participants seemed to give increased attention to more positive influences. These included robust economic growth in many parts of the world and strong world trade. There were also continued signs of improving economic conditions within the United States. For example, we saw many instances of improving corporate profits and balance sheets, as well as gains in private sector job growth. The credit markets remained open and strong, providing good access to capital for large cap and mid cap companies, in particular.
Global equity markets posted brisk returns for the period, with developed markets outperforming emerging markets on the whole. The MSCI World Index, a measure of developed market performance, gained 15.04% for the six-month period, while emerging markets rose 9.84%, as measured by the MSCI Emerging Markets Index. Equity-sensitive securities also participated in this advance, with the BofA Merrill Lynch Global 300 Convertible Index returning 9.68%. However, returns in the global bond market were more muted, with the BofA Merrill Lynch Global Broad Market Index gaining just 1.50%. As investors sought yield, high-yield securities were generally better rewarded; for example, the Credit Suisse High Yield Index rose 6.01%.
| 2 | CALAMOS GLOBAL DYNAMIC INCOME FUND SEMIANNUAL REPORT |
Letter to Shareholders
Positioned for Global Growth
Globally, we see considerable investment opportunities being driven by long-term secular trends. As we have discussed previously, one of the most important of these trends is the growing prosperity of emerging economies. We believe that progress in emerging markets has exciting ramifications for countries and companies all over the world. These opportunities extend not only to companies that may benefit from infrastructure build-out, in sectors such as energy, materials and industrials, but also to businesses that provide goods and services that help individuals achieve an improved quality of life. We expect rising prosperity in emerging markets to drive demand for a wide variety of goods and services, ranging from cell phones to health care innovations and education.
Other important trends include corporations’ focus on productivity enhancements, which we believe will drive technology spending. We also believe that individuals’ desire to be connected to information, each other and entertainment at all times and price points, creates opportunities for consumer-oriented technologies. We believe secular trends will also drive growth in some areas of health care, as populations in developed markets age.
We Are Finding Opportunities Throughout the Global Markets
CHW’s global enhanced fixed income strategy provides us with broad flexibility to invest in multiple asset classes, including convertible securities, high-yield corporate bonds and equities. Our team continues to find compelling investments in each of these groups. Within the global bond and convertible securities markets, we are seeking credits that offer attractive yields, reliable debt servicing prospects and the opportunity for credit upgrades. In keeping with our risk conscious approach, we are maintaining a highly selective approach to the most speculative credits. Across the portfolio, where possible, we focus on businesses with global footprints, global management and global revenue streams.
We believe there are compelling investment opportunities around the world for investors who put in the time and effort to separate the leaders from the also-rans. For example, as we have discussed in recent interviews with national television networks and publications, we believe the case for U.S. growth equities is strong. On the whole, we feel that valuations are extremely attractive by a number of measures, such as future cash flows and growth assumptions. Our investment criteria have also led us to compelling investments in the global equity markets, including companies based in developed European markets and select emerging markets.
In Closing
We believe that innovation thrives in all market environments. Our investment team continues to find many businesses that are guided by a spirit of creativity and entrepreneurship—companies that we have seen adapt and change as the global economy evolves.
| CALAMOS GLOBAL DYNAMIC INCOME FUND SEMIANNUAL REPORT | 3 |
Letter to Shareholders
While I believe that globalization presents a very exciting backdrop for investors, the opportunity potential does vary considerably from company to company and industry to industry. Because of this, we believe that an active investment approach is particularly important. We believe our decades of experience, our selective, risk-aware approach and our unwavering commitment to our shareholders will continue to differentiate CHW as an enhanced fixed income offering.
If you would like additional information about this fund or our other closed-end offerings, please contact your financial advisor or our client services team at 800.582.6959 (Monday through Friday from 8:00 a.m. to 6:00 p.m., Central Time). We also invite you to visit us at www.calamos.com.
We thank you for your continued trust. It is an honor to partner with you to help you achieve your financial goals.
Sincerely,

John P. Calamos, Sr.
CEO and Co-CIO
Calamos Advisors LLC
CEO and Co-CIO
Calamos Advisors LLC
This report is for informational purposes only and should not be considered investment advice.
| 4 | CALAMOS GLOBAL DYNAMIC INCOME FUND SEMIANNUAL REPORT |
The Calamos Closed-End Funds: An Overview
In our closed-end funds, we draw upon decades of investment experience, including a long history of opportunistically blending asset classes in an attempt to capture upside potential while managing downside risk. We launched our first closed-end fund in 2002.
Closed-end funds are long-term investments. Most focus on providing monthly distributions, but there are important differences among individual closed-end funds. Calamos closed-end funds can be grouped into two broad categories: (1) enhanced fixed income and (2) total return. Funds in both groups provide a monthly distribution stream and invest in a combination of asset classes.
| OBJECTIVE: ENHANCED FIXED INCOME | OBJECTIVE: TOTAL RETURN | |
| Portfolios Positioned to Pursue High Current Income from Income and Capital Gains | Portfolios Positioned to Seek Current Income, with Increased Emphasis on Capital Gains Potential | |
| Calamos Convertible Opportunities and Income Fund (Ticker: CHI) Invests in high-yield and convertible securities, primarily in U.S. markets | Calamos Global Total Return Fund (Ticker: CGO) Invests in equities and higher-yielding convertible securities and corporate bonds, in both U.S. and non-U.S. markets | |
| Calamos Convertible and High Income Fund (Ticker: CHY) Invests in high-yield and convertible securities, primarily in U.S. markets | Calamos Strategic Total Return Fund (Ticker: CSQ) Invests in equities and higher-yielding convertible securities and corporate bonds, primarily in U.S. markets. | |
| Calamos Global Dynamic Income Fund (Ticker: CHW) Invests in global fixed-income securities, alternative investments and equities | ||
Our Level Rate Distribution Policy
Investors often choose a closed-end fund because they seek a steady stream of income. In recognition of this, all five Calamos closed-end funds have adopted a level distribution policy. Our policy is to pay a distribution reflective of the funds’ past results and projected earnings potential through income as well as capital gains. Our team is focused on delivering an attractive monthly distribution, while maintaining a long-term focus on risk management. The level of the funds’ distributions can be greatly influenced by market conditions, including the interest rate environment. The funds’ distributions will depend on the individual performance of positions the funds hold, our view of the benefits of retaining leverage, fund tax considerations, and maintaining regulatory requirements.
For more information about any of these funds, we encourage you to contact your financial advisor or Calamos Investments at 800.582.6959 (Monday through Friday from 8:00 a.m. to 6:00 p.m., Central Time). You can also visit us at www.calamos.com.
For more information on our level rate distribution policy, please see page 33.
| CALAMOS GLOBAL DYNAMIC INCOME FUND SEMIANNUAL REPORT | 5 |
Investment Team Discussion
| TOTAL RETURN* AS OF 4/30/11 | ||||||||||||||
| Common Shares – Inception 6/27/07 | ||||||||||||||
| Since | ||||||||||||||
| 6 Months | 1 Year | Inception** | ||||||||||||
On Market Price | 13.80 | % | 20.29 | % | -2.63 | % | ||||||||
On NAV | 18.22 | % | 25.17 | % | 2.48 | % | ||||||||
*Total return measures net investment income and net realized gain or loss from portfolio investments, and change in net unrealized appreciation and depreciation, assuming reinvestment of income and net realized gains distributions.
**Annualized since inception.
| SECTOR WEIGHTINGS | ||||||
Information Technology | 20.4 | % | ||||
Energy | 14.8 | |||||
Health Care | 11.5 | |||||
Industrials | 10.9 | |||||
Financials | 8.7 | |||||
Consumer Staples | 8.3 | |||||
Consumer Discretionary | 7.8 | |||||
Materials | 7.2 | |||||
Telecommunication Services | 3.4 | |||||
Utilities | 1.3 | |||||
Sector Weightings are based on managed assets and may vary over time. Sector Weightings exclude any government/sovereign bonds or options on broad market indexes the portfolio may hold.
GLOBAL DYNAMIC INCOME FUND
INVESTMENT TEAM DISCUSSION
The Calamos Investment Management Team, led by Co-Chief Investment Officers John P. Calamos, Sr. and Nick P. Calamos, CFA, discusses the fund’s strategy, performance and positioning for the six-month period ended April 30, 2011.
Q. To provide a context for its performance, please discuss the fund’s strategy and role within an asset allocation.
A. Calamos Global Dynamic Income Fund (CHW) is a global enhanced fixed income offering that seeks to provide an attractive monthly distribution, with a secondary objective of capital appreciation. We believe it offers a diversified way to participate in the long-term potential of global markets.
In this portfolio, we are drawing upon our team’s wide-ranging experience in an array of asset classes. We utilize a highly flexible approach and can invest in equities, convertible securities and high yield securities. We also can employ alternative strategies such as convertible arbitrage and covered call writing. In the convertible arbitrage strategy, we invest in convertible securities and short sell the convertibles’ underlying equities to generate income and hedge against risk. Through covered call writing, we seek to generate income by selling (“writing”) options on market indexes.
We believe that this broad mandate enhances our ability to capitalize on market volatility, manage potential downside risks and generate more income versus traditional fixed income funds. The allocation to each asset class and strategy is dynamic, and reflects our view of the economic landscape as well as the potential of individual securities. By combining asset classes and strategies, we believe that we are well positioned to generate income and capital gains. The broader range of security types also provides us with increased opportunities to manage the risk and reward characteristics of the portfolio over full market cycles.
We invest in both U.S. and non-U.S. companies, with at least 40% of assets invested in non-U.S. companies. We emphasize companies we believe offer reliable debt servicing, respectable balance sheets, and sustainable prospects for growth. Regardless of a company’s country of domicile, we favor, where possible, companies with geographically diversified revenue streams and global business strategies.
SINCE INCEPTION MARKET PRICE AND NAV HISTORY THROUGH 4/30/11
| 6 | CALAMOS GLOBAL DYNAMIC INCOME FUND SEMIANNUAL REPORT |
Investment Team Discussion
Q. How did the fund perform over the reporting period?
A. CHW gained 18.22% on a net asset value (NAV) basis for the six-month period ending April 30, 2011, outperforming the global equity market as measured MSCI World Index, up 15.04%, and the global bond market, as measured by the BofA Merrill Lynch Global Broad Market Index, which gained 1.50%. On a market price basis, the fund returned 13.80% for the same period.
Q. How do NAV and market price return differ?
A. Closed-end funds trade on exchanges, where the price of shares may be driven by factors other than the value of the underlying securities. The price of a share in the market is called market value. Market price may be influenced by factors unrelated to the performance of the fund’s holdings.
A fund’s NAV return measures the return of the individual securities in the portfolio, less fund expenses. It also measures how a manager was able to capitalize on market opportunities. Because we believe closed-end funds are best utilized as a long-term holding within asset allocations, we believe that NAV return is the better measure of a fund’s performance.
Q. Please discuss the fund’s distributions during the annual period.
A. As we discussed in the opening letter, we employ a level rate distribution policy within this fund, with the goal of providing shareholders with a consistent distribution stream. The fund provided a steady distribution stream over the period. Monthly distributions were $0.0500 per share, and the fund’s annual distribution rate was 6.63% of market price as of April 30, 2011.
We believe that the fund’s distribution rate and level remained attractive and competitive, as low interest rates limited yield opportunities in much of the marketplace. For example, as of April 30, 2011, the dividend yield of S&P 500 Index stocks averaged 1.8%. Yields also remained low in the U.S. government bond market, with 10-Year Treasurys and 30-Year Treasurys yielding 3.5% and 4.5%, respectively. Moreover, we believe the fund’s distribution rate is particularly compelling in that the fund also captured much of the equity market’s return, demonstrating the potential merits of a total return approach.
Q. The fund is currently trading at a discount to its NAV. Please discuss this discount.
A. At of the close of the reporting period, the fund was trading at a discount of 13.97%. This means that its market share price is 13.97% less than its NAV price. As we have noted in the past, we believe that this may be favorable for long-term investors seeking to purchase shares because investors can buy shares of the portfolio at a price that is lower than the fair value of the portfolio, as measured by its NAV.
Q. What factors influenced performance over the reporting period?
A. As we noted in the overview of the fund’s enhanced fixed income approach, we invest across asset classes and also employ alternative strategies. During the reporting period, the fund benefited from its holdings in U.S. equities, non-U.S. equities, convertible securities and high yield corporate bonds, as well as from our use of convertible arbitrage.
| CALAMOS GLOBAL DYNAMIC INCOME FUND SEMIANNUAL REPORT | 7 |
Investment Team Discussion
Within its U.S. equity allocation, an overweight in the energy sector relative to the S&P 500 Index proved particularly advantageous as the price of oil increased over the period. An underweight to the financials sector also enhanced relative performance. The fund’s underweight reflects our long-standing concerns about the potential risks within much of the sector. For example, we believe unfolding regulation and deleveraging may hinder revenue and profit growth in many banks. In contrast, while the fund’s information technology stake contributed favorably on an absolute basis, our positioning hindered performance relative to the S&P 500 Index. We maintain a high degree of conviction in many information technology stocks. We’ve favored companies that we believe are positioned to benefit from capital spending as companies seek to enhance their productivity. We are also interested in companies that are providing consumers with technologies that help them communicate, innovate and gain access to information. We are finding companies with high-growth characteristics, such as higher cash levels and lower debt levels, at valuations we believe are attractive.
Within the international equity portion of the portfolio, our positioning within information technology provided a significant boost to returns relative to the MSCI EAFE Index. Here, the fund’s semiconductors stake contributed notably. Health care holdings also furthered the fund’s advance, in areas such as health care equipment and pharmaceuticals. In contrast, an underweight position to the materials sector detracted from performance versus the MSCI EAFE Index. Within the sector, we have maintained a close eye on steepening valuations.
The fund’s global high yield bonds and convertible securities gained ground. As market participants pursued yield, this resulted in a narrowing of credit spreads in these markets which drove prices up. This quest for income in many cases led investors to favor the most speculative issues in the market. However, because we take a total return approach that focuses on avoiding downside risk, we took a very selective approach to lower rated issues, particularly those rated CCC. The fund was significantly underweighted in these credits.
Turning to alternative strategies, as convertible markets advanced briskly over the reporting period, the convertible arbitrage portion of the fund participated, benefiting from improved convertible valuations and narrowing credit spreads. During the period, we opted to suspend the use of covered call writing, based on our assessment of volatility in the marketplace (covered call writing is often more profitable during periods of higher volatility) and our view of equity market upside. By writing covered calls, we could have potentially capped our participation in the gains of the fund’s equity holdings that would have been used to cover our call writing activities.
Our use of leverage was also beneficial to the fund’s performance. We were able to borrow at low rates and then invest the proceeds in securities that generated higher returns. As we discussed in the opening letter, we utilized interest rate swaps to lock in an interest rate we believe to be attractive and to provide a hedge against a potential rise in interest rates.
Q. What is your outlook for Calamos Global Dynamic Income Fund?
A. Despite our concerns about some macroeconomic influences, we believe that the global markets offer ample opportunities for this fund’s enhanced fixed income approach, and that the fund’s broad investment universe provides us with important
| 8 | CALAMOS GLOBAL DYNAMIC INCOME FUND SEMIANNUAL REPORT |
Investment Team Discussion
advantages, both in the current low-rate environment as well as in an environment where rates could rise in the U.S., perhaps quite suddenly. Because of its innovative portfolio structure, this fund may be less susceptible to interest rate changes that could result from dollar devaluation or debt burdens, compared to those closed-end funds that rely primarily on U.S. Treasury bonds or municipal securities for yield.
In our view, active, multi-faceted risk management will remain very important. Global economic recovery is underway, but we do not believe that the current environment is one in which “a rising tide will lift all boats.” We do expect continued spikes in volatility, and in this environment, we believe that our ability to utilize a broad range of securities will remain an important differentiator of our enhanced fixed income approach. In this current climate, we also feel that our focus on companies with respectable balance sheets and good prospects for debt servicing remains prudent. Although the most speculative credits may provide incrementally higher income, we believe that a number of them fail to provide a return potential that is commensurate with their potential risks. Additionally, where possible, we maintain an emphasis companies with global strategies and reach, as they may be particularly well positioned for an evolving global economy.
| CALAMOS GLOBAL DYNAMIC INCOME FUND SEMIANNUAL REPORT | 9 |
Schedule of Investments April 30, 2011 (Unaudited)
| PRINCIPAL | ||||||||
| AMOUNT | VALUE | |||||||
CORPORATE BONDS (20.1%) | ||||||||
| Consumer Discretionary (3.6%) | ||||||||
| 556,000 | Cooper Tire & Rubber Company 8.000%, 12/15/19 | $ | 597,005 | |||||
| DISH Network Corp. | ||||||||
| 2,000,000 | 7.125%, 02/01/16 | 2,140,000 | ||||||
| 500,000 | 7.875%, 09/01/19 | 543,750 | ||||||
| 1,000,000 | Exide Technologies* 8.625%, 02/01/18 | 1,077,500 | ||||||
| 1,000,000 | Goodyear Tire & Rubber Company 8.250%, 08/15/20 | 1,116,250 | ||||||
| 2,000,000 | Hanesbrands, Inc.‡ 3.831%, 12/15/14 | 2,010,000 | ||||||
| 2,000,000 | Jarden Corp. 8.000%, 05/01/16 | 2,205,000 | ||||||
| 2,000,000 | Liberty Media Corp. 8.500%, 07/15/29 | 1,970,000 | ||||||
| 1,000,000 | Live Nation Entertainment, Inc.* 8.125%, 05/15/18 | 1,025,000 | ||||||
| 2,000,000 | MGM Resorts International 7.500%, 06/01/16 | 1,950,000 | ||||||
| 1,000,000 | NetFlix, Inc. 8.500%, 11/15/17 | 1,135,000 | ||||||
| 915,000 | Perry Ellis International, Inc. 7.875%, 04/01/19 | 958,462 | ||||||
| 2,210,000 | Royal Caribbean Cruises, Ltd.~ 7.500%, 10/15/27 | 2,215,525 | ||||||
| Service Corp. International | ||||||||
| 1,000,000 | 8.000%, 11/15/21 | 1,110,000 | ||||||
| 1,000,000 | 7.000%, 05/15/19 | 1,067,500 | ||||||
| 1,000,000 | Speedway Motorsports, Inc. 8.750%, 06/01/16 | 1,100,000 | ||||||
| 350,000 | Wynn Las Vegas, LLC 7.750%, 08/15/20 | 384,125 | ||||||
| 22,605,117 | ||||||||
| Consumer Staples (0.5%) | ||||||||
| 333,000 | Constellation Brands, Inc. 8.375%, 12/15/14 | 380,453 | ||||||
| 564,000 | Darling International, Inc.* 8.500%, 12/15/18 | 617,580 | ||||||
| 50,000 | Elizabeth Arden, Inc. 7.375%, 03/15/21 | 52,875 | ||||||
| 2,000,000 | Smithfield Foods, Inc. 7.750%, 07/01/17 | 2,165,000 | ||||||
| 3,215,908 | ||||||||
| Energy (5.0%) | ||||||||
| 634,000 | Basic Energy Services, Inc.* 7.750%, 02/15/19 | 667,285 | ||||||
| 2,000,000 | Berry Petroleum Companyµ 8.250%, 11/01/16 | 2,125,000 | ||||||
| 2,000,000 | Bristow Group, Inc. 7.500%, 09/15/17 | 2,120,000 | ||||||
| 1,500,000 | Calfrac Holdings, LP* 7.500%, 12/01/20 | 1,575,000 | ||||||
| 425,000 | Carrizo Oil & Gas, Inc.* 8.625%, 10/15/18 | 455,812 | ||||||
| 2,000,000 | Chesapeake Energy Corp. 9.500%, 02/15/15 | 2,417,500 | ||||||
| 167,000 | Clayton Williams Energy, Inc.* 7.750%, 04/01/19 | 167,835 | ||||||
| 2,000,000 | Complete Production Services, Inc. 8.000%, 12/15/16 | 2,120,000 | ||||||
| 2,850,000 | Comstock Resources, Inc. 8.375%, 10/15/17 | 3,021,000 | ||||||
| 2,170,000 | Concho Resources, Inc. 8.625%, 10/01/17 | 2,408,700 | ||||||
| 1,000,000 | Frontier Oil Corp. 8.500%, 09/15/16 | 1,090,000 | ||||||
| 500,000 | GulfMark Offshore, Inc. 7.750%, 07/15/14 | 512,500 | ||||||
| 360,000 | Holly Corp. 9.875%, 06/15/17 | 407,700 | ||||||
| 1,470,000 | Hornbeck Offshore Services, Inc.µ 8.000%, 09/01/17 | 1,525,125 | ||||||
| 2,000,000 | Pride International, Inc. 8.500%, 06/15/19 | 2,516,180 | ||||||
| 2,000,000 | SEACOR Holdings, Inc. 7.375%, 10/01/19 | 2,164,960 | ||||||
| 2,000,000 | SESI, LLC 6.875%, 06/01/14 | 2,052,500 | ||||||
| Swift Energy Company | ||||||||
| 1,700,000 | 8.875%, 01/15/20 | 1,870,000 | ||||||
| 515,000 | 7.125%, 06/01/17 | 530,450 | ||||||
| 1,000,000 | Trinidad Drilling, Ltd.* 7.875%, 01/15/19 | 1,065,000 | ||||||
| 30,812,547 | ||||||||
| Financials (0.7%) | ||||||||
| 500,000 | Janus Capital Group, Inc.µ 6.700%, 06/15/17 | 548,125 | ||||||
| Leucadia National Corp.µ | ||||||||
| 1,980,000 | 8.125%, 09/15/15 | 2,207,700 | ||||||
| 400,000 | 7.000%, 08/15/13 | 435,000 | ||||||
| 1,050,000 | OMEGA Healthcare Investors, Inc. 7.500%, 02/15/20 | 1,126,125 | ||||||
| 4,316,950 | ||||||||
| Health Care (2.4%) | ||||||||
| 2,000,000 | Bio-Rad Laboratories, Inc. 8.000%, 09/15/16 | 2,235,000 | ||||||
| 500,000 | Community Health Systems, Inc. 8.875%, 07/15/15 | 512,500 | ||||||
| 2,000,000 | Giant Funding Corp.* 8.250%, 02/01/18 | 2,085,000 | ||||||
| 2,000,000 | HCA, Inc. 9.125%, 11/15/14 | 2,110,000 | ||||||
10 | CALAMOS GLOBAL DYNAMIC INCOME FUND SEMIANNUAL REPORT | See accompanying Notes to Schedule of Investments |
Schedule of Investments April 30, 2011 (Unaudited)
| PRINCIPAL | ||||||||
| AMOUNT | VALUE | |||||||
| HealthSouth Corp. | ||||||||
| 500,000 | 7.750%, 09/15/22 | $ | 533,125 | |||||
| 500,000 | 7.250%, 10/01/18 | 530,000 | ||||||
| Mylan, Inc.* | ||||||||
| 990,000 | 7.625%, 07/15/17 | 1,089,000 | ||||||
| 500,000 | 7.875%, 07/15/20 | 555,000 | ||||||
| 2,000,000 | Talecris Biotherapeutics Holdings Corp.~ 7.750%, 11/15/16 | 2,210,000 | ||||||
| Valeant Pharmaceuticals International, Inc.* | ||||||||
| 1,300,000 | 7.000%, 10/01/20 | 1,283,750 | ||||||
| 800,000 | 7.250%, 07/15/22 | 791,000 | ||||||
| 250,000 | 6.750%, 10/01/17 | 250,000 | ||||||
| 569,000 | Warner Chilcott Company, LLC* 7.750%, 09/15/18 | 602,429 | ||||||
| 14,786,804 | ||||||||
| Industrials (3.2%) | ||||||||
| 1,000,000 | Belden, Inc.µ 7.000%, 03/15/17 | 1,037,500 | ||||||
| 438,000 | Boart Longyear Management Pty., Ltd.* 7.000%, 04/01/21 | 455,520 | ||||||
| 900,000 | Clean Harbors, Inc. 7.625%, 08/15/16 | 967,500 | ||||||
| 2,500,000 | Deluxe Corp. 7.375%, 06/01/15 | 2,603,125 | ||||||
| 688,000 | Dycom Investments, Inc.* 7.125%, 01/15/21 | 714,660 | ||||||
| 2,000,000 | General Cable Corp.µ 7.125%, 04/01/17 | 2,065,000 | ||||||
| 502,000 | Interline Brands, Inc. 7.000%, 11/15/18 | 519,570 | ||||||
| 1,105,000 | Kansas City Southern 13.000%, 12/15/13 | 1,309,425 | ||||||
| 2,000,000 | Manitowoc Company, Inc. 7.125%, 11/01/13 | 2,030,000 | ||||||
| Oshkosh Corp. | ||||||||
| 1,290,000 | 8.500%, 03/01/20 | 1,444,800 | ||||||
| 210,000 | 8.250%, 03/01/17 | 232,838 | ||||||
| 2,000,000 | SPX Corp. 7.625%, 12/15/14 | 2,222,500 | ||||||
| 1,500,000 | Terex Corp. 8.000%, 11/15/17 | 1,593,750 | ||||||
| 680,000 | Triumph Group, Inc. 8.000%, 11/15/17 | 729,300 | ||||||
| 1,675,000 | Tutor Perini Corp.* 7.625%, 11/01/18 | 1,716,875 | ||||||
| 19,642,363 | ||||||||
| Information Technology (2.6%) | ||||||||
| Advanced Micro Devices, Inc. | ||||||||
| 1,000,000 | 7.750%, 08/01/20 | 1,047,500 | ||||||
| 640,000 | 8.125%, 12/15/17 | 680,000 | ||||||
| 2,000,000 | Amkor Technology, Inc. 9.250%, 06/01/16 | 2,110,000 | ||||||
| 400,000 | Equinix, Inc.µ 8.125%, 03/01/18 | 435,000 | ||||||
| 100,000 | Hynix Semiconductor, Inc.* 7.875%, 06/27/17 | 106,380 | ||||||
| 2,500,000 | iGATE Corp.* 9.000%, 05/01/16 | 2,575,000 | ||||||
| 2,500,000 | Jabil Circuit, Inc.µ 8.250%, 03/15/18 | 2,881,250 | ||||||
| 1,000,000 | Lender Processing Services, Inc.µ 8.125%, 07/01/16 | 1,035,000 | ||||||
| 1,340,000 | MEMC Electronic Materials, Inc.* 7.750%, 04/01/19 | 1,398,625 | ||||||
| 1,000,000 | ViaSat, Inc. 8.875%, 09/15/16 | 1,081,250 | ||||||
| 2,500,000 | Xerox Corp. 8.000%, 02/01/27 | 2,542,420 | ||||||
| 15,892,425 | ||||||||
| Materials (0.7%) | ||||||||
| 967,000 | Clearwater Paper Corp.* 7.125%, 11/01/18 | 1,010,515 | ||||||
| 1,000,000 | Southern Copper Corp. 7.500%, 07/27/35 | 1,055,579 | ||||||
| Steel Dynamics, Inc. | ||||||||
| 1,675,000 | 7.750%, 04/15/16µ | 1,800,625 | ||||||
| 325,000 | 7.625%, 03/15/20 | 357,500 | ||||||
| 4,224,219 | ||||||||
| Telecommunication Services (1.3%) | ||||||||
| Frontier Communications Corp. | ||||||||
| 2,000,000 | 9.000%, 08/15/31 | 2,070,000 | ||||||
| 500,000 | 8.250%, 04/15/17 | 544,375 | ||||||
| 1,500,000 | MetroPCS Wireless, Inc. 7.875%, 09/01/18 | 1,623,750 | ||||||
| 2,000,000 | Qwest Communications International, Inc.~ 7.750%, 02/15/31 | 2,145,000 | ||||||
| 2,000,000 | Windstream Corp.* 7.500%, 04/01/23 | 2,040,000 | ||||||
| 8,423,125 | ||||||||
| Utilities (0.1%) | ||||||||
| 1,000,000 | Edison Mission Energy 7.750%, 06/15/16 | 865,000 | ||||||
| TOTAL CORPORATE BONDS (Cost $115,773,814) | 124,784,458 | |||||||
CONVERTIBLE BONDS (19.0%) | ||||||||
| Consumer Discretionary (1.7%) | ||||||||
| 1,000,000 | Coinstar, Inc. 4.000%, 09/01/14 | 1,537,500 | ||||||
| 6,000,000 | HKD | Hengdeli Holdings, Ltd. 2.500%, 10/20/15 | 946,356 | |||||
| 6,000,000 | Interpublic Group of Companies, Inc.µ 4.250%, 03/15/23 | 6,780,000 | ||||||
| See accompanying Notes to Schedule of Investments | CALAMOS GLOBAL DYNAMIC INCOME FUND SEMIANNUAL REPORT | 11 |
Schedule of Investments April 30, 2011 (Unaudited)
| PRINCIPAL | ||||||||
| AMOUNT | VALUE | |||||||
| 1,750,000 | Liberty Media Corp. (Viacom, CBS Corp. - Class B)§ 3.250%, 03/15/31 | $ | 1,478,750 | |||||
| 10,742,606 | ||||||||
| Consumer Staples (0.3%) | ||||||||
| 1,500,000 | Smithfield Foods, Inc. 4.000%, 06/30/13 | 1,878,750 | ||||||
| Energy (2.1%) | ||||||||
| 2,000,000 | Chesapeake Energy Corp. 2.750%, 11/15/35 | 2,340,000 | ||||||
| 1,000,000 | James River Coal Company* 4.500%, 12/01/15 | 1,217,500 | ||||||
| 1,000,000 | Newpark Resources, Inc. 4.000%, 10/01/17 | 1,133,750 | ||||||
| 1,300,000 | Petrominerales, Ltd. 2.625%, 08/25/16 | 1,723,800 | ||||||
| 3,100,000 | Subsea 7, SA 2.250%, 10/11/13 | 3,875,274 | ||||||
| 1,950,000 | EUR | Technip, SA 0.500%, 01/01/16 | 2,774,804 | |||||
| 13,065,128 | ||||||||
| Financials (1.6%) | ||||||||
| 1,300,000 | GBP | Aberdeen Asset Management, PLC 3.500%, 12/17/14 | 2,825,971 | |||||
| 4,000,000 | Affiliated Managers Group, Inc. 3.950%, 08/15/38 | 4,655,000 | ||||||
| 2,000,000 | PHH Corp. 4.000%, 09/01/14 | 2,227,500 | ||||||
| 9,708,471 | ||||||||
| Health Care (3.8%) | ||||||||
| 3,000,000 | Cephalon, Inc. 2.500%, 05/01/14 | 3,645,000 | ||||||
| 2,000,000 | Charles River Laboratories International, Inc. 2.250%, 06/15/13 | 2,170,000 | ||||||
| 3,000,000 | Cubist Pharmaceuticals, Inc. 2.500%, 11/01/17 | 4,020,000 | ||||||
| 3,000,000 | Kinetic Concepts, Inc.* 3.250%, 04/15/15 | 3,937,500 | ||||||
| 2,000,000 | LifePoint Hospitals, Inc. 3.500%, 05/15/14 | 2,165,000 | ||||||
| 6,500,000 | Shire, PLCµ 2.750%, 05/09/14 | 7,571,282 | ||||||
| 23,508,782 | ||||||||
| Industrials (0.6%) | ||||||||
| 600,000 | Altra Holdings, Inc.* 2.750%, 03/01/31 | 681,750 | ||||||
| 1,800,000 | EUR | MTU Aero Engines Holdings, AGµ 2.750%, 02/01/12 | 2,985,517 | |||||
| 3,667,267 | ||||||||
| Information Technology (5.5%) | ||||||||
| 3,550,000 | GBP | Autonomy Corp., PLC 3.250%, 03/04/15 | 6,709,532 | |||||
| 2,850,000 | EUR | Cap Gemini, SA 1.000%, 01/01/12 | 1,903,805 | |||||
| 2,000,000 | Ciena Corp. 0.875%, 06/15/17 | 1,985,000 | ||||||
| 2,000,000 | Equinix, Inc. 3.000%, 10/15/14 | 2,265,000 | ||||||
| 2,000,000 | Hynix Semiconductor, Inc. 2.650%, 05/14/15 | 2,450,360 | ||||||
| 5,500,000 | Intel Corp.µ 2.950%, 12/15/35 | 5,891,875 | ||||||
| 2,000,000 | Mentor Graphics Corp.* 4.000%, 04/01/31 | 2,082,500 | ||||||
| 1,650,000 | Micron Technology, Inc. 1.875%, 06/01/27 | 1,977,938 | ||||||
| 1,900,000 | EUR | Nexans, SA 1.500%, 01/01/13 | 2,497,475 | |||||
| 300,000 | Photronics, Inc.* 3.250%, 04/01/16 | 344,625 | ||||||
| 1,000,000 | Quantum Corp.* 3.500%, 11/15/15 | 1,070,000 | ||||||
| 1,000,000 | RF Micro Devices, Inc. 1.000%, 04/15/14 | 1,106,250 | ||||||
| 2,790,000 | Xilinx, Inc.* 2.625%, 06/15/17 | 3,630,487 | ||||||
| 33,914,847 | ||||||||
| Materials (3.0%) | ||||||||
| 1,200,000 | Anglo American, PLC* 4.000%, 05/07/14 | 2,366,585 | ||||||
| 1,500,000 | AngloGold Ashanti, Ltd. 3.500%, 05/22/14 | 1,891,873 | ||||||
| 5,450,000 | Goldcorp, Inc.µ 2.000%, 08/01/14 | 7,289,375 | ||||||
| 2,000,000 | Jaguar Mining, Inc.* 5.500%, 03/31/16 | 2,112,500 | ||||||
| 1,500,000 | Kinross Gold Corp. 1.750%, 03/15/28 | 1,511,250 | ||||||
| 1,000,000 | Owens-Brockway Glass Container, Inc.* 3.000%, 06/01/15 | 1,011,250 | ||||||
| 1,760,000 | Sino-Forest Corp.*µ 4.250%, 12/15/16 | 2,422,200 | ||||||
| 18,605,033 | ||||||||
| Utilities (0.4%) | ||||||||
| 1,700,000 | EUR | International Power, PLC 3.250%, 07/20/13 | 2,699,622 | |||||
| TOTAL CONVERTIBLE BONDS (Cost $107,382,041) | 117,790,506 | |||||||
12 | CALAMOS GLOBAL DYNAMIC INCOME FUND SEMIANNUAL REPORT | See accompanying Notes to Schedule of Investments |
Schedule of Investments April 30, 2011 (Unaudited)
| PRINCIPAL | ||||||||
| AMOUNT | VALUE | |||||||
U.S. GOVERNMENT AND AGENCY SECURITIES (0.9%) | ||||||||
| United States Treasury Note~ | ||||||||
| 3,750,000 | 1.000%, 03/31/12 | $ | 3,776,389 | |||||
| 1,500,000 | 0.875%, 01/31/12 | 1,507,911 | ||||||
| TOTAL U.S. GOVERNMENT AND AGENCY SECURITIES (Cost $5,282,894) | 5,284,300 | |||||||
SOVEREIGN BONDS (0.7%) | ||||||||
| 350,000 | BRL | Federal Republic of Brazil 10.000%, 01/01/12 | 2,261,456 | |||||
| 2,500,000 | NZD | Government of New Zealand 6.000%, 04/15/15 | 2,147,903 | |||||
| TOTAL SOVEREIGN BONDS (Cost $3,926,131) | 4,409,359 | |||||||
| NUMBER OF | ||||||||
| SHARES | VALUE | |||||||
CONVERTIBLE PREFERRED STOCKS (4.4%) | ||||||||
| Consumer Discretionary (0.2%) | ||||||||
| 8,573 | Stanley Black & Decker, Inc. 4.750% | 1,011,185 | ||||||
| Consumer Staples (1.0%) | ||||||||
| 101,000 | Archer-Daniels-Midland Company 6.250% | 4,728,820 | ||||||
| 16,750 | Bunge, Ltd. 4.875% | 1,788,063 | ||||||
| 6,516,883 | ||||||||
| Energy (0.9%) | ||||||||
| 80,000 | Apache Corp. 6.000% | 5,630,400 | ||||||
| Financials (1.4%) | ||||||||
| 65,000 | Affiliated Managers Group, Inc.µ 5.150% | 2,904,687 | ||||||
| 2,800 | Bank of America Corp.µ 7.250% | 2,923,200 | ||||||
| 13,600 | MetLife, Inc. 5.000% | 1,190,544 | ||||||
| 1,600 | Wells Fargo & Companyµ 7.500% | 1,727,168 | ||||||
| 8,745,599 | ||||||||
| Materials (0.6%) | ||||||||
| 37,800 | Vale, SA 6.750% | 3,527,118 | ||||||
| Utilities (0.3%) | ||||||||
| 32,000 | NextEra Energy, Inc. 7.000% | 1,660,800 | ||||||
| TOTAL CONVERTIBLE PREFERRED STOCKS (Cost $22,765,908) | 27,091,985 | |||||||
| NUMBER OF | ||||||||
| UNITS | VALUE | |||||||
STRUCTURED EQUITY-LINKED SECURITIES (2.0%)+* | ||||||||
| Energy (1.4%) | ||||||||
| 175,069 | Barclays Capital, Inc. (Nabors Industries, Ltd.) 12.000%, 06/04/11 | 4,411,739 | ||||||
| 125,000 | Deutsche Bank, AG (Chesapeake Energy Corp.)† 8.000%, 01/24/11 | 4,125,000 | ||||||
| 8,536,739 | ||||||||
| Materials (0.6%) | ||||||||
| 73,000 | Credit Suisse Group (Barrick Gold Corp.) 11.000%, 05/24/11 | 3,717,160 | ||||||
| TOTAL STRUCTURED EQUITY-LINKED SECURITIES (Cost $11,704,181) | 12,253,899 | |||||||
| NUMBER OF | ||||||||
| SHARES | VALUE | |||||||
COMMON STOCKS (82.3%) | ||||||||
| Consumer Discretionary (5.2%) | ||||||||
| 28,650 | Amazon.com, Inc.µ# | 5,629,725 | ||||||
| 130,000 | JPY | ASICS Corp. | 1,880,034 | |||||
| 38,500 | Carnival Corp.µ | 1,465,695 | ||||||
| 30,000 | CBS Corp.µ | 756,600 | ||||||
| 400,000 | AUD | Harvey Norman Holdings, Ltd.µ | 1,178,403 | |||||
| 39,000 | JPY | Makita Corp.µ | 1,793,253 | |||||
| 72,000 | News Corp. - Class Bµ | 1,360,800 | ||||||
| 140,000 | JPY | Nikon Corp.µ | 2,934,065 | |||||
| 83,000 | JPY | Panasonic Corp.µ | 1,020,597 | |||||
| 9,000 | EUR | Porsche Automobil Holding, SEµ | 650,551 | |||||
| 110,000 | JPY | Suzuki Motor Corp.µ | 2,618,753 | |||||
| 85,000 | CHF | Swatch Group, AG | 7,550,480 | |||||
| 8,000 | Target Corp.µ | 392,800 | ||||||
| 31,000 | JPY | Toyota Motor Corp.µ | 1,236,626 | |||||
| 46,800 | Walt Disney Companyµ | 2,017,080 | ||||||
| 32,485,462 | ||||||||
| Consumer Staples (9.2%) | ||||||||
| 53,000 | EUR | Anheuser-Busch InBev, NV | 3,382,351 | |||||
| 96,000 | JPY | Asahi Breweries, Ltd.µ | 1,803,443 | |||||
| 40,000 | Avon Products, Inc.µ | 1,175,200 | ||||||
| 53,000 | EUR | Beiersdorf, AGµ | 3,451,687 | |||||
| 74,000 | Coca-Cola Companyµ | 4,992,040 | ||||||
| 107,000 | BRL | Companhia de Bebidas das Americas | 3,407,513 | |||||
| 106,500 | EUR | Danone, SA | 7,797,536 | |||||
| 160 | JPY | Japan Tobacco, Inc.µ | 621,808 | |||||
| 12,000 | Kimberly-Clark Corp.µ | 792,720 | ||||||
| 225,000 | CHF | Nestlé, SA | 13,965,388 | |||||
| 23,000 | PepsiCo, Inc.µ | 1,584,470 | ||||||
| 45,000 | Procter & Gamble Companyµ | 2,920,500 | ||||||
| See accompanying Notes to Schedule of Investments | CALAMOS GLOBAL DYNAMIC INCOME FUND SEMIANNUAL REPORT | 13 |
Schedule of Investments April 30, 2011 (Unaudited)
| NUMBER OF | ||||||||
| SHARES | VALUE | |||||||
| 52,000 | GBP | Reckitt Benckiser Group, PLCµ | $ | 2,893,649 | ||||
| 30,750 | Sysco Corp.µ | 888,982 | ||||||
| 53,000 | GBP | Unilever, PLCµ | 1,721,781 | |||||
| 1,140,000 | MXN | Wal-Mart de Mexico, SAB de CV | 3,565,069 | |||||
| 42,000 | Wal-Mart Stores, Inc.µ | 2,309,160 | ||||||
| 57,273,297 | ||||||||
| Energy (10.3%) | ||||||||
| 10,000 | Apache Corp.µ | 1,333,700 | ||||||
| 875,000 | GBP | BP, PLCµ | 6,726,369 | |||||
| 26,000 | Chevron Corp.µ | 2,845,440 | ||||||
| 1,600,000 | HKD | CNOOC, Ltd. | 3,976,923 | |||||
| 40,000 | ConocoPhillipsµ | 3,157,200 | ||||||
| 23,500 | Devon Energy Corp.µ | 2,138,500 | ||||||
| 95,000 | EUR | ENI S.p.A.µ | 2,543,496 | |||||
| 180,000 | CAD | Ensign Energy Services, Inc. | 3,475,770 | |||||
| 82,500 | Exxon Mobil Corp.µ | 7,260,000 | ||||||
| 46,500 | Halliburton Companyµ | 2,347,320 | ||||||
| 31,000 | Marathon Oil Corp.µ | 1,675,240 | ||||||
| 24,000 | Noble Corp. | 1,032,240 | ||||||
| 15,000 | Occidental Petroleum Corp.µ | 1,714,350 | ||||||
| 2,350,000 | HKD | PetroChina Company, Ltd. - Class H | 3,411,260 | |||||
| 57,500 | NOK | Petroleum Geo-Services ASAµ# | 909,660 | |||||
| 82,300 | GBP | Royal Dutch Shell, PLCµ | 3,205,724 | |||||
| 22,000 | Schlumberger, Ltd. | 1,974,500 | ||||||
| 118,000 | CAD | Suncor Energy, Inc. | 5,438,863 | |||||
| 34,000 | EUR | Technip, SA | 3,836,222 | |||||
| 74,000 | EUR | TOTAL, SA | 4,739,063 | |||||
| 63,741,840 | ||||||||
| Financials (8.1%) | ||||||||
| 27,500 | Aflac, Inc.µ | 1,545,225 | ||||||
| 4,000 | American International Group, Inc.µ# | 124,600 | ||||||
| 95,000 | AUD | ASX, Ltd.µ | 3,350,192 | |||||
| 135,000 | EUR | Banco Santander, SAµ | 1,724,014 | |||||
| 105,000 | Bank of America Corp.µ | 1,289,400 | ||||||
| 41,000 | Bank of New York Mellon Corp.µ | 1,187,360 | ||||||
| 18,700 | EUR | BNP Paribas, SAµ | 1,478,319 | |||||
| 189,615 | Citigroup, Inc.µ# | 870,333 | ||||||
| 29,000 | EUR | Deutsche Börse, AGµ | 2,407,545 | |||||
| 12,000 | Franklin Resources, Inc.µ | 1,549,440 | ||||||
| 8,500 | Goldman Sachs Group, Inc.µ | 1,283,585 | ||||||
| 19,000 | Hartford Financial Services Group, Inc.µ | 550,430 | ||||||
| 100,000 | HKD | Hong Kong Exchanges and Clearing, Ltd. | 2,286,807 | |||||
| 77,500 | JPMorgan Chase & Companyµ | 3,536,325 | ||||||
| 80,000 | CHF | Julius Baer Group, Ltd.µ# | 3,743,821 | |||||
| 99,000 | Manulife Financial Corp.µ | 1,779,030 | ||||||
| 16,000 | MetLife, Inc.µ | 748,640 | ||||||
| 98,000 | CAD | Power Financial Corp.µ | 3,259,589 | |||||
| 8,500 | Prudential Financial, Inc.µ | 539,070 | ||||||
| 238,500 | GBP | Schroders, PLCµ | 7,577,611 | |||||
| 140,000 | GBP | Standard Chartered, PLC | 3,890,863 | |||||
| 23,500 | T. Rowe Price Group, Inc.µ | 1,509,875 | ||||||
| 14,000 | Travelers Companies, Inc.µ | 885,920 | ||||||
| 37,250 | Wells Fargo & Companyµ | 1,084,347 | ||||||
| 8,300 | CHF | Zurich Financial Services, AGµ# | 2,333,783 | |||||
| 50,536,124 | ||||||||
| Health Care (10.4%) | ||||||||
| 15,000 | Abbott Laboratoriesµ | 780,600 | ||||||
| 83,000 | Bristol-Myers Squibb Companyµ | 2,332,300 | ||||||
| 29,000 | AUD | Cochlear, Ltd. | 2,563,926 | |||||
| 23,000 | DKK | Coloplast, A/S - Class B | 3,383,203 | |||||
| 65,000 | Covidien, PLC | 3,619,850 | ||||||
| 150,000 | AUD | CSL, Ltd.µ | 5,660,326 | |||||
| 88,000 | SEK | Elekta, AB - Class Bµ | 4,016,131 | |||||
| 34,250 | Eli Lilly and Companyµ | 1,267,593 | ||||||
| 80,000 | Johnson & Johnsonµ | 5,257,600 | ||||||
| 42,000 | Medtronic, Inc.µ | 1,753,500 | ||||||
| 144,533 | Merck & Company, Inc.µ | 5,195,961 | ||||||
| 79,600 | DKK | Novo Nordisk, A/S - Class B | 10,076,830 | |||||
| 98,000 | JPY | OLYMPUS Corp.µ | 2,773,688 | |||||
| 190,000 | Pfizer, Inc.µ | 3,982,400 | ||||||
| 25,000 | CHF | Roche Holding, AGµ | 4,057,998 | |||||
| 140,000 | GBP | Shire, PLC | 4,344,556 | |||||
| 18,500 | Stryker Corp.µ | 1,091,500 | ||||||
| 42,000 | UnitedHealth Group, Inc.µ | 2,067,660 | ||||||
| 64,225,622 | ||||||||
| Industrials (10.7%) | ||||||||
| 27,000 | 3M Companyµ | 2,624,670 | ||||||
| 270,000 | CHF | ABB, Ltd.µ# | 7,456,128 | |||||
| 54,000 | EUR | ALSTOMµ | 3,590,334 | |||||
| 610,000 | GBP | BAE Systems, PLCµ | 3,348,480 | |||||
| 28,000 | Boeing Companyµ | 2,233,840 | ||||||
| 35,000 | EUR | Bouygues, SAµ | 1,741,789 | |||||
| 14,000 | Danaher Corp.µ | 773,360 | ||||||
| 20,000 | Eaton Corp.µ | 1,070,600 | ||||||
| 14,500 | General Dynamics Corp.µ | 1,055,890 | ||||||
| 242,500 | General Electric Companyµ | 4,959,125 | ||||||
| 60,000 | Honeywell International, Inc.µ | 3,673,800 | ||||||
| 25,000 | Illinois Tool Works, Inc.µ | 1,460,250 | ||||||
| 75,000 | JPY | Komatsu, Ltd. | 2,644,455 | |||||
| 44,000 | EUR | Konecranes OYJµ | 2,116,773 | |||||
| 47,000 | EUR | Krones AGµ# | 3,802,492 | |||||
| 10,000 | Lockheed Martin Corp.µ | 792,500 | ||||||
| 30,000 | EUR | MAN, AGµ# | 4,179,421 | |||||
| 44,000 | EUR | MTU Aero Engines Holdings, AGµ# | 3,368,276 | |||||
14 | CALAMOS GLOBAL DYNAMIC INCOME FUND SEMIANNUAL REPORT | See accompanying Notes to Schedule of Investments |
Schedule of Investments April 30, 2011 (Unaudited)
| NUMBER OF | ||||||||
| SHARES | VALUE | |||||||
| 14,000 | EUR | Nexans, SAµ | $ | 1,483,768 | ||||
| 10,000 | Raytheon Companyµ | 485,500 | ||||||
| 40,000 | EUR | Royal Philips Electronics, NVµ | 1,184,721 | |||||
| 63,500 | EUR | Siemens, AG | 9,236,633 | |||||
| 32,000 | United Technologies Corp.µ | 2,866,560 | ||||||
| 66,149,365 | ||||||||
| Information Technology (19.6%) | ||||||||
| 72,000 | Accenture, PLC - Class A | 4,113,360 | ||||||
| 22,200 | Apple, Inc.µ# | 7,730,706 | ||||||
| 105,000 | Applied Materials, Inc. | 1,647,450 | ||||||
| 1,350,000 | GBP | ARM Holdings, PLC | 13,992,103 | |||||
| 90,000 | EUR | ASML Holding, NV | 3,751,387 | |||||
| 260,000 | GBP | Autonomy Corp., PLCµ# | 7,017,007 | |||||
| 60,000 | JPY | Canon, Inc.µ | 2,825,553 | |||||
| 29,500 | EUR | Cap Gemini, SAµ | 1,786,843 | |||||
| 37,000 | Check Point Software Technologies, Ltd.# | 2,032,410 | ||||||
| 145,000 | Cisco Systems, Inc.µ | 2,546,200 | ||||||
| 132,500 | Dell, Inc.µ# | 2,055,075 | ||||||
| 130,000 | eBay, Inc.µ# | 4,472,000 | ||||||
| 65,000 | EMC Corp.µ# | 1,842,100 | ||||||
| 6,250 | Google, Inc.µ# | 3,400,625 | ||||||
| 115,762 | TWD | HTC Corp. | 5,269,102 | |||||
| 185,000 | Intel Corp.µ | 4,290,150 | ||||||
| 15,000 | International Business Machines Corp.µ | 2,558,700 | ||||||
| 113,000 | JPY | Konami Corp.µ | 2,252,184 | |||||
| 285,000 | SEK | LM Ericsson Telephone Companyµ | 4,324,454 | |||||
| 85,000 | CHF | Logitech International, SAµ# | 1,178,765 | |||||
| 190,000 | Microsoft Corp.µ | 4,943,800 | ||||||
| 5,625 | Motorola Mobility Holdings, Inc.# | 146,588 | ||||||
| 6,428 | Motorola Solutions, Inc.# | 294,917 | ||||||
| 23,000 | JPY | Murata Manufacturing Company, Ltd. | 1,661,160 | |||||
| 20,400 | JPY | Nintendo Company, Ltd.µ | 4,826,929 | |||||
| 580,000 | EUR | NOKia, OYJ | 5,343,189 | |||||
| 92,000 | JPY | Nomura Research Institute, Ltd.µ | 1,977,799 | |||||
| 75,000 | Oracle Corp.µ | 2,703,750 | ||||||
| 51,893 | QUALCOMM, Inc.µ | 2,949,598 | ||||||
| 5,560 | KRW | Samsung Electronics Company, Ltd.µ | 4,644,161 | |||||
| 110,000 | EUR | SAP, AG | 7,087,303 | |||||
| 14,300 | EUR | Software, AG | 2,706,519 | |||||
| 75,000 | Symantec Corp.µ# | 1,473,750 | ||||||
| 635,000 | TWD | Taiwan Semiconductor Manufacturing Company, Ltd. | 1,642,419 | |||||
| 121,488,056 | ||||||||
| Materials (4.9%) | ||||||||
| 64,000 | GBP | Anglo American, PLCµ | 3,354,819 | |||||
| 124,000 | CAD | Barrick Gold Corp. | 6,332,695 | |||||
| 20,500 | EUR | BASF, SEµ | 2,105,021 | |||||
| 41,000 | Dow Chemical Companyµ | 1,680,590 | ||||||
| 36,000 | E.I. du Pont de Nemours and Companyµ | 2,044,440 | ||||||
| 135,000 | CAD | Goldcorp, Inc. | 7,546,531 | |||||
| 30,000 | GBP | Rio Tinto, PLCµ | 2,188,959 | |||||
| 15,000 | CHF | Syngenta, AG | 5,304,860 | |||||
| 30,557,915 | ||||||||
| Telecommunication Services (3.1%) | ||||||||
| 93,500 | América Móvil, SAB de CVµ | 5,348,200 | ||||||
| 145,000 | AT&T, Inc.µ | 4,512,400 | ||||||
| 96,000 | EUR | France Telecom, SAµ | 2,249,698 | |||||
| 5,520 | Frontier Communications Corp. | 45,651 | ||||||
| 23,000 | Verizon Communications, Inc.µ | 868,940 | ||||||
| 2,157,000 | GBP | Vodafone Group, PLC | 6,235,461 | |||||
| 19,260,350 | ||||||||
| Utilities (0.8%) | ||||||||
| 47,500 | Duke Energy Corp.µ | 885,875 | ||||||
| 10,500 | Exelon Corp.µ | 442,575 | ||||||
| 45,801 | EUR | GDF Suezµ | 1,872,770 | |||||
| 29,000 | EUR | RWE, AG | 1,891,898 | |||||
| 5,093,118 | ||||||||
| TOTAL COMMON STOCKS (Cost $560,353,248) | 510,811,149 | |||||||
| NUMBER OF | ||||||||
| CONTRACTS | VALUE | |||||||
PURCHASED OPTIONS (0.0%)# | ||||||||
| Consumer Discretionary (0.0%) | ||||||||
| 55 | Amazon.com, Inc. Call, 01/19/13, Strike $180.00 | 230,862 | ||||||
| Energy (0.0%) | ||||||||
| 85 | James River Coal Company Put, 06/18/11, Strike $12.50 | 425 | ||||||
| Materials (0.0%) | ||||||||
| 550 | Jaguar Mining, Inc. Put, 06/18/11, Strike $4.00 | 4,125 | ||||||
| TOTAL PURCHASED OPTIONS (Cost $237,667) | 235,412 | |||||||
| See accompanying Notes to Schedule of Investments | CALAMOS GLOBAL DYNAMIC INCOME FUND SEMIANNUAL REPORT | 15 |
Schedule of Investments April 30, 2011 (Unaudited)
| NUMBER OF | ||||||||
| SHARES | VALUE | |||||||
SHORT TERM INVESTMENT (3.3%) | ||||||||
| 20,775,894 | Fidelity Prime Money Market Fund - Institutional Class (Cost $20,775,894) | $ | 20,775,894 | |||||
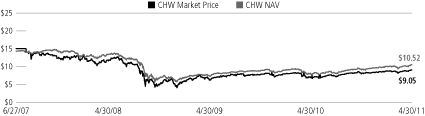
TOTAL INVESTMENTS (132.7%) (Cost $848,201,778) | 823,436,962 | |||||||
| LIABILITIES, LESS OTHER ASSETS (-32.7%) | (202,878,691 | ) | ||||||
NET ASSETS APPLICABLE TO COMMON SHAREHOLDERS (100.0%) | $ | 620,558,271 | ||||||
| NUMBER OF | ||||||||
| SHARES | VALUE | |||||||
COMMON STOCKS SOLD SHORT (-3.6%)# | ||||||||
| Consumer Discretionary (-0.5%) | ||||||||
| (13,800 | ) | Coinstar, Inc. | (744,924 | ) | ||||
| (220,600 | ) | Interpublic Group of Companies, Inc. | (2,592,050 | ) | ||||
| (3,336,974 | ) | |||||||
| Consumer Staples (-0.2%) | ||||||||
| (42,900 | ) | Smithfield Foods, Inc. | (1,010,724 | ) | ||||
| Energy (-0.2%) | ||||||||
| (25,000 | ) | James River Coal Company | (583,000 | ) | ||||
| (55,000 | ) | Newpark Resources, Inc. | (496,650 | ) | ||||
| (1,079,650 | ) | |||||||
| Financials (-0.4%) | ||||||||
| (11,800 | ) | Affiliated Managers Group, Inc. | (1,287,144 | ) | ||||
| (50,000 | ) | PHH Corp. | (1,073,000 | ) | ||||
| (2,360,144 | ) | |||||||
| Health Care (-1.3%) | ||||||||
| (21,000 | ) | Cephalon, Inc. | (1,612,800 | ) | ||||
| (20,500 | ) | Charles River Laboratories International, Inc. | (864,895 | ) | ||||
| (87,200 | ) | Cubist Pharmaceuticals, Inc. | (2,951,720 | ) | ||||
| (35,800 | ) | Kinetic Concepts, Inc. | (2,113,274 | ) | ||||
| (19,300 | ) | LifePoint Hospitals, Inc. | (803,073 | ) | ||||
| (8,345,762 | ) | |||||||
| Industrials (-0.1%) | ||||||||
| (16,175 | ) | Altra Holdings, Inc. | (410,683 | ) | ||||
| Information Technology (-0.7%) | ||||||||
| (29,000 | ) | Ciena Corp. | (818,960 | ) | ||||
| (6,000 | ) | Equinix, Inc. | (603,960 | ) | ||||
| (53,000 | ) | Mentor Graphics Corp. | (781,750 | ) | ||||
| (107,000 | ) | Micron Technology, Inc. | (1,208,030 | ) | ||||
| (16,520 | ) | Photronics, Inc. | (144,220 | ) | ||||
| (164,000 | ) | Quantum Corp. | (521,520 | ) | ||||
| (75,000 | ) | RF Micro Devices, Inc. | (499,500 | ) | ||||
| (4,577,940 | ) | |||||||
| Materials (-0.2%) | ||||||||
| (187,000 | ) | Jaguar Mining, Inc. | (1,045,330 | ) | ||||
| (10,500 | ) | Kinross Gold Corp. | (166,320 | ) | ||||
| (9,500 | ) | Owens-Illinois, Inc. | (281,865 | ) | ||||
| (1,493,515 | ) | |||||||
| TOTAL COMMON STOCKS SOLD SHORT (Proceeds $18,947,851) | (22,615,392 | ) | ||||||
| NUMBER OF | ||||||||
| CONTRACTS | VALUE | |||||||
WRITTEN OPTIONS (0.0%)# | ||||||||
| Consumer Discretionary (0.0%) | ||||||||
| 50 | Coinstar, Inc. Call, 07/16/11, Strike $47.50 (Premium $13,098) | (40,250 | ) | |||||
NOTES TO SCHEDULE OF INVESTMENTS
| * | Securities issued and sold pursuant to a Rule 144A transaction are excepted from the registration requirement of the Securities Act of 1933, as amended. These securities may only be sold to qualified institutional buyers (“QIBs”), such as the fund. Any resale of these securities must generally be effected through a sale that is registered under the Act or otherwise exempted from such registration requirements. At April 30, 2011, the value of 144A securities that could not be exchanged to the registered form is $34,178,946 or 5.5% of net assets applicable to common shareholders. | |
| ‡ | Variable rate or step bond security. The rate shown is the rate in effect at April 30, 2011. | |
| ~ | Security, or portion of security, is segregated as collateral (or potential collateral for future transactions) for written options, swaps, or securities sold short. The aggregate value of such securities aggregate a total value of $11,251,255. | |
| µ | Security, or portion of security, is held in a segregated account as collateral for note payable aggregating a total value of $373,649,980. | |
| § | Securities exchangeable or convertible into securities of one or more entities that are different than the issuer. Each entity is identified in the parenthetical. | |
| + | Structured equity-linked securities are designed to simulate the characteristics of the equity security in the parenthetical. | |
| † | Security or a portion of the security purchased on a delayed delivery or when-issued basis. | |
| # | Non-income producing security. |
| 16 | CALAMOS GLOBAL DYNAMIC INCOME FUND SEMIANNUAL REPORT | See accompanying Notes to Financial Statements |
Schedule of Investments April 30, 2011 (Unaudited)
FOREIGN CURRENCY ABBREVIATIONS
| AUD | Australian Dollar | JPY | Japanese Yen | |||
| BRL | Brazilian Real | KRW | South Korean Won | |||
| CAD | Canadian Dollar | MXN | Mexican Peso | |||
| CHF | Swiss Franc | NOK | Norwegian Krone | |||
| DKK | Danish Krone | NZD | New Zealand Dollar | |||
| EUR | European Monetary Unit | SEK | Swedish Krona | |||
| GBP | British Pound Sterling | TWD | New Taiwanese Dollar | |||
| HKD | Hong Kong Dollar |
Note: Value for securities denominated in foreign currencies is shown in U.S. dollars. The principal amount for such securities is shown in the respective foreign currency. The date on options represents the expiration date of the option contract. The option contract may be exercised at any date on or before the date shown.
CURRENCY EXPOSURE
APRIL 30, 2011 (UNAUDITED)
APRIL 30, 2011 (UNAUDITED)
| % OF TOTAL | ||||||||
| VALUE | INVESTMENTS | |||||||
| US Dollar | $ | 446,840,481 | 55.8% | |||||
| European Monetary Unit | 104,370,842 | 13.0% | ||||||
| British Pound Sterling | 76,032,885 | 9.5% | ||||||
| Swiss Franc | 45,591,223 | 5.7% | ||||||
| Japanese Yen | 32,870,347 | 4.1% | ||||||
| Canadian Dollar | 26,053,448 | 3.3% | ||||||
| Danish Krone | 13,460,033 | 1.7% | ||||||
| Australian Dollar | 12,752,847 | 1.6% | ||||||
| Hong Kong Dollar | 10,621,346 | 1.3% | ||||||
| Swedish Krona | 8,340,585 | 1.0% | ||||||
| New Taiwanese Dollar | 6,911,521 | 0.9% | ||||||
| Brazilian Real | 5,668,969 | 0.7% | ||||||
| South Korean Won | 4,644,161 | 0.6% | ||||||
| Mexican Peso | 3,565,069 | 0.4% | ||||||
| New Zealand Dollar | 2,147,903 | 0.3% | ||||||
| Norwegian Krone | 909,660 | 0.1% | ||||||
| Total Investments Net of Common Stocks Sold Short and Written Options | $ | 800,781,320 | 100.0% | |||||
Currency exposure may vary over time.
INTEREST RATE SWAPS
| UNREALIZED | ||||||||||||||||
| FIXED RATE | FLOATING RATE | TERMINATION | NOTIONAL | APPRECIATION/ | ||||||||||||
| COUNTERPARTY | (FUND PAYS) | (FUND RECEIVES) | DATE | AMOUNT | (DEPRECIATION) | |||||||||||
| BNP Paribas, SA | 2.5350% | quarterly | 3 month LIBOR | 03/09/14 | $ | 80,000,000 | $ | (3,406,690 | ) | |||||||
| BNP Paribas, SA | 2.0200% | quarterly | 3 month LIBOR | 03/09/12 | 55,000,000 | (940,786 | ) | |||||||||
| BNP Paribas, SA | 1.8525% | quarterly | 3 month LIBOR | 09/14/12 | 36,900,000 | (781,026 | ) | |||||||||
| $ | (5,128,502 | ) | ||||||||||||||
| See accompanying Notes to Financial Statements | CALAMOS GLOBAL DYNAMIC INCOME FUND SEMIANNUAL REPORT | 17 |
Statement of Assets and Liabilities April 30, 2011 (Unaudited)
ASSETS | ||||
| Investments in securities, at value (cost $848,201,778) | $ | 823,436,962 | ||
| Cash with custodian (interest bearing) | 522,775 | |||
| Restricted cash for short positions (interest bearing) | 24,282,727 | |||
| Foreign currency (cost $174,775) | 176,019 | |||
| Receivables: | ||||
| Accrued interest and dividends | 5,392,975 | |||
| Investments sold | 3,372,226 | |||
| Prepaid expenses | 56,023 | |||
| Other assets | 97,993 | |||
| Total assets | 857,337,700 | |||
LIABILITIES | ||||
| Common stocks sold short, at value (proceeds $18,947,851) | 22,615,392 | |||
| Options written, at value (premium $13,098) | 40,250 | |||
| Unrealized depreciation on interest rate swaps | 5,128,502 | |||
| Payables: | ||||
| Note payable | 196,000,000 | |||
| Investments purchased | 12,076,665 | |||
| Affiliates: | ||||
| Investment advisory fees | 648,976 | |||
| Deferred compensation to trustees | 97,993 | |||
| Financial accounting fees | 7,422 | |||
| Trustees’ fees and officer compensation | 8,697 | |||
| Other accounts payable and accrued liabilities | 155,532 | |||
| Total liabilities | 236,779,429 | |||
| NET ASSETS APPLICABLE TO COMMON SHAREHOLDERS | $ | 620,558,271 | ||
COMPOSITION OF NET ASSETS APPLICABLE TO COMMON SHAREHOLDERS | ||||
| Common stock, no par value, unlimited shares authorized 59,006,992 shares issued and outstanding | $ | 795,087,845 | ||
| Undistributed net investment income (loss) | (10,613,594 | ) | ||
| Accumulated net realized gain (loss) on investments, foreign currency transactions, written options, short positions and interest rate swaps | (130,420,072 | ) | ||
| Unrealized appreciation (depreciation) of investments, foreign currency translations, written options, short positions and interest rate swaps | (33,495,908 | ) | ||
| NET ASSETS APPLICABLE TO COMMON SHAREHOLDERS | $ | 620,558,271 | ||
| Net asset value per common shares based upon 59,006,992 shares issued and outstanding | $ | 10.52 | ||
18 | CALAMOS GLOBAL DYNAMIC INCOME FUND SEMIANNUAL REPORT | See accompanying Notes to Financial Statements |
Statement of Operations Six Months Ended April 30, 2011 (Unaudited)
INVESTMENT INCOME | ||||
| Interest | $ | 6,735,425 | ||
| Dividends | 7,631,815 | |||
| Dividend taxes withheld | (328,615 | ) | ||
| Total investment income | 14,038,625 | |||
EXPENSES | ||||
| Investment advisory fees | 3,796,825 | |||
| Interest expense and related fees | 1,537,893 | |||
| Printing and mailing fees | 58,956 | |||
| Custodian fees | 46,197 | |||
| Financial accounting fees | 43,284 | |||
| Audit fees | 29,290 | |||
| Accounting fees | 29,154 | |||
| Registration fees | 25,883 | |||
| Trustees’ fees and officer compensation | 24,428 | |||
| Dividend expense on short positions | 13,939 | |||
| Transfer agent fees | 12,881 | |||
| Legal fees | 2,872 | |||
| Other | 33,361 | |||
| Total expenses | 5,654,963 | |||
| NET INVESTMENT INCOME (LOSS) | 8,383,662 | |||
REALIZED AND UNREALIZED GAIN (LOSS) | ||||
Net realized gain (loss) from: | ||||
| Investments, excluding purchased options | 9,551,916 | |||
| Purchased options | 94,871 | |||
| Foreign currency transactions | 130,823 | |||
| Written options | (1,931,959 | ) | ||
| Short positions | (267,877 | ) | ||
| Interest rate swaps | (1,665,239 | ) | ||
Change in net unrealized appreciation/(depreciation) on: | ||||
| Investments, excluding purchased options | 77,278,395 | |||
| Purchased options | (52,634 | ) | ||
| Foreign currency translations | (45,178 | ) | ||
| Written options | 1,987,094 | |||
| Short positions | (1,213,539 | ) | ||
| Interest rate swaps | 2,159,650 | |||
| NET GAIN (LOSS) | 86,026,323 | |||
| NET INCREASE (DECREASE) IN NET ASSETS APPLICABLE TO COMMON SHAREHOLDERS RESULTING FROM OPERATIONS | $ | 94,409,985 | ||
| See accompanying Notes to Financial Statements | CALAMOS GLOBAL DYNAMIC INCOME FUND SEMIANNUAL REPORT | 19 |
Statements of Changes in Net Assets
| (UNAUDITED) | ||||||||
| SIX MONTHS | ||||||||
| ENDED | YEAR ENDED | |||||||
| APRIL 30, | OCTOBER 31, | |||||||
| 2011 | 2010 | |||||||
OPERATIONS | ||||||||
| Net investment income (loss) | $ | 8,383,662 | $ | 18,129,548 | ||||
| Net realized gain (loss) | 5,912,535 | (3,416,096 | ) | |||||
| Change in unrealized appreciation/(depreciation) | 80,113,788 | 64,295,900 | ||||||
| Net increase (decrease) in net assets applicable to common shareholders resulting from operations | 94,409,985 | 79,009,352 | ||||||
DISTRIBUTIONS TO COMMON SHAREHOLDERS FROM | ||||||||
| Net investment income | (17,702,098 | ) | (16,189,909 | ) | ||||
| Return of capital | — | (19,214,286 | ) | |||||
| Net decrease in net assets from distributions to common shareholders | (17,702,098 | ) | (35,404,195 | ) | ||||
| TOTAL INCREASE (DECREASE) IN NET ASSETS APPLICABLE TO COMMON SHAREHOLDERS | 76,707,887 | 43,605,157 | ||||||
NET ASSETS APPLICABLE TO COMMON SHAREHOLDERS | ||||||||
| Beginning of period | $ | 543,850,384 | $ | 500,245,227 | ||||
| End of period | 620,558,271 | 543,850,384 | ||||||
| Undistributed net investment income (loss) | $ | (10,613,594 | ) | $ | (1,295,158 | ) | ||
20 | CALAMOS GLOBAL DYNAMIC INCOME FUND SEMIANNUAL REPORT | See accompanying Notes to Financial Statements |
Statement of Cash Flows Six Months Ended April 30, 2011 (Unaudited)
CASH FLOWS FROM OPERATING ACTIVITIES: | ||||
| Net increase/(decrease) in net assets from operations | $ | 94,409,985 | ||
| Adjustments to reconcile net increase/(decrease) in net assets from operations to net cash used for operating activities: | ||||
| Purchase of investment securities | (201,302,939 | ) | ||
| Net proceeds from disposition of short term investments | 2,569,332 | |||
| Purchase of securities sold short | (5,356,363 | ) | ||
| Proceeds paid on closing written options | (5,776,986 | ) | ||
| Proceeds from disposition of investment securities | 211,013,010 | |||
| Proceeds for securities sold short | 18,314,521 | |||
| Premiums received from written options | 1,777,671 | |||
| Amortization and accretion of fixed-income securities | (853,816 | ) | ||
| Net realized gains/losses from investments, excluding purchased options | (9,551,916 | ) | ||
| Net realized gains/losses from purchased options | (94,871 | ) | ||
| Net realized gains/losses from short positions | 267,877 | |||
| Net realized gains/losses from written options | 1,931,959 | |||
| Change in unrealized appreciation or depreciation on investments, excluding purchased options | (77,278,395 | ) | ||
| Change in unrealized appreciation or depreciation on purchased options | 52,634 | |||
| Change in unrealized appreciation or depreciation on short positions | 1,213,539 | |||
| Change in unrealized appreciation or depreciation on written options | (1,987,094 | ) | ||
| Change in unrealized appreciation or depreciation on interest rate swaps | (2,159,650 | ) | ||
| Net change in assets and liabilities: | ||||
| (Increase)/decrease in assets: | ||||
| Accrued interest and dividends receivable | (767,566 | ) | ||
| Restricted cash for short positions (interest bearing) | (14,351,855 | ) | ||
| Prepaid expenses | (40,821 | ) | ||
| Other assets | (16,008 | ) | ||
| Increase/(decrease) in liabilities: | ||||
| Payables to affiliates | 55,631 | |||
| Other accounts payable and accrued liabilities | 7,899 | |||
| Net cash provided by/(used in) operating activities | $ | 12,075,778 | ||
CASH FLOWS FROM FINANCING ACTIVITIES: | ||||
| Distributions to common shareholders | (17,702,098 | ) | ||
| Proceeds from Note payable | 5,000,000 | |||
| Net cash provided by/(used in) financing activities | $ | (12,702,098 | ) | |
| Net increase/(decrease) in cash and foreign currency* | $ | (626,320 | ) | |
| Cash and foreign currency at beginning of period | $ | 1,325,114 | ||
| Cash and foreign currency at end of period | $ | 698,794 | ||
| Supplemental disclosure | ||||
| Cash paid for interest and related fees | $ | 1,556,709 | ||
| * | Includes net change in unrealized appreciation or depreciation on foreign currency of $(75,632). |
| See accompanying Notes to Financial Statements | CALAMOS GLOBAL DYNAMIC INCOME FUND SEMIANNUAL REPORT | 21 |
Notes to Financial Statements
Note 1 – Organization and Significant Accounting Policies
Organization. Calamos Global Dynamic Income Fund (the “Fund”) was organized as a Delaware statutory trust on April 10, 2007 and is registered under the Investment Company Act of 1940 (the “1940 Act”) as a diversified, closed-end management investment company. The Fund commenced operations on June 27, 2007. The Fund’s investment objective is to generate a high level of current income with a secondary objective of capital appreciation.
Fund Valuation. The valuation of the Fund’s securities is in accordance with policies and procedures adopted by and under the ultimate supervision of the board of trustees.
Fund securities that are traded on U.S. securities exchanges, except option securities, are valued at the last current reported sales price at the time a Fund determines its net asset value (“NAV”). Securities traded in the over-the-counter market and quoted on The NASDAQ Stock Market are valued at the NASDAQ Official Closing Price, as determined by NASDAQ, or lacking a NASDAQ Official Closing Price, the last current reported sale price on NASDAQ at the time the Fund determines its NAV.
When a last sale or closing price is not available, equity securities, other than option securities, that are traded on a U.S. securities exchange and other equity securities traded in the over-the-counter market are valued at the mean between the most recent bid and asked quotations in accordance with guidelines adopted by the board of trustees. Each option security traded on a U.S. securities exchange is valued at the mid-point of the consolidated bid/ask quote for the option security, also in accordance with guidelines adopted by the board of trustees. Each over-the-counter option that is not traded through the Options Clearing Corporation is valued based on a quotation provided by the counterparty to such option under the ultimate supervision of the board of trustees.
Fixed income securities, certain convertible preferred securities, and non-exchange traded derivatives are normally valued by independent pricing services or by dealers or brokers who make markets in such securities. Valuations of such fixed income securities, certain convertible preferred securities, and non-exchange traded derivatives consider yield or price of equivalent securities of comparable quality, coupon rate, maturity, type of issue, trading characteristics and other market data and do not rely exclusively upon exchange or over-the-counter prices.
Trading on European and Far Eastern exchanges and over-the-counter markets is typically completed at various times before the close of business on each day on which the New York Stock Exchange (“NYSE”) is open. Each security trading on these exchanges or over-the-counter markets may be valued utilizing a systematic fair valuation model provided by an independent pricing service approved by the board of trustees. The valuation of each security that meets certain criteria in relation to the valuation model is systematically adjusted to reflect the impact of movement in the U.S. market after the foreign markets close. Securities that do not meet the criteria, or that are principally traded in other foreign markets, are valued as of the last reported sale price at the time the Fund determines its NAV, or when reliable market prices or quotations are not readily available, at the mean between the most recent bid and asked quotations as of the close of the appropriate exchange or other designated time. Trading of foreign securities may not take place on every NYSE business day. In addition, trading may take place in various foreign markets on Saturdays or on other days when the NYSE is not open and on which the Fund’s NAV is not calculated.
If the pricing committee determines that the valuation of a security in accordance with the methods described above is not reflective of a fair value for such security, the security is valued at a fair value by the pricing committee, under the ultimate supervision of the board of trustees, following the guidelines and/or procedures adopted by the board of trustees.
The Fund also may use fair value pricing, pursuant to guidelines adopted by the board of trustees and under the ultimate supervision of the board of trustees, if trading in the security is halted or if the value of a security it holds is materially affected by events occurring before the Fund’s pricing time but after the close of the primary market or exchange on which the security is listed. Those procedures may utilize valuations furnished by pricing services approved by the board of trustees, which may be based on market transactions for comparable securities and various relationships between securities that are generally recognized by institutional traders, a computerized matrix system, or appraisals derived from information concerning the securities or similar securities received from recognized dealers in those securities.
When fair value pricing of securities is employed, the prices of securities used by a Fund to calculate its NAV may differ from market quotations or official closing prices. In light of the judgment involved in fair valuations, there can be no assurance that a fair value assigned to a particular security is accurate.
| 22 | CALAMOS GLOBAL DYNAMIC INCOME FUND SEMIANNUAL REPORT |
Notes to Financial Statements
Investment Transactions. Investment transactions are recorded on a trade date basis. Net realized gains and losses from investment transactions are reported on an identified cost basis. Interest income is recognized using the accrual method and includes accretion of original issue and market discount and amortization of premium. Dividend income is recognized on the ex-dividend date, except that certain dividends from foreign securities are recorded as soon as the information becomes available after the ex-dividend date.
Foreign Currency Translation. Values of investments and other assets and liabilities denominated in foreign currencies are translated into U.S. dollars using a rate quoted by a major bank or dealer in the particular currency market, as reported by a recognized quotation dissemination service.
The Fund does not isolate that portion of the results of operations resulting from changes in foreign exchange rates on investments from the fluctuations arising from changes in market prices of securities held. Such fluctuations are included with the net realized and unrealized gain or loss from investments.
Reported net realized foreign currency gains or losses arise from disposition of foreign currency, the difference in the foreign exchange rates between the trade and settlement dates on securities transactions, and the difference between the amounts of dividends, interest and foreign withholding taxes recorded on the ex-date or accrual date and the U.S. dollar equivalent of the amounts actually received or paid. Net unrealized foreign exchange gains and losses arise from changes (due to the changes in the exchange rate) in the value of foreign currency and other assets and liabilities denominated in foreign currencies held at period end.
Allocation of Expenses Among Funds. Expenses directly attributable to the Fund are charged to the Fund; certain other common expenses of Calamos Advisors Trust, Calamos Investment Trust, Calamos Convertible Opportunities and Income Fund, Calamos Convertible and High Income Fund, Calamos Strategic Total Return Fund, Calamos Global Total Return Fund and Calamos Global Dynamic Income Fund are allocated proportionately among each fund to which the expenses relate in relation to the net assets of each fund or on another reasonable basis.
Use of Estimates. The preparation of financial statements in conformity with U.S. generally accepted accounting principles requires management to make estimates and assumptions that affect the amounts reported in the financial statements and accompanying notes. Actual results may differ from those estimates.
Income Taxes. No provision has been made for U.S. income taxes because the Fund’s policy is to continue to qualify as a regulated investment company under the Internal Revenue Code of 1986, as amended, and distribute to shareholders substantially all of its taxable income and net realized gains.
Dividends and distributions paid to shareholders are recorded on the ex-dividend date. The amount of dividends and distributions from net investment income and net realized capital gains is determined in accordance with federal income tax regulations, which may differ from U.S. generally accepted accounting principles. To the extent these “book/tax” differences are permanent in nature, such amounts are reclassified within the capital accounts based on their federal tax-basis treatment. These differences are primarily due to differing treatments for foreign currency transactions, contingent payment debt instruments and methods of amortizing and accreting on fixed income securities. The financial statements are not adjusted for temporary differences.
The Fund recognized no liability for uncertain tax positions. A reconciliation is not provided as the beginning and ending amounts of unrecognized benefits are zero, with no interim additions, reductions or settlements. Tax years 2007 — 2009 remain subject to examination by the U.S. and the State of Illinois tax jurisdictions.
Indemnifications. Under the Fund’s organizational documents, the Fund is obligated to indemnify its officers and trustees against certain liabilities incurred by them by reason of having been an officer or trustee of the Fund. In addition, in the normal course of business, the Fund may enter into contracts that provide general indemnifications to other parties. The Fund’s maximum exposure under these arrangements is unknown as this would involve future claims that may be made against the Fund that have not yet occurred. Currently, the Fund’s management expects the risk of material loss in connection to a potential claim to be remote.
| CALAMOS GLOBAL DYNAMIC INCOME FUND SEMIANNUAL REPORT | 23 |
Notes to Financial Statements
Note 2 – Investment Adviser and Transactions With Affiliates Or Certain Other Parties
Pursuant to an investment advisory agreement with Calamos Advisors LLC (“Calamos Advisors”), the Fund pays an annual fee, payable monthly, equal to 1.00% based on the average weekly managed assets. “Managed assets” means a fund’s total assets (including any assets attributable to any leverage that may be outstanding) minus total liabilities (other than debt representing financial leverage).
Pursuant to a financial accounting services agreement, during the period the Fund paid Calamos Advisors a fee for financial accounting services payable monthly at the annual rate of 0.0175% on the first $1 billion of combined assets, 0.0150% on the next $1 billion of combined assets and 0.0110% on combined assets above $2 billion (for purposes of this calculation “combined assets” means the sum of the total average daily net assets of Calamos Investment Trust, Calamos Advisors Trust, and the total average weekly managed assets of Calamos Convertible and High Income Fund, Calamos Strategic Total Return Fund, Calamos Convertible Opportunities and Income Fund, Calamos Global Total Return Fund and Calamos Global Dynamic Income Fund). Financial accounting services include, but are not limited to, the following: managing expenses and expense payment processing; monitoring the calculation of expense accrual amounts; calculating, tracking and reporting tax adjustments on all assets; and monitoring trustee deferred compensation plan accruals and valuations. The Fund pays its pro rata share of the financial accounting services fee payable to Calamos Advisors based on its relative portion of combined assets used in calculating the fee.
The Fund reimburses Calamos Advisors for a portion of compensation paid to the Fund’s Chief Compliance Officer. This compensation is reported as part of “Trustees’ fees and officer compensation” expense on the Statement of Operations.
A trustee and certain officers of the Fund are also officers and directors of Calamos Advisors. Such trustee and officers serve without direct compensation from the Fund.
The Fund has adopted a deferred compensation plan (the “Plan”). Under the Plan, a trustee who is not an “interested person” (as defined in the 1940 Act) and has elected to participate in the Plan (a “participating trustee”) may defer receipt of all or a portion of his compensation from the Fund. The deferred compensation payable to the participating trustee is credited to the trustee’s deferral account as of the business day such compensation would have been paid to the participating trustee. The value of amounts deferred for a participating trustee is determined by reference to the change in value of Class I shares of one or more funds of Calamos Investment Trust designated by the participating trustee. The value of the account increases with contributions to the account or with increases in the value of the measuring shares, and the value of the account decreases with withdrawals from the account or with declines in the value of the measuring shares. Deferred compensation of $97,993 is included in “Other assets” on the Statement of Assets and Liabilities at April 30, 2011. The Fund’s obligation to make payments under the Plan is a general obligation of the Fund and is included in “Payable for deferred compensation to trustees” on the Statement of Assets and Liabilities at April 30, 2011.
Note 3 – Investments
The cost of purchases and proceeds from sale of long-term investments, for the period ended April 30, 2011 were as follows:
| Cost of purchases | $ | 189,011,982 | ||
| Proceeds from sales | 181,849,089 |
The following information is presented on a federal income tax basis as of April 30, 2011. Differences between the cost basis under U.S. generally accepted accounting principles and federal income tax purposes are primarily due to temporary differences.
The cost basis of investments for federal income tax purposes at April 30, 2011 was as follows:
| Cost basis of investments | $ | 855,379,910 | ||
| Gross unrealized appreciation | 73,229,710 | |||
| Gross unrealized depreciation | (105,172,658 | ) | ||
| Net unrealized appreciation (depreciation) | $ | (31,942,948 | ) | |
Note 4 – Income Taxes
The Fund intends to make monthly distributions from its income available for distribution, which consists of the Fund’s dividends and interest income after payment of Fund expenses, and net realized gains on stock investments. At least annually, the Fund intends to
| 24 | CALAMOS GLOBAL DYNAMIC INCOME FUND SEMIANNUAL REPORT |
Notes to Financial Statements
distribute all or substantially all of its net realized capital gains, if any. Distributions are recorded on the ex-dividend date. The Fund distinguishes between distributions on a tax basis and a financial reporting basis. Accounting principles generally accepted in the United States of America require that only distributions in excess of tax basis earnings and profits be reported in the financial statements as a return of capital. Permanent differences between book and tax accounting relating to distributions are reclassified to paid-in-capital. For tax purposes, distributions from short-term capital gains are considered to be from ordinary income. Distributions in any year may include a return of capital component.
The tax character of distributions for the period ended April 30, 2011 will be determined at the end of each Fund’s current fiscal year. Distributions for the fiscal year ended October 31, 2010 were characterized for federal income tax purposes as follows:
| YEAR ENDED | ||||
| OCTOBER 31, 2010 | ||||
| Distributions paid from: | ||||
| Ordinary income | $ | 16,189,909 | ||
| Long-term capital gains | — | |||
| Return of Capital | 19,214,286 | |||
As of October 31, 2010, the components of accumulated earnings/(loss) on a tax basis were as follows:
| Undistributed ordinary income | $ | — | ||
| Undistributed capital gains | — | |||
| Total undistributed earnings | — | |||
| Accumulated capital and other losses | (129,859,293 | ) | ||
| Net unrealized gains/(losses) | (121,288,169 | ) | ||
| Total accumulated earnings/(losses) | (251,147,462 | ) | ||
| Other | (89,999 | ) | ||
| Paid-in capital | 795,087,845 | |||
| Net assets applicable to common shareholders | $ | 543,850,384 |
As of October 31, 2010, the Fund had capital loss carryforwards which, if not used, will expire as follows:
| 2017 | $ | (129,280,329 | ) | |
| 2018 | (578,964 | ) |
Note 5 – Common Shares
There are unlimited common shares of beneficial interest authorized and 59,006,992 shares outstanding at April 30, 2011. Calamos Advisors owned 28,943 of the outstanding shares at April 30, 2011. Transactions in common shares were as follows:
| PERIOD ENDED | YEAR ENDED | |||||||
| APRIL 30, 2011 | OCTOBER 31, 2010 | |||||||
| Beginning shares | 59,006,992 | 59,006,992 | ||||||
| Shares issued through reinvestment of distributions | — | — | ||||||
| Ending shares | 59,006,992 | 59,006,992 | ||||||
Notice is hereby given in accordance with Section 23(c) of the Investment Company Act of 1940 that the Fund may from time to time purchase its shares of common stock in the open market.
Note 6 – Short Sales
Securities sold short represent obligations to deliver the securities at a future date. The Fund may sell a security it does not own in anticipation of a decline in the value of that security before the delivery date. When a Fund sells a security short, it must borrow the security sold short and deliver it to the broker-dealer through which it made the short sale. Dividends paid on securities sold short are included as an expense on the Statement of Operations. A gain, limited to the price at which the Fund sold the security short, or a loss, unlimited in size, will be recognized upon the termination of a short sale.
| CALAMOS GLOBAL DYNAMIC INCOME FUND SEMIANNUAL REPORT | 25 |
Notes to Financial Statements
To secure its obligation to deliver to the broker-dealer the securities sold short, the Fund must segregate an amount of cash or liquid securities with its custodian equal to any excess of the current market value of the securities sold short over any cash or liquid securities deposited as collateral with the broker in connection with the short sale (not including the proceeds of the short sale). As a result of that requirement, the Fund will not gain any leverage merely by selling short, except to the extent that it earns interest or other income or gains on the segregated cash or liquid securities while also being subject to the possibility of gain or loss from the securities sold short.
Note 7 – Derivative Instruments
Foreign Currency Risk. The Fund engaged in portfolio hedging with respect to changes in currency exchange rates by entering into foreign currency contracts to purchase or sell currencies. A forward foreign currency contract is a commitment to purchase or sell a foreign currency at a future date at a negotiated forward rate. Risks associated with such contracts include, among other things, movement in the value of the foreign currency relative to the U.S. dollar and the ability of the counterparty to perform. The net unrealized gain, if any, represents the credit risk to the Fund on a forward foreign currency contract. The contracts are valued daily at forward foreign exchange rates and an unrealized gain or loss is recorded. The Fund realizes a gain or loss when a position is closed or upon settlement of the contracts. There were no open forward currency contracts at April 30, 2011.
Equity Risk. The Fund engages in option transactions and in doing so achieves the similar objectives to what it would achieve through the sale or purchase of individual securities. A call option, upon payment of a premium, gives the purchaser of the option the right to buy, and the seller of the option the obligation to sell, the underlying security, index or other instrument at the exercise price. A put option gives the purchaser of the option, upon payment of a premium, the right to sell, and the seller the obligation to buy, the underlying security, index, or other instrument at the exercise price.
To seek to offset some of the risk of a potential decline in value of certain long positions, the Fund may also purchase put options on individual securities, broad-based securities indexes or certain exchange traded funds (“ETFs”). The Fund may also seek to generate income from option premiums by writing (selling) options on a portion of the equity securities (including securities that are convertible into equity securities) in the Fund’s portfolio, on broad-based securities indexes, or certain ETFs.
When a Fund purchases an option, it pays a premium and an amount equal to that premium is recorded as an asset. When a Fund writes an option, it receives a premium and an amount equal to that premium is recorded as a liability. The asset or liability is adjusted daily to reflect the current market value of the option. If an option expires unexercised, the Fund realizes a gain or loss to the extent of the premium received or paid. If an option is exercised, the premium received or paid is recorded as an adjustment to the proceeds from the sale or the cost basis of the purchase. The difference between the premium and the amount received or paid on a closing purchase or sale transaction is also treated as a realized gain or loss. The cost of securities acquired through the exercise of call options is increased by premiums paid. The proceeds from securities sold through the exercise of put options are decreased by the premiums paid. Gain or loss on written options and purchased options is presented separately as net realized gain or loss on written options and net realized gain or loss on purchased options, respectively.
As of April 30, 2011, the Fund had outstanding purchased options and/or written options as listed on the Schedule of Investments. For the period ended April 30, 2011, the Fund had the following transactions in options written:
| NUMBER OF | PREMIUMS | |||||||
| CONTRACTS | RECEIVED | |||||||
| Options outstanding at October 31, 2010 | 7,850 | $ | 2,080,454 | |||||
| Options written | 7,900 | 1,777,671 | ||||||
| Options closed | (15,700 | ) | (3,845,027 | ) | ||||
| Options exercised | — | — | ||||||
| Options expired | — | — | ||||||
| Options outstanding at April 30, 2011 | 50 | $ | 13,098 | |||||
Interest Rate Risk. The Fund engages in interest rate swaps primarily to hedge the interest rate risk on the fund’s borrowings (see Note 8 – Borrowings). An interest rate swap is a contract that involves the exchange of one type of interest rate for another type of interest rate. If interest rates rise, resulting in a diminution in the value of the Fund’s portfolio, the Fund would receive payments under the swap that would offset, in whole or in part, such diminution in value; if interest rates fall, the Fund would likely lose money on the swap transaction. Unrealized gains are reported as an asset, and unrealized losses are reported as a liability on the Statement of Assets
| 26 | CALAMOS GLOBAL DYNAMIC INCOME FUND SEMIANNUAL REPORT |
Notes to Financial Statements
and Liabilities. The change in value of swaps, including accruals of periodic amounts of interest to be paid or received on swaps, is reported as change in net unrealized appreciation/depreciation on interest rate swaps in the Statement of Operations. A realized gain or loss is recorded in net realized gain (loss) from interest rate swaps in the Statement of Operations upon payment or receipt of a periodic payment or termination of the swap agreements. Swap agreements are stated at fair value. Notional principal amounts are used to express the extent of involvement in these transactions, but the amounts potentially subject to credit risk are much smaller. In connection with these contracts, securities may be identified as collateral in accordance with the terms of the respective swap contracts in the event of default or bankruptcy of the Fund.
Premiums paid to or by a Fund are accrued daily and included in realized gain (loss) when paid on swaps in the accompanying Statement of Operations. The contracts are marked-to-market daily based upon third party vendor valuations and changes in value are recorded as unrealized appreciation (depreciation). Gains or losses are realized upon early termination of the contract. Risks may exceed amounts recognized in the Statement of Assets and Liabilities. These risks include changes in the returns of the underlying instruments, failure of the counterparties to perform under the contracts’ terms, counterparty’s creditworthiness, and the possible lack of liquidity with respect to the contracts.
As of April 30, 2011, the Fund had outstanding interest rate swap agreements as listed on the Schedule of Investments.
Below are the types of derivatives in the Fund by gross value as of April 30, 2011:
| ASSETS | LIABILITIES | |||||||||||
| STATEMENT OF ASSETS & | STATEMENT OF ASSETS & | |||||||||||
| LIABILITIES LOCATION | VALUE | LIABILITIES LOCATION | VALUE | |||||||||
| Derivative Type: | ||||||||||||
| Equity-Purchased Options | Investments in securities | $ | 235,412 | Written options | $ | 40,250 | ||||||
| Interest Rate Swaps | Unrealized appreciation on swaps | — | Unrealized depreciation on swaps | 5,128,502 | ||||||||
Volume of Derivative Activity for the Six Months Ended April 30, 2011*
| Equity: | ||||
| Purchased options | 890 | |||
| Written options | 7,900 |
| * | Activity during the period is measured by opened number of contracts for options and opened notional amount for swap contracts. |
Note 8 – Borrowings
The Fund, with the approval of its board of trustees, including its independent trustees, has entered into a financing package that includes a Committed Facility Agreement (the “Agreement”) with BNP Paribas Prime Brokerage, Inc. (as successor to Bank of America N.A.) (“BNP”) that allows the Fund to borrow up to an initial limit of $300,000,000 and a Lending Agreement, as defined below. Borrowings under the Agreement are secured by assets of the Fund that are held with the Fund’s custodian in a separate account (the “pledged collateral”). Interest is charged at the quarterly LIBOR (London Inter-bank Offered Rate) plus .65% on the amount borrowed and .55% on the undrawn balance. For the period ended April 30, 2011, the average borrowings and the average interest rate were $191,082,873 and 1.18%, respectively. As of April 30, 2011, the amount of such outstanding borrowings is $196,000,000. The interest rate applicable to the borrowings on April 30, 2011 was 0.92%.
The Lending Agreement is a separate side-agreement between the Fund and BNP pursuant to which BNP may borrow a portion of the pledged collateral (the “Lent Securities”) in an amount not to exceed the outstanding borrowings owed by the Fund to BNP under the Agreement. The Lending Agreement is intended to permit the Fund to significantly reduce the cost of its borrowings under the Agreement. BNP may re-register the Lent Securities in its own name or in another name other than the Fund, and may pledge, re-pledge, sell, lend or otherwise transfer or use the Lent Securities with all attendant rights of ownership. (It is the Fund’s understanding that BNP will perform due diligence to determine the creditworthiness of any party that borrows Lent Securities from BNP.) The Fund may designate any security within the pledged collateral as ineligible to be a Lent Security, provided there are eligible securities within the pledged collateral in an amount equal to the outstanding borrowing owed by the Fund. During the period in which the Lent Securities
| CALAMOS GLOBAL DYNAMIC INCOME FUND SEMIANNUAL REPORT | 27 |
Notes to Financial Statements
are outstanding, BNP must remit payment to the Fund equal to the amount of all dividends, interest or other distributions earned or made by the Lent Securities.
Under the terms of the Lending Agreement, the Lent Securities are marked to market daily, and if the value of the Lent Securities exceeds the value of the then-outstanding borrowings owed by the Fund to BNP under the Agreement (the “Current Borrowings”), BNP must, on that day, either (1) return Lent Securities to the Fund’s custodian in an amount sufficient to cause the value of the outstanding Lent Securities to equal the Current Borrowings; or (2) post cash collateral with the Fund’s custodian equal to the difference between the value of the Lent Securities and the value of the Current Borrowings. If BNP fails to perform either of these actions as required, the Fund will recall securities, as discussed below, in an amount sufficient to cause the value of the outstanding Lent Securities to equal the Current Borrowings. The Fund can recall any of the Lent Securities and BNP shall, to the extent commercially possible, return such security or equivalent security to the Fund’s custodian no later than three business days after such request. If the Fund recalls a Lent Security pursuant to the Lending Agreement, and BNP fails to return the Lent Securities or equivalent securities in a timely fashion, BNP shall remain liable to the Fund’s custodian for the ultimate delivery of such Lent Securities, or equivalent securities, and for any buy-in costs that the executing broker for the sales transaction may impose with respect to the failure to deliver. The Fund shall also have the right to apply and set-off an amount equal to one hundred percent (100%) of the then-current fair market value of such Lent Securities against the Current Borrowings.
Note 9 – When-Issued and Delayed Delivery Securities
The Fund may purchase securities on a when-issued or delayed-delivery basis. Although the payment and interest terms of these securities are established at the time the Fund enters into the commitment, the securities may be delivered and paid for a month or more after the date of purchase, when their value may have changed. The Fund makes such commitments only with the intention of actually acquiring the securities, but may sell the securities before the settlement date if Calamos Advisors deems it advisable for investment reasons. The Fund may utilize spot and forward foreign currency exchange transactions to reduce the risk inherent in fluctuations in the exchange rate between one currency and another when securities are purchased or sold on a when-issued or delayed-delivery basis.
At the time when the Fund enters into a binding obligation to purchase securities on a when-issued basis, liquid assets (cash, U.S. Government securities or other “high-grade” debt obligations) of the Fund having a value at least as great as the purchase price of the securities to be purchased will be segregated on the books of the Fund and held by the custodian throughout the period of the obligation. The use of this investment strategy may increase net asset value fluctuation.
Note 10 – Structured Equity-Linked Securities
The Fund may also invest in structured equity-linked securities created by third parties, typically investment banks. Structured equity-linked securities created by such parties may be designed to simulate the characteristics of traditional convertible securities or may be designed to alter or emphasize a particular feature. Traditional convertible securities typically offer stable cash flows with the ability to participate in capital appreciation of the underlying common stock. Because traditional convertible securities are exercisable at the option of the holder, the holder is protected against downside risk. Structured equity-linked securities may alter these characteristics by offering enhanced yields in exchange for reduced capital appreciation or less downside protection, or any combination of these features. Structured equity-linked instruments may include structured notes, equity-linked notes, mandatory convertibles and combinations of securities and instruments, such as a debt instrument combined with a forward contract. Income received from these securities is recorded as dividends on the Statement of Operations.
Note 11 – Valuations
Various inputs are used to determine the value of the Fund’s investments. These inputs are categorized into three broad levels as follows:
| • | Level 1 – Prices are determined using inputs from unadjusted quoted prices from active markets (including securities actively traded on a securities exchange) for identical assets. | |
| • | Level 2 – Prices are determined using significant observable market inputs other than unadjusted quoted prices, including quoted prices of similar securities, fair value adjustments to quoted foreign securities, interest rates, credit risk, prepayment speeds, and other relevant data. |
| 28 | CALAMOS GLOBAL DYNAMIC INCOME FUND SEMIANNUAL REPORT |
Notes to Financial Statements
| • | Level 3 – Prices reflect unobservable market inputs (including the Fund’s own judgments about assumptions market participants would use in determining fair value) when observable inputs are unavailable. |
Debt securities (including U.S. government and government agency obligations) are valued based upon evaluated prices received from an independent pricing service or from a dealer or broker who makes markets in such securities. Pricing services utilize various observable market data and as such, debt securities are generally categorized as Level 2. The levels are not necessarily an indication of the risk or liquidity of the Fund’s investments.
The following is a summary of the inputs used in valuing the Fund’s holdings at fair value:
| GLOBAL DYNAMIC INCOME FUND | ||||||||||||||||
| LEVEL 1 | LEVEL 2 | LEVEL 3 | TOTAL | |||||||||||||
| Assets: | ||||||||||||||||
| Corporate Bonds | $ | — | $ | 124,784,458 | $ | — | $ | 124,784,458 | ||||||||
| Convertible Bonds | 117,790,506 | $ | 117,790,506 | |||||||||||||
| U.S. Government and Agency Securities | 5,284,300 | $ | 5,284,300 | |||||||||||||
| Sovereign Bonds | 4,409,359 | $ | 4,409,359 | |||||||||||||
| Convertible Preferred Stocks | 22,399,235 | 4,692,750 | $ | 27,091,985 | ||||||||||||
| Structured Equity-Linked Securities | 12,253,899 | $ | 12,253,899 | |||||||||||||
| Common Stocks | 217,648,781 | 293,162,368 | $ | 510,811,149 | ||||||||||||
| Purchased Options | 235,412 | $ | 235,412 | |||||||||||||
| Short Term Investment | 20,775,894 | $ | 20,775,894 | |||||||||||||
| $ | 261,059,322 | $ | 562,377,640 | $ | — | $ | 823,436,962 | |||||||||
| Liabilities: | ||||||||||||||||
| Common Stocks Sold Short | 22,615,392 | $ | 22,615,392 | |||||||||||||
| Written Options | 40,250 | $ | 40,250 | |||||||||||||
| Interest Rate Swaps | 5,128,502 | $ | 5,128,502 | |||||||||||||
| Total | $ | 22,655,642 | $ | 5,128,502 | $ | — | $ | 27,784,144 | ||||||||
| CALAMOS GLOBAL DYNAMIC INCOME FUND SEMIANNUAL REPORT | 29 |
Financial Highlights
Selected data for a share outstanding throughout each period were as follows:
| (Unaudited) | ||||||||||||||||||||
| Six Months | June 27, 2007* | |||||||||||||||||||
| Ended | through | |||||||||||||||||||
| April 30, | Year Ended October 31, | October 31, | ||||||||||||||||||
| 2011 | 2010 | 2009 | 2008 | 2007 | ||||||||||||||||
| Net asset value, beginning of period | $9.22 | $8.48 | $7.42 | $14.80 | $14.32 | (a) | ||||||||||||||
| Income from investment operations: | ||||||||||||||||||||
| Net investment income (loss) | 0.14 | ** | 0.31 | ** | 0.32 | ** | 0.60 | ** | 0.18 | ** | ||||||||||
| Net realized and unrealized gain (loss) | 1.46 | 1.03 | 1.63 | (6.49 | ) | 0.75 | ||||||||||||||
| Distributions to preferred shareholders from: | ||||||||||||||||||||
| Net investment income (common share equivalent basis) | — | — | (0.01 | ) | (0.17 | ) | (0.04 | ) | ||||||||||||
| Total from investment operations | 1.60 | 1.34 | 1.94 | (6.06 | ) | 0.89 | ||||||||||||||
| Less distributions to common shareholders from: | ||||||||||||||||||||
| Net investment income | (0.30 | ) | (0.27 | ) | (0.43 | ) | (1.32 | ) | — | |||||||||||
| Net realized gains | — | — | — | — | (0.33 | ) | ||||||||||||||
| Return of capital | — | (0.33 | ) | (0.45 | ) | — | — | |||||||||||||
| Capital charge resulting from issuance of common and preferred shares and related offering costs | — | — | — | (b) | — | (b) | (0.08 | ) | ||||||||||||
| Net asset value, end of period | $10.52 | $9.22 | $8.48 | $7.42 | $14.80 | |||||||||||||||
| Market value, end of period | $9.05 | $8.24 | $7.34 | $6.35 | $13.09 | |||||||||||||||
| Total investment return based on:(c) | ||||||||||||||||||||
| Net asset value | 18.22% | 17.50% | 31.82% | (43.35 | )% | 5.92% | ||||||||||||||
| Market value | 13.80% | 21.32% | 33.32% | (45.14 | )% | (10.59 | )% | |||||||||||||
| Net assets, end of period (000) | $620,558 | $543,850 | $500,245 | $437,906 | $873,464 | |||||||||||||||
| Preferred shares, at redemption value ($25,000 per share liquidation preference) (000’s omitted) | $— | $— | $— | $50,000 | $350,000 | |||||||||||||||
| Ratios to average net assets applicable to common shareholders: | ||||||||||||||||||||
| Net expenses(d) | 1.98% | (e) | 2.20% | 3.24% | 2.68% | 1.22% | (e) | |||||||||||||
| Gross expenses prior to expense reductions and earnings credits(d) | 1.98% | (e) | 2.20% | 3.26% | 2.70% | 1.26% | (e) | |||||||||||||
| Net expenses, excluding interest expense and dividend expense on short positions(d) | 1.44% | (e) | 1.52% | 2.32% | 2.10% | 1.22% | (e) | |||||||||||||
| Net investment income (loss)(d) | 2.94% | (e) | 3.55% | 4.31% | 4.70% | 3.83% | (e) | |||||||||||||
| Preferred share distributions | —% | —% | 0.07% | 1.35% | 0.81% | (e) | ||||||||||||||
| Net investment income (loss), net of preferred share distributions from net investment income | 2.94% | (e) | 3.55% | 4.24% | 3.35% | 3.02% | (e) | |||||||||||||
| Portfolio turnover rate | 25% | 37% | 34% | 79% | 9% | |||||||||||||||
| Average commission rate paid | $0.0107 | $0.0121 | $0.0191 | $0.0864 | $0.0427 | |||||||||||||||
| Asset coverage per preferred share, at end of period(f) | $— | $— | $— | $243,959 | $87,404 | |||||||||||||||
| Asset coverage per $1,000 of loan outstanding(g) | $4,166 | $3,847 | $3,619 | $3,900 | $— | |||||||||||||||
| * | Commencement of operations. | |
| ** | Net investment income allocated based on average shares method. | |
| (a) | Net of sales load of $0.675 on initial shares issued and beginning net asset value of $14.325. | |
| (b) | Amount equated to less than $0.005 per common share. | |
| (c) | Total investment return is calculated assuming a purchase of common stock on the opening of the first day and a sale on the closing of the last day of the period reported. Dividends and distributions are assumed, for purposes of this calculation, to be reinvested at prices obtained under the Fund’s dividend reinvestment plan. Total return is not annualized for periods less than one year. Brokerage commissions are not reflected. NAV per share is determined by dividing the value of the Fund’s portfolio securities, cash and other assets, less all liabilities, by the total number of common shares outstanding. The common share market price is the price the market is willing to pay for shares of the Fund at a given time. Common share market price is influenced by a range of factors, including supply and demand and market conditions. | |
| (d) | Does not reflect the effect of dividend payments to Preferred Shareholders. | |
| (e) | Annualized. | |
| (f) | Calculated by subtracting the Fund’s total liabilities (not including Preferred Shares) from the Fund’s total assets and dividing this by the number of Preferred Shares outstanding. | |
| (g) | Calculated by subtracting the Fund’s total liabilities (not including Note payable) and preferred shares from the Fund’s total assets and dividing this by the amount of note payable outstanding, and by multiplying the result by 1,000. |
| 30 | CALAMOS GLOBAL DYNAMIC INCOME FUND SEMIANNUAL REPORT |
Report of Independent Registered Public Accounting Firm
To the Shareholders and Board of Trustees of Calamos Global Dynamic Income Fund
We have reviewed the accompanying statement of assets and liabilities, including the schedule of investments, for Calamos Global Dynamic Income Fund (the “Fund”) as of April 30, 2011, and the related statements of operations, changes in net assets, and cash flows and the financial highlights for the semi-annual period then ended. These interim financial statements and financial highlights are the responsibility of the Fund’s management.
We conducted our review in accordance with standards of the Public Company Accounting Oversight Board (United States). A review of interim financial information consists principally of applying analytical procedures and making inquiries of persons responsible for financial and accounting matters. It is substantially less in scope than an audit conducted in accordance with standards of the Public Company Accounting Oversight Board (United States), the objective of which is the expression of an opinion regarding the financial statements and financial highlights taken as a whole. Accordingly, we do not express such an opinion.
Based on our review, we are not aware of any material modifications that should be made to such interim financial statements and financial highlights for them to be in conformity with accounting principles generally accepted in the United States of America.
We have previously audited, in accordance with the standards of the Public Company Accounting Oversight Board (United States), the statement of changes in net assets of the Fund for the year ended October 31, 2010 and the financial highlights for each of the three years then ended and for the period from June 27, 2007 (commencement of operations) through October 31, 2007; and in our report dated December 17, 2010, we expressed an unqualified opinion on such statement of changes in net assets and financial highlights.
Chicago, Illinois
June 20, 2011
| CALAMOS GLOBAL DYNAMIC INCOME FUND SEMIANNUAL REPORT | 31 |
About Closed-End Funds
What is a Closed-End Fund?
A closed-end fund is a publicly traded investment company that raises its initial investment capital through the issuance of a fixed number of shares to investors in a public offering. Shares of a closed-end fund are listed on a stock exchange or traded in the over-the-counter market. Like all investment companies, a closed-end fund is professionally managed and offers investors a unique investment solution based on its investment objective approved by the fund’s Board of Directors.
Potential Advantages of Closed-End Fund Investing
• Defined Asset Pool Allows Efficient Portfolio Management—Although closed-end fund shares trade actively on a securities exchange, this doesn’t affect the closed-end fund manager because there are no new investors buying into or selling out of the fund’s portfolio.
• More Flexibility in the Timing and Price of Trades—Investors can purchase and sell shares of closed-end funds throughout the trading day, just like the shares of other publicly traded securities.
• Lower Expense Ratios—The expense ratios of closed-end funds are oftentimes less than those of mutual funds. Over time, a lower expense ratio could enhance investment performance.
• Closed-End Structure Makes Sense for Less-Liquid Asset Classes—A closed-end structure makes sense for investors considering less-liquid asset classes, such as high-yield bonds or micro-cap stocks.
• Ability to Put Leverage to Work—Closed-end funds may issue senior securities (such as preferred shares or debentures) or borrow money to “leverage” their investment positions.
• No Minimum Investment Requirements
OPEN-END MUTUAL FUNDS VERSUS CLOSED-END FUNDS
| OPEN-END FUND | CLOSED-END FUND | |
| Issues new shares on an ongoing basis | Generally issues a fixed number of shares | |
| Issues common equity shares | Can issue common equity shares and senior securities such as preferred shares and bonds | |
| Sold at NAV plus any sales charge | Price determined by the marketplace | |
| Sold through the fund’s distributor | Traded in the secondary market | |
| Fund redeems shares at NAV calculated at the close of business day | Fund does not redeem shares | |
| 32 | CALAMOS GLOBAL DYNAMIC INCOME FUND SEMIANNUAL REPORT |
Level Rate Distribution Policy
Using a Level Rate Distribution Policy to Promote Dependable Income and Total Return
The goal of the level rate distribution policy is to provide investors a predictable, though not assured, level of cash flow, which can either serve as a stable income stream or, through reinvestment, contribute significantly to long-term total return.
We understand the importance that investors place on the stability of dividends and their ability to contribute to long-term total return, which is why we have instituted a level rate distribution policy for the Fund. Under the policy, monthly distributions paid may include net investment income, net realized short-term capital gains and, if necessary, return of capital. In addition, a limited number of distributions per calendar year may include net realized long-term capital gains. There is no guarantee that the Fund will realize capital gains in any given year. Distributions are subject to re-characterization for tax purposes after the end of the fiscal year. All shareholders with taxable accounts will receive written notification regarding the components and tax treatment for distributions via Form 1099-DIV.
Distributions from the Fund are generally subject to Federal income taxes. For purposes of maintaining the level rate distribution policy, the Fund may realize short-term capital gains on securities that, if sold at a later date, would have resulted in long-term capital gains. Maintenance of a level rate distribution policy may increase transaction and tax costs associated with the Fund.
Automatic Dividend Reinvestment Plan
Maximizing Investment with an Automatic Dividend Reinvestment Plan
The Automatic Dividend Reinvestment Plan offers a simple, cost-efficient and convenient way to reinvest your dividends and capital gains distributions in additional shares of the Fund, allowing you to increase your investment in the Fund.
Potential Benefits
• Compounded Growth: By automatically reinvesting with the Plan, you gain the potential to allow your dividends and capital gains to compound over time.
• Potential for Lower Commission Costs: Additional shares are purchased in large blocks, with brokerage commissions shared among all plan participants. There is no cost to enroll in the Plan.
• Convenience: After enrollment, the Plan is automatic and includes detailed statements for participants. Participants can terminate their enrollment at any time.
Pursuant to the Plan, unless a shareholder is ineligible or elects otherwise, all dividend and capital gains on common shares distributions are automatically reinvested by BNY Mellon Asset Servicing, as agent for shareholders in administering the Plan (“Plan Agent”), in additional common shares of the Fund. Shareholders who elect not to participate in the Plan will receive all dividends and distributions payable in cash paid by check mailed directly to the shareholder of record (or, if the shares are held in street or other nominee name, then to such nominee) by Plan Agent, as dividend paying agent. Shareholders may elect not to participate in the Plan and to receive all dividends and distributions in cash by sending written instructions to Plan Agent, as dividend paying agent, at: Dividend Reinvestment Department, P.O. Box 1958, Newark, New Jersey 07101-9774. Participation in the Plan is completely voluntary and may be terminated or resumed at any time without penalty by giving notice in writing to the Plan Agent; such termination will be effective with respect to a particular dividend or distribution if notice is received prior to the record date for the applicable distribution.
| CALAMOS GLOBAL DYNAMIC INCOME FUND SEMIANNUAL REPORT | 33 |
Automatic Dividend Reinvestment Plan
The shares are acquired by the Plan Agent for the participant’s account either (i) through receipt of additional common shares from the Fund (“newly issued shares”) or (ii) by purchase of outstanding common shares on the open market (“open-market purchases”) on the NYSE or elsewhere. If, on the payment date, the net asset value per share of the common shares is equal to or less than the market price per common share plus estimated brokerage commissions (a “market premium”), the Plan Agent will receive newly issued shares from the Fund for each participant’s account. The number of newly issued common shares to be credited to the participant’s account will be determined by dividing the dollar amount of the dividend or distribution by the greater of (i) the net asset value per common share on the payment date, or (ii) 95% of the market price per common share on the payment date.
If, on the payment date, the net asset value per common share exceeds the market price plus estimated brokerage commissions (a “market discount”), the Plan Agent has a limited period of time to invest the dividend or distribution amount in shares acquired in open-market purchases. The weighted average price (including brokerage commissions) of all common shares purchased by the Plan Agent as Plan Agent will be the price per common share allocable to each participant. If, the Plan Agent is unable to invest the full dividend amount in open-market purchases during the purchase period or if the market discount shifts to a market premium during the purchase period, the Plan Agent will cease making open-market purchases and will invest the uninvested portion of the dividend or distribution amount in newly issued shares at the close of business on the last purchase date.
The automatic reinvestment of dividends and distributions will not relieve participants of any federal, state or local income tax that may be payable (or required to be withheld) on such dividends even though no cash is received by participants.
There are no brokerage charges with respect to shares issued directly by the Fund as a result of dividends or distributions payable either in shares or in cash. However, each participant will pay a pro rata share of brokerage commissions incurred with respect to the Plan Agent’s open-market purchases in connection with the reinvestment of dividends or distributions. If a participant elects to have the Plan Agent sell part or all of his or her common shares and remit the proceeds, such participant will be charged his or her pro rata share of brokerage commissions on the shares sold, plus a $15 transaction fee. There is no direct service charge to participants in the Plan; however, the Fund reserves the right to amend the Plan to include a service charge payable by the participants.
A participant may request the sale of all of the common shares held by the Plan Agent in his or her Plan account in order to terminate participation in the Plan. If such participant elects in advance of such termination to have the Plan Agent sell part or all of his shares, the Plan Agent is authorized to deduct from the proceeds a $15.00 fee plus the brokerage commissions incurred for the transaction. A participant may re-enroll in the Plan in limited circumstances.
The terms and conditions of the Plan may be amended by the Plan Agent or the Fund at any time upon notice are required by the Plan.
This discussion of the Plan is only summary, and is qualified in its entirety to the Terms and Conditions of the Dividend Reinvestment Plan filed as part of the Fund’s registration statement.
For additional information about the Plan, please contact the Plan Agent, The Bank of New York, at 800.432.8224. If you wish to participate in the Plan and your shares are held in your own name, simply call the Plan Agent. If your shares are not held in your name, please contact your brokerage firm, bank, or other nominee to request that they participate in the Plan on your behalf. If your brokerage firm, bank, or other nominee is unable to participate on your behalf, you may request that your shares be re-registered in your own name.
We’re pleased to provide our shareholders with the additional benefit of the Fund’s Dividend Reinvestment Plan and hope that it may serve your financial plan.
| 34 | CALAMOS GLOBAL DYNAMIC INCOME FUND SEMIANNUAL REPORT |
This page intentionally left blank.
This page intentionally left blank.
 | STAY CONNECTED www.calamos.com | |
| Visit our website for timely fund performance, detailed fund profiles, fund news and insightful market commentary. | ||
MANAGING YOUR CALAMOS
FUNDS INVESTMENTS
FUNDS INVESTMENTS
Calamos Investments offers several convenient means to monitor, manage and feel confident about your Calamos investment choice.
PERSONAL ASSISTANCE: 800.582.6959
Dial this toll-free number to speak with a knowledgeable Client Services Representative who can help answer questions or address issues concerning your Calamos Fund.
YOUR FINANCIAL ADVISOR
We encourage you to talk to your financial advisor to determine how the Calamos Funds can benefit your investment portfolio based on your financial goals, risk tolerance, time horizon and income needs.
A description of the Calamos Proxy Voting Policies and Procedures and the Fund’s proxy voting record for the 12 month period ended June 30, 2010, are available free of charge upon request by calling 800.582.6959, by visiting the Calamos website at www.calamos.com, by writing Calamos at: Calamos Investments, Attn: Client Services, 2020 Calamos Court, Naperville, IL 60563. The Fund’s proxy voting record is also available free of charge by visiting the SEC website at http://www.sec.gov.
The Fund files its complete list of portfolio holdings with the SEC for the first and third quarters each fiscal year on Form N-Q . The Forms N-Q are available free of charge, upon request, by calling or writing Calamos Investments at the phone number or address provided above or by visiting the SEC website at http://www.sec.gov. You may also review or, for a fee, copy the forms at the SEC’s Public Reference Room in Washington, D.C. Information on the operation of the Public Reference Room may be obtained by calling 800.732.0330.
On June 21, 2010, the Fund submitted a CEO annual certification to the NYSE on which the Fund’s chief executive officer certified that he was not aware, as of that date, of any violation by the Fund of the NYSE’s corporate governance listing standards. In addition, the Fund’s report to the SEC on Form N-CSR contains certifications by the fund’s principal executive officer and principal financial officer as required by Rule 30a-2(a) under the 1940 Act, relating to, among other things, the quality of the Fund’s disclosure controls and procedures and internal control over financial reporting.
FOR 24 HOUR AUTOMATED SHAREHOLDER ASSISTANCE: 800.432.8224
TO OBTAIN INFORMATION ABOUT YOUR INVESTMENTS: 800.582.6959
VISIT OUR WEBSITE: www.calamos.com
INVESTMENT ADVISER:
Calamos Advisors LLC
2020 Calamos Court
Naperville, IL 60563-2787
2020 Calamos Court
Naperville, IL 60563-2787
CUSTODIAN AND FUND ACCOUNTING AGENT:
State Street Bank and Trust Company
225 Franklin Street
Boston, MA 02111
225 Franklin Street
Boston, MA 02111
TRANSFER AGENT:
The Bank of New York Mellon
P.O. Box 11258
Church Street Station
New York, NY 10286
800.524.4458
P.O. Box 11258
Church Street Station
New York, NY 10286
800.524.4458
INDEPENDENT REGISTERED PUBLIC ACCOUNTING FIRM:
Deloitte & Touche LLP
Chicago, IL
Chicago, IL
LEGAL COUNSEL:
K&L Gates LLP
Chicago, IL
Chicago, IL

2020 Calamos Court
Naperville, IL 60563-2787
800.582.6959
www.calamos.com
© 2011 Calamos Holdings LLC. All Rights Reserved.
Calamos® and Calamos Investments® are registered
trademarks of Calamos Holdings LLC.
CHWSAN 3083 2011
ITEM 2. CODE OF ETHICS.
Not applicable.
ITEM 3. AUDIT COMMITTEE FINANCIAL EXPERT.
Not applicable.
ITEM 4. PRINCIPAL ACCOUNTANT FEES AND SERVICES.
Not applicable.
ITEM 5. AUDIT COMMITTEE OF LISTED REGISTRANTS.
Not applicable.
ITEM 6. SCHEDULE OF INVESTMENTS
Included in the Report to Shareholders in Item 1.
ITEM 7. DISCLOSURE OF PROXY VOTING POLICIES AND PROCEDURES FOR CLOSED-END MANAGEMENT INVESTMENT COMPANIES.
Not applicable.
ITEM 8. PORTFOLIO MANAGERS OF CLOSED-END MANAGEMENT INVESTMENT COMPANIES.
Not applicable.
ITEM 9. PURCHASES OF EQUITY SECURITIES BY CLOSED-END MANAGEMENT INVESTMENT COMPANY AND AFFILIATED PURCHASERS.
Not applicable
ITEM 10. SUBMISSION OF MATTERS TO A VOTE OF SECURITY HOLDERS.
No material changes.
ITEM 11. CONTROLS AND PROCEDURES.
a) The registrant’s principal executive officer and principal financial officer have evaluated the registrant’s disclosure controls and procedures within 90 days of this filing and have concluded that the registrant’s disclosure controls and procedures were effective, as of that date, in ensuring that information required to be disclosed by the registrant in this Form N-CSR was recorded, processed, summarized, and reported timely.
b) There were no changes in the registrant’s internal controls over financial reporting (as defined in Rule 30a-3(d) under the Investment Company Act of 1940) that occurred during the second fiscal quarter of the period covered by this report that has materially affected, or is reasonably likely to materially affect, the registrant’s internal control over financial reporting.
ITEM 12. EXHIBITS.
(a)(1) Code of Ethics – Not applicable.
(a)(2)(i) Certification of Principal Executive Officer.
(a)(2)(ii) Certification of Principal Financial Officer.
SIGNATURES
Pursuant to the requirements of the Securities Exchange Act of 1934 and the Investment Company Act of 1940, the registrant has duly caused this report to be signed on its behalf by the undersigned, thereunto duly authorized.
Calamos Global Dynamic Income Fund
By: /s/ John P. Calamos, Sr.
Name: John P. Calamos, Sr.
Title: Principal Executive Officer
Date: June 24, 2011
Name: John P. Calamos, Sr.
Title: Principal Executive Officer
Date: June 24, 2011
By: /s/ Nimish S. Bhatt
Name: Nimish S. Bhatt
Title: Principal Financial Officer
Date: June 24, 2011
Name: Nimish S. Bhatt
Title: Principal Financial Officer
Date: June 24, 2011
Pursuant to the requirements of the Securities Exchange Act of 1934 and the Investment Company Act of 1940, this report has been signed by the following persons on behalf of the registrant and in the capacities and on the dates indicated.
By: /s/ John P. Calamos, Sr.
Name: John P. Calamos, Sr.
Title: Principal Executive Officer
Date: June 24, 2011
Name: John P. Calamos, Sr.
Title: Principal Executive Officer
Date: June 24, 2011
By: /s/ Nimish S. Bhatt
Name: Nimish S. Bhatt
Title: Principal Financial Officer
Date: June 24, 2011
Name: Nimish S. Bhatt
Title: Principal Financial Officer
Date: June 24, 2011