 Investment Outlook September, 2010 Kevin E. Grant, CFA President & CEO Exhibit 99.1 |
 1 Forward Looking Statements This presentation contains forward-looking statements, within the meaning of Section 27A of the Securities Act of 1933, as amended, and Section 21E of the Securities Exchange Act of 1934, as amended, that are based on management’s beliefs and assumptions, current expectations, estimates and projections. Such statements, including information relating to the Company’s expectations for future financial performance, are not considered historical facts and are considered forward-looking information under the federal securities laws. This information may contain words such as “believes,” “plans,” “expects,” “intends,” “estimates” or similar expressions. This information is not a guarantee of the Company’s future performance and is subject to risks, uncertainties and other important factors that could cause the Company’s actual performance or achievements to differ materially from those expressed or implied by this forward-looking information and include, without limitation, changes in the market value and yield of our assets, changes in interest rates and the yield curve, net interest margin, return on equity, availability and terms of financing and hedging and various other risks and uncertainties related to our business and the economy, some of which are described in our filings with the SEC. Given these uncertainties, you should not rely on forward-looking information. The Company undertakes no obligations to update any forward-looking information, whether as a result of new information, future events or otherwise. |
 2 CYS Overview Agency Residential Mortgage Backed Securities Kevin Grant, CEO, President, Chairman Frances Spark, CFO Pay dividends and achieve capital appreciation throughout changing interest rate and credit cycles Be the most efficient Agency REIT in the market Currently financing lines with 27 lenders Swap agreements with 11 counterparties Company intends to distribute all or substantially all of its REIT taxable income Scaled Management Fee: 1.0% to 1.5% No Incentive Fee Target Assets Objective Senior Management Focus on Cost Efficiency Ample Financing Sources Dividend Policy A Real Estate Investment Trust formed in January 2006 |
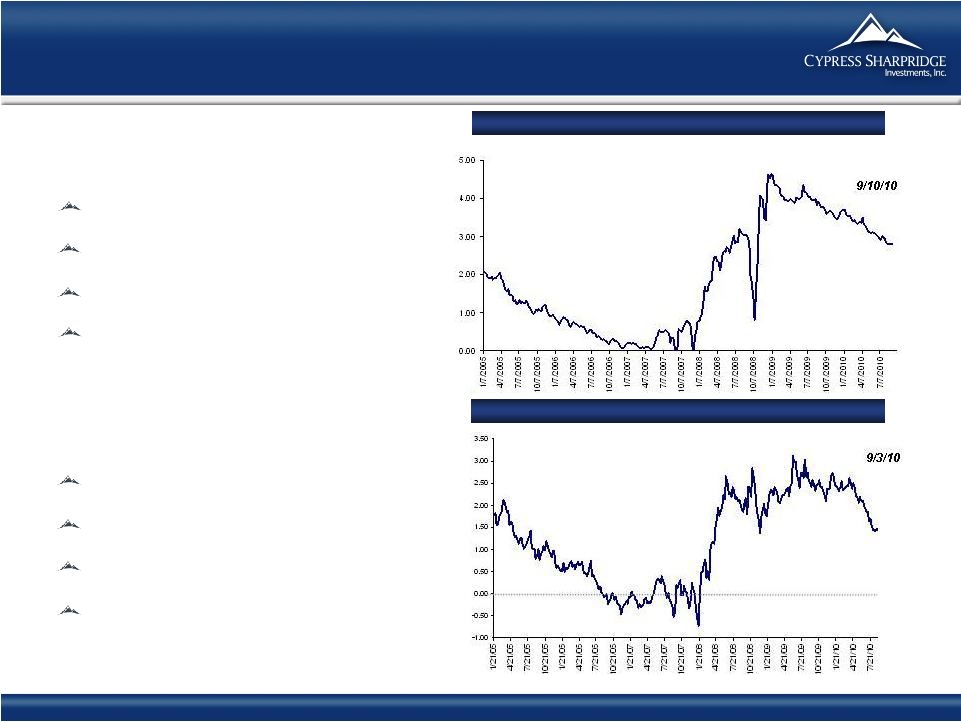 3 Attractive Environment Likely to Persist Source: Bloomberg. (1) As of September 10, 2010 5/1 Hybrid Net Interest Margin: 1/05 – 9/10 5 Year Swap vs 1 Month LIBOR: 1/05 – 9/10 Mortgage Yields Currently Attractive Par-Priced 5/1 hybrid rates now 3.10 (1) 30 Year fixed rates now 3.75% (1) 15 Year fixed rates now 3.25% (1) Hedging rates at all-time lows Steep Curve Creates significant positive carry Significant ROE Hedge flexibility very important No signs of inflation |
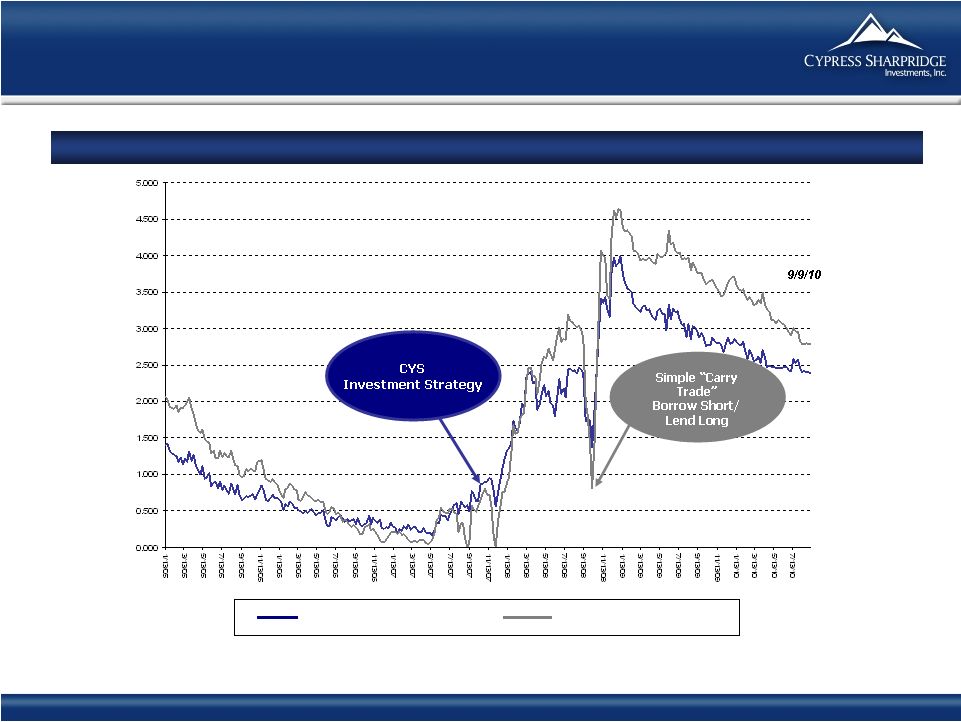 4 Wide Spreads Create Good Environment 5/1 Hybrids Hedged with Swaps: 1/05 – 9/10 Hedged Hybrids (i) Unhedged Hybrids (ii) Source: Bloomberg. Note: Spreads calculated as: (i) 5/1 Hybrids Index – 50/50 3-Year Swaps/LIBOR, and (ii) 5/1 Hybrids Index – 1-Month LIBOR Index. |
 5 0 5 10 15 20 25 30 35 0 5 10 15 20 25 30 35 40 45 50 10 Year Treasury Note Auctions 11/98 – 8/10 Treasury Auction Volume Exploding 2 Year Treasury Note Auctions 2/00 – 8/10 3 Year Treasury Note Auctions 2/00 – 8/10 Source: Bloomberg, US Treasury 5 Year Treasury Note Auctions 2/00 – 8/10 7 Year Treasury Note Auctions 2/00 – 8/10 30 Year Treasury Note Auctions 2/00 – 8/10 0 5 10 15 20 25 30 35 40 45 0 5 10 15 20 25 30 35 40 45 0 5 10 15 20 25 30 0 2 4 6 8 10 12 14 16 18 |
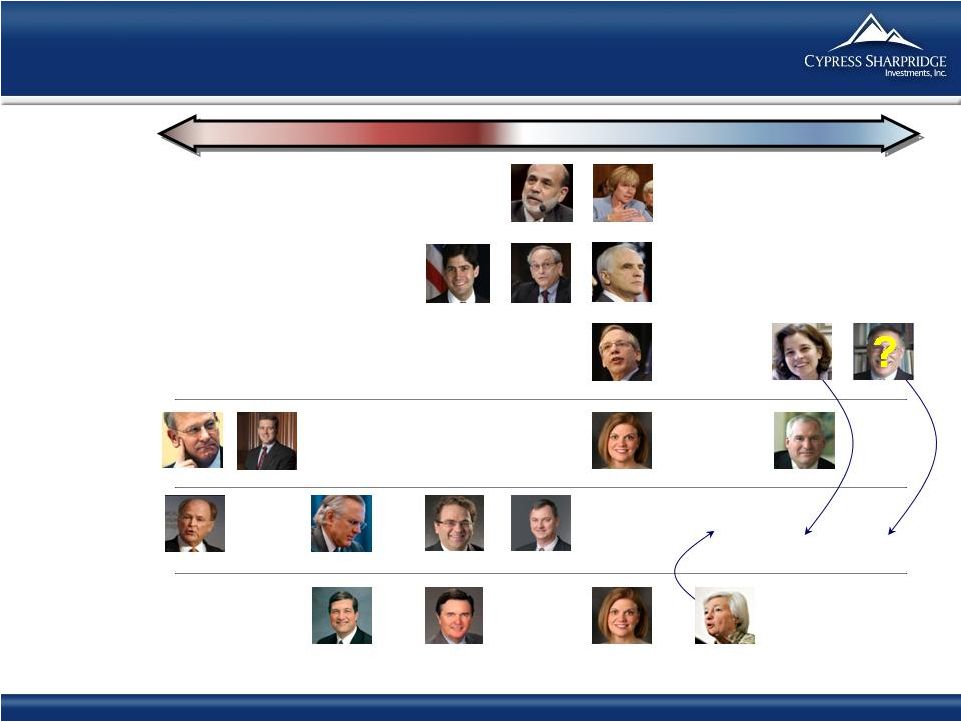 Hawkish Dovish Neutral Hoenig Bullard Plosser Fisher Lacker Duke Tarullo Evans Dudley Pianalto Warsh Kohn Kocherlakota Lockhart Pianalto Yellen Rosengren Raskin Diamond Bernanke Obama Nominees Governors 2010 Voters 2011 Voters 2012 Voters Source: Bank of America Merrill Lynch, Bloomberg, Wall Street Journal, Indiana University, Marketwatch, Thomson Reuters, Federal Reserve Bank of Atlanta, Federal Reserve Bank of Chicago, Federal Reserve Bank of Cleveland, Maryland Consumer Rights Coalition, Boston Globe, Businessweek, Newsweek, Washington Post, CNBC. Fed Board to Become More Dovish 6 |
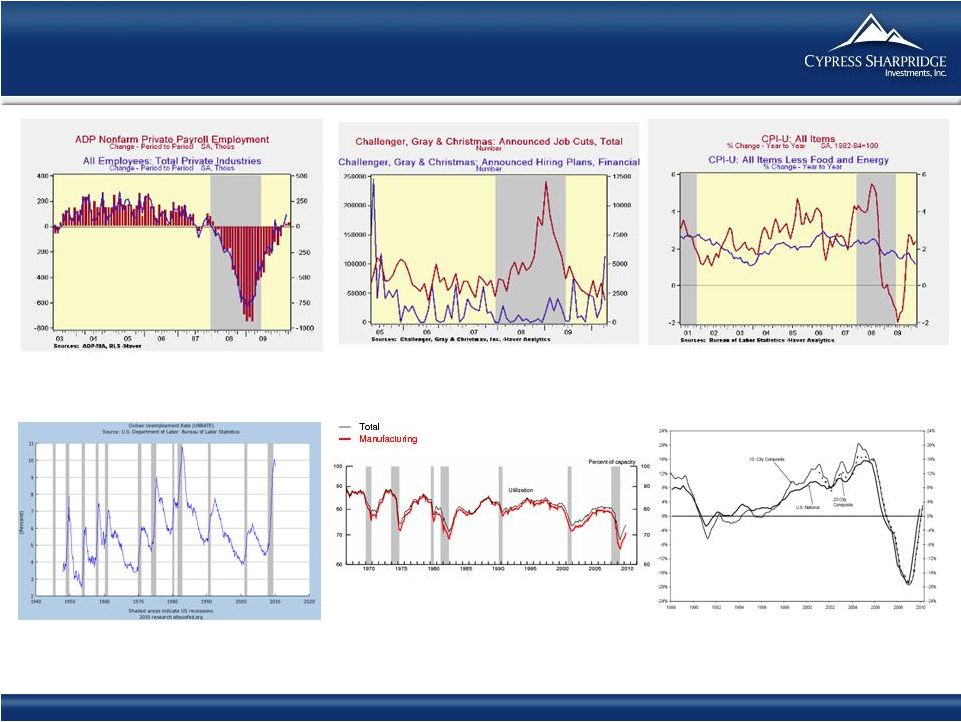 S&P/Case-Shiller U.S. National Home Price Indices 1988 – Present % Change - Year to Year Capacity Utilization: Manufacturing 1968 – Present % Unemployment Rate 1940-present % Economic Recovery Below Normal Pace 7 Source: S&P, Fiserv, and Macromarkets LLC / Haver Analytics, BLS |
 8 15 Year MBS Exhibit Superior Stability Projected Average Life Slow Prepay Environment (years) Fast Prepay Environment (years) 30 year Fixed 9.18 3.45 5/1 Hybrid 9.18 3.45 15 Year 4.08 2.72 |
 9 Source: Bloomberg, Bank of America Loan size: $280k (30 Year), $275k (Hybrid), and $226k (15 Year) Homeowner Savings 15 Year Mortgages Exhibit Low Prepayment Volatility Security Original Rate Current Environment Current Payment New Payment Monthly Savings 30 Year 5% 5.50% 4.25 1,589 1,377 212 5 x 1 Hybrid ARM 5.125% 3.50 1,497 263 263 15 Year 4.5% 5.00% 3.75 1,787 1,643 144 Refi Incentive |
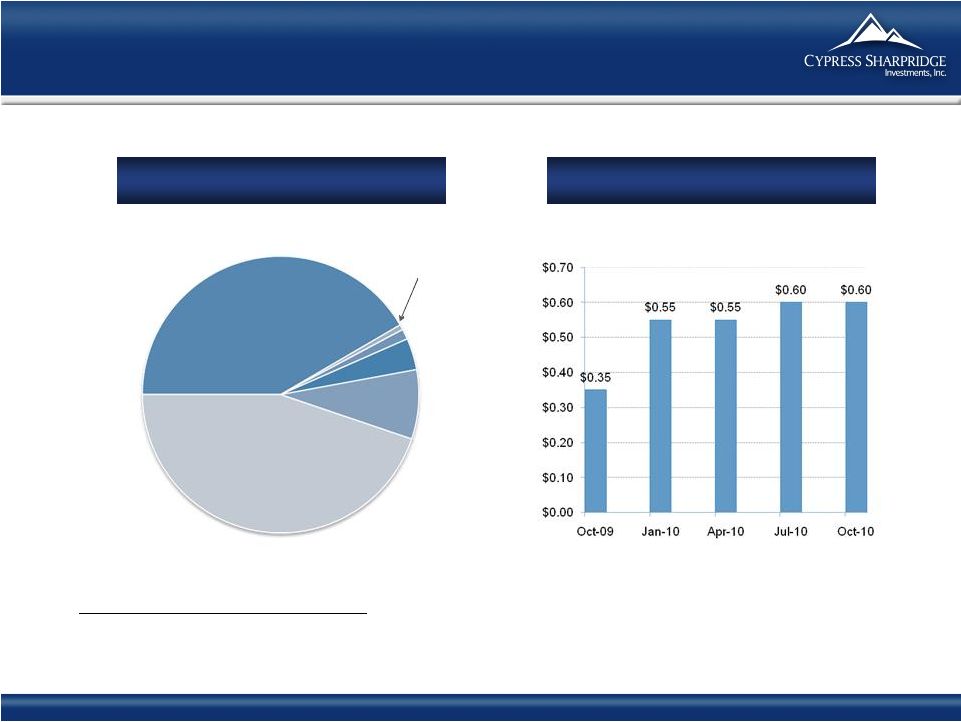 10 CYS Dividends: 10/09 – 9/10 Portfolio Composition and Results CYS Portfolio Total Assets: $2,297,490 15 Year Fixed ( 41.6%) CLO and Resix (0.6%) 30 Yr Fixed (1.2%) 20 Yr Fixed (3.7%) Short Reset Arms (8.1%) Hybrid Arms (44.8%) 1 2 1) As of June 30, 2010 2) CYS paid quarterly dividends of $0.35 per share of common stock on October 21, 2009, $0.55 per share of common stock on January 27, 2010 and April 28, 2010, and $0.60 per share of common stock on July 28, 2010. On September 9, 2010, CYS declared a quarterly dividend of $0.60 per share of common stock for the third quarter of 2010. The dividend will be paid on October 20, 2010 to stockholders of record on September 20, 2010. |
 History of Transparent and Consistent Financial Reporting CYS uses Financial Reporting for Investment Companies CYS financial reporting – Best in Class Schedule of investments NAVs have reflected mark-to-market accounting since inception No OCI account on balance sheet Realized and unrealized losses taken through income statement Losses expensed in period incurred Competitors likely to move closer to CYS’ financial reporting standards when FASB declares SOP 07-1 effective Potential to create meaningful adjustments for the other companies 11 |
 12 Historical Financials (1) Net income excluding net realized gain (loss) on investments and swap contracts and net unrealized appreciation (depreciation) on investments and swap contracts. (2) Calculated by dividing total interest income from Agency RMBS by average Agency RMBS. (3) Calculated by dividing total interest expense, including net swap interest income (expense) by average repurchase agreements. (4) Calculated by subtracting average cost of funds & hedge from average yield on Agency RMBS. (5) Calculated by dividing total liabilities by net assets. 6/30/2010 3/31/2010 Income Statement Data Investment Income – Interest Income $17,265.3 $16,936.9 Total expenses 3,167.1 3,217.8 Net Investment Income 14,098.2 13,719.1 Net gain (loss) from investments 32,367.7 6,464.3 Net gain (loss) from swap contracts (18,860.4) (10,040.2) Net Income (Loss) $27,605.5 $10,143.2 Net Income (Loss) Per Common Share (diluted) $1.46 $0.54 Distributions per Common Share $0.60 $0.55 Non-GAAP Measure Core Earnings (1) $10,960.3 $10,424.7 Non-GAAP Reconciliation NET INCOME $27,605.5 $10,143.2 Net (gain) loss from investments ($32,367.7) ($6,464.3) Net (gain) loss from termination of swap contracts $17,205.5 - Net unrealized (appreciation) depreciation on swap contracts ($1,483.0) $6,745.8 Core Earnings $10,960.3 $10,424.7 Balance Sheet Data Cash and Cash Equivalents $140,625.1 $775.7 Total Assets $2,447,676.9 $1,840,877.9 Repurchase Agreements $1,447,600.1 $1,487,589.2 Net assets $390,551.8 $244,446.2 Net assets per common share $13.15 $13.03 Key Portfolio Statistics Average Yield on Agency RMBS (3) 3.98% 3.86% Average Cost of Funds & Hedge (4) 1.15% 1.14% Interest Rate Spread Net of Hedge (5) 2.83% 2.72% Leverage Ratio (at period end) (6) 5.3:1 6.5:1 Quarter Ended |
 13 Financial Highlights Steep yield curve and attractive spreads in target assets Tailwinds likely to continue Reinvestment needs relatively low Non-Agency assets recovering Investment Company accounting provides transparency |
 Kevin E. Grant, CFA President & CEO Investment Outlook September, 2010 |