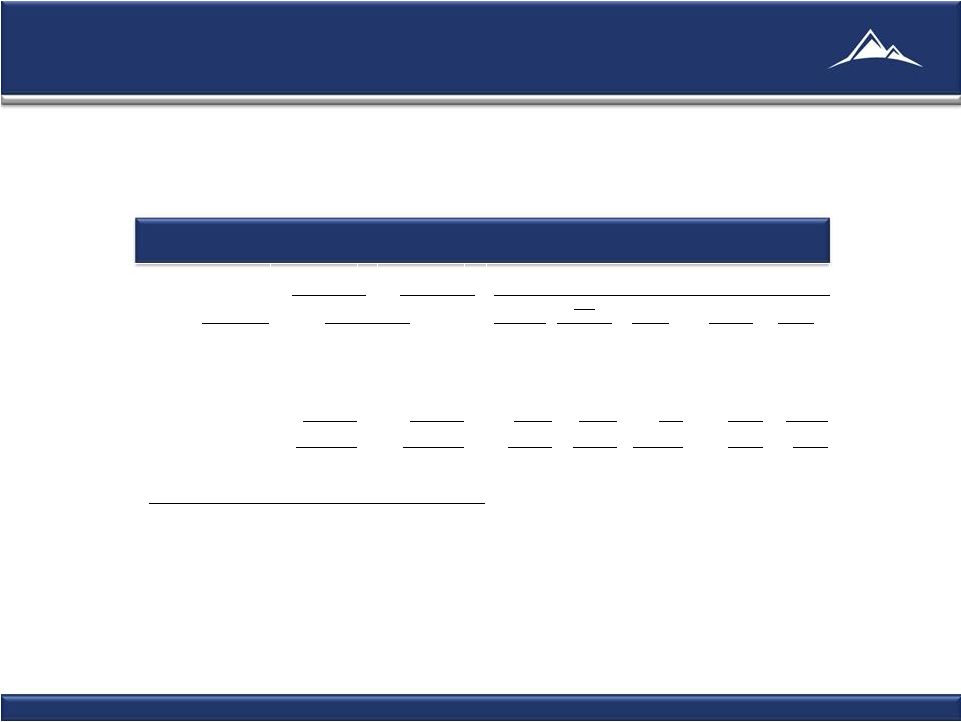
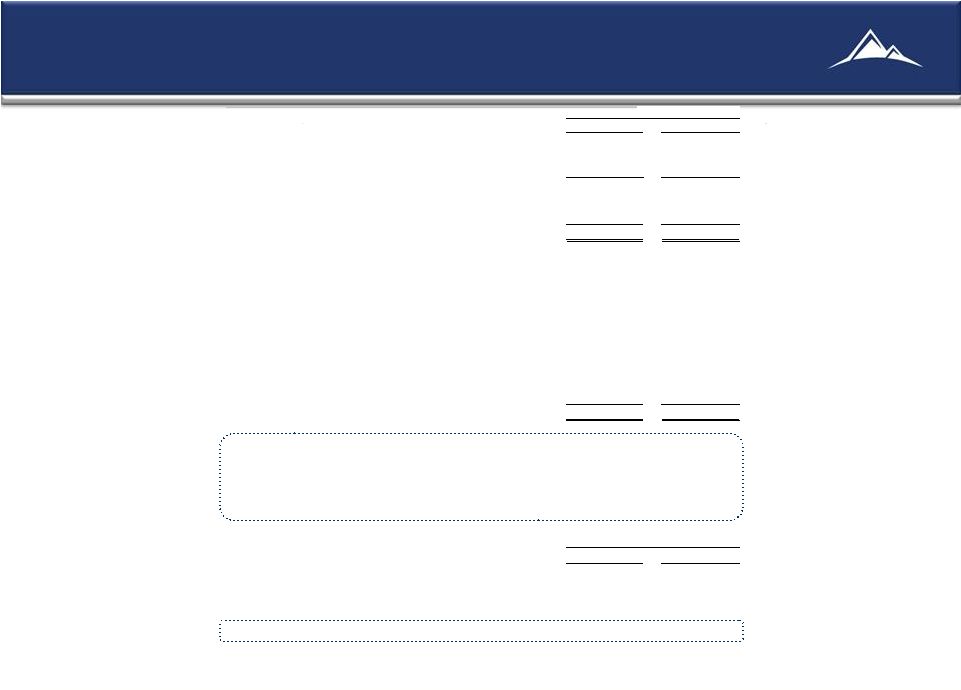
13 Historical Financials 3/31/2011 12/31/2010 Income Statement Data (in 000's) Investment Income – Interest Income $40,980 $25,025 Total expenses 7,522 5,306 Net Investment Income 33,458 19,719 Net gain (loss) from investments 19,820 (66,125) Net gain (loss) from swap and cap contracts (1,181) 29,138 Net Income (Loss) $52,097 ($17,268) Net Income (Loss) Per Common Share (diluted) $0.74 ($0.38) Distributions per Common Share $0.60 $0.60 Non-GAAP Measure (in 000's) Core Earnings (1) $21,599 $12,396 Non-GAAP Reconciliation (in 000's) NET INCOME $52,097 (17,268) Net (gain) loss from investments (19,820) $66,125 Net (gain) loss on termination of swap contracts - $13,427 Net unrealized (appreciation) depreciation on swap and cap contracts ($10,678) ($49,888) Core Earnings $21,599 $12,396 Key Portfolio Statistics* Average Yield on Agency RMBS (2) 3.27% 3.23% Average Cost of Funds & Hedge (3) 1.44% 1.49% Interest Rate Spread Net of Hedge (4) 1.83% 1.74% Operating Expanse Ratio (5) 2.11% 2.28% Leverage Ratio (at period end) (6) 8.1:1 8.3:1 Balance Sheet Data (in 000's) 3/31/2011 12/31/2010 Cash and Cash Equivalents $6,001 $1,510 Total Assets $8,787,632 $6,389,267 Repurchase Agreements $5,364,030 $3,443,843 Net assets $969,266 $690,339 Net assets per common share $11.74 $11.59 Quarter Ended As of (1) Core Earnings is defined as net income (loss) excluding net realized gain (loss) on investments, net unrealized appreciation (depreciation) on investments, net realized gain (loss) on termination of swap contracts and unrealized appreciation (depreciation) on swap and cap contracts. (2) Our average yield on Agency RMBS for the period was calculated by dividing our interest income from Agency RMBS by our average Agency RMBS. (3) Average cost of funds and hedge for the period was calculated by dividing our total interest expense, including our net swap and cap interest income (expense), by our average repurchase agreements. (4) Interest rate spread net of hedge for the period was calculated by subtracting our average cost of funds and hedge from our average yield on Agency RMBS (5) Operating expense ratio is calculated by dividing operating expenses by average net assets (6) Leverage ratio was calculated by dividing total liabilities by net assets * All percentages are annualized. |