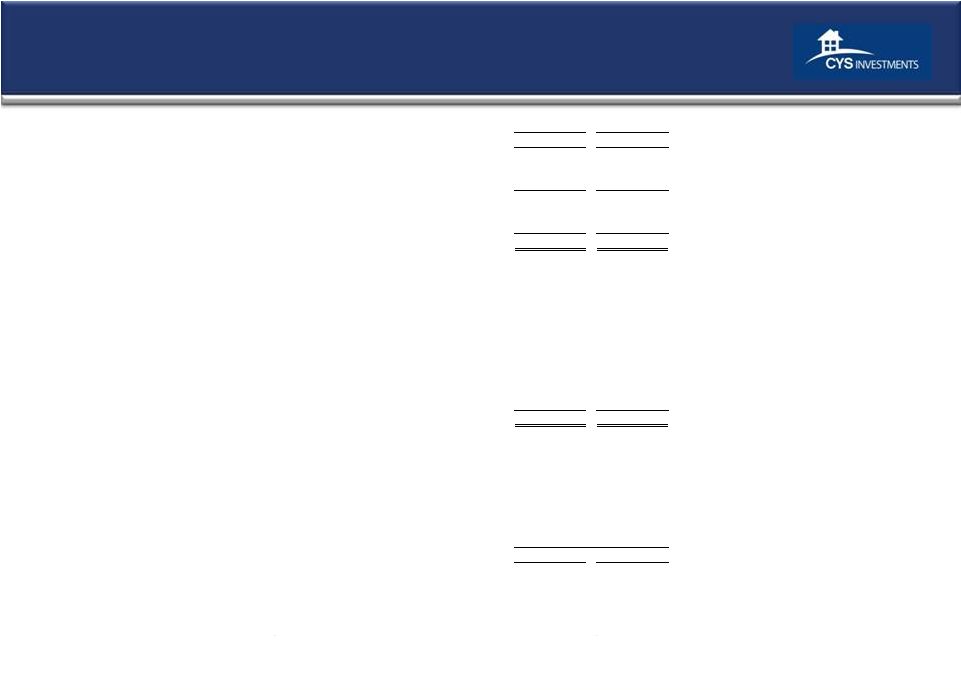
15 Historical Financials 12/31/2011 9/30/2011 Income Statement Data (in 000's) Investment Income – Interest Income $61,631 $64,566 Total expenses 10,510 14,610 Net Investment Income $51,121 $49,956 Net gain (loss) from investments (8,587) 120,959 Net gain (loss) from swap and cap contracts 1,559 (74,594) Net Income $44,093 $96,321 Net Income Per Common Share (diluted) $0.53 $1.16 Distributions per Common Share $0.50 $0.55 Non-GAAP Measure (in 000's) Core Earnings (1) $37,836 $34,487 Non-GAAP Reconciliation NET INCOME $44,093 $96,321 Net (gain) loss from investments 8,587 (120,959) Net (gain) loss on termination of swap contracts 1,411 - Net unrealized (appreciation) depreciation on swap and cap contracts (16,255) 59,125 Core Earnings $37,836 $34,487 Key Portfolio Statistics* Average yield on Agency RMBS (2) 2.81% 3.02% Average cost of funds and hedge (3) 1.01% 1.07% Interest rate spread net of hedge (4) 1.80% 1.95% Operating expense ratio (5) 1.53% 2.33% Leverage ratio (at period end) (6) 7.7:1 7.7:1 Three Months Ended Balance Sheet Data (in 000's) 12/31/2011 9/30/2011 Cash and Cash Equivalents $11,508 $7,180 Total Assets $9,518,057 $9,540,317 Repurchase Agreements $7,880,814 $7,540,669 Net assets $1,077,458 $1,074,207 Net assets per common share $13.02 $12.98 As of (in 000's) (1) Core Earnings is defined as net income (loss) excluding net realized gain (loss) on investments, net unrealized appreciation (depreciation) on investments, net realized gain (loss) on termination of swap contracts and unrealized appreciation (depreciation) on swap and cap contracts. (2) Our average yield on Agency RMBS for the period was calculated by dividing our interest income from Agency RMBS by our average Agency RMBS. (3) Our average cost of funds and hedge for the period was calculated by dividing our total interest expense, including our net swap and cap interest income (expense), by our average repurchase agreements. (4) Our interest rate spread net of hedge for the period was calculated by subtracting our average cost of funds and hedge from our average yield on Agency RMBS. (5) Our operating expense ratio is calculated by dividing operating expenses by average net assets. (6) Our leverage ratio was calculated by dividing (i) the Company’s repurchase agreements balance plus payable for securities purchased minus receivable for securities sold (ii) by net assets. * All percentages are annualized. |