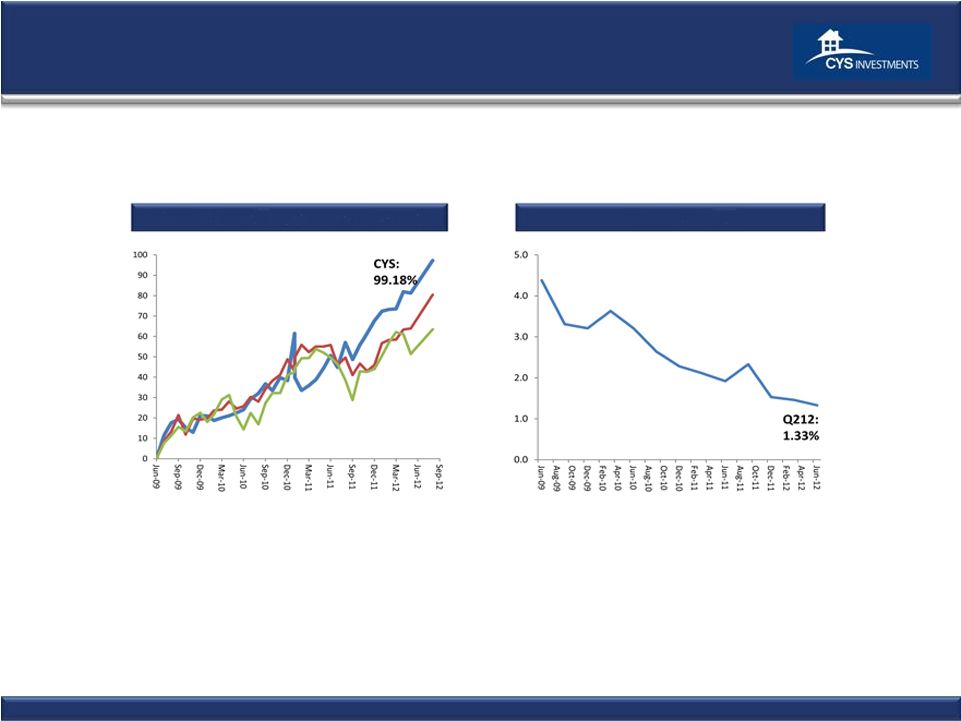
Historical Financials (1) Core Earnings is defined as net income (loss) excluding net gain (loss) on investments, net realized gain (loss) on termination of swap contracts and unrealized appreciation (depreciation) on swap and cap contracts. (2) Our average yield on Agency RMBS for the period was calculated by dividing our interest income from Agency RMBS by our average Agency RMBS. (3) Our average cost of funds and hedge for the period was calculated by dividing our total interest expense, including our net swap and cap interest income (expense), by our average repurchase agreements. (4) Our interest rate spread net of hedge for the period was calculated by subtracting our average cost of funds and hedge from our average yield on Agency RMBS. (5) Our operating expense ratio is calculated by dividing operating expenses by average net assets. (6) Our leverage ratio was calculated by dividing (i) the Company’s repurchase agreements balance plus payable for securities purchased minus receivable for securities sold by (ii) net assets. * All percentages are annualized. 20 Three Months Ended 6/30/2012 3/31/2012 Income Statement Data (in 000's) Investment Income – Interest Income $71,747 $65,369 Total expenses 14,272 11,972 Net Investment Income 57,475 53,397 Net gain (loss) from investments 61,113 33,150 Net gain (loss) from swap and cap contracts (24,356) (17,429) Net Income $101,705 $69,118 Net Income Per Common Share (diluted) $0.87 $0.66 Distributions per Common Share $0.50 $0.50 Non-GAAP Measure (in 000's) Core Earnings (1) $44,788 $41,891 Non-GAAP Reconciliation (in 000's) NET INCOME $101,705 $69,118 Net (gain) loss from investments (68,586) (33,150) Net (gain) loss on termination of swap contracts -- -- Net unrealized (appreciation) depreciation on swap and cap contracts 11,669 5,923 Core Earnings $ 44,788 $ 41,891 Core Earnings per Common Share (diluted) $ 0.38 $ 0.39 Three Months Ended 6/30/2012 3/31/2012 Key Portfolio Statistics* Average yield on Agency RMBS (2) 2.62% 2.78% Average cost of funds and hedge (3) 0.91% 0.90% Interest rate spread net of hedge (4) 1.71% 1.88% Operating expense ratio (5) 1.33% 1.46% Leverage ratio (at period end) (6) 7.6:1 7.7:1 As of Balance Sheet Data (in 000's) 6/30/2012 3/31/2012 Cash and Cash Equivalents $13,486 $10,643 Total Assets $14,623,128 $13,555,905 Repurchase Agreements $9,763,313 $8,234,669 Net assets $1,629,854 $1,525,792 Net assets per common share $13.52 $13.14 |