| UNITED STATES | |
| SECURITIES AND EXCHANGE COMMISSION | |
| Washington, D.C. 20549 | |
| FORM N-CSR | |
| CERTIFIED SHAREHOLDER REPORT OF REGISTERED | |
| MANAGEMENT INVESTMENT COMPANIES | |
| Investment Company Act file number 811- 22056 | |
| John Hancock Tax-Advantaged Global Shareholder Yield Fund | |
| (Exact name of registrant as specified in charter) | |
| 601 Congress Street, Boston, Massachusetts 02210 | |
| (Address of principal executive offices) (Zip code) | |
| Alfred P. Ouellette | |
| Senior Counsel and Assistant Secretary | |
| 601 Congress Street | |
| Boston, Massachusetts 02210 | |
| (Name and address of agent for service) | |
| Registrant's telephone number, including area code: 617-663-4324 | |
| Date of fiscal year end: | October 31 |
| Date of reporting period: | October 31, 2007 |
| ITEM 1. REPORT TO SHAREHOLDERS. | |

CEO corner
| TABLE OF CONTENTS |
| Your fund at a glance |
| page 1 |
| Managers' report |
| page 2 |
| Fund's investments |
| page 6 |
| Financial statements |
| page 10 |
| Notes to financial |
| statements |
| page 14 |
| Trustees and officers |
| page 29 |
| For more information |
| page 36 |
To Our Shareholders,
Volatility returned to the U.S. stock market in the 12-month period ended October 31, 2007; however, stocks still posted a strong gain of 14.56%, as measured by the Standard & Poor's 500 Index. The market experienced a particularly sharp downturn in August, as the subprime mortgage market's woes increased. Rising defaults and an ensuing credit crunch caused heightened fears about their potential impact on U.S. economic growth. Foreign markets felt some ripple effects from the subprime issue, but they continued nonetheless to benefit from solid economic growth and outperformed the U.S. market in this period.
During this period of volatility, the U.S. stock market also passed a signifi-cant milestone - the broad Standard & Poor's 500 Index climbed beyond the record it had set seven years ago. From its peak in March 2000, the stock market spiraled downward three consecutive years, bottoming in 2002. The upturn began in 2003, and the market has advanced each year since, finally setting a new high for the first time on May 30, 2007. During that period, the S&P 500 Index experienced five significant short-term sell-offs of 6% or more, with the August subprime-induced meltdown being the most recent.
This nearly complete market cycle highlights the importance of two investment principles you have heard us speak of often: diversification and patience. By allocating your investments among different asset classes, investment styles and portfolio managers, you are likely to be well represented through all phases of a complete market cycle, with the winners helping to cushion the fall of the losers.
The challenge for investors with a diversified portfolio is to properly evaluate your investments to tell the difference between an underperforming manager and an out-of-favor style, while also understanding the role each investment plays in your portfolio. That's where your financial professional can provide true value. He or she can help you make those assessments and also counsel patience, because a properly diversified portfolio by its very nature will typically have something lagging or out of favor - a concept that can be difficult to live with, but necessary to embrace. If everything in your portfolio is "working," then you are not truly diversified, but rather are leveraged to the current market and the flavor of the day. If so, you are bound to be out of step in the near future.
The recent volatility in the securities markets has prompted many investors to question how long this type of market cycle will last. History tells us it will indeed end and that when it does, today's leaders may well turn into laggards and vice versa. The subprime mortgage market woes are just the latest example of why investors should be both patient and well-diversified. For with patience and a diversified portfolio, it could be easier to weather the market's twists and turns and reach your long-term goals.
Sincerely,

| Keith F. Hartstein, President and Chief Executive Officer |
This commentary reflects the CEO's views as of October 31, 2007. They are subject to change at any time.
Your fund at a glance
The Fund seeks to provide total return consisting of a high level of current income and gains and long-term capital appreciation. The Fund will seek to achieve favorable after-tax returns by seeking to minimize the federal income tax consequences on income and gains generated. Under normal market circumstances, the Fund will invest at least 80% of its total assets in a diversified portfolio of dividend-paying stocks located throughout the world.
Since inception
► Stocks performed well despite the U.S. housing slowdown and subprime credit crunch; global economic growth remained healthy.
► We invest in companies throughout the world with a history of attractive dividend yields and positive growth in free cash flow to provide tax-advantaged income and capital appreciation potential in a globally diversified portfolio.
► Many of the portfolio's leading contributors to return were telecommunication firms, while a number of notable detractors were consumer discretionary stocks sensitive to a slowdown in the U.S. economy.
John Hancock Tax-Advantaged Global Shareholder Yield Fund
Fund performance from inception September 26, 2007, through October 31, 2007.
The total returns for the Fund include the reinvestment of all distributions. The performance data contained within this material represents past performance, which does not guarantee future results.
Top 10 issuers
| Southern Co. | 3.9% | ONEOK, Inc. | 2.1% | ||
| General Electric Co. | 2.6% | UST, Inc. | 2.1% | ||
| Vodafone Group PLC | 2.2% | National Grid PLC | 2.1% | ||
| Fairfax Media Ltd. | 2.2% | Enel SpA | 2.1% | ||
| Terna Rete Elettrica Nazionale | 2.1% | Altria Group, Inc. | 2.1% | ||
As a percentage of net assets on October 31, 2007.
1
Managers' report
John Hancock
Tax-Advantaged Global Shareholder Yield Fund
Stocks managed solid returns during the brief reporting period from the Fund's September 26, 2007, inception to its October 31, 2007, annual reporting date. For the period, the S&P/Citigroup Broad Market Index-World Equity Index rose 4.54% . Stock returns were powered by rate cuts and signs of central bank support to limit the impact of the summer credit crisis on global growth.
Indeed, tighter credit standards and lower home prices called into question future growth estimates for the United States economy. As a result, U.S. stocks were among the poorest-performing segments of the World Equity Index. But despite concern about the United States, economies in Europe and Asia appeared to be healthy. Rapid growth was also evident among many emerging-market countries, which are benefiting from internally driven growth and higher prices for their commodity exports. As a result, emerging-market shares outperformed those of developed economies for the brief period.
Performance
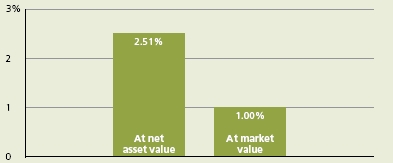
From the Fund's September 26, 2007, inception to October 31, 2007, John Hancock Tax-Advantaged Global Shareholder Yield Fund posted total returns of 2.51% at net asset value (NAV) and 1.00% at market value. The difference in the Fund's NAV performance and its market
SCORECARD
| INVESTMENT | PERIOD'S PERFORMANCE... AND WHAT'S BEHIND THE NUMBERS | |
| France Telecom | ▲ | Distributor of iPhone in France continued expansion into |
| emerging markets | ||
| Vodafone Group | ▲ | World's leading mobile phone provider enjoying strong growth in |
| emerging markets | ||
| GateHouse Media | ▼ | Performance hurt by reduced valuations in the economically sensitive |
| newspaper publishing sector |
2
| From the Portfolio Management Teams Epoch Investment Partners, Inc. Analytic Investors, Inc. |
performance stems from the fact that the market share price is subject to the dynamics of secondary market trading, which could cause it to trade at a discount or premium to the Fund's NAV share price at any time.
The Fund's performance compares with the 4.54% return of the S&P/Citigroup Broad Market Index-World Equity Index and the 5.14%return of the average closed-end world stock fund tracked by Morningstar, Inc. The Fund trailed its benchmark and the Morningstar peer group average because our investment strategy leads us to higher-quality, dividend-paying, often defensive-type stocks, which trailed the higher-risk names that performed well in the wake of the Federal Reserve'sinterest rate cuts. Also keep in mind that your net asset value return will be different from the Fund's performance if you were not invested for the entire period and did not reinvest all Fund distributions.
| "Stocks managed solid returns during the brief reporting period from the Fund's September 26, 2007, inception to its October 31, 2007, annual reporting date." |
Process
Our goal is to give shareholders a globally diversified portfolio offering an attractive yield and growth potential in a tax-advantaged investment vehicle. To do that, we combine an underlying portfolio of attractively valued dividend-paying stocks with a strategy of writing (selling) call options on stock indexes to generate additional income. We believe this is a compelling investment strategy in an environment where earnings growth and dividends are likely to represent a larger portion of equity returns going forward. That's because we believe the contribution to return from price/earnings multiple expansion (the third component of stock returns) is likely to diminish over time given the prevailing economic and interest rate backdrop.
Tax-Advantaged Global Shareholder Yield Fund
3
In terms of the stocks in the underlying portfolio, we search the globe for firms generating strong free cash flow that is used to maximize shareholder yield through dividend payouts, share buybacks or debt pay-downs.
With respect to the options component, we write (sell) calls on stock indexes - by which we receive additional cash flow from the options premium, with the trade-off of less participation in the index's future appreciation potential. We believe this is an attractive way to enhance yield while still retaining the potential for some price appreciation because our calls cover less than 50% of the value of the portfolio, and we carefully manage the call option's strike price with the goal of maximizing our options premium income. We also enhance portfolio yield by using dividend rolls, which involves buying and selling dividend paying stocks around their ex-dividend dates to capture their income payouts.
| "Our goal is to give shareholders a globally diversified portfolio offering an attractive yield and growth potential in a tax-advantaged investment vehicle." |
Leading detractors
Looking at the portfolio, stocks sensitive to the health of the U.S. consumer underperformed. Examples of this in the portfolio include Idearc, Inc., a telephone directory business, and GateHouse Media, Inc., a local newspaper publishing concern, both of which struggled on concerns related to future advertising spending. Despite their decline in price, we believe the stocks are attractive for their cash flow generation and that they will continue to make their projected dividend payments.
Key contributors
The portfolio's focus on free cash flow and dividend yield naturally points it toward telecommunication services, which was home to several of the portfolio's leading contributors to return, including Vodafone Group PLC and France Telecom SA. Generally speaking, these companies are attractive because of their strong free cash flow and significant dividend payments.
| SECTOR DISTRIBUTION1 | |
| Telecommunication | |
| services | 20% |
| Utilities | 20% |
| Energy | 14% |
| Financials | 8% |
| Industrials | 8% |
| Consumer discretionary | 7% |
| Consumer staples | 7% |
| Materials | 6% |
| Health care | 5% |
| Information technology | 4% |
Tax-Advantaged Global Shareholder Yield Fund
4
Options component detracted
The options component detracted from performance during the period, led by written calls on precious metals stocks, whose index prices rose higher than the strike price we contracted for, so we needed to pay out some of the options income to settle our options position. Our calls on large-cap cyclical stocks and small- and mid-cap shares were the largest positive contributors. It's also worth noting that the sharp increase in volatility in the market in recent months means that the Fund is likely to have greater flexibility and more opportunities to meet its yield objectives going forward, because option premiums typically are greater in volatile markets.
Outlook
Going forward, we expect an increase in home loan defaults and foreclosures in the U.S. to lead to tighter lending standards and declining consumer sentiment. This is likely to weigh on consumer spending, the job market and, ultimately, on U.S. economic growth. Against that backdrop, we would expect financial market volatility to continue. But while U.S. growth is likely to slow, the global economy appears on solid footing. Regional economies are growing at a healthy clip, and rising living standards for literally billions of people around the globe remain a key support for growth going forward. It is our belief that a global focus on high-quality companies with superior shareholder yield characteristics - abundant free cash flow with a history of creating shareholder value - can give positive performance in these uncertain times.

This commentary reflects the views of the portfolio managers through the end of the Fund's period discussed in this report. The managers' statements reflect their own opinions. As such, they are in no way guarantees of future events and are not intended to be used as investment advice or a recommendation regarding any specific security. They are also subject to change at any time as market and other conditions warrant.
International investing involves special risks such as political, economic and currency risks and differences in accounting standards and financial reporting.
1 As a percentage of net assets on October 31, 2007.
Tax-Advantaged Global Shareholder Yield Fund
5
F I N A N C I A L S T A T E M E N T S
Fund's investments
Securities owned by the Fund on 10-31-07
This schedule is divided into two main categories: common stocks and preferred stocks. Common stocks and preferred stocks are further broken down by country.
| Issuer | Shares | Value |
| Common stocks 96.87% | $165,935,878 | |
| (Cost $160,763,635) | ||
| Australia 5.26% | 9,009,532 | |
| Fairfax Media, Ltd. (Publishing) (F) | 843,000 | 3,725,060 |
| Insurance Australia Group Ltd. (Property & Casualty Insurance) (F) | 776,700 | 3,399,559 |
| St. George Bank, Ltd. (Diversified Banks) (F) | 55,500 | 1,884,913 |
| Austria 1.13% | 1,938,347 | |
| Telekom Austria AG (Integrated Telecommunication Services) (C) | 67,400 | 1,938,347 |
| Belgium 3.01% | 5,165,456 | |
| Belgacom SA (Integrated Telecommunication Services) (C) | 74,400 | 3,560,913 |
| Fortis (Other Diversified Financial Services) (C) | 23,500 | 753,775 |
| InBev NV (Brewers (C) | 9,000 | 850,768 |
| Canada 3.12% | 5,353,233 | |
| Manitoba Telecom Services, Inc. (Integrated Telecommunication | ||
| Services) (F) | 68,900 | 3,409,455 |
| TransAlta Corp. (Independent Power Producers & Energy Traders) (F) | 54,300 | 1,943,778 |
| China 0.68% | 1,172,106 | |
| PetroChina Co., Ltd., Class H (Integrated Oil & Gas) (F) | 454,000 | 1,172,106 |
| Finland 0.59% | 1,016,254 | |
| Fortum Oyj (Electric Utilities) (C) | 23,400 | 1,016,254 |
| France 3.26% | 5,583,420 | |
| France Telecom SA (Integrated Telecommunication Services) (C) | 78,000 | 2,880,878 |
| PagesJaunes Groupe SA (Publishing) (C) | 40,800 | 901,716 |
| Vivendi Universal SA (Movies & Entertainment) (C) | 39,900 | 1,800,826 |
| Germany 1.11% | 1,893,700 | |
| RWE AG (Multi-Utilities) (C) | 13,900 | 1,893,700 |
| Italy 7.23% | 12,378,269 | |
| Arnoldo Mondadori Editore SpA (Publishing) (C) | 176,500 | 1,745,731 |
| Enel SpA (Electric Utilities) (C) | 299,000 | 3,580,682 |
| Eni SpA, ADR (Integrated Oil & Gas) (F) | 22,700 | 1,658,916 |
| Telecom Italia SpA (Integrated Telecommunication Services) (C) | 551,600 | 1,726,327 |
| Terna Rete Elettrica Nazionale (Electric Utilities) (C) | 936,600 | 3,666,613 |
| Korea 1.04% | 1,774,715 | |
| KT&G Corp. (Tobacco) (F) | 22,000 | 1,774,715 |
See notes to financial statements
Tax-Advantaged Global Shareholder Yield Fund
6
F I N A N C I A L S T A T E M E N T S
| Issuer | Shares | Value |
| New Zealand 1.03% | $1,759,592 | |
| Telecom Corporation of New Zealand, Ltd., ADR (Integrated | ||
| Telecommunication Services) (F) | 104,800 | 1,759,592 |
| Norway 1.55% | 2,660,272 | |
| Statoil ASA, ADR (Integrated Oil & Gas) (F) | 48,400 | 1,649,472 |
| Veidekke ASA (Construction and Engineering) (F) | 96,100 | 1,010,800 |
| Philippines 0.55% | 939,820 | |
| Philippine Long Distance Telephone Co., SP ADR (Wireless | ||
| Telecommunication Services) (F) | 13,700 | 939,820 |
| Sweden 1.09% | 1,870,733 | |
| Swedish Match AB (Tobacco) (F) | 83,600 | 1,870,733 |
| Taiwan 0.99% | 1,695,462 | |
| Far EasTone Telecommunications Co., Ltd. (Wireless Telecommunication | ||
| Services) (F) | 1,364,000 | 1,695,462 |
| United Kingdom 9.36% | 16,032,499 | |
| Barclays PLC (Diversified Banks) (F) | 67,100 | 848,449 |
| Diageo PLC, ADR (Distillers and Vintners) (F) | 8,700 | 798,225 |
| GKN PLC (Auto Parts & Equipment) (F) | 116,800 | 893,187 |
| Legal & General Group PLC (Life & Health Insurance) (F) | 632,400 | 1,844,479 |
| Lloyds TSB Group PLC (Diversified Banks) (F) | 77,400 | 878,401 |
| National Grid PLC (Multi-Utilities) (F) | 217,300 | 3,590,970 |
| Tomkins PLC (Industrial Conglomerates) (F) | 738,000 | 3,416,745 |
| Vodafone Group PLC (Wireless Telecommunication Services) (F) | 955,600 | 3,762,043 |
| United States 55.86% | 95,692,468 | |
| Altria Group, Inc. (Tobacco) | 48,900 | 3,566,277 |
| AT&T, Inc. (Integrated Telecommunication Services) | 79,100 | 3,305,589 |
| Automatic Data Processing, Inc. (Data Processing & Outsourced Services) | 36,000 | 1,784,160 |
| Ball Corp. (Metal & Glass Containers) | 61,500 | 3,049,170 |
| Bank of America Corp. (Other Diversified Financial Services) | 16,600 | 801,448 |
| Bristol-Myers Squibb Co. (Pharmaceuticals) | 117,300 | 3,517,827 |
| CBS Corp. (Class B) (Broadcasting & Cable TV) | 54,200 | 1,555,540 |
| Citizens Communications Co. (Integrated Telecommunication Services) | 244,700 | 3,220,252 |
| ConocoPhillips (Integrated Oil & Gas) | 37,500 | 3,186,000 |
| DaVita, Inc. (Health Care Services) (I) | 13,700 | 893,103 |
| Diamond Offshore Drilling, Inc. (Oil & Gas Drilling) | 7,600 | 860,548 |
| Duke Energy Corp. (Electric Utilities) | 178,900 | 3,429,513 |
| E.I. du Pont de Nemours & Co. (Diversified Chemicals) | 67,700 | 3,351,827 |
| GateHouse Media, Inc. (Publishing) | 127,900 | 1,469,571 |
| General Electric Co. (Industrial Conglomerates) | 81,100 | 3,338,076 |
| General Maritime Corp. (Oil & Gas Storage & Transportation) | 29,800 | 839,764 |
| Great Plains Energy, Inc. (Electric Utilities) | 117,000 | 3,491,280 |
| Idearc, Inc. (Publishing) | 106,000 | 2,859,880 |
| Iowa Telecommunications Services, Inc. (Integrated | ||
| Telecommunication Services) | 83,800 | 1,652,536 |
| Merck & Co., Inc. (Pharmaceuticals) | 32,000 | 1,864,320 |
See notes to financial statements
Tax-Advantaged Global Shareholder Yield Fund
7
F I N A N C I A L S T A T E M E N T S
| Issuer | Shares | Value | |
| United States (continued) | |||
| ONEOK, Inc. (Gas Utilities) | 73,200 | $3,655,608 | |
| Packaging Corp of America (Paper Packaging) | 61,600 | 1,961,344 | |
| Pfizer, Inc. (Pharmaceuticals) | 68,500 | 1,685,785 | |
| Progress Energy, Inc. (Electric Utilities) | 70,300 | 3,374,400 | |
| Reynolds American, Inc. (Tobacco) | 52,900 | 3,408,347 | |
| Southern Co. (Electric Utilities) | 181,400 | 6,650,124 | |
| Southern Copper Corp. (Diversified Metals & Mining) | 20,300 | 2,835,910 | |
| Spectra Energy Corp. (Oil & Gas Storage & Transportation) | 130,900 | 3,400,782 | |
| TECO Energy, Inc. (Multi-Utilities) | 206,100 | 3,468,663 | |
| The Laclede Group, Inc. (Gas Utilities) | 25,400 | 883,666 | |
| U.S. Bancorp. (Diversified Banks) | 26,300 | 872,108 | |
| UST, Inc. (Tobacco) | 68,300 | 3,641,756 | |
| Verizon Communications, Inc. (Integrated | |||
| Telecommunication Services) | 75,800 | 3,492,106 | |
| Westar Energy, Inc. (Electric Utilities) | 67,800 | 1,804,836 | |
| WGL Holdings, Inc. (Gas Utilities) | 99,600 | 3,378,432 | |
| Windstream Corp. (Integrated Telecommunication Services) | 233,600 | 3,141,920 | |
| Credit | |||
| Issuer, description | rating (A) | Shares | Value |
| Preferred stocks 2.56% | $4,381,354 | ||
| (Cost $4,359,782) | |||
| United States 2.56% | 4,381,354 | ||
| Bank of America Corp., 6.50% | |||
| (Diversified Financial Services) | AA- | 33,800 | 836,550 |
| Comcast Corp., 7.00%, Ser B | |||
| (Broadcasting & Cable TV) | BBB+ | 51,300 | 1,270,188 |
| General Electric Capital Corp., | |||
| 6.00% (Diversified Financial Services) | AAA | 47,200 | 1,146,016 |
| Wells Fargo Capital Trust IV, | |||
| 7.00% (Diversified Banks) | AA- | 45,000 | 1,128,600 |
| Total investments (Cost $165,123,417) 99.43% | $170,317,232 | ||
| Other assets and liabilities, net 0.57% | $978,276 | ||
| Total net assets 100.00% | $171,295,508 | ||
The percentage shown for each investment category is the total value of that category, as a percentage of the net assets.
See notes to financial statements
Tax-Advantaged Global Shareholder Yield Fund
8
F I N A N C I A L S T A T E M E N T S
Notes to Schedule of Investments
ADR American Depositary Receipt
(A) Credit ratings are unaudited and are rated by Moody's Investors Service where Standard & Poor's ratings are not available unless indicated otherwise.
(C) The security is euro-denominated.
(F) The security is U.S. dollar-denominated.
(I) Non-income-producing security.
See notes to financial statements
Tax-Advantaged Global Shareholder Yield Fund
9
F I N A N C I A L S T A T E M E N T S
Financial statements
Statement of assets and liabilities 10-31-07
This Statement of Assets and Liabilities is the Fund's balance sheet. It shows the value of what the Fund owns, is due and owes. You'll also find the net asset value for each common share.
| Assets | |
| Investments at value (cost $165,123,417) | $170,317,232 |
| Cash | 3,729,238 |
| Foreign currency at value (cost $9,010) | 9,075 |
| Receivable for investments sold | 4,438,956 |
| Dividends receivable | 350,145 |
| Other assets | 26,942 |
| Total assets | 178,871,588 |
| Liabilities | |
| Payable for investments purchased | 4,187,383 |
| Payable for options written, at value (premiums received $1,656,496) | 2,957,520 |
| Payable to affiliates | |
| Management fees | 4,644 |
| Other | 3,753 |
| Other payables and accrued expenses | 422,780 |
| Total liabilities | 7,576,080 |
| Net assets | |
| Common shares capital paid-in | 166,658,621 |
| Accumulated net realized gain on investments, options written and | |
| foreign currency transactions | 739,655 |
| Net unrealized appreciation of investments, options written and | |
| translation of assets and liabilities in foreign currencies | 3,897,232 |
| Net assets applicable to common shares | $171,295,508 |
| Net asset value per common share | |
| Based on 8,750,000 shares of beneficial interest outstanding - unlimited | |
| number of shares authorized with no par value | $19.58 |
See notes to financial statements
Tax-Advantaged Global Shareholder Yield Fund
10
F I N A N C I A L S T A T E M E N T S
Statement of operations For the period ended 10-31-071
This Statement of Operations summarizes the Fund's investment income earned and expenses incurred in operating the Fund. It also shows net gains (losses) for the period stated.
| Investment income | |
| Dividends (net of foreign withholding taxes of $5,836) | $372,335 |
| Interest | 26,113 |
| Total investment income | 398,448 |
| Expenses | |
| Investment management fees (Note 2) | 166,298 |
| Accounting and legal services fees (Note 2) | 3,753 |
| Professional fees | 36,875 |
| Custodian fees | 8,918 |
| Registration and filing fees | 7,240 |
| Printing fees | 6,521 |
| Transfer agent fees | 4,816 |
| Trustees' fees | 797 |
| Miscellaneous | 7,911 |
| Total expenses | 243,129 |
| Less expense reductions (Note 2) | (26,942) |
| Net expenses | 216,187 |
| Net investment income | 182,261 |
| Realized and unrealized gain (loss) | |
| Net realized gain (loss) on | |
| Investments | 158,399 |
| Options written | 581,256 |
| Foreign currency transactions | (298,640) |
| 441,015 | |
| Change in net unrealized appreciation (depreciation) of | |
| Investments | 5,193,815 |
| Options written | (1,301,024) |
| Translation of assets and liabilities in foreign currencies | 4,441 |
| 3,897,232 | |
| Net realized and unrealized gain | 4,338,247 |
| Increase in net assets from operations | $4,520,508 |
1 Commencement of operations period from 9-26-07 to 10-31-07.
See notes to financial statements
Tax-Advantaged Global Shareholder Yield Fund
11
F I N A N C I A L S T A T E M E N T S
Statement of changes in net assets
These Statements of Changes in Net Assets show how the value of the Fund's net assets has changed during the last period. The difference reflects earnings less expenses, any investment gains and losses, distributions, if any, paid to shareholders and the net of Fund share transactions.
| Period | |
| ended1 | |
| 10-31-07 | |
| Increase in net assets | |
| From operations | |
| Net investment income | $182,261 |
| Net realized gain | 441,015 |
| Change in net unrealized appreciation (depreciation) | 3,897,232 |
| Increase in net assets resulting from operations | 4,520,508 |
| From Fund share transactions (Note 4) | 166,775,000 |
| Total increase | 171,295,508 |
| Net assets | |
| Beginning of period | -- |
| End of period | $171,295,508 |
1 Commencement of operations period from 9-26-07 to 10-31-07.
See notes to financial statements
Tax-Advantaged Global Shareholder Yield Fund
12
F I N A N C I A L S T A T E M E N T S
Financial highlights
The Financial Highlights show how the Fund's net asset value for a share has changed since inception.
COMMON SHARES
| Period ended | 10-31-071 |
| Per share operating performance | |
| Net asset value, beginning of period | $19.102 |
| Net investment income3 | 0.02 |
| Net realized and unrealized | |
| gain on investments | 0.50 |
| Total from investment operations | 0.52 |
| Capital charges | |
| Offering costs related | |
| to common shares | (0.04) |
| Net asset value, end of period | $19.58 |
| Per share market value, end of period | $20.20 |
| Total return at NAV4,5,6 (%) | 2.517 |
| Total return at market value4,6 (%) | 1.007 |
| Ratios and supplemental data | |
| Net assets applicable | |
| to common shares, end of period | |
| (in millions) | $171 |
| Ratio of net expenses to average | |
| net assets (%) | 1.308 |
| Ratio of gross expenses to average | |
| net assets (%) | 1.468.9 |
| Ratio of net investment income | |
| to average net assets (%) | 1.108 |
| Portfolio turnover (%) | 37 |
1 Commencement of operations period from 9-26-07 to 10-31-07.
2 Reflects the deduction of a $0.90 per share sales load.
3 Based on the average of the shares outstanding.
4 Assumes dividend reinvestment and a purchase at $20.00 per share on the inception date and a sale at the current market price on the last day of the period.
5 Total return would have been lower had certain expenses not been reduced during the period shown.
6 Total return based on net asset value reflects changes in the Fund's net asset value during each period. Total return based on market value reflects changes in market value. Each figure assumes that dividend and capital gain distributions, if any, were reinvested. These figures will differ depending upon the level of any discount from or premium to net asset value at which the Fund's shares traded during the period.
7 Not annualized.
8 Annualized.
9 Does not take into consideration expense reductions during the period shown.
See notes to financial statements
Tax-Advantaged Global Shareholder Yield Fund
13
Notes to financial statements
Note 1 Accounting policies
John Hancock Tax-Advantaged Global Shareholder Yield Fund (the Fund) is a newly organized, diversified, closed-end management investment company registered under the Investment Company Act of 1940, as amended (the 1940 Act).
Significant accounting policies
The financial statements have been prepared in conformity with accounting principles generally accepted in the United States of America, which require management to make certain estimates and assumptions at the date of the financial statements. The following summarizes the significant accounting policies of the Fund:
Security valuation
The net asset value of the shares of the Fund is determined daily as of the close of the New York Stock Exchange (NYSE), normally at 4:00 p.m., Eastern Time. Short-term debt investments that have a remaining maturity of 60 days or less are valued at amortized cost, and thereafter assume a constant amortization to maturity of any discount or premium, which approximates market value. All other securities held by the Fund are valued at the last sale price or official closing price (closing bid price or last evaluated quote if no sale has occurred) as of the close of business on the principal securities exchange (domestic or foreign) on which they trade or, lacking any sales, at the closing bid price. Securities traded only in the over-the-counter market are valued at the last bid price quoted by brokers making markets in the securities at the close of trading. Securities for which there are no such quotations, principally debt securities, are valued based on the valuation provided by an independent pricing service, which utilizes both dealer-supplied and electronic data processing techniques, which take into account factors such as institutional-size trading in similar groups of securities, yield, quality, coupon rate, maturity, type of issue, trading characteristics and other market data.
Other assets and securities for which no such quotations are readily available are valued at fair value as determined in good faith under consistently applied procedures established by and under the general supervision of the Board of Trustees. Generally, trading in non-U.S. securities is substantially completed each day at various times prior to the close of trading on the NYSE. The values of such securities used in computing the net asset value of a Fund's shares are generally determined as of such times. Occasionally, significant events that affect the values of such securities may occur between the times at which such values are generally determined and the close of the NYSE. Upon such an occurrence, these securities will then be valued at their fair value as determined in good faith under consistently applied procedures established by and under the general supervision of the Board of Trustees.
Foreign currency translations
The books and records of the Fund are maintained in U.S. dollars. Investment securities and other assets and liabilities denominated in a foreign currency are translated into U.S. dollars at the prevailing exchange rates at period end. Purchases and sales of investment securities, income and expenses are translated into U.S. dollars at the prevailing exchange rates on the respective dates of the transactions.
Net realized and unrealized gains and losses on foreign currency transactions represent net gains and losses between trade and settlement dates on securities transactions, the disposition of forward foreign currency exchange contracts and foreign currencies, and the difference between the amount of net investment income accrued and the U.S. dollar amount actually received. That portion of both realized and unrealized gains and losses on investments that results from fluctuations in foreign currency exchange rates is
Tax-Advantaged Global Shareholder Yield Fund
14
not separately disclosed but is included with net realized and unrealized gain/appreciation and loss/depreciation on investments.
Investment transactions
Investment transactions are accounted for on a trade date plus one basis for daily net asset value calculations. However, for financial reporting purposes, investment security transactions are reported on trade date. Interest income is recorded on the accrual basis. Dividend income is recorded on the ex-dividend date net of foreign withholding taxes. Certain dividends from foreign securities may be recorded subsequent to the ex-dividend date as soon as the Fund is informed of such dividends. Realized gains and losses from investment transactions are recorded on an identified cost basis.
Expenses
The majority of expenses are directly identifiable to an individual fund. Expenses that are not readily identifiable to a specific fund are allocated in such a manner as deemed equitable, taking into consideration, among other things, the nature and type of expense and the relative size of the funds.
Options
The Fund may enter into option contracts. Listed options will be valued at the last quoted sales price on the exchange on which they are primarily traded. Over-the-counter options are valued at the mean between the last bid and asked prices. Upon the writing of a call or put option, an amount equal to the premium received by the Fund will be included in the Fund's Statement of Assets and Liabilities as an asset and corresponding liability. The amount of the liability will be subsequently marked to market to reflect the current market value of the written option.
The Fund may use option contracts to manage its exposure to the price volatility of financial instruments. Writing puts and buying calls will tend to increase the Fund's exposure to the underlying instrument, and buying puts and writing calls will tend to decrease the Fund's exposure to the underlying instrument, or hedge other Fund investments.
The maximum exposure to loss for any purchased options will be limited to the premium initially paid for the option. In all other cases, the face (or notional) amount of each contract at value will reflect the maximum exposure of the Fund in these contracts, but the actual exposure will be limited to the change in value of the contract over the period the contract remains open.
Risks may also arise if counterparties do not perform under the contract's terms (credit risk) or if the Fund is unable to offset a contract with a counterparty on a timely basis (liquidity risk). Exchange-traded options have minimal credit risk as the exchanges act as counter-parties to each transaction and only present liquidity risk in highly unusual market conditions. To minimize credit and liquidity risks in over-the-counter option contracts, the Fund continuously monitors the creditworthiness of all its counterparties.
At any particular time, except for purchased options, market or credit risk may involve amounts in excess of those reflected in the Fund's Statement of Assets and Liabilities.
Written options on indices for the period ended October 31, 2007, were as follows:
| NUMBER OF CONTRACTS | PREMIUMS RECEIVED | |
| Outstanding, beginning of period | -- | -- |
| Options written | 3,177 | $3,254,157 |
| Option closed | (1,265) | (1,084,253) |
| Options expired | (574) | (513,408) |
| Outstanding, end of period | 1,338 | $1,656,496 |
Tax-Advantaged Global Shareholder Yield Fund
15
Summary of written options on indices outstanding on October 31, 2007:
| NUMBER OF | EXERCISE | EXPIRATION | ||
| NAME OF ISSUER | CONTRACTS | PRICE | DATE | VALUE |
| CALLS | ||||
| KBW Bank Index | 409 | $100 | Nov 2007 | $171,780 |
| Amex Biotechnology Index | 50 | 840 | Nov 2007 | 63,000 |
| Morgan Stanley Cyclical Index | 40 | 1,040 | Nov 2007 | 128,000 |
| CBOE Gold Index | 243 | 175 | Nov 2007 | 405,810 |
| S&P Midcap 400 Index | 47 | 890 | Nov 2007 | 123,140 |
| CBOE Oil Index | 52 | 810 | Nov 2007 | 160,160 |
| S&P Small Cap 600 Index | 99 | 420 | Nov 2007 | 145,530 |
| S&P 500 Index | 215 | 1,505 | Nov 2007 | 1,066,400 |
| Philadelphia Stock Exchange | ||||
| Utility Index | 77 | 535 | Nov 2007 | 239,470 |
| Amex Oil Index | 29 | 1,440 | Nov 2007 | 184,730 |
| Amex Natural Gas Index | 77 | 540 | Nov 2007 | 269,500 |
| Total | 1,338 | $2,957,520 | ||
Federal income taxes
The Fund intends to qualify as a regulated investment company by complying with the applicable provisions of the Internal Revenue Code and will not be subject to federal income tax on taxable income that is distributed to shareholders. Therefore, no federal income tax provision is required. For federal income tax purposes, the Fund has $561,369 of a capital loss carryforward available, to the extent provided by regulations, to offset future net realized capital gains. To the extent that such carryforward is used by the Fund, no capital gain distributions will be made. The loss carryforward expires October 31, 2015.
New accounting pronouncements
In June 2006, Financial Accounting Standards Board (FASB) Interpretation No. 48, Accounting for Uncertainty in Income Taxes, an interpretation of FASB Statement 109 (FIN 48), was issued and is effective for fiscal years beginning after December 15, 2006, and is to be applied to all open tax years as of the effective date. On December 22, 2006, the SEC delayed the implementation of FIN 48 for regulated investment companies for an additional six months. FIN 48 prescribes a minimum threshold for financial statement recognition of the benefit of a tax position taken or expected to be taken in a tax return, and requires certain expanded disclosures. Management has concluded that the adoption of FIN 48 will not result in a material impact on the Fund's net assets, results of operations and financial statement disclosures.
In September 2006, FASB Standard No. 157, Fair Value Measurements (FAS 157), was issued and is effective for fiscal years beginning after November 15, 2007. FAS 157 defines fair value, establishing a framework for measuring fair value and expands disclosure about fair value measurements. Management is currently evaluating the application of FAS 157 to the Fund and its impact, if any, resulting from the adoption of FAS 157 on the Fund's financial statements.
Dividends, interest and distributions
Dividend income on investment securities is recorded on the ex-dividend date or, in the case of some foreign dividends when the Fund becomes aware of the dividends from cash collections. Interest income on investment securities is recorded on the accrual basis. Foreign income may be subject to foreign withholding taxes, which are accrued as applicable.
The Fund records distributions to shareholders from net investment income and net realized gains, if any, on the ex-dividend date. There were no distributions during the period ended October 31, 2007.
As of October 31, 2007, there were no distributable earnings on a tax basis.
Such distributions and distributable earnings, on a tax basis, are determined in conformity with income tax regulations, which may differ from accounting principles generally accepted in the United States of America. Distributions in excess of tax basis earnings and profits, if any,
Tax-Advantaged Global Shareholder Yield Fund
16
are reported in the Fund's financial statements as a return of capital.
Note 2
Management fee and transactions with affiliates and others
The Fund has an investment management contract with John Hancock Advisers, LLC (the Adviser), a wholly owned subsidiary of John Hancock Financial Services, Inc., a subsidiary of Manulife Financial Corporation (MFC). Under the investment management contract, the Fund pays a daily management fee to the Adviser at an annual rate of 1.00% of the Fund's average daily net asset value. The Adviser has a subadvisory agreement with Epoch Investment Partners, Inc. and, also, a subadvisory agreement with Analytic Investors, Inc. The Fund is not responsible for payment of the subadvisory fees.
The Adviser agreed to voluntarily limit the Fund's total expenses to 1.30% of the Fund's average daily net asset value until October 31, 2007. Accordingly, the expense reductions related to this total expense limitation amounted to $26,942 for the period ended October 31, 2007.
The Fund has an agreement with the Adviser and affiliates to perform necessary tax, accounting, compliance and legal services for the Fund. The compensation for the period amounted to $1,663.
Mr. James R. Boyle is Chairman of the Adviser, as well as affiliated Trustee of the Fund, and is compensated by the Adviser and/or its affiliates. The compensation of unaffiliated Trustees is borne by the Fund. The unaffiliated Trustees may elect to defer, for tax purposes, their receipt of this compensation under the John Hancock Group of Funds Deferred Compensation Plan. The Fund makes investments into other John Hancock funds, as applicable, to cover its liability for the deferred compensation. Investments to cover the Fund's deferred compensation liability are recorded on the Fund's books as an other asset. The deferred compensation liability and the related other asset are always equal and are marked to market on a periodic basis to reflect any income earned by the investments, as well as any unrealized gains or losses. The Deferred Compensation Plan investments had no impact on the operations of the Fund.
The Fund is listed for trading on the NYSE and has filed with the NYSE its chief executive officer certification regarding compliance with the NYSE's listing standards. The Fund also files with the Securities and Exchange Commission the certification of its chief executive officer and chief financial officer required by Section 302 of the Sarbanes-Oxley Act.
Note 3
Guarantees and indemnifications
Under the Fund's organizational documents, its Officers and Trustees are indemnified against certain liability arising out of the performance of their duties to the Fund. Additionally, in the normal course of business, the Fund enters into contracts with service providers that contain general indemnification clauses. The Fund's maximum exposure under these arrangements is unknown, as this would involve future claims that may be made against the Fund that have not yet occurred. However, based on experience, the Fund believes the risk of loss to be remote.
Tax-Advantaged Global Shareholder Yield Fund
17
Note 4
Fund share transactions
This listing illustrates the reclassification of the Fund's capital accounts and the number of common shares outstanding during the period ended October 31, 2007, along with the corresponding dollar value.
| Period ended 10-31-071 | ||
| Shares | Amount | |
| Shares issued | 8,750,000 | $167,125,0002 |
| Offering costs related to common shares | -- | (350,000) |
| Net increase | 8,750,000 | $166,775,000 |
1Commencement of operations period from 9-26-07 to 10-31-07.
2 Net of $0.90 per share sales load of the initial offering price of $20.00 per share.
Note 5
Investment transactions
Purchases and proceeds from sales or maturities of securities, other than short-term securities and obligations of the U.S. government, during the period ended October 31, 2007, aggregated $6,298,454 and $5,294,217, respectively.
The cost of investments owned on October 31, 2007, including short-term investments, for federal income tax purposes, was $165,123,417. Gross unrealized appreciation and depreciation of investments aggregated $7,104,890 and $1,911,075, respectively, resulting in net unrealized appreciation of $5,193,815.
Note 6
Reclassification of accounts
Capital accounts within financial statements are adjusted for permanent book tax differences. These adjustments have no impact on net assets or the results of operations. Temporary book tax differences will reverse in a subsequent period. During the year ended October 31, 2007, the Fund reclassified amounts to reflect an increase in accumulated net realized gain on investments of $298,640, a decrease in accumulated net investment income of $182,261 and a decrease in capital paid-in of $116,379. These reclassifications are primarily attributable to certain differences in the computation of distributable income and capital gains under federal tax rules versus accounting principles generally accepted in the United States of America for net operating losses, foreign currency transactions and derivative transactions. The calculation of net investment income per share in the Fund's Financial Highlights excludes these adjustments.
Tax-Advantaged Global Shareholder Yield Fund
18
| Auditors' report |
Report of Independent Registered Public Accounting Firm
To the Board of Trustees and Shareholders of John Hancock Tax-Advantaged Global Shareholder Yield Fund,
In our opinion, the accompanying statement of assets and liabilities, including the schedule of investments, and the related statements of operations and of changes in net assets and the financial highlights present fairly, in all material respects, the financial position of John Hancock Tax-Advantaged Global Shareholder Yield Fund (the Fund) at October 31, 2007, and the results of its operations, the changes in its net assets and the financial highlights for the period September 26, 2007 (commencement of operations) through October 31, 2007, in conformity with accounting principles generally accepted in the United States of America. These financial statements and financial highlights (hereafter referred to as "financial statements") are the responsibility of the Fund's management; our responsibility is to express an opinion on these financial statements based on our audit. We conducted our audit of these financial statements in accordance with the standards of the Public Company Accounting Oversight Board (United States). Those standards require that we plan and perform the audit to obtain reasonable assurance about whether the financial statements are free of material misstatement. An audit includes examining, on a test basis, evidence supporting the amounts and disclosures in the financial statements, assessing the accounting principles used and significant estimates made by management, and evaluating the overall financial statement presentation. We believe that our audit, which included confirmation of securities at October 31, 2007 by correspondence with the custodian and brokers, provide a reasonable basis for our opinion.
| PricewaterhouseCoopers LLP Boston, Massachusetts December 21, 2007 |
19
| Tax information |
| Unaudited |
The Fund had no distributions from September 26, 2007, commencement of operations, to October 31, 2007. As a result, the 2007 U.S. Treasury Department Form 1099-DIV is not required to be mailed to shareholders.
20
Shareholder communication and assistance
If you have any questions concerning the Fund, we will be pleased to assist you. If you hold shares in your own name and not with a brokerage firm, please address all notices, correspondence, questions or other communications regarding the Fund to the transfer agent at:
| Mellon Investor Services Newport Office Center VII 480 Washington Boulevard Jersey City, NJ 07310 Telephone: 1-800-852-0218 |
If your shares are held with a brokerage firm, you should contact that firm, bank or other nominee for assistance.
21
Board Consideration of and Continuation of Investment Advisory Agreement and Subadvisory Agreements: John Hancock Tax-Advantaged Global Shareholder Yield Fund
The Investment Company Act of 1940 (the 1940 Act) requires the Board of Trustees (the Board) of John Hancock Tax-Advantaged Global Shareholder Yield Fund (the Fund), including a majority of the Trustees who have no direct or indirect interest in the investment advisory agreement and are not "interested persons" of the Fund, as defined in the 1940 Act (the Independent Trustees), initially to review and approve: (i) the investment advisory agreement (the Advisory Agreement) with John Hancock Advisers, LLC (the Adviser) and (ii) the investment subadvisory agreements (the Subadvisory Agreements) with Epoch Investment Partners, Inc. and Analytic Investors, Inc. (the Subadvisers). The Advisory Agreement and the Subadvisory Agreements are collectively referred to as the Advisory Agreements.
At meetings held on June 5, 2007, the Board, including the Independent Trustees, considered the factors and reached the conclusions described below relating to the selection of the Adviser and Subadvisers and the Advisory Agreements. During such meetings, the Board's Contracts/Operations Committee and the Independent Trustees also met in executive sessions with their independent legal counsel.
In evaluating the Advisory Agreements, the Board, including the Contracts/Operations Committee and the Independent Trustees, reviewed a broad range of information requested for this purpose by the Independent Trustees, including but not limited to advisory and other fees incurred by, and the expense ratios of, a group of comparable funds selected by the Adviser and the proposed fee and estimated expense ratio of the Fund. The Independent Trustees also considered information that was provided in connection with the Trustees annual review of the advisory agreement for other funds management by the Adviser including (i) the Adviser's financial results and condition, (ii) the background and experience of senior management and investment professionals, (iii) the nature, cost and character of advisory and non-investment management services provided by the Adviser and its affiliates to other Trusts and (iv) the Adviser's and Subadvisers' record of compliance with applicable laws and regulations, with the Fund's investment policies and restrictions, and with the Fund's Code of Ethics and the structure and responsibilities of the Adviser's and Subadvisers' compliance department.
Nature, extent and quality of services
The Board considered the ability of the Adviser and the Subadvisers, based on their resources, reputation and other attributes, to attract and retain qualified investment professionals, including research, advisory, and supervisory personnel. The Board considered the investment philosophy, research and investment decision-making processes of the Adviser and Subadvisers. The Board further considered the culture of compliance, resources dedicated to compliance, compliance programs and compliance records of the Adviser and Subadvisers. In addition, the Board took into account the administrative and other non-advisory services provided to the Fund by the Adviser and its affiliates. The Board also reviewed the investment performance of similar accounts managed by the Subadvisers compared to the performance of an index.
Based on the above factors, together with those referenced below, the Board concluded that, within the context of its full deliberations, the nature, extent and quality of the investment advisory services provided to the Fund by the Adviser and Subadvisers were sufficient to support approval of the Advisory Agreements.
Investment advisory fee and subadvisory fee rates and expenses
The Board reviewed and considered the contractual investment advisory fee rate payable by the Fund to the Adviser for investment advisory services (the Advisory Agreement Rate). The Board received and considered information comparing the Advisory Agreement Rate with the advisory fees paid by a group of similar funds selected by the Adviser. The Board noted that the Advisory Agreement Rate was substantially the same as the average rate for
22
these similar funds. The Board concluded that the Advisory Agreement Rate was reasonable in relation to the services to be provided.
The Board received and considered information regarding the Fund's estimated total operating expense ratio and its various components, including advisory fees, and other non-advisory fees, including administrative fees, transfer agent fees, custodian fees, and other miscellaneous fees (e.g., fees for accounting and legal services). The Board considered comparisons of these expenses to the expense information for similar funds. The Board noted that the total operating expense ratio of the Fund was projected to be substantially the same as that of the peer group of funds. Based on the above referenced considerations and other factors, the Board concluded that the Fund's projected overall expense ratio supported the approval of the Advisory Agreement.
The Board also received information about the investment subadvisory fee rates (the Subadvisory Agreement Rates) payable by the Adviser to the Subadvisers for investment sub-advisory services. The Board concluded that the Subadvisory Agreement Rate was fair and equitable, based on its consideration of the factors described above.
Information about services to other clients.
The Board also received information about the nature, extent and quality of services and fee rates offered by the Adviser to its other clients, including other registered investment companies, institutional investors and separate accounts. The Board concluded that the Advisory Agreement Rate was not unreasonable, taking into account fee rates offered to others by the Adviser and giving effect to differences in services covered by such rates.
Other benefits to the Adviser
The Board received information regarding potential "fall-out" or ancillary benefits received by the Adviser and its affiliates as a result of the Adviser's relationship with the Fund. Such benefits could include, among others, benefits directly attributable to the relationship of the Adviser with the Fund and benefits potentially derived from an increase in the business of the Adviser as a result of its relationship with the Fund (such as the ability to market to shareholders other financial products offered by the Adviser and its affiliates).
The Board also considered the effectiveness of the Adviser's, Subadvisers' and Fund's policies and procedures for complying with the requirements of the federal securities laws, including those relating to best execution of portfolio transactions and brokerage allocation.
Factors not considered relevant at this time
In light of the fact that the Fund had not yet commenced normal operations, the Trustees noted that certain factors, such as investment performance, economies of scale and profitability, that will be relevant when the Trustees consider continuing the Advisory Agreement, are not germane to its initial approval.
Other factors and broader review
The Board regularly reviews and assesses the quality of the services that the other funds managed by the Adviser receive throughout the year. In this regard, the Board reviews reports of the Adviser and Subadvisers at least quarterly, which include, among other things, a detailed portfolio review, detailed fund performance reports and compliance reports. In addition, the Board meets with portfolio managers and senior investment officers at various times throughout the year.
After considering the above-described factors and based on its deliberations and its evaluation of the information described above, the Board concluded that approval of the Advisory Agreements for the Fund was in the best interest of the Fund and its shareholders. Accordingly, the Board unanimously approved the Advisory and Subadvisory Agreements.
23
Information about the Epoch portfolio managers
Management Biographies and Fund Ownership
Below is a list of the Epoch portfolio managers who share joint responsibility for the day-to-day investment management of the Fund. It provides a brief summary of their business careers over the past five years and their range of beneficial share ownership in the Fund as of October 31, 2007.
| William W. Priest Founder, chief investment officer, chief executive officer and portfolio manager, Epoch Investment Partners, Inc. since 2004 Co-managing partner and portfolio manager, Steinberg, Priest & Sloan Capital Management, LLC (2001-2004) Began business career in 1965 Joined Fund team in 2007 Fund ownership -- None |
| Eric Sappenfield Managing director, portfolio manager and senior analyst, Epoch Investment Partners, Inc. since 2006 Research analyst, Spear, Leads & Kellogg (2004-2006) Senior analyst, Steinberg Priest & Sloane Capital Management, LLC (2002-2004) Began business career in 1985 Joined Fund team in 2007 Fund ownership -- None |
| Michael A. Welhoelter Managing director, portfolio manager and head of quantitative research and risk management, Epoch Investment Partners, Inc. since 2005 Director and portfolio manager, Columbia Management Group, Inc. (2001-2005) Began business career in 1986 Joined Fund team in 2007 Fund ownership -- None |
| Daniel Geber Managing director and portfolio manager, Epoch Investment Partners, Inc. since 2004 Partner, Trident Investment Management (1998-2004) Began business career in 1985 Joined Fund team in 2007 Fund ownership -- None |
| David N. Pearl Executive vice president, head of U.S. equities and portfolio manager, Epoch Investment Partners, Inc. since 2004 Managing director and portfolio manager, Steinberg Priest & Sloane Capital Management, LLC (2002-2004) Began business career in 1983 Joined Fund team in 2007 Fund ownership -- None |
24
Other Accounts the Portfolio Managers are Managing
The table below indicates for each portfolio manager, information about the accounts over which the portfolio manager has day-to-day investment responsibility. All information on the number of accounts and total net assets in the table is as of October 31, 2007. For purposes of the table, "Other Pooled Investment Vehicles" may include investment partnerships, pooled separate accounts, and group trusts, and "Other Accounts" may include separate accounts for institutions or individuals, insurance company general or non-pooled separate accounts, pension funds and other similar institutional accounts.
| P O R T F O L I O M A N A G E R | O T H E R A C C O U N T S M A N A G E D B Y T H E P O R T F O L I O M A N A G E R S |
| William W. Priest | Other Registered Investment Companies: Three (3) funds |
| with total net assets of approximately $1.1 billion | |
| Other Pooled Investment Vehicles: Thirty-two (32) entities with | |
| total net assets of approximately $3.2 billion | |
| Other Accounts: One hundred thirty-one (131) accounts with | |
| total net assets of approximately $2.2 billion | |
| Eric Sappenfield | Other Registered Investment Companies: One (1) fund with total |
| net assets of approximately $588 million | |
| Other Pooled Investment Vehicles: Two (2) entities with total net | |
| assets of approximately $869 million | |
| Other Accounts: None | |
| Michael A. Welhoelter | Other Registered Investment Companies: Three (3) funds with |
| total net assets of approximately $1.1 billion | |
| Other Pooled Investment Vehicles: Thirty-two (32) entities with | |
| total net assets of approximately $3.2 billion | |
| Other Accounts: One hundred thirty-one (131) accounts with | |
| total net assets of approximately $2.2 billion | |
| Daniel Geber | Other Registered Investment Companies: One (1) fund with total |
| net assets of approximately $514 million | |
| Other Pooled Investment Vehicles: Five (5) entities with total net | |
| assets of approximately $266 million | |
| Other Accounts: Two (2) accounts with total net assets of | |
| approximately $135 million | |
| David N. Pearl | Other Registered Investment Companies: Three (3) funds with |
| total net assets of approximately $1.1 billion | |
| Other Pooled Investment Vehicles: Thirty-two (32) entities with | |
| total net assets of approximately $3.2 billion | |
| Other Accounts: One hundred thirty-one (131) accounts with | |
| total net assets of approximately $2.2 billion | |
Neither the Adviser nor the Subadviser receives a fee based upon the investment performance of any of the accounts included under "Other Accounts Managed by the Portfolio Managers" in the table above.
With respect to accounts managed by Messrs. Priest, Welhoelter and Pearl, the Subadviser receives performance-based fees with respect to five (5) Other Accounts with total assets of approximately $46 million and one (1) Other Pooled Investment Vehicle with total assets of approximately $14 million.
25
Information about the Analytic portfolio managers
Management Biographies and Fund ownership
Below is an alphabetical list of the Analytic portfolio managers who share joint responsibility for the implementation and execution of the Fund's options strategy. It provides a brief summary of their business careers over the past five years and their range of beneficial share ownership in the Fund as of October 31, 2007.
| Harindra de Silva, Ph. D., CFA President and portfolio manager, Analytic Investors, LLC since 1995 Principal at Analysis Group, Inc. (1986-1994) Began business career in 1984 Joined Fund team in 2007 Fund ownership -- None |
| Gregory M. McMurran Chief investment officer and portfolio manager, Analytic Investors, LLC since 1976 Began business career in 1976 Joined Fund team in 2007 Fund ownership -- None |
| Dennis Bein, CFA Chief investment officer and portfolio manager, Analytic Investors, LLC since 1995 Senior consultant, AG Risk Management (1990-1998) Began business career in 1990 Joined Fund team in 2007 Fund ownership -- None |
| Scott Barker, CFA Portfolio manager Analytic Investors, LLC since 1995 Research analyst, Analysis Group, Inc. (1993-1998) Began business career in 1987 Joined Fund team in 2007 Fund ownership -- None |
| P O R T F O L I O M A N A G E R | O T H E R A C C O U N T S M A N A G E D B Y T H E P O R T F O L I O M A N A G E R S |
| Harindra de Silva, Ph.D., CFA | Other Registered Investment Companies: Twenty (20) funds |
| with total net assets of approximately $4.9 billion | |
| Other Pooled Investment Vehicles: Twenty-eight (28) entities | |
| with total net assets of approximately $2.4 billion | |
| Other Accounts: Thirty-two (32) accounts with total net assets of | |
| approximately $4.3 billion | |
| Gregory M. McMurran | Other Registered Investment Companies: Seven (7) funds with |
| total net assets of approximately $1.9 billion | |
| Other Pooled Investment Vehicles: Three (3) entities with total | |
| net assets of approximately $2.9 billion | |
| Other Accounts: Five (5) accounts with total net assets of | |
| approximately $1.09 billion | |
26
| P O R T F O L I O M A N A G E R | O T H E R A C C O U N T S M A N A G E D B Y T H E P O R T F O L I O M A N A G E R S |
| Dennis Bein, CFA | Other Registered Investment Companies: Twenty (20) funds |
| with total net assets of approximately $4.9 billion | |
| Other Pooled Investment Vehicles: Twenty-eight (28) entities | |
| with total net assets of approximately $2.3 billion | |
| Other Accounts: Thirty-three (33) accounts with total net assets | |
| of approximately $3.4 billion | |
| Scott Barker, CFA | Other Registered Investment Companies: (6) funds with total net |
| assets of approximately $1.8 billion | |
| Other Pooled Investment Vehicles: None | |
| Other Accounts: One (1) account with total net assets of | |
| approximately $14.4 billion | |
Neither the Adviser nor the Subadviser receives a fee based upon the investment performance of any of the accounts included under "Other Accounts Managed by the Portfolio Managers" in the table above, except for Messrs. de Silva, McMurran and Bein, who each receive a fee based on performance for 20 accounts, 2 accounts and 19 accounts, respectively, for "Other Pooled Investments" and for 14 accounts, 1 account and 13 accounts, respectively, for "Other Accounts" in the table above.
Conflicts of Interest
Conflicts of interest may arise because the Fund's portfolio managers have day-to-day management responsibilities with respect to both the Fund and various other accounts. These potential conflicts include:
• Limited Resources. The portfolio managers cannot devote their full time and attention to the management of each of the accounts that they manage. Accordingly, the portfolio managers may be limited in their ability to identify investment opportunities for each of the accounts that are as attractive as might be the case if the portfolio managers were to devote substantially more attention to the management of a single account. The effects of this potential conflict may be more pronounced where the accounts have different investment strategies.
• Limited Investment Opportunities. Other clients of either Subadviser may have investment objectives and policies similar to those of the Fund. Either Subadviser may, from time to time, make recommendations which result in the purchase or sale of a particular security by its other clients simultaneously with the Fund. If transactions on behalf of more than one client during the same period increase the demand for securities being purchased or the supply of securities being sold, there may be an adverse effect on price or quantity. It is the policy of each Subadviser to allocate advisory recommendations and the placing of orders in a manner that it believes is equitable to the accounts involved, including the Fund. When two or more clients of a Subadviser are purchasing or selling the same security on a given day from the same broker-dealer, such transactions may be averaged as to price.
• Different Investment Strategies. The accounts managed by the portfolio managers have differing investment strategies. If the portfolio managers determine that an investment opportunity may be appropriate for only some of the accounts or decide that certain of the accounts should take different positions with respect to a particular security, the portfolio managers may effect transactions for one or more accounts which may affect the market price of the security or the execution of the transaction, or both, to the detriment or benefit of one or more other accounts.
27
• Variation in Compensation. A conflict of interest may arise where a Subadviser is compensated differently by the accounts that are managed by the portfolio managers. If certain accounts pay higher management fees or performance-based incentive fees, the portfolio managers might be motivated to prefer certain accounts over others. The portfolio managers might also be motivated to favor accounts in which they have a greater ownership interest or accounts that are more likely to enhance the portfolio managers' performance record or to otherwise benefit the portfolio managers.
• Selection of Brokers. The portfolio managers select the brokers that execute securities transactions for the accounts that they supervise. In addition to executing trades, some brokers provide the portfolio managers with research and other services which may require the payment of higher brokerage fees than might otherwise be available. The portfolio managers' decision as to the selection of brokers could yield disproportionate costs and benefits among the accounts that they manage, since the research and other services provided by brokers may be more beneficial to some accounts than to others.
Where conflicts of interest arise between the Fund and other accounts managed by the portfolio managers, the portfolio managers will use good faith efforts so that the Fund will not be treated materially less favorably than other accounts. There may be instances where similar portfolio transactions may be executed for the same security for numerous accounts managed by the portfolio managers. In such instances, securities will be allocated in accordance with the Adviser's trade allocation policy.
Compensation Epoch Compensation
Our compensation system consists of three components - salary, bonus and stock ownership. The mix of remuneration elements varies according to the employee's level of responsibility and the role that their judgment plays in executing that responsibility. Every employee's compensation includes a base salary, annual bonus and incentive compensation. The portfolio management teams are compensated based on the performance of their product, their contribution to that performance, the overall performance of the firm and their contribution to the betterment of the firm through corporate citizenship.
Analytic Compensation
Our compensation structure for professional employees consists of an industry median base salary (based on independent industry information) and an annual discretionary bonus. Bonus amounts are determined using the following factors: the overall success of the firm in terms of profitability; the overall success of the department or team; and an individual's contribution to the team, based on goals established during the performance period. Compensation based on investment strategy performance is not tied to individual account performance, but rather, each strategy as a whole. Strategy performance information is based on pre-tax calculations for the prior calendar year. No portfolio manager is directly compensated a portion of an advisory fee based on the performance of a specific account. Members of Analytic's senior management team and investment management professionals may also have a deferred component to their total compensation (with a three-year vesting period) that is invested in the firm's investment products to tie the interests of the individual to the interests of the firm and our clients. Portfolio managers' base salaries are typically reviewed on an annual basis determined by each portfolio manager's anniversary date of employment. Discretionary bonuses are determined annually, upon analysis of information from the prior calendar year.
28
Trustees and Officers
This chart provides information about the Trustees and Officers who oversee your John Hancock fund. Officers elected by the Trustees manage the day-to-day operations of the Fund and execute policies formulated by the Trustees.
| Independent Trustees | ||
| Name, year of birth | Number of | |
| Position(s) held with Fund | Trustee | John Hancock |
| Principal occupation(s) and other | of Fund | funds overseen |
| directorships during past 5 years | since1 | by Trustee |
| James F. Carlin, Born: 1940 | 2007 | 57 |
| Interim Chairman (since December 2007); Director and Treasurer, Alpha Analytical Laboratories, Inc. | ||
| (chemical analysis) (since 1985); Part Owner and Treasurer, Lawrence Carlin Insurance Agency, Inc. | ||
| (since 1995); Part Owner and Vice President, Mone Lawrence Carlin Insurance Agency, Inc. (until 2005); | ||
| Chairman and Chief Executive Officer, Carlin Consolidated, Inc. (management/investments) (since 1987); | ||
| Trustee, Massachusetts Health and Education Tax Exempt Trust (1993-2003). | ||
| William H. Cunningham, Born: 1944 | 2007 | 57 |
| Former Chancellor, University of Texas System, and former President, University of Texas at Austin; | ||
| Chairman and Chief Executive Officer, IBT Technologies (until 2001); Director of the following: | ||
| Hire.com (until 2004), STC Broadcasting, Inc. and Sunrise Television Corp. (until 2001), Symtx, Inc. | ||
| (electronic manufacturing) (since 2001), Adorno/Rogers Technology, Inc. (until 2004), Pinnacle Foods | ||
| Corporation (until 2003), rateGenius (until 2003), Lincoln National Corporation (insurance) (since 2006), | ||
| Jefferson-Pilot Corporation (diversified life insurance company) (until 2006), New Century Equity | ||
| Holdings (formerly Billing Concepts) (until 2001), eCertain (until 2001), ClassMap.com (until 2001), | ||
| Agile Ventures (until 2001), AskRed.com (until 2001), Southwest Airlines (since 2000), Introgen (man- | ||
| ufacturer of biopharmaceuticals) (since 2000) and Viasystems Group, Inc. (electronic manufacturer) | ||
| (until 2003); Advisory Director, Interactive Bridge, Inc. (college fundraising) (until 2001); Advisory | ||
| Director, Q Investments (until 2003); Advisory Director, JPMorgan Chase Bank (formerly Texas Commerce | ||
| Bank-Austin), LIN Television (since 2002), WilTel Communications (until 2003) and Hayes Lemmerz | ||
| International, Inc. (diversified automotive parts supply company) (since 2003). | ||
| Charles L. Ladner, 2 Born: 1938 | 2007 | 57 |
| Chairman and Trustee, Dunwoody Village, Inc. (retirement services) (until 2003); Senior Vice President | ||
| and Chief Financial Officer, UGI Corporation (public utility holding company) (retired 1998); Vice | ||
| President and Director, AmeriGas, Inc. (retired 1998); Director, AmeriGas Partners, L.P. (gas distribution) | ||
| (until 1997); Director, EnergyNorth, Inc. (until 1997); Director, Parks and History Association (until 2007). | ||
| John A. Moore,2 Born: 1939 | 2007 | 57 |
| President and Chief Executive Officer, Institute for Evaluating Health Risks (nonprofit institution) | ||
| (until 2001); Senior Scientist, Sciences International (health research) (until 2003); Former Assistant | ||
| Administrator and Deputy Administrator, Environmental Protection Agency; Principal, Hollyhouse (con- | ||
| sulting) (since 2000); Director, CIIT Center for Health Science Research (nonprofit research) (since 2002). | ||
29
| Independent Trustees (continued) | ||
| Name, year of birth | Number of | |
| Position(s) held with Fund | Trustee | John Hancock |
| Principal occupation(s) and other | of Fund | funds overseen |
| directorships during past 5 years | since1 | by Trustee |
| Patti McGill Peterson,2 Born: 1943 | 2007 | 57 |
| Executive Director, Council for International Exchange of Scholars and Vice President, Institute of In- | ||
| ternational Education (since 1998); Senior Fellow, Cornell Institute of Public Affairs, Cornell University | ||
| (until 1998); Former President, Wells College, Aurora, NY, and St. Lawrence University, Canton, NY; | ||
| Director, Niagara Mohawk Power Corporation (until 2003); Director, Ford Foundation, International | ||
| Fellowships Program (since 2002); Director, Lois Roth Endowment (since 2002); Director, Council for | ||
| International Educational Exchange (since 2003). | ||
| Steven R. Pruchansky, Born: 1944 | 2007 | 57 |
| Chairman and Chief Executive Officer, Greenscapes of Southwest Florida, Inc. (since 2000); Director and | ||
| President, Greenscapes of Southwest Florida, Inc. (until 2000); Managing Director, JonJames, LLC (real | ||
| estate) (since 2001); Director, First Signature Bank & Trust Company (until 1991); Director, Mast Realty | ||
| Trust (until 1994); President, Maxwell Building Corp. (until 1991). | ||
| Non-Independent Trustees3 | ||
| Name, year of birth | Number of | |
| Position(s) held with Fund | Trustee | John Hancock |
| Principal occupation(s) and other | of Fund | funds overseen |
| directorships during past 5 years | since1 | by Trustee |
| James R. Boyle, Born: 1959 | 2007 | 250 |
| President, John Hancock Variable Life Insurance Company (since March 2007); Executive Vice President, | ||
| John Hancock Life Insurance Company (since June 2004); Chairman and Director, John Hancock | ||
| Advisers, LLC (the Adviser), John Hancock Funds, LLC and The Berkeley Financial Group, LLC (The | ||
| Berkeley Group) (holding company) (since 2005); Senior Vice President, The Manufacturers Life Insurance | ||
| Company (U.S.A.) (until 2004). | ||
30
| Principal officers who are not Trustees | |
| Name, year of birth | |
| Position(s) held with Fund | Officer |
| Principal occupation(s) and other | of Fund |
| directorships during past 5 years | since |
| Keith F. Hartstein, Born: 1956 | 2007 |
| President and Chief Executive Officer | |
| Senior Vice President, Manulife Financial Corporation (since 2004); Director, President and Chief | |
| Executive Officer, the Adviser, The Berkeley Group and John Hancock Funds, LLC (since 2005); Director, | |
| MFC Global Investment Management (U.S.), LLC (MFC Global (U.S.)) (since 2005); Director, John | |
| Hancock Signature Services, Inc. (since 2005); President and Chief Executive Officer, John Hancock | |
| Investment Management Services, LLC (since 2006); President and Chief Executive Officer, John Hancock | |
| Funds, John Hancock Funds II, John Hancock Funds III and John Hancock Trust (since 2005); Director, | |
| Chairman and President, NM Capital Management, Inc. (since 2005); Chairman, Investment Company | |
| Institute Sales Force Marketing Committee (since 2003); Director, President and Chief Executive Officer, | |
| MFC Global (U.S.) (2005-2006); Executive Vice President, John Hancock Funds, LLC (until 2005). | |
| Thomas M. Kinzler, Born: 1955 | 2007 |
| Secretary and Chief Legal Officer | |
| Vice President and Counsel, John Hancock Life Insurance Company (U.S.A.) (since 2006); Secretary | |
| and Chief Legal Officer, John Hancock Funds and John Hancock Funds III (since 2006); Secretary, John | |
| Hancock Funds II and Assistant Secretary, John Hancock Trust (since June 2007); Vice President and | |
| Associate General Counsel, Massachusetts Mutual Life Insurance Company (1999-2006); Secretary and | |
| Chief Legal Counsel, MML Series Investment Fund (2000-2006); Secretary and Chief Legal Counsel, | |
| MassMutual Institutional Funds (2000-2004); Secretary and Chief Legal Counsel, MassMutual Select | |
| Funds and MassMutual Premier Funds (2004-2006). | |
| Francis V. Knox, Jr., Born: 1947 | 2007 |
| Chief Compliance Officer | |
| Vice President and Chief Compliance Officer, John Hancock Investment Management Services, LLC, | |
| the Adviser and MFC Global (U.S.) (since 2005); Vice President and Chief Compliance Officer, John | |
| Hancock Funds, John Hancock Funds II, John Hancock Funds III and John Hancock Trust (since 2005); | |
| Vice President and Assistant Treasurer, Fidelity Group of Funds (until 2004); Vice President and Ethics & | |
| Compliance Officer, Fidelity Investments (until 2001). | |
| Charles A. Rizzo, Born: 1957 | 2007 |
| Chief Financial Officer | |
| Chief Financial Officer, John Hancock Funds, John Hancock Funds II, John Hancock Funds III and John | |
| Hancock Trust (since June 2007); Assistant Treasurer, Goldman Sachs Mutual Fund Complex (regis- | |
| tered investment companies) (2005-June 2007); Vice President, Goldman Sachs (2005-June 2007); | |
| Managing Director and Treasurer of Scudder Funds, Deutsche Asset Management (2003-2005); | |
| Director, Tax and Financial Reporting, Deutsche Asset Management (2002-2003); Vice President and | |
| Treasurer, Deutsche Global Fund Services (1999-2002). | |
| Gordon M. Shone, Born: 1956 | 2007 |
| Treasurer | |
| Treasurer, John Hancock Funds (since 2006), John Hancock Funds II, John Hancock Funds III and John | |
| Hancock Trust (since 2005); Vice President and Chief Financial Officer, John Hancock Trust (2003-2005); | |
| Senior Vice President, John Hancock Life Insurance Company (U.S.A.) (since 2001); Vice President, John | |
| Hancock Investment Management Services, Inc., John Hancock Advisers, LLC (since 2006) and The | |
| Manufacturers Life Insurance Company (U.S.A.) (1998-2000). | |
31
| Principal officers who are not Trustees (continued) | |
| Name, year of birth | |
| Position(s) held with Fund | Officer |
| Principal occupation(s) and other | of Fund |
| directorships during past 5 years | since |
| John G. Vrysen, Born: 1955 | 2007 |
| Chief Operating Officer | |
| Senior Vice President, Manulife Financial Corporation (since 2006); Director, Executive Vice President | |
| and Chief Operating Officer, the Adviser, The Berkeley Group and John Hancock Funds, LLC (since | |
| June 2007); Chief Operating Officer, John Hancock Funds, John Hancock Funds II, John Hancock Funds III | |
| and John Hancock Trust (since June 2007); Director, Executive Vice President and Chief Financial Officer, | |
| the Adviser, The Berkeley Group and John Hancock Funds, LLC (until June 2007); Executive Vice President | |
| and Chief Financial Officer, John Hancock Investment Management Services, LLC (since 2005); Vice | |
| President and Chief Financial Officer, MFC Global (U.S.) (since 2005); Director, John Hancock Signature | |
| Services, Inc. (since 2005); Chief Financial Officer, John Hancock Funds, John Hancock Funds II, John | |
| Hancock Funds III and John Hancock Trust (2005-June 2007); Vice President and General Manager, Fixed | |
| Annuities, U.S. Wealth Management (until 2005); Vice President, Operations, Manulife Wood Logan | |
| (2000-2004). | |
The business address for all Trustees and Officers is 601 Congress Street, Boston, Massachusetts 02210-2805.
The Statement of Additional Information of the Fund includes additional information about members of the Board of Trustees of the Fund and is available without charge, upon request, by calling 1-800-225-5291.
1 Each Trustee serves until resignation, retirement age or until his or her successor is elected.
2 Member of Audit and Compliance Committee.
3 Non-Independent Trustee holds positions with the Fund's investment adviser, underwriter and certain other affiliates.
32
For more information
The Fund's proxy voting policies, procedures and records are available without charge, upon request:
| By phone | On the Fund's Web site | On the SEC's Web site |
| 1-800-225-5291 | www.jhfunds.com/proxy | www.sec.gov |
| Investment adviser | Custodian | Legal counsel |
| John Hancock Advisers, LLC | The Bank of New York | Kirkpatrick & Lockhart |
| 601 Congress Street | One Wall Street | Preston Gates Ellis LLP |
| Boston, MA 02210-2805 | New York, NY 10286 | One Lincoln Street |
| Boston, MA 02111-2950 | ||
| Subadvisers | Transfer agent for common | |
| Epoch Investment Partners, Inc. | shareholders | Independent registered public |
| 640 Fifth Avenue, 18th Floor | Mellon Investor Services | accounting firm |
| New York, NY 10019 | Newport Office Center VII | PricewaterhouseCoopers LLP |
| 480 Washington Boulevard | 125 High Street | |
| Analytic Investors, Inc. | Jersey City, NJ 07310 | Boston, MA 02110 |
| 500 South Grand Avenue | ||
| 23rd Floor | Stock symbol | |
| Los Angeles, CA 90071 | Listed New York Stock | |
| Exchange: HTY | ||
| For shareholder assistance | ||
| refer to page 21 | ||
| How to contact us | ||
| Internet | www.jhfunds.com | |
| Mellon Investor Services | ||
| Newport Office Center VII | ||
| 480 Washington Boulevard | ||
| Jersey City, NJ 07310 | ||
| Phone | Customer service representatives | 1-800-852-0218 |
| Portfolio commentary | 1-800-344-7054 | |
| 24-hour automated information | 1-800-843-0090 | |
| TDD line | 1-800-231-5469 | |
A listing of month-end portfolio holdings is available on our Web site, www.jhfunds.com. A more detailed portfolio holdings summary is available on a quarterly basis 60 days after the fiscal quarter on our Web site or upon request by calling 1-800-225-5291, or on the SEC's Web site, www.sec.gov.
36
J O H N H A N C O C K F A M I L Y O F F U N D S
| equity | SECTOR |
| Balanced Fund | Financial Industries Fund |
| Classic Value Fund | Health Sciences Fund |
| Classic Value Fund II | Real Estate Fund |
| Classic Value Mega Cap Fund | Regional Bank Fund |
| Core Equity Fund | Technology Fund |
| Growth Fund | Technology Leaders Fund |
| Growth Opportunities Fund | |
| Growth Trends Fund | INTERNATIONAL/GLOBAL |
| Intrinsic Value Fund | Global Opportunities Fund |
| Large Cap Equity Fund | Global Shareholder Yield Fund |
| Large Cap Select Fund | Greater China Opportunities Fund |
| Mid Cap Equity Fund | International Allocation Portfolio |
| Small Cap Equity Fund | International Classic Value Fund |
| Small Cap Fund | International Core Fund |
| Small Cap Intrinsic Value Fund | International Growth Fund |
| Sovereign Investors Fund | |
| U.S. Core Fund | INCOME |
| U.S. Global Leaders Growth Fund | Bond Fund |
| Value Opportunities Fund | Government Income Fund |
| High Yield Fund | |
| Investment Grade Bond Fund | |
| ASET ALLOCATION | Strategic Income Fund |
| Lifecycle 2010 Portfolio | |
| Lifecycle 2015 Portfolio | TAX-FREE INCOMEE |
| Lifecycle 2020 Portfolio | California Tax-Free Income Fund |
| Lifecycle 2025 Portfolio | High Yield Municipal Bond Fund |
| Lifecycle 2030 Portfolio | Massachusetts Tax-Free Income Fund |
| Lifecycle 2035 Portfolio | New York Tax-Free Income Fund |
| Lifecycle 2040 Portfolio | Tax-Free Bond Fund |
| Lifecycle 2045 Portfolio | |
| Lifecycle Retirement Portfolio | MONEY MARKET |
| Lifestyle Aggressive Portfolio | Money Market Fund |
| Lifestyle Balanced Portfolio | |
| Lifestyle Conservative Portfolio | CLOSED-END |
| Lifestyle Growth Portfolio | Bank and Thrift Opportunity Fund |
| Lifestyle Moderate Portfolio | Income Securities Trust |
| Investors Trust | |
| Patriot Premium Dividend Fund II | |
| Preferred Income Fund | |
| Preferred Income II Fund | |
| Preferred Income III Fund | |
| Tax-Advantaged Dividend Income Fund | |
| Tax-Advantaged Global Shareholder Yield Fund |
A Fund's investment objectives, risks, charges and expenses should be considered carefully before investing. The prospectus includes this and other important information about the Fund. To obtain a prospectus, contact your financial professional, call John Hancock Funds at 1-800-225-5291 or visit the Fund's Web site at www.jhfunds.com. Please read the prospectus carefully before investing or sending money.

| 1-800-852-0218 1-800-231-5469 TDD 1-800-843-0090 EASI-Line www.jhfunds.com |
| PRESORTED STANDARD U.S. POSTAGE PAID MIS |
| P140A 10/07 12/07 |
ITEM 2. CODE OF ETHICS.
As of the end of the period, October 31, 2007, the registrant has adopted a code of ethics, as defined in Item 2 of Form N-CSR, that applies to its Chief Executive Officer, Chief Financial Officer and Treasurer (respectively, the principal executive officer, the principal financial officer and the principal accounting officer, the “Senior Financial Officers”). A copy of the code of ethics is filed as an exhibit to this Form N-CSR.
ITEM 3. AUDIT COMMITTEE FINANCIAL EXPERT.
Charles L. Ladner is the audit committee financial expert and is “independent”, pursuant to general instructions on Form N-CSR Item 3.
ITEM 4. PRINCIPAL ACCOUNTANT FEES AND SERVICES.
(a) Audit Fees
The aggregate fees billed for professional services rendered by the principal accountant(s) for the audit of the registrant’s annual financial statements or services that are normally provided by the accountant(s) in connection with statutory and regulatory filings or engagements amounted to $30,350 for the fiscal year ended October 31, 2007. John Hancock Tax-Advantaged Global Yield Fund began operations on September 26, 2007. These fees were billed to the registrant and were approved by the registrant’s audit committee.
(b) Audit-Related Services
There were no audit-related fees during the fiscal year ended October 31, 2007 billed to the registrant or to the registrant's investment adviser (not including any sub-adviser whose role is primarily portfolio management and is subcontracted with or overseen by another investment adviser), and any entity controlling, controlled by, or under common control with the adviser that provides ongoing services to the registrant ("control affiliates").
(c) Tax Fees
The aggregate fees billed for professional services rendered by the principal accountant(s) for the tax compliance, tax advice and tax planning (“tax fees”) amounted to $0 for the fiscal year ended October 31, 2007. The nature of the services comprising the tax fees was the review of the registrant’s income tax returns and tax distribution requirements. These fees were billed to the registrant and were approved by the registrant’s audit committee. There were no tax fees billed to the control affiliates.
(d) All Other Fees
Other fees amounted to $0 for the fiscal year ended October 31, 2007 billed to the registrant or to the control affiliates.
(e)(1) See attachment "Approval of Audit, Audit-related, Tax and Other Services", with the audit committee pre-approval policies and procedures.
(e)(2) There were no fees that were approved by the audit committee pursuant to the de minimis exception for the fiscal years ended October 31, 2007 on behalf of the registrant or on behalf of the control affiliates that relate directly to the operations and financial reporting of the registrant.
(f) According to the registrant’s principal accountant, for the fiscal year ended October 31, 2007, the percentage of hours spent on the audit of the registrant's financial statements for the most recent fiscal year that were attributed to work performed by persons who were not full-time, permanent employees of principal accountant was less than 50%.
(g) The aggregate non-audit fees billed by the registrant's accountant(s) for services rendered to the registrant and rendered to the registrant's control affiliates for each of the last two fiscal years of the registrant were $1,403,169 for the fiscal year ended October 31, 2007.
(h) The audit committee of the registrant has considered the non-audit services provided by the registrant’s principal accountant(s) to the control affiliates and has determined that the services that were not pre-approved are compatible with maintaining the principal accountant(s)' independence.
ITEM 5. AUDIT COMMITTEE OF LISTED REGISTRANTS.
The registrant has a separately-designated standing audit committee comprised of independent trustees. The members of the audit committee are as follows:
Dr. John A. Moore - Chairman
Richard P. Chapman, Jr.
Charles L. Ladner
Patti McGill Peterson
ITEM 6. SCHEDULE OF INVESTMENTS.
Not applicable.
ITEM 7. DISCLOSURE OF PROXY VOTING POLICIES AND PROCEDURES FOR CLOSED-END MANAGEMENT INVESTMENT COMPANIES.
See attached Exhibit “Proxy Voting Policies and Procedures”.
ITEM 8. PORTFOLIO MANAGERS OF CLOSED-END MANAGEMENT INVESTMENT COMPANIES.
Information about the Epoch portfolio managers
Management Biographies and Fund Ownership
Below is a list of the Epoch portfolio managers who share joint responsibility for the day-to-day investment management of the Fund. It provides a brief summary of their business careers over the past five years and their range of beneficial share ownership in the Fund as of October 31, 2007.
| William W. Priest Founder, chief investment officer, chief executive officer and portfolio manager, Epoch Investment Partners, Inc. since 2004 Co-managing partner and portfolio manager, Steinberg, Priest & Sloan Capital Management, LLC (2001-2004) Began business career in 1965 Joined Fund team in 2007 Fund ownership -- None |
| Eric Sappenfield Managing director, portfolio manager and senior analyst, Epoch Investment Partners, Inc. since 2006 Research analyst, Spear, Leads & Kellogg (2004-2006) Senior analyst, Steinberg Priest & Sloane Capital Management, LLC (2002-2004) Began business career in 1985 Joined Fund team in 2007 Fund ownership -- None |
| Michael A. Welhoelter Managing director, portfolio manager and head of quantitative research and risk management, Epoch Investment Partners, Inc. since 2005 Director and portfolio manager, Columbia Management Group, Inc. (2001-2005) Began business career in 1986 Joined Fund team in 2007 Fund ownership -- None |
| Daniel Geber Managing director and portfolio manager, Epoch Investment Partners, Inc. since 2004 Partner, Trident Investment Management (1998-2004) Began business career in 1985 Joined Fund team in 2007 Fund ownership -- None |
| David N. Pearl Executive vice president, head of U.S. equities and portfolio manager, Epoch Investment Partners, Inc. since 2004 Managing director and portfolio manager, Steinberg Priest & Sloane Capital Management, LLC (2002-2004) Began business career in 1983 Joined Fund team in 2007 Fund ownership -- None |
Other Accounts the Portfolio Managers are Managing
The table below indicates for each portfolio manager, information about the accounts over which the portfolio manager has day-to-day investment responsibility. All information on the number of accounts and total net assets in the table is as of October 31, 2007. For purposes of the table, "Other Pooled Investment Vehicles" may include investment partnerships, pooled separate accounts, and group trusts, and "Other Accounts" may include separate accounts for institutions or individuals, insurance company general or non-pooled separate accounts, pension funds and other similar institutional accounts.
| P O R T F O L I O M A N A G E R | O T H E R A C C O U N T S M A N A G E D B Y T H E P O R T F O L I O M A N A G E R S |
| William W. Priest | Other Registered Investment Companies: Three (3) funds |
| with total net assets of approximately $1.1 billion | |
| Other Pooled Investment Vehicles: Thirty-two (32) entities with | |
| total net assets of approximately $3.2 billion | |
| Other Accounts: One hundred thirty-one (131) accounts with | |
| total net assets of approximately $2.2 billion | |
| Eric Sappenfield | Other Registered Investment Companies: One (1) fund with total |
| net assets of approximately $588 million | |
| Other Pooled Investment Vehicles: Two (2) entities with total net | |
| assets of approximately $869 million | |
| Other Accounts: None | |
| Michael A. Welhoelter | Other Registered Investment Companies: Three (3) funds with |
| total net assets of approximately $1.1 billion | |
| Other Pooled Investment Vehicles: Thirty-two (32) entities with | |
| total net assets of approximately $3.2 billion | |
| Other Accounts: One hundred thirty-one (131) accounts with | |
| total net assets of approximately $2.2 billion | |
| Daniel Geber | Other Registered Investment Companies: One (1) fund with total |
| net assets of approximately $514 million | |
| Other Pooled Investment Vehicles: Five (5) entities with total net | |
| assets of approximately $266 million | |
| Other Accounts: Two (2) accounts with total net assets of | |
| approximately $135 million | |
| David N. Pearl | Other Registered Investment Companies: Three (3) funds with |
| total net assets of approximately $1.1 billion | |
| Other Pooled Investment Vehicles: Thirty-two (32) entities with | |
| total net assets of approximately $3.2 billion | |
| Other Accounts: One hundred thirty-one (131) accounts with | |
| total net assets of approximately $2.2 billion | |
Neither the Adviser nor the Subadviser receives a fee based upon the investment performance of any of the accounts included under "Other Accounts Managed by the Portfolio Managers" in the table above.
With respect to accounts managed by Messrs. Priest, Welhoelter and Pearl, the Subadviser receives performance-based fees with respect to five (5) Other Accounts with total assets of approximately $46 million and one (1) Other Pooled Investment Vehicle with total assets of approximately $14 million.
Information about the Analytic portfolio managers
Management Biographies and Fund ownership
Below is an alphabetical list of the Analytic portfolio managers who share joint responsibility for the implementation and execution of the Fund's options strategy. It provides a brief summary of their business careers over the past five years and their range of beneficial share ownership in the Fund as of October 31, 2007.
| Harindra de Silva, Ph. D., CFA President and portfolio manager, Analytic Investors, LLC since 1995 Principal at Analysis Group, Inc. (1986-1994) Began business career in 1984 Joined Fund team in 2007 Fund ownership -- None |
| Gregory M. McMurran Chief investment officer and portfolio manager, Analytic Investors, LLC since 1976 Began business career in 1976 Joined Fund team in 2007 Fund ownership -- None |
| Dennis Bein, CFA Chief investment officer and portfolio manager, Analytic Investors, LLC since 1995 Senior consultant, AG Risk Management (1990-1998) Began business career in 1990 Joined Fund team in 2007 Fund ownership -- None |
| Scott Barker, CFA Portfolio manager Analytic Investors, LLC since 1995 Research analyst, Analysis Group, Inc. (1993-1998) Began business career in 1987 Joined Fund team in 2007 Fund ownership -- None |
| P O R T F O L I O M A N A G E R | O T H E R A C C O U N T S M A N A G E D B Y T H E P O R T F O L I O M A N A G E R S |
| Harindra de Silva, Ph.D., CFA | Other Registered Investment Companies: Twenty (20) funds |
| with total net assets of approximately $4.9 billion | |
| Other Pooled Investment Vehicles: Twenty-eight (28) entities | |
| with total net assets of approximately $2.4 billion | |
| Other Accounts: Thirty-two (32) accounts with total net assets of | |
| approximately $4.3 billion | |
| Gregory M. McMurran | Other Registered Investment Companies: Seven (7) funds with |
| total net assets of approximately $1.9 billion | |
| Other Pooled Investment Vehicles: Three (3) entities with total | |
| net assets of approximately $2.9 billion | |
| Other Accounts: Five (5) accounts with total net assets of | |
| approximately $1.09 billion | |
| P O R T F O L I O M A N A G E R | O T H E R A C C O U N T S M A N A G E D B Y T H E P O R T F O L I O M A N A G E R S |
| Dennis Bein, CFA | Other Registered Investment Companies: Twenty (20) funds |
| with total net assets of approximately $4.9 billion | |
| Other Pooled Investment Vehicles: Twenty-eight (28) entities | |
| with total net assets of approximately $2.3 billion | |
| Other Accounts: Thirty-three (33) accounts with total net assets | |
| of approximately $3.4 billion | |
| Scott Barker, CFA | Other Registered Investment Companies: (6) funds with total net |
| assets of approximately $1.8 billion | |
| Other Pooled Investment Vehicles: None | |
| Other Accounts: One (1) account with total net assets of | |
| approximately $14.4 billion | |
Neither the Adviser nor the Subadviser receives a fee based upon the investment performance of any of the accounts included under "Other Accounts Managed by the Portfolio Managers" in the table above, except for Messrs. de Silva, McMurran and Bein, who each receive a fee based on performance for 20 accounts, 2 accounts and 19 accounts, respectively, for "Other Pooled Investments" and for 14 accounts, 1 account and 13 accounts, respectively, for "Other Accounts" in the table above.
Conflicts of Interest
Conflicts of interest may arise because the Fund's portfolio managers have day-to-day management responsibilities with respect to both the Fund and various other accounts. These potential conflicts include:
• Limited Resources. The portfolio managers cannot devote their full time and attention to the management of each of the accounts that they manage. Accordingly, the portfolio managers may be limited in their ability to identify investment opportunities for each of the accounts that are as attractive as might be the case if the portfolio managers were to devote substantially more attention to the management of a single account. The effects of this potential conflict may be more pronounced where the accounts have different investment strategies.
• Limited Investment Opportunities. Other clients of either Subadviser may have investment objectives and policies similar to those of the Fund. Either Subadviser may, from time to time, make recommendations which result in the purchase or sale of a particular security by its other clients simultaneously with the Fund. If transactions on behalf of more than one client during the same period increase the demand for securities being purchased or the supply of securities being sold, there may be an adverse effect on price or quantity. It is the policy of each Subadviser to allocate advisory recommendations and the placing of orders in a manner that it believes is equitable to the accounts involved, including the Fund. When two or more clients of a Subadviser are purchasing or selling the same security on a given day from the same broker-dealer, such transactions may be averaged as to price.
• Different Investment Strategies. The accounts managed by the portfolio managers have differing investment strategies. If the portfolio managers determine that an investment opportunity may be appropriate for only some of the accounts or decide that certain of the accounts should take different positions with respect to a particular security, the portfolio managers may effect transactions for one or more accounts which may affect the market price of the security or the execution of the transaction, or both, to the detriment or benefit of one or more other accounts.
ITEM 9. PURCHASES OF EQUITY SECURITIES BY CLOSED-END MANAGEMENT INVESTMENT COMPANY AND AFFILIATED PURCHASERS.
Not applicable.
ITEM 10. SUBMISSION OF MATTERS TO A VOTE OF SECURITY HOLDERS.
(a) The registrant has adopted procedures by which shareholders may recommend nominees to the registrant's Board of Trustees. A copy of the procedures is filed as an exhibit to this Form N-CSR. See attached "John Hancock Funds - Governance Committee Charter".
ITEM 11. CONTROLS AND PROCEDURES.
(a) Based upon their evaluation of the registrant's disclosure controls and procedures as conducted within 90 days of the filing date of this Form N-CSR, the registrant's principal executive officer and principal financial officer have concluded that those disclosure controls and procedures provide reasonable assurance that the material information required to be disclosed by the registrant on this report is recorded, processed, summarized and reported within the time periods specified in the Securities and Exchange Commission's rules and forms.
(b) There were no changes in the registrant's internal control over financial reporting that occurred during the registrant's most recent fiscal half-year (the registrant's second fiscal half-
year in the case of an annual report) that have materially affected, or are reasonably likely to materially affect, the registrant's internal control over financial reporting.
ITEM 12. EXHIBITS.
(a)(1) Code of Ethics for Senior Financial Officers is attached.
(a)(2) Separate certifications for the registrant's principal executive officer and principal financial officer, as required by Section 302 of the Sarbanes-Oxley Act of 2002 and Rule 30a-2(a) under the Investment Company Act of 1940, are attached.
(b)(1) Separate certifications for the registrant's principal executive officer and principal financial officer, as required by 18 U.S.C. Section 1350, as adopted pursuant to Section 906 of the Sarbanes-Oxley Act of 2002, and Rule 30a-2(b) under the Investment Company Act of 1940, are attached. The certifications furnished pursuant to this paragraph are not deemed to be "filed" for purposes of Section 18 of the Securities Exchange Act of 1934, or otherwise subject to the liability of that section. Such certifications are not deemed to be incorporated by reference into any filing under the Securities Act of 1933 or the Securities Exchange Act of 1934, except to the extent that the Registrant specifically incorporates them by reference.
(c)(1) Submission of Matters to a Vote of Security Holders is attached. See attached "John Hancock Funds - Governance Committee Charter".
(c)(2) Approval of Audit, Audit-related, Tax and Other Services is attached.
(c)(3) Contact person at the registrant.
SIGNATURES
Pursuant to the requirements of the Securities Exchange Act of 1934 and the Investment Company Act of 1940, the registrant has duly caused this report to be signed on its behalf by the undersigned, thereunto duly authorized.
John Hancock Tax-Advantaged Global Shareholder Yield Fund
By: /s/ Keith F. Hartstein
-------------------------------------
Keith F. Hartstein
President and Chief Executive Officer
Date: December 19, 2007
Pursuant to the requirements of the Securities Exchange Act of 1934 and the Investment Company Act of 1940, this report has been signed below by the following persons on behalf of the registrant and in the capacities and on the dates indicated.
By: /s/ Keith F. Hartstein
-------------------------------------
Keith F. Hartstein
President and Chief Executive Officer
Date: December 19, 2007
By: /s/ Charles A. Rizzo
-------------------------------------
Charles A. Rizzo
Chief Financial Officer
Date: December 19, 2007