 The Dolan Company Investor Presentation (NYSE: DM) James P. Dolan Chairman, President and CEO Vicki J. Duncomb Vice President and CFO Bob Evans Director, Business Development & Investor Relations Exhibit 99.2 |
 Forward—Looking Statements 2 In addition to historical information, this presentation contains forward-looking statements that reflect our current expectations and projections about future results, performance, prospects and opportunities. These forward-looking statements are subject to a number of risks, uncertainties and other factors that may cause actual results, performance, prospects or opportunities to be materially different from those expressed in, or implied by, such forward-looking statements. These risks and uncertainties include those described in the Risk Factors and Forward-Looking Statements sections of the company’s quarterly and annual reports filed with the SEC, including the Form 10-K filed on March 9, 2012. Copies of the company’s SEC filings are available at the SEC’s web site and at www.thedolancompany.com. You should not place undue reliance on any forward-looking statements. We assume no obligation to update any forward-looking statements for any reason, even if new information becomes available, new events occur or circumstances change. |
 The Dolan Company at a Glance Court & commercial media Electronic and print Processing services E-discovery services Appellate services 1) Revenue mix is based on third quarter 2012 results BUSINESS INFORMATION 27% of revenues (1) 3 |
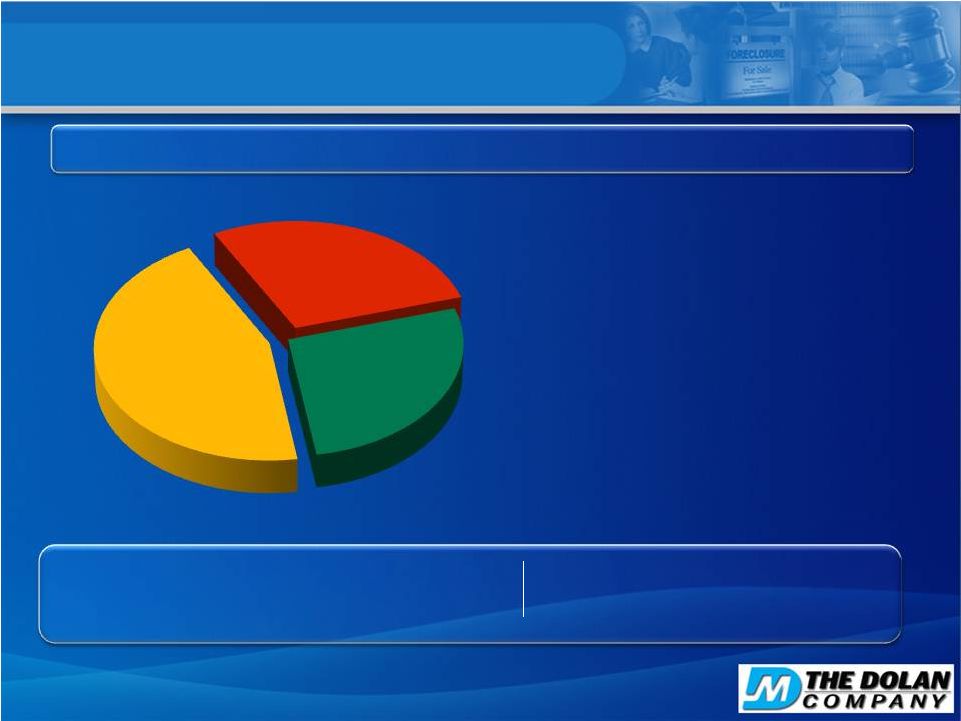
 Q3 2012 Q3 2011 y/y Revenue $49.8m $51.4m -3.1% 2011 2010 y/y $190.1m $210.5m -9.7% Professional Services: 73% of total company Q3 2012 revenues 4 Third Quarter 2012 Professional Services Revenue Mix Professional Services Division 46.4% 7.7% 45.9% |
 1) Based on our estimated volume of mortgages in foreclosure and the average revenue we derived per file in 2011 which we believe would be generally representative of rates charged for mortgage default processing services throughout the United States 2) Seasonally-adjusted total delinquent loans as a percentage of mortgages outstanding, according to the Mortgage Bankers Association 3) Seriously delinquent loans (90+ days) outstanding by state, according to the Mortgage Bankers Association > 100K 20K- 100K < 20K 4.95% 5.82% 7.88% 2006 2007 2008 2009 2010 2011 9.47% 8.25% Seriously Delinquent Loans – Q3 2012 Historical Delinquency Trends (2) Seriously Delinquent Loans (3) 5 7.58% Q3 2012 7.40% Nationwide Market $1b Market Opportunity (1) |
 6 1) Foreclosure starts as a percentage of mortgages outstanding by state according to the MBA’s National Delinquency Survey for the quarter ended September 30, 2012 Leading Provider of Processing Services 1. New Jersey 2. Florida Rankings in loans 90+ days past due States with the highest residential mortgage foreclosure starts (1) 5. Georgia 7. Nevada 11. Indiana 12. Michigan 25. California 39. Texas 40. Minnesota #1 #3 #5 #13 #19 #27 #16 |
 Law Law Firm Firm Law Law Firm Firm Law Law Firm Firm Law Law Firm Firm Law Law Firm Firm Law Law Firm Firm Law Law Firm Firm Fees paid by servicers to law firms benchmarked by GSEs and government agencies: Fannie Mae, Freddie Mac, FHA, VA California 7 What We Do |
 Growth Strategy: Five Ways to Win 8 PRICE INCREASES T ECHNOLOGY S ERVICES IN NEW MARKETS E XPAND G EOGRAPHIC F OOTPRINT M ORE B USINESS F ROM E XISTING C LIENTS M ANDATED A DDITIONAL STEPS |
 9 Fast-Growing e-Discovery Market $4 billion+ market, double-digit growth (1) Fortune 1000 companies need high quality with controllable costs Rising litigation data volume, regulatory demands Market share gains via technology innovations, synergistic sales/marketing 1) Source: The Dolan Company estimate DiscoverReady’s Client Mix |
 The E-Discovery Process 10 Information Management Identification Presentation Preservation Collection Review Analysis Processing Production |
 11 Technology Neutral Constantly evaluating tools on market Client- centered solutions Thought Leadership Industry- recognized discovery professionals Dedicated practice groups Experts in designing processes Innovation PrivBank ® Decision® i- Competitive Advantages |
 12 Large Appellate Services Market 1) 2) http://www.uscourts.gov/Statistics/FederalJudicialCaseloadStatistics/FederalJudicialCaseloadStatistics2011.aspx Number of Cases Handled in 2011 Total U.S. Filings ~ 300,000 ~ 8,600 ~ 56,000 Counsel Press Federal (1) State (2) Highly fragmented sector, limited competition Law firm outsourcing driven by increasing volumes, complexity Building on our market- leading position as nation’s largest Source: Examining the Work of State Courts: An analysis of 2008 State Court Caseloads |
 Business Information: Business Information: 27% of total company 27% of total company Q3 2012 revenues Q3 2012 revenues 13 Display & Classified Subscription & Other Public Notice Q3 2012 Q3 2011 y/y Revenue $18.3m $18.8m -2.8% 2011 2010 y/y $78.5m $83.8m -6.4% Third Quarter 2012 Business Information Revenue Mix 44.6% 28.4% 27.0% Business Information Division |
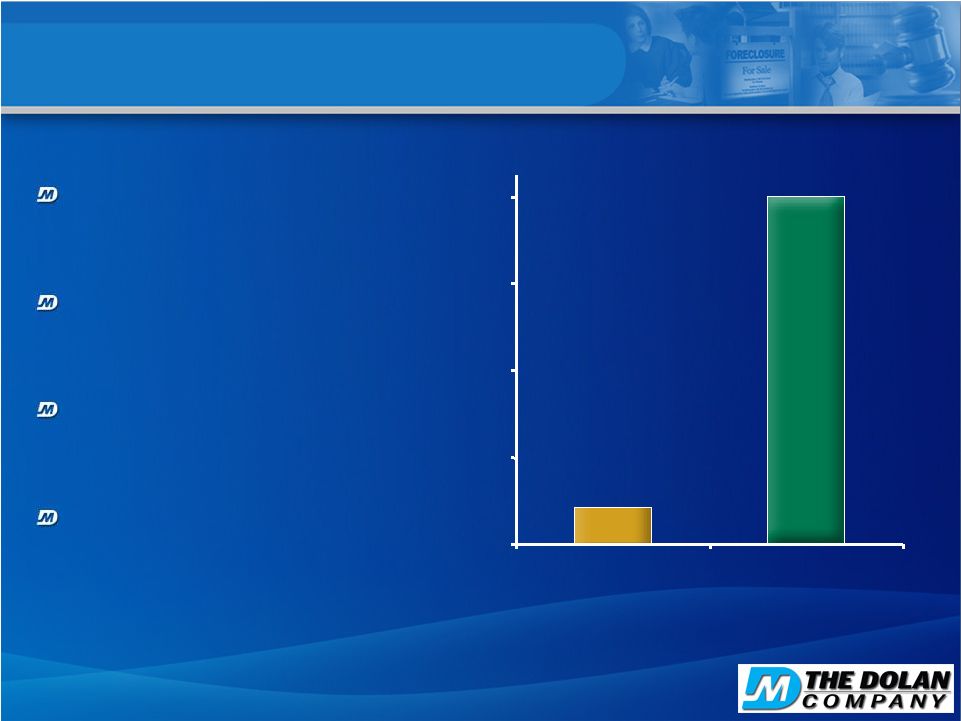 14 Attractive Business Information Market Highly fragmented U.S. market with 600+ titles (1) Approximately 4% market share Attractive local market fundamentals Higher barriers to entry 1) Source: The Dolan Company estimate $2 billion $78.5 million 0 400 800 1,200 1,600 The Dolan Company Full Year 2011 Business Information Revenue Total Market Opportunity (1) |
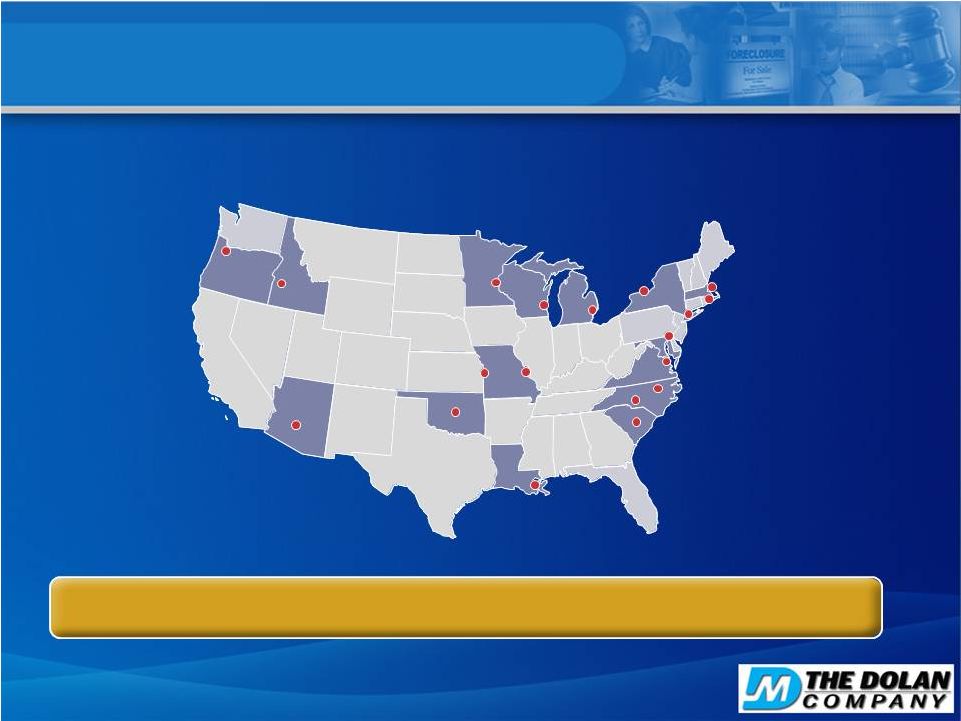 Business Information Division National Footprint The Dolan Company Business Information Operations 15 19 markets 100+ titles 100+ web sites |
 Q3 2012 Revenue Mix by Revenue Line Countercyclical Cyclical / Non-Cyclical Foreclosure Public Notice Mortgage Default Processing Services Display & Classified Advertising eDiscovery Subscription & Other Q3 2012 Revenue Mix Other Public Notice 16 Appellate Services 5.6% 34.0% 33.5% 8.9% 3.1% 7.3% 7.6% |
 Name Title Yrs Experience Previous Jim Dolan Chairman, President, CEO 37 News Corporation, Wall Street M&A Scott Pollei EVP, COO 25 KPMG Vicki J. Duncomb VP, CFO 28 McGraw-Hill Renee Jackson VP, General Counsel 21 Fair Isaac Corp., Fulbright & Jaworski Mark Stodder EVP – Business Information 30 L.A. Independent Newspapers, Post Newspaper Group David Trott Chairman, CEO – NDeX 27 Scott Goldstein President – NDeX 25 Trott & Trott, Schlumberger Jim Wagner CEO – DiscoverReady 17 Document Technologies, Inc. Steve Harber President – DiscoverReady 22 Palisades Advisors 17 Proven and Experienced Leadership |
 Financial Overview Financial Overview 18 |
 19 Financial Profile Strong cash flow conversion Meaningful operating leverage Successful acquisitions accretive to cash flow |
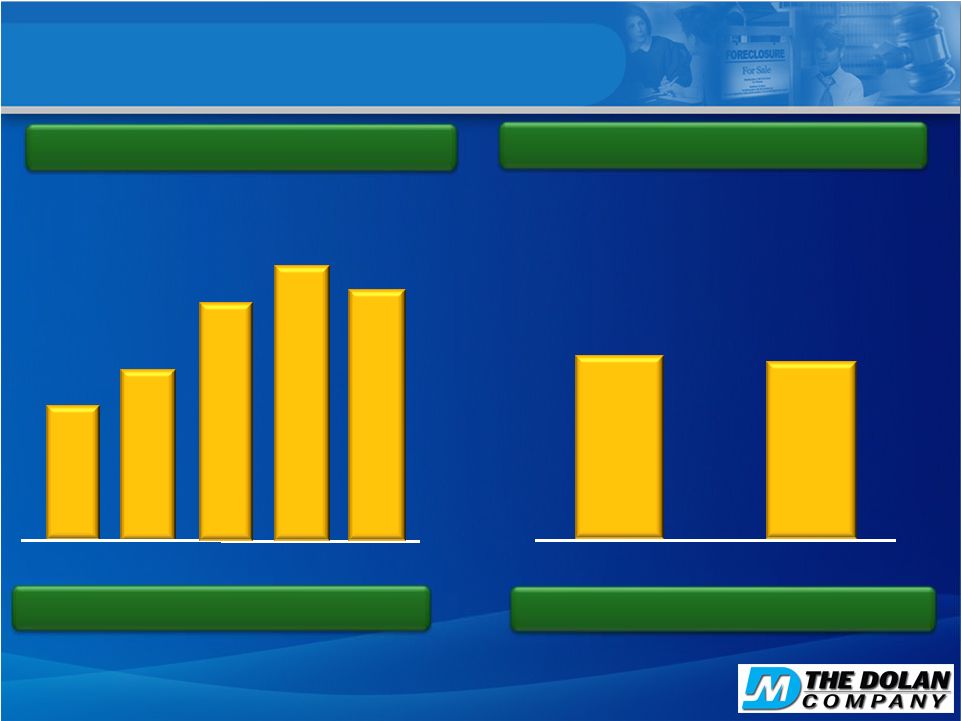 $294.3 $146.1 $255.6 2007 2008 2010 Y/Y 25.8% 39.1% 15.1% -8.7% 2009 $183.8 $68.1 Q3 11 Q3 12 Quarterly Revenues ($ in mm) $70.2 Annual Revenues ($ in mm) 20 $268.6 2011 Y/Y -3.0% Revenues |
 Y/Y -20.7% Quarterly Adj. EBITDA (1) ($ in mm) $12.6 $15.9 Q3 11 Q3 12 Adjusted EBITDA (1) ($ in mm) $90.7 $42.5 $82.0 2007 2008 2010 2009 $55.4 21 2011 $56.1 Y/Y 30.4% 48.0% 10.6% -38.1% Adjusted EBITDA 1. Please refer to the company’s earnings releases for 2007 through 2011 and for the third quarter of 2012, dated March 27, 2008, February 24. 2009, February 23, 2010, February 23, 2011, March 9, 2012, and November 2, 2012, respectively, for a reconciliation of Adjusted EBITDA to the comparable GAAP measure and the reasons we consider Adjusted EBITDA an important measure of our financial performance. |
 22 $59.3 2010 2011 $38.8 Annual Free Cash Flow Annual Free Cash Flow (1) (1) ($ in millions) ($ in millions) FCF Conversion Historically> 50% of Adjusted EBITDA FCF Conversion Historically> 50% of Adjusted EBITDA $17.6 2012 Q3 YTD Strong Free Cash Flow Generation Note: Free Cash Flow Conversion is defined as Cash Provided by Operating Activities – Capex / Adjusted EBITDA. 1. Please refer to the company’s earnings releases for 2010 through 2011 and for the third quarter of 2012, dated February 23, 2011, March 9, 2012, and November 2, 2012, respectively, for a reconciliation of free cash flow to the comparable GAAP measure and the reasons we consider free cash flow an important measure of our financial performance. |
 How We Believe We Can De-lever Assumptions: Net debt as of 9/30/12 $174.6M Net debt as of 12/31/12 (unaudited) $162.5M Estimated proceeds from preferred stock $15M+ Expected 2013 free cash flow $20M+ Estimated 2013 federal income tax refund $7M+ Based on expected NOL carryforward at 12/31/12 of $20M+ 23 |
 Financial Coverage TTM Adjusted EBITDA (1) $46.6M Expected 2013 cash interest (2) $10.0M (Excludes dividend payment from preferred stock) Expected Adjusted EBITDA Coverage Ratio (3) > 4.0x Higher rate on preferred stock offset by lower rate on the bank grid scale – neutral to free cash flow 24 1. Represents Adjusted EBITDA for the four quarters ended September 30, 2012. Please refer to the company’s earnings releases for the fourth quarter of 2011 and the first second and third quarters of 2012, dated March 9, 2012, May 8, 2012, August 1, 2012, and November 2, 2012, respectively, for a reconciliation of Adjusted EBITDA to the comparable GAAP measure and the reasons we consider Adjusted EBITDA an important measure of our financial performance. 2. Based on assumed average debt of $160 million and an average interest rate of 6.0% during 2013. 3. Assumes 2013 Adjusted EBITDA greater than $40 million as reflected above and expected 2013 cash interest reflected above. Adjusted EBITDA Coverage Ratio is calculated as Adjusted EBITDA divided by cash interest. |
 Capital Sources (in millions) 9/30/2012 Cash & Equivalents $15.6 Senior Term Loan Due 2015 $141.3 Revolving Debt Facility Due 2015 $48.0 ($16.5m unused capacity) * Defined as the ratio of outstanding indebtedness to trailing pro-forma Adjusted EBITDA Managing Leverage 2011 2010 2009 2012 25 1 2 3 4 5 Q1 Q2 Q3 Q4 Q1 Q2 Q3 Q4 Q1 Q2 Q3 Q4 Q1 Q2 Q3 Leverage Ratios * |