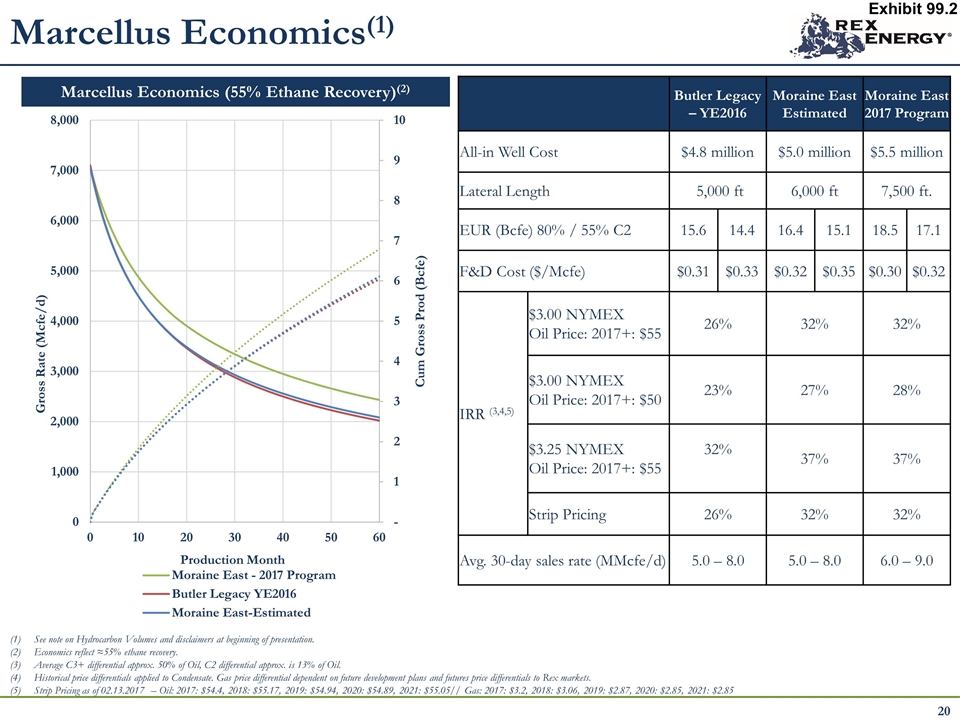
Marcellus Economics(1) Marcellus Economics (55% Ethane Recovery)(2) 20 Butler Legacy – YE2016 Moraine East Estimated Moraine East 2017 Program All-in Well Cost $4.8 million $5.0 million $5.5 million Lateral Length 5,000 ft 6,000 ft 7,500 ft. EUR (Bcfe) 80% / 55% C2 15.6 14.4 16.4 15.1 18.5 17.1 F&D Cost ($/Mcfe) $0.31 $0.33 $0.32 $0.35 $0.30 $0.32 IRR (3,4,5) $3.00 NYMEX Oil Price: 2017+: $55 26% 32% 32% $3.00 NYMEX Oil Price: 2017+: $50 23% 27% 28% $3.25 NYMEX Oil Price: 2017+: $55 32% 37% 37% Strip Pricing 26% 32% 32% Avg. 30-day sales rate (MMcfe/d) 5.0 – 8.0 5.0 – 8.0 6.0 – 9.0 See note on Hydrocarbon Volumes and disclaimers at beginning of presentation. Economics reflect ≈55% ethane recovery. Average C3+ differential approx. 50% of Oil, C2 differential approx. is 13% of Oil. Historical price differentials applied to Condensate. Gas price differential dependent on future development plans and futures price differentials to Rex markets. Strip Pricing as of 02.13.2017 – Oil: 2017: $54.4, 2018: $55.17, 2019: $54.94, 2020: $54.89, 2021: $55.05// Gas: 2017: $3.2, 2018: $3.06, 2019: $2.87, 2020: $2.85, 2021: $2.85 Exhibit 99.2

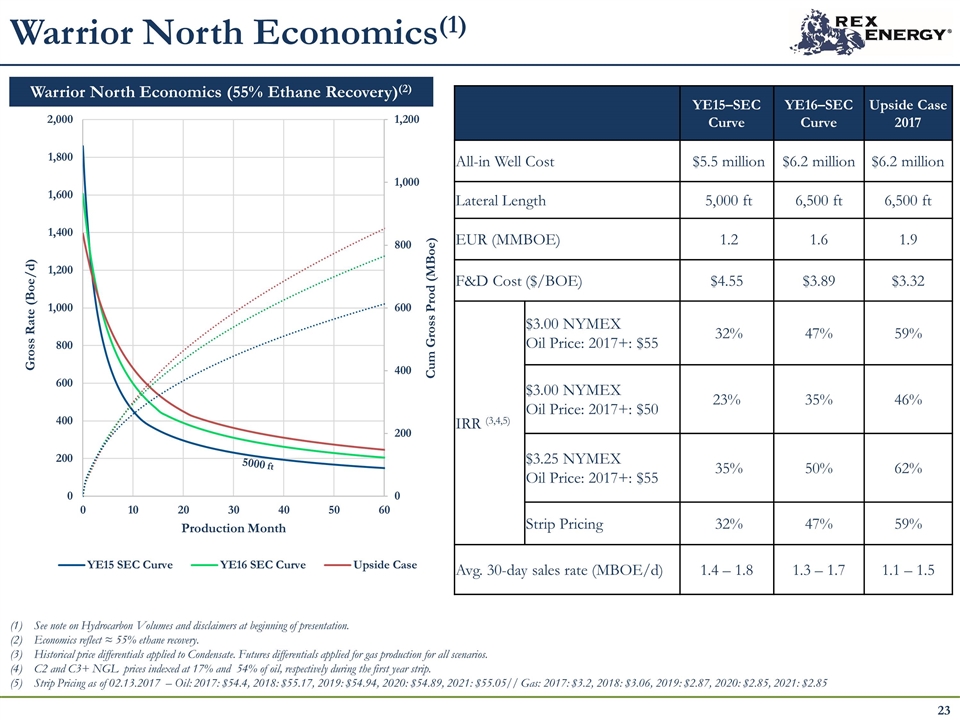
See note on Hydrocarbon Volumes and disclaimers at beginning of presentation. Economics reflect ≈ 55% ethane recovery. Historical price differentials applied to Condensate. Futures differentials applied for gas production for all scenarios. C2 and C3+ NGL prices indexed at 17% and 54% of oil, respectively during the first year strip. Strip Pricing as of 02.13.2017 – Oil: 2017: $54.4, 2018: $55.17, 2019: $54.94, 2020: $54.89, 2021: $55.05// Gas: 2017: $3.2, 2018: $3.06, 2019: $2.87, 2020: $2.85, 2021: $2.85 YE15–SEC Curve YE16–SEC Curve Upside Case 2017 All-in Well Cost $5.5 million $6.2 million $6.2 million Lateral Length 5,000 ft 6,500 ft 6,500 ft EUR (MMBOE) 1.2 1.6 1.9 F&D Cost ($/BOE) $4.55 $3.89 $3.32 IRR (3,4,5) $3.00 NYMEX Oil Price: 2017+: $55 32% 47% 59% $3.00 NYMEX Oil Price: 2017+: $50 23% 35% 46% $3.25 NYMEX Oil Price: 2017+: $55 35% 50% 62% Strip Pricing 32% 47% 59% Avg. 30-day sales rate (MBOE/d) 1.4 – 1.8 1.3 – 1.7 1.1 – 1.5 5000 ft 23 Warrior North Economics(1) Warrior North Economics (55% Ethane Recovery)(2)

