Investor Presentation
May 20, 2008

This presentation contains forward-looking statements within the meaning of Section 27A of the Securities Act of
1933 and Section 21E of the Securities Exchange Act of 1934, which reflect our current views with respect to,
among other things, our operations and financial performance. In some cases, you can identify these forward-
looking statements by the use of words such as “outlook”, “believes”, “expects”, “potential”, “continues”, “may”,
“will”, “should”, “seeks”, “approximately”, “predicts”, “intends”, “plans”, “estimates”, “anticipates” or the negative
version of these words or other comparable words. All statements other than statements of historical fact included
in this presentation are forward-looking statements and are based on various underlying assumptions and
expectations and are subject to known and unknown risks, uncertainties and assumptions, and may include
projections of our future financial performance based on our growth strategies and anticipated trends in our
business. Such forward-looking statements are subject to various risks and uncertainties. Accordingly, there are
or will be important factors that could cause actual outcomes or results to differ materially from those indicated in
these statements. We believe these factors include, but are not limited to, those described under “Risk Factors”
discussed in our Form 10-K filed with the SEC on March 26, 2008. These factors should not be construed as
exhaustive and should be read in conjunction with the other cautionary statements that are included in this
discussion. In addition, new risks and uncertainties emerge from time to time, and it is not possible for us to
predict all risks and uncertainties, nor can we assess the impact of all factors on our business or the extent to
which any factor, or combination of factors, may cause actual results to differ materially from those contained in
any forward-looking statements. Accordingly, you should not rely upon forward-looking statements as a prediction
of actual results and we do not assume any responsibility for the accuracy or completeness of any of these
forward-looking statements. We undertake no obligation to publicly update or review any forward-looking
statement, whether as a result of new information, future developments or otherwise.
Forward Looking Statements
2

Introduction to Duff & Phelps

Positioned to capitalize on key industry trends
Uniquely qualified to succeed
Broad and well-balanced service offerings for all markets
Benefiting from today’s volatile market environment
Strong financial performance
Significant growth opportunities
Investment Highlights
4

Positioned to Capitalize on Key Industry Trends
“Investors have been clamoring for more use
of fair value in financial statements, because
they think it provides a more accurate picture
of the company’s balance sheet than
historical cost figures.” – Reuters, September
2006
“Turnaround firms, faced with increasing
demand for their service…, are beefing up
staffs in anticipation of an increase in
corporate restructurings and bankruptcies
this year.” – Wall Street Journal, May 2007
“Companies often hire small, independent
boutiques to provide deal advice that
counterbalances input from bulge-bracket
firms . . . that may have many internal
competing agendas.” – Wall Street Journal,
September 2007
Corporate Restructuring
Fair Value Accounting
Independent Advice
5
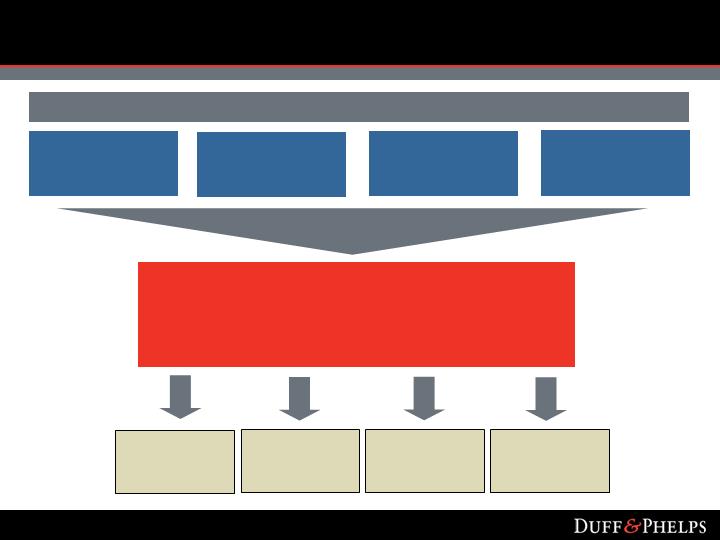
Valuation Services are the Foundation of Our Business
Fair Value
Accounting
Transparency
Corporate
Restructuring
Independence
VALUATION SERVICES
- Financial Reporting - Portfolio Valuation
- Transaction Opinions - Tax Valuation
- General Business Valuations - Financial Engineering
Specialty
Tax
Dispute
Consulting
M&A
Restructuring
Technical Expertise
Market Trends
6

Long-Standing, Diverse Client Base
Approximately one-third of the S&P 500 companies
Leading multi-national firms
Top-tier private equity firms and hedge funds
Client diversification
7

Technical Expertise
Independence
Scale
Brand
Culture
What Makes Duff & Phelps Unique?
8
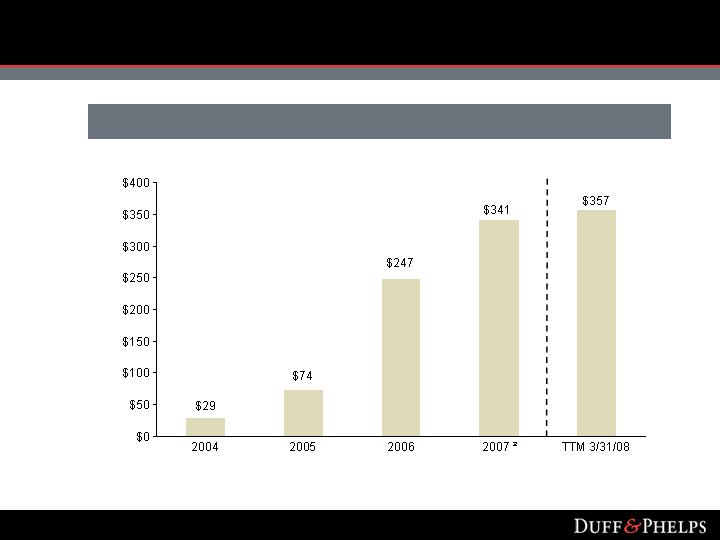
Financial Highlights
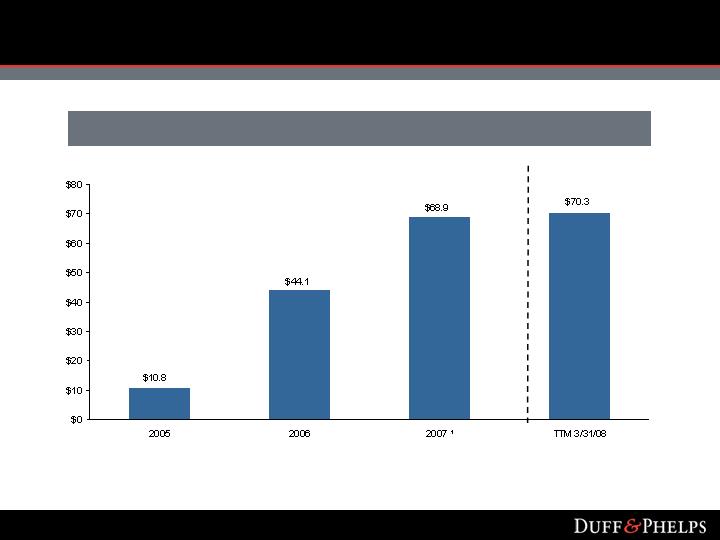
1 Total revenue excludes reimbursable expenses.
2 Revenue represents Aggregated Successor and Predecessor results.
3 TTM 3/31/08 represents the Trailing Twelve Months Ended March 31, 2008.
Duff & Phelps Revenue1
($ in millions)
3
9
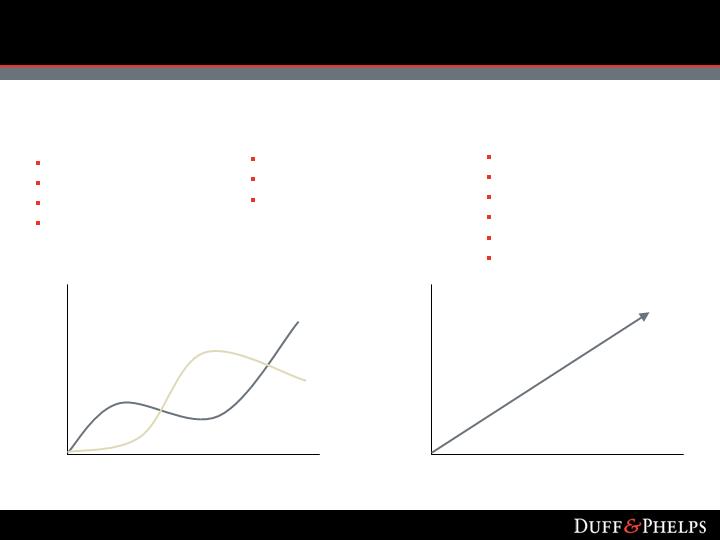
Broad & Well-Balanced Service Portfolio
Counter-Cyclical
Restructuring Advisory
Dispute Consulting
FAS 142 (goodwill
impairment)
Strong Secular
Trends / Non-Cyclical
Portfolio Valuation
Financial Engineering
Transfer Pricing
Property Tax
General Valuation
International
M&A Driven
FAS 141
M&A Advisory
Transaction Opinions
M&A Due Diligence
M&A Driven
Counter-
Cyclical
10

Impact of Today’s Credit Environment
Duff & Phelps is benefiting from the market dislocation
Hired by multiple global financial institutions to provide independent valuation
assessments of their loan and CDO portfolios
Hired to provide multiple transaction opinions and related advice with respect to
distressed bail-out situations in the financial services sector
Hired as a restructuring advisor in connection with a distressed sub-prime
situation
Major corporate clients are hiring D&P to value their investment portfolios,
particularly given their typical concentrations in money-market, municipals and
CDO-related investments
FAS 142 impairment valuation practice seeing lift in today’s environment
11

Growth Strategy
International expansion
Complementary / new service offerings
Cross-selling
Brand building
Focus on balance
12
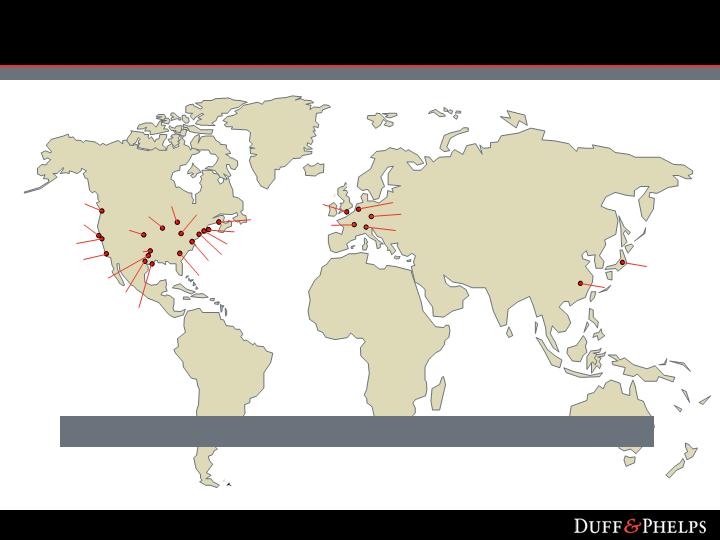
Expanding Global Platform
Tokyo
Silicon Valley
San Francisco
Seattle
Detroit
Chicago
Houston
Dallas
Los Angeles
Denver
Austin
Amsterdam
London
Munich
Zurich
Paris
Plano
Cincinnati
Boston
New York
Morristown
Philadelphia
Atlanta
Washington, DC Metro
Significant International Growth Opportunities
Shanghai
13

Expanding Global Platform
Increased global restructuring capability by adding
experienced restructuring professionals in Paris
Continued expansion in Asia through the opening of a
Shanghai office
Strategic relationship with Shinsei Bank in Japan supports
platform for further Asian market penetration
Continued growth throughout Europe and Asia
14

Our Culture
Unconflicted
Dynamic
Environment
Multiple Growth
Channels
Cross-selling
75 Year History
Partnership
Heritage
Global Presence
Blue Chip Clients
Diverse Portfolio
Collaborative, Team-Oriented Culture
LARGE, STABLE
ORGANIZATION
HIGH GROWTH
FIRM
15

Operational and Financial Highlights

Delivering Solutions
Financial Advisory
Valuation Advisory
Corporate Finance
Consulting
Specialty Tax
Dispute & Legal
Management
Consulting
Investment Banking
Transaction Opinions
M&A Advisory
Restructuring
17
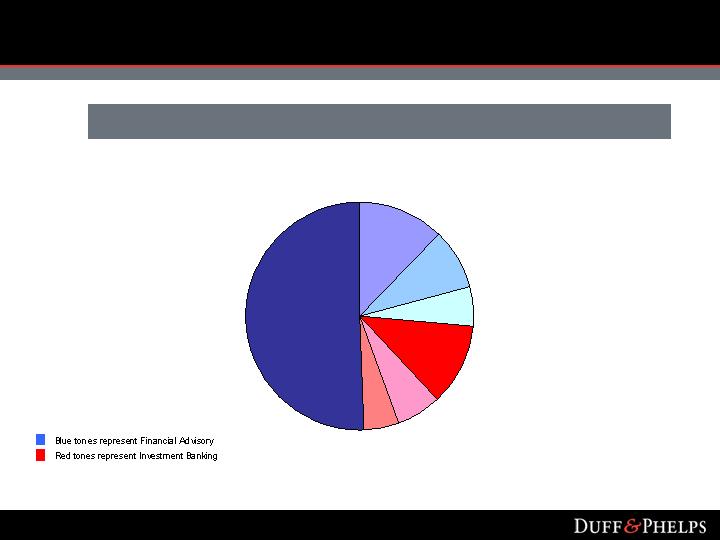
Financial Highlights
Revenue1 Snapshot by Service Category
¹ Represents revenue for the Trailing Twelve Months Ended March 31, 2008.
Corporate Finance Consulting 12%
Valuation Advisory Services 51%
Specialty Tax 8%
Dispute and Legal Management 6%
Transaction Opinions 12%
M&A Advisory 6%
Restructuring 5%
18

Business Model Diversification
Pricing
Key Metrics
Financials
Rates & Hours
Utilization
Rate per Hour
Mid 40% Gross Margin
More Predictable
Big 4
Specialty consulting
Retainer / Success Fee
Revenue per Professional
Backlog / Pipeline
High 40% Gross Margin
Transaction Based
Boutique investment banks
FINANCIAL
ADVISORY
INVESTMENT
BANKING
23%
Technical Expertise in Financial Analysis & Valuation
77%
Competition
19
Selected Operating Metrics
Financial Advisory
Investment Banking
Total
2005
2006
2007 2
425
84
509
746
98
844
($000s)
Financial Advisory
Investment Banking
Total
$344
$424
$377
$374
$651
$415
$409
$808
$464
Utilization
Rate per hour ($)
71.4%
$264
68.1%
$300
69.0%
$323
1 Revenue per professional calculated by dividing total segment revenue by average headcount for the given period of time.
2 Revenue used for calculation represents Aggregated Successor and Predecessor results and excludes reimbursable expenses.
3 Excludes approximately 60 professionals and approximately $1.6 million and $2.0 million of revenue associated with Rash & Associates in 2007 and Q1 2008, respectively.
Q1 2008
66.1%
$326
$95
$187
$105
807
109
916
553
118
671
Q1 2007
591
100
691
67.5%
$314
$102
$174
$114
20

Client Service Professionals
Sources of Growth
Financial Advisory1
52% of growth in headcount associated with Specialty Tax of which approximately 30%
resulted from the acquisition of Rash & Associates
25% of growth from additional domestic hiring across other service lines
23% of growth from hiring internationally
Investment Banking
Nine client service professionals hired in our Paris office to build a restructuring
business
Since the end of the quarter, we have built this restructuring practice to over 20 client
service professionals, including three managing directors
1 Between the quarters ended March 31, 2007 and March 31, 2008.
21
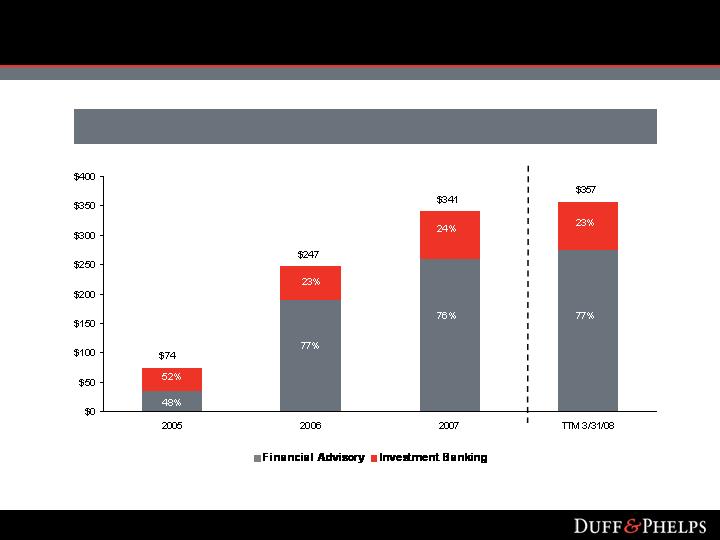
Financial Highlights
¹ 2007 represents Aggregated Successor and Predecessor results. TTM 3/31/08 represents the Trailing Twelve Months Ended March 31, 2008.
Revenue1
($ in millions)
22
Financial Highlights
¹ Represents Aggregated Successor and Predecessor results.
2 Represents Trailing Twelve Months Ended March 31, 2008.
Adjusted EBITDA
($ in millions)
2
23

Adjusted EBITDA Reconciliation
24
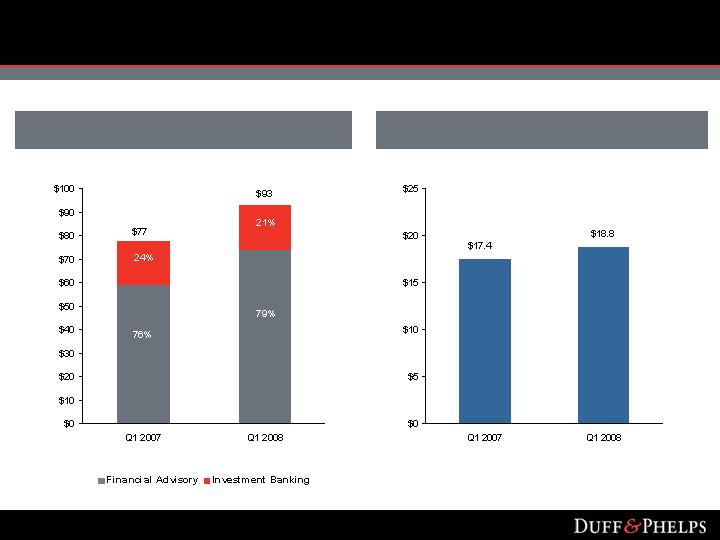
Q1 Adjusted EBITDA
Q1 Revenue
Financial Highlights
($ in millions)
25
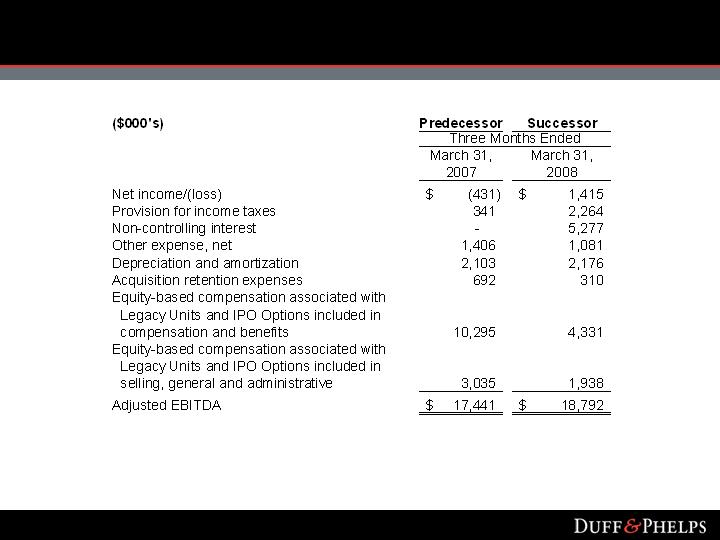
Adjusted EBITDA Reconciliation
26

Long-Term Financial Objectives
15-20% Total Revenue Growth
Mix of organic and acquired revenue
19-20% Adjusted EBITDA Margin
Gross margin leverage (productivity improvement, business mix)
Utilization
SG&A leverage
20% Adjusted Pro Forma EPS Growth
On a fully exchanged, fully diluted basis
Low-to-mid single digit % annual share count growth
Primarily with respect to Restricted Stock Awards granted in connection with ongoing equity
compensation
Excludes material acquisitions or additional share offerings
Note: The foregoing does not represent projections for any period, but rather long-term objectives that management utilizes
as goals in managing the business. Results for any particular period will reflect the impact of the business cycle and various
other factors, including those discussed under "Risk Factors" in our Form 10-K for the year ended December 31, 2007.
27

Conclusion

Positioned to capitalize on key industry trends
Uniquely qualified to succeed
Broad and well-balanced service offerings for all markets
Benefiting from today’s volatile market environment
Strong financial performance
Significant growth opportunities
Investment Highlights
29