UNITED STATES
SECURITIES AND EXCHANGE COMMISSION
Washington, D.C. 20549
FORM 10-Q
þ | QUARTERLY REPORT PURSUANT TO SECTION 13 OR 15(d) OF THE SECURITIES EXCHANGE ACT OF 1934. |
For the quarterly period ended March 31, 2010
OR
o | TRANSITION REPORT PURSUANT TO SECTION 13 OR 15(d) OF THE SECURITIES EXCHANGE ACT OF 1934. |
Commission File Number: 001-33693
DUFF & PHELPS CORPORATION
(Exact name of registrant as specified in its charter)
| DELAWARE | 20-8893559 |
(State of other jurisdiction or incorporation or organization) | (I.R.S. employer identification no.) |
55 East 52nd Street, 31st Floor
New York, New York 10055
(Address of principal executive offices)
(Zip code)
(212) 871-2000
(Registrant’s telephone number, including area code)
Indicate by check mark whether the registrant (1) has filed all reports required to be filed by Section 13 or 15(d) of the Securities Exchange Act of 1934 during the preceding 12 months (or for such shorter period that the registrant was required to file such reports), and (2) has been subject to such filing requirements for the past 90 days. Yes þ No o
Indicate by check mark whether the registrant has submitted electronically and posted on its corporate Web site, if any, every Interactive Data File required to be submitted and posted pursuant to Rule 405 of Regulations S-T (§232.405 of this chapter) during the preceding 12 months (or for such shorter period that the registrant was required to submit and post such files). Yes o No o
Indicate by check mark whether the registrant is a large accelerated filer, an accelerated filer, a non-accelerated filer, or a smaller reporting company. See the definitions of “large accelerated filer,” “accelerated filer” and “smaller reporting company” in Rule 12b-2 of the Exchange Act.
Large accelerated filer o Accelerated filer þ Non-accelerated filer o Smaller reporting company o
Indicated by check mark whether the registrant is a shell company (as defined in Rule 12b-2 of the Exchange Act.) Yes o No þ
The number of shares outstanding of the registrant’s Class A common stock, par value $0.01 per share, was 28,624,014 as of April 16, 2010. The number of shares outstanding of the registrant’s Class B common stock, par value $0.0001 per share, was 12,945,489 as of April 16, 2010.
DUFF & PHELPS CORPORATION
| Part I. | Financial Information | |
| | | | |
| | Item 1. | Financial Statements | 1 |
| | | | |
| | Item 2. | Management’s Discussion and Analysis of Financial Condition and Results of Operations. | 24 |
| | | | |
| | Item 3. | Quantitative and Qualitative Disclosures About Market Risk. | 38 |
| | | | |
| | Item 4. | Controls and Procedures. | 38 |
| | | | |
| Part II. | Other Information | |
| | | | |
| | Item 1. | Legal Proceedings | 39 |
| | | | |
| | Item 1A. | Risk Factors | 39 |
| | | | |
| | Item 2. | Unregistered Sales of Equity Securities and Use of Proceeds | 39 |
| | | | |
| | Item 3. | Defaults Upon Senior Securities | 39 |
| | | | |
| | Item 4. | (Removed and Reserved) | 39 |
| | | | |
| | Item 5. | Other Information | 39 |
| | | | |
| | Item 6. | Exhibits | 40 |
| | | | |
| | Signatures | 41 |
PART I – FINANCIAL INFORMATION
Item 1. Financial Statements.
DUFF & PHELPS CORPORATION AND SUBSIDIARIES CONDENSED CONSOLIDATED STATEMENTS OF INCOME
(In thousands, except per share amounts)
(Unaudited)
| | | Three Months Ended | |
| | | March 31, | | | March 31, | |
| | | 2010 | | | 2009 | |
| Revenues | | $ | 89,164 | | | $ | 89,265 | |
| Reimbursable expenses | | | 2,798 | | | | 2,037 | |
| Total revenues | | | 91,962 | | | | 91,302 | |
| | | | | | | | | |
| Direct client service costs | | | | | | | | |
| Compensation and benefits (includes $3,717 and $4,262 | | | | | | | | |
| of equity-based compensation for the three months ended | | | | | | | | |
| March 31, 2010 and 2009, respectively) | | | 48,598 | | | | 51,130 | |
| Other direct client service costs | | | 2,605 | | | | 1,304 | |
| Reimbursable expenses | | | 2,854 | | | | 2,015 | |
| | | | 54,057 | | | | 54,449 | |
| | | | | | | | | |
| Operating expenses | | | | | | | | |
| Selling, general and administrative (includes $1,453 and $1,892 | | | | | | | | |
| of equity-based compensation for the three months ended | | | | | | | | |
| March 31, 2010 and 2009, respectively) | | | 23,467 | | | | 24,940 | |
| Depreciation and amortization | | | 2,493 | | | | 2,562 | |
| Charge from impairment of certain intangible assets (Note 10) | | | 674 | | | | - | |
| | | | 26,634 | | | | 27,502 | |
| | | | | | | | | |
| Operating income | | | 11,271 | | | | 9,351 | |
| | | | | | | | | |
| Other expense, net | | | | | | | | |
| Interest income | | | (24 | ) | | | (14 | ) |
| Interest expense | | | 92 | | | | 655 | |
| Other (income)/expense | | | (15 | ) | | | 17 | |
| | | | 53 | | | | 658 | |
| | | | | | | | | |
| Income before income taxes | | | 11,218 | | | | 8,693 | |
| | | | | | | | | |
| Provision for income taxes | | | 3,650 | | | | 2,112 | |
| | | | | | | | | |
| Net income | | | 7,568 | | | | 6,581 | |
| | | | | | | | | |
| Less: Net income attributable to noncontrolling interest | | | 3,295 | | | | 4,816 | |
| | | | | | | | | |
| Net income attributable to Duff & Phelps Corporation | | $ | 4,273 | | | $ | 1,765 | |
| | | | | | | | | |
| Weighted average shares of Class A common stock outstanding | | | | | | | | |
| Basic | | | 24,986 | | | | 13,479 | |
| Diluted | | | 25,780 | | | | 13,973 | |
| | | | | | | | | |
| Net income per share attributable to stockholders of Class A | | | | | | | | |
| common stock of Duff & Phelps Corporation (Note 4) | | | | | | | | |
| Basic | | $ | 0.16 | | | $ | 0.12 | |
| Diluted | | $ | 0.16 | | | $ | 0.11 | |
See accompanying notes to the condensed consolidated financial statements.
DUFF & PHELPS CORPORATION AND SUBSIDIARIES CONDENSED CONSOLIDATED BALANCE SHEETS
(In thousands, except per share amounts)
(Unaudited)
| | | March 31, | | | December 31, | |
| | | 2010 | | | 2009 | |
| ASSETS | |
| Current assets | | | | | | |
| Cash and cash equivalents | | $ | 89,979 | | | $ | 107,311 | |
| Accounts receivable (net of allowance for doubtful accounts | | | | | | | | |
| of $1,346 at March 31, 2010 and $1,690 at December 31, 2009) | | | 52,285 | | | | 55,079 | |
| Unbilled services | | | 25,226 | | | | 22,456 | |
| Prepaid expenses and other current assets | | | 7,696 | | | | 6,100 | |
| Net deferred income taxes, current | | | 70 | | | | 4,601 | |
| Total current assets | | | 175,256 | | | | 195,547 | |
| | | | | | | | | |
| Property and equipment (net of accumulated depreciation | | | | | | | | |
| of $21,876 at March 31, 2010 and $20,621 at December 31, 2009) | | | 28,897 | | | | 27,413 | |
| Goodwill | | | 122,879 | | | | 122,876 | |
| Intangible assets (net of accumulated amortization | | | | | | | | |
| of $17,759 at March 31, 2010 and $16,881 at December 31, 2009) | | | 26,355 | | | | 27,907 | |
| Other assets | | | 3,054 | | | | 3,218 | |
| Investments related to deferred compensation plan (Note 9) | | | 20,400 | | | | 17,807 | |
| Net deferred income taxes, non-current | | | 112,220 | | | | 112,265 | |
| Total non-current assets | | | 313,805 | | | | 311,486 | |
| | | | | | | | | |
| Total assets | | $ | 489,061 | | | $ | 507,033 | |
| | | | | | | | | |
| LIABILITIES AND STOCKHOLDERS' EQUITY | |
| Current liabilities | | | | | | | | |
| Accounts payable | | $ | 3,520 | | | $ | 2,459 | |
| Accrued expenses | | | 7,215 | | | | 11,609 | |
| Accrued compensation and benefits | | | 9,168 | | | | 35,730 | |
| Current portion of liability related to deferred compensation plan (Note 9) | | | 411 | | | | - | |
| Deferred revenues | | | 4,318 | | | | 3,633 | |
| Other current liabilities | | | 223 | | | | 993 | |
| Current portion due to noncontrolling unitholders | | | 4,303 | | | | 4,303 | |
| Total current liabilities | | | 29,158 | | | | 58,727 | |
| | | | | | | | | |
| Liability related to deferred compensation plan, less current portion (Note 9) | | | 21,358 | | | | 18,051 | |
| Other long-term liabilities | | | 15,585 | | | | 15,400 | |
| Due to noncontrolling unitholders, less current portion | | | 101,257 | | | | 101,098 | |
| Total non-current liabilities | | | 138,200 | | | | 134,549 | |
| | | | | | | | | |
| Total liabilities | | | 167,358 | | | | 193,276 | |
| | | | | | | | | |
| Commitments and contingencies (Note 11) | | | | | | | | |
| | | | | | | | | |
| Stockholders' equity | | | | | | | | |
| Preferred stock (50,000 shares authorized; zero issued and outstanding) | | | - | | | | - | |
| Class A common stock, par value $0.01 per share (100,000 shares authorized; 28,621 and | | | | | | | | |
| 27,290 shares issued and outstanding at March 31, 2010 and December 31, 2009, respectively) | | | 286 | | | | 273 | |
| Class B common stock, par value $0.0001 per share (50,000 shares authorized; 12,945 and | | | | | | | | |
| 12,974 shares issued and outstanding at March 31, 2010 and December 31, 2009, respectively) | | | 1 | | | | 1 | |
| Additional paid-in capital | | | 213,951 | | | | 207,210 | |
| Accumulated other comprehensive income/(loss) | | | (338 | ) | | | 693 | |
| Retained earnings | | | 9,565 | | | | 6,709 | |
| Total stockholders' equity of Duff & Phelps Corporation | | | 223,465 | | | | 214,886 | |
| Noncontrolling interest | | | 98,238 | | | | 98,871 | |
| Total stockholders' equity | | | 321,703 | | | | 313,757 | |
| Total liabilities and stockholders' equity | | $ | 489,061 | | | $ | 507,033 | |
See accompanying notes to the condensed consolidated financial statements.
DUFF & PHELPS CORPORATION AND SUBSIDIARIES
(In thousands)
(Unaudited)
| | | Three Months Ended | |
| | | March 31, | | | March 31, | |
| | | 2010 | | | 2009 | |
| Cash flows from operating activities: | | | | | | |
| Net income | | $ | 7,568 | | | $ | 6,581 | |
| | | | | | | | | |
| Adjustments to reconcile net income | | | | | | | | |
| to net cash provided by operating activities: | | | | | | | | |
| Depreciation and amortization | | | 2,493 | | | | 2,562 | |
| Equity-based compensation | | | 5,170 | | | | 6,154 | |
| Bad debt expense | | | 600 | | | | 464 | |
| Net deferred income taxes | | | 4,734 | | | | 2,583 | |
| Charge from impairment of certain intangible assets | | | 674 | | | | - | |
| Other | | | 277 | | | | (234 | ) |
| Changes in assets and liabilities providing/(using) cash: | | | | | | | | |
| Accounts receivable | | | 2,194 | | | | 1,539 | |
| Unbilled services | | | (2,770 | ) | | | (12,577 | ) |
| Prepaid expenses and other current assets | | | 222 | | | | 132 | |
| Other assets | | | 503 | | | | 2,701 | |
| Accounts payable and accrued expenses | | | (5,488 | ) | | | (651 | ) |
| Accrued compensation and benefits | | | (22,706 | ) | | | (22,729 | ) |
| Deferred revenues | | | 685 | | | | (66 | ) |
| Other liabilities | | | (649 | ) | | | - | |
| Net cash used in operating activities | | | (6,493 | ) | | | (13,541 | ) |
| | | | | | | | | |
| Cash flows from investing activities: | | | | | | | | |
| Purchase of property and equipment | | | (1,518 | ) | | | (2,108 | ) |
| Business acquisitions, net of cash acquired | | | (481 | ) | | | - | |
| Purchase of investments for deferred compensation plan | | | (2,975 | ) | | | (5,684 | ) |
| Net cash used in investing activities | | | (4,974 | ) | | | (7,792 | ) |
| | | | | | | | | |
| Cash flows from financing activities: | | | | | | | | |
| Proceeds from exercises of IPO Options | | | 28 | | | | 80 | |
| Distributions and other payments to noncontrolling unitholders | | | (1,343 | ) | | | (8,847 | ) |
| Dividends | | | (1,403 | ) | | | - | |
| Repurchases of Class A common stock | | | (1,618 | ) | | | (603 | ) |
| Repayments of debt | | | - | | | | (198 | ) |
| Other | | | (3 | ) | | | - | |
| Net cash used in financing activities | | | (4,339 | ) | | | (9,568 | ) |
| | | | | | | | | |
| Effect of exchange rate on cash and cash equivalents | | | (1,526 | ) | | | (1,104 | ) |
| | | | | | | | | |
| Net decrease in cash and cash equivalents | | | (17,332 | ) | | | (32,005 | ) |
| Cash and cash equivalents at beginning of period | | | 107,311 | | | | 81,381 | |
| Cash and cash equivalents at end of period | | $ | 89,979 | | | $ | 49,376 | |
See accompanying notes to the condensed consolidated financial statements.
DUFF & PHELPS CORPORATION AND SUBSIDIARIES
CONDENSED CONSOLIDATED STATEMENT OF STOCKHOLDERS’ EQUITY
AND COMPREHENSIVE INCOME/(LOSS)
(In thousands)
(Unaudited)
| | | | | | | | | Stockholders of Duff & Phelps Corporation | | | | |
| | | | | | | | | | | | | | | | | | | | | | | | Accumulated | | | | | | | |
| | | Total | | | | | | | | | | | | | | | | | | | | | Other | | | | | | | |
| | | Stockholders' | | | Comprehensive | | | Common Stock - Class A | | | Common Stock - Class B | | | Additional | | | Comprehensive | | | Retained | | | Noncontrolling | |
| | | Equity | | | Income | | | Shares | | | Dollars | | | Shares | | | Dollars | | | Paid-in-Capital | | | Income/(Loss) | | | Earnings | | | Interest | |
| | | | | | | | | | | | | | | | | | | | | | | | | | | | | | | |
| Balance as of December 31, 2009 | | $ | 313,757 | | | | | | | 27,290 | | | $ | 273 | | | | 12,974 | | | $ | 1 | | | $ | 207,210 | | | $ | 693 | | | $ | 6,709 | | | $ | 98,871 | |
| | | | | | | | | | | | | | | | | | | | | | | | | | | | | | | | | | | | | | | | |
| Comprehensive income | | | | | | | | | | | | | | | | | | | | | | | | | | | | | | | | | | | | | | | |
| Net income for the three months ended March 31, 2010 | | | 7,568 | | | $ | 7,568 | | | | - | | | | - | | | | - | | | | - | | | | - | | | | - | | | | 4,273 | | | | 3,295 | |
| Currency translation adjustment | | | (1,525 | ) | | | (1,525 | ) | | | - | | | | - | | | | - | | | | - | | | | - | | | | (1,037 | ) | | | - | | | | (488 | ) |
| Amortization of post-retirement benefits | | | 12 | | | | 12 | | | | - | | | | - | | | | - | | | | - | | | | - | | | | 8 | | | | - | | | | 4 | |
| Total comprehensive income | | | 6,055 | | | | 6,055 | | | | - | | | | - | | | | - | | | | - | | | | - | | | | (1,029 | ) | | | 4,273 | | | | 2,811 | |
| | | | | | | | | | | | | | | | | | | | | | | | | | | | | | | | | | | | | | | | | |
| Sale of Class A common stock | | | (3 | ) | | | | | | | - | | | | - | | | | - | | | | - | | | | (3 | ) | | | - | | | | - | | | | - | |
| Issuance of Class A common stock for acquisitions | | | 322 | | | | | | | | 19 | | | | - | | | | - | | | | - | | | | 222 | | | | - | | | | - | | | | 100 | |
| Exchange of New Class A Units | | | - | | | | | | | | 22 | | | | - | | | | (22 | ) | | | - | | | | - | | | | - | | | | - | | | | - | |
| Net issuance of restricted stock awards | | | (1,603 | ) | | | | | | | 1,352 | | | | 14 | | | | - | | | | - | | | | (1,108 | ) | | | - | | | | - | | | | (509 | ) |
Adjustment to Tax Receivable Agreement as a result of the exchange of New Class A Units | | | 34 | | | | | | | | - | | | | - | | | | - | | | | - | | | | 34 | | | | - | | | | - | | | | - | |
| Issuance for exercise of IPO Options | | | 18 | | | | | | | | 1 | | | | - | | | | - | | | | - | | | | 12 | | | | - | | | | - | | | | 6 | |
| Forfeitures | | | (1 | ) | | | | | | | (63 | ) | | | (1 | ) | | | (7 | ) | | | - | | | | - | | | | - | | | | - | | | | - | |
| Equity-based compensation | | | 5,755 | | | | | | | | - | | | | - | | | | - | | | | - | | | | 3,923 | | | | - | | | | - | | | | 1,832 | |
| Income tax benefit on equity-based compensation | | | 72 | | | | | | | | - | | | | - | | | | - | | | | - | | | | 72 | | | | - | | | | - | | | | - | |
| Distributions to noncontrolling unitholders | | | (1,343 | ) | | | | | | | - | | | | - | | | | - | | | | - | | | | (917 | ) | | | - | | | | - | | | | (426 | ) |
| Change in ownership interests between periods | | | - | | | | | | | | - | | | | - | | | | - | | | | - | | | | 4,031 | | | | (2 | ) | | | - | | | | (4,029 | ) |
| Deferred tax asset effective tax rate conversion | | | 57 | | | | | | | | - | | | | - | | | | - | | | | - | | | | 475 | | | | - | | | | - | | | | (418 | ) |
| Dividends on Class A common stock | | | (1,417 | ) | | | | | | | - | | | | - | | | | - | | | | - | | | | - | | | | - | | | | (1,417 | ) | | | - | |
| Balance as of March 31, 2010 | | $ | 321,703 | | | | | | | | 28,621 | | | $ | 286 | | | | 12,945 | | | $ | 1 | | | $ | 213,951 | | | $ | (338 | ) | | $ | 9,565 | | | $ | 98,238 | |
See accompanying notes to the condensed consolidated financial statements.
DUFF & PHELPS CORPORATION AND SUBSIDIARIES
CONDENSED CONSOLIDATED STATEMENT OF STOCKHOLDERS’ EQUITY
AND COMPREHENSIVE INCOME/(LOSS)
(In thousands)
(Unaudited)
| | | | | | | | | Stockholders of Duff & Phelps Corporation | | | | |
| | | | | | | | | | | | | | | | | | | | | | | | Accumulated | | | Retained | | | | |
| | | Total | | | | | | | | | | | | | | | | | | | | | Other | | | Earnings/ | | | | |
| | | Stockholders' | | | Comprehensive | | | Common Stock - Class A | | | Common Stock - Class B | | | Additional | | | Comprehensive | | | (Accumulated | | | Noncontrolling | |
| | | Equity | | | Income | | | Shares | | | Dollars | | | Shares | | | Dollars | | | Paid-in-Capital | | | Income/(Loss) | | | Deficit) | | | Interest | |
| | | | | | | | | | | | | | | | | | | | | | | | | | | | | | | |
| Balance as of December 31, 2008 | | $ | 237,759 | | | $ | - | | | | 14,719 | | | $ | 147 | | | | 20,889 | | | $ | 2 | | | $ | 100,985 | | | $ | 122 | | | $ | (1,127 | ) | | $ | 137,630 | |
| | | | | | | | | | | | | | | | | | | | | | | | | | | | | | | | | | | | | | | | | |
| Comprehensive income | | | | | | | | | | | | | | | | | | | | | | | | | | | | | | | | | | | | | | | | |
| Net income for the three months ended March 31, 2009 | | | 6,581 | | | | 6,581 | | | | - | | | | - | | | | - | | | | - | | | | - | | | | - | | | | 1,765 | | | | 4,816 | |
| Currency translation adjustment | | | (1,104 | ) | | | (1,104 | ) | | | - | | | | - | | | | - | | | | - | | | | - | | | | (478 | ) | | | - | | | | (626 | ) |
| Amortization of post-retirement benefits | | | 4 | | | | 4 | | | | - | | | | - | | | | - | | | | - | | | | - | | | | 2 | | | | - | | | | 2 | |
| Total comprehensive income/(loss) | | | 5,481 | | | $ | 5,481 | | | | - | | | | - | | | | - | | | | - | | | | - | | | | (476 | ) | | | 1,765 | | | | 4,192 | |
| | | | | | | | | | | | | | | | | | | | | | | | | | | | | | | | | | | | | | | | | |
| Net issuance of restricted stock awards | | | (590 | ) | | | | | | | 1,197 | | | | 12 | | | | - | | | | - | | | | (260 | ) | | | - | | | | - | | | | (342 | ) |
| Exercise of stock options | | | 8 | | | | | | | | - | | | | - | | | | - | | | | - | | | | 3 | | | | - | | | | - | | | | 5 | |
| Forfeitures | | | - | | | | | | | | (11 | ) | | | - | | | | (11 | ) | | | - | | | | - | | | | - | | | | - | | | | - | |
| Equity-based compensation | | | 7,240 | | | | | | | | - | | | | - | | | | - | | | | - | | | | 3,132 | | | | - | | | | - | | | | 4,108 | |
| Income tax benefit on equity-based compensation | | | (87 | ) | | | | | | | - | | | | - | | | | - | | | | - | | | | (87 | ) | | | - | | | | - | | | | - | |
| Distributions to non-controlling unitholders | | | (8,847 | ) | | | | | | | - | | | | - | | | | - | | | | - | | | | (3,826 | ) | | | - | | | | - | | | | (5,021 | ) |
| Change in ownership interests between periods | | | - | | | | | | | | - | | | | - | | | | - | | | | - | | | | 4,462 | | | | 6 | | | | - | | | | (4,468 | ) |
| Deferred tax asset effective tax rate conversion | | | 294 | | | | | | | | - | | | | - | | | | - | | | | - | | | | 294 | | | | - | | | | - | | | | - | |
| Balance as of March 31, 2009 | | $ | 241,258 | | | | | | | | 15,905 | | | $ | 159 | | | | 20,878 | | | $ | 2 | | | $ | 104,703 | | | $ | (348 | ) | | $ | 638 | | | $ | 136,104 | |
See accompanying notes to the condensed consolidated financial statements.
DUFF & PHELPS CORPORATION AND SUBSIDIARIES
NOTES TO THE CONDENSED CONSOLIDATED FINANCIAL STATEMENTS
(In thousands, except per share amounts)
(Unaudited)
Note 1 - DESCRIPTION OF BUSINESS
Duff & Phelps Corporation (the “Company”) is a leading provider of independent financial advisory and investment banking services. Its mission is to help its clients protect, maximize and recover value by providing independent advice on issues involving highly technical and complex assessments in the areas of valuation, transactions, financial restructuring, disputes and taxation. The Company believes that the Duff & Phelps brand is associated with experienced professionals who give trusted guidance in a responsive manner. The Company serves a global client base through offices in 23 cities, comprised of offices in 17 U.S. cities, including New York, Chicago, Dallas and Los Angeles, and six international offices located in Amsterdam, London, Munich, Paris, Shanghai and Tokyo.
Note 2 - BASIS OF PRESENTATION
Basis of Presentation
The accompanying unaudited condensed consolidated financial statements have been prepared in accordance with accounting principles generally accepted in the United States of America and with the rules and regulations of the United States Securities and Exchange Commission (“SEC”) for interim financial reporting, and include all adjustments which are, in the opinion of management, necessary for a fair presentation. The financial statements require the use of management estimates and include the accounts of the Company, its controlled subsidiaries and other entities consolidated as required by accounting principles generally accepted in the United States of America (“GAAP”). References to the “Company,” “its” and “itself,” refer to Duff & Phelps Corporation and its subsidiaries, unless the context requires otherwise.
The balance sheet at December 31, 2009 was derived from audited financial statements, but does not include all disclosures required by (“GAAP”). Accordingly, certain information and footnote disclosures normally included in financial statements prepared in accordance with GAAP have been condensed or omitted pursuant to such rules and regulations. In management’s opinion, all adjustments necessary for a fair presentation are reflected in the interim periods presented. All significant intercompany accounts and transactions have been eliminated in consolidation.
Recently Issued Accounting Pronouncements
In October 2009, the Financial Accounting Standards Board (“FASB”) issued Accounting Standards Update (“ASU”) No. 2009-13, Multiple-Deliverable Revenue Arrangements. ASU 2009-13 supersedes certain guidance in FASB Accounting Standards Codification (“ASC”) 605-25, Revenue Recognition–Multiple-Element Arrangements and requires an entity to allocate arrangement consideration at the inception of an arrangement to all of its deliverables based on their relative selling prices (the relative-selling-price method). ASU 2009-13 eliminates the use of the residual method of allocation in which the undelivered element is measured at its estimated selling price and the delivered element is measured as the residual of the arrangement consideration, and requires the relative-selling-price method in all circumstances in which an entity recognizes revenue for an arrangement with multiple deliverable subject to ASU 2009-13. ASU 2009-13 must be adopted no later than the beginning of the first fiscal year beginning on or after June 15, 2010, with early adoption permitted through either prospective application for revenue arrangements entered into, or materially modified, after the effective date or through retrospective application to all revenue arrangements for all periods presented. The Company is currently evaluating the impact that the adoption of ASU 2009-13 will have on its consolidated financial statements.
Critical Accounting Policies
There have been no significant changes in new accounting pronouncements or in our critical accounting policies and estimates from those that were disclosed in our Annual Report on Form 10-K for the year ended December 31, 2009. The Company believes that the disclosures herein are adequate so that the information presented is not misleading; however, it is suggested that these financial statements be read in conjunction with the financial statements and the notes thereto in our Annual Report on Form 10-K for the year ended December 31, 2009. The financial data for the interim periods may not necessarily be indicative of results to be expected for the year.
DUFF & PHELPS CORPORATION AND SUBSIDIARIES
NOTES TO THE CONDENSED CONSOLIDATED FINANCIAL STATEMENTS
(In thousands, except per share amounts)
(Unaudited)
Note 3 - NONCONTROLLING INTEREST
The Company has sole voting power in and controls the management of D&P Acquisitions, LLC and its subsidiaries (“D&P Acquisitions”), which collectively represent the operating subsidiaries of the Company. As a result, the Company consolidates the financial results of D&P Acquisitions and records noncontrolling interest for the economic interest in D&P Acquisitions held by the existing unitholders to the extent the book value of their interest in D&P Acquisitions is greater than zero. The Company’s economic interest in D&P Acquisitions totaled 68.9% at March 31, 2010. The noncontrolling unitholders’ interest in D&P Acquisitions totaled 31.1% at March 31, 2010.
Net income attributable to the noncontrolling interest on the statement of operations represents the portion of earnings or loss attributable to the economic interest in D&P Acquisitions held by the noncontrolling unitholders. Noncontrolling interest on the balance sheet represents the portion of net assets of D&P Acquisitions attributable to the noncontrolling unitholders based on the portion of total units of D&P Acquisitions owned by such unitholders (“New Class A Units”). The ownership of the New Class A Units is summarized as follows:
| | | Duff & | | | Non- | | | | |
| | | Phelps | | | controlling | | | | |
| | | Corporation | | | Unitholders | | | Total | |
| December 31, 2009 | | | 27,290 | | | | 12,974 | | | | 40,264 | |
| Issuance of Class A common stock for acquisitions | | | 19 | | | | - | | | | 19 | |
| Exchange to Class A common stock | | | 22 | | | | (22 | ) | | | - | |
| Issuance for exercises of IPO Options | | | 1 | | | | - | | | | 1 | |
| Net issuance of restricted stock awards | | | 1,352 | | | | - | | | | 1,352 | |
| Forfeitures | | | (63 | ) | | | (7 | ) | | | (70 | ) |
| March 31, 2010 | | | 28,621 | | | | 12,945 | | | | 41,566 | |
| | | | | | | | | | | | | |
| Percent of total | | | | | | | | | | | | |
| December 31, 2009 | | | 67.8 | % | | | 32.2 | % | | | 100 | % |
| March 31, 2010 | | | 68.9 | % | | | 31.1 | % | | | 100 | % |
A reconciliation from “Income before income taxes” to “Net income attributable to the noncontrolling interest” and “Net income attributable to Duff & Phelps Corporation” is detailed as follows:
| | | Three Months Ended | |
| | | March 31, | | | March 31, | |
| | | 2010 | | | 2009 | |
| Income before income taxes | | $ | 11,218 | | | $ | 8,693 | |
| Less: provision for income taxes for entities | | | | | | | | |
other than Duff & Phelps Corporation(a)(b) | | | (920 | ) | | | (357 | ) |
| | | | | | | | | |
| Income before income taxes, as adjusted | | | 10,298 | | | | 8,336 | |
Ownership percentage of noncontrolling interest(d) | | | 32.0 | % | | | 57.8 | % |
| Net income attributable to noncontrolling interest | | | 3,295 | | | | 4,816 | |
| | | | | | | | | |
| Income before income taxes, as adjusted, attributable | | | | | | | | |
| to Duff & Phelps Corporation | | | 7,003 | | | | 3,520 | |
| Less: provision for income taxes of Duff & Phelps | | | | | | | | |
Corporation(a)(c) | | | (2,730 | ) | | | (1,755 | ) |
| | | | | | | | | |
| Net income attributable to Duff & Phelps Corporation | | $ | 4,273 | | | $ | 1,765 | |
DUFF & PHELPS CORPORATION AND SUBSIDIARIES
NOTES TO THE CONDENSED CONSOLIDATED FINANCIAL STATEMENTS
(In thousands, except per share amounts)
(Unaudited)
| (a) | The consolidated provision for income taxes is equal to the sum of (i) the provision for income taxes for entities other than Duff & Phelps Corporation and (ii) the provision for income taxes of Duff & Phelps Corporation. The consolidated provision for income taxes totaled $3,650 and $2,112 for the three months ended March 31, 2010 and 2009, respectively. |
| | (b) | The provision for income taxes for entities other than Duff & Phelps Corporation represents taxes imposed directly on Duff & Phelps, LLC, a wholly-owned subsidiary of D&P Acquisitions, and its subsidiaries, such as taxes imposed on certain domestic subsidiaries (e.g., Rash & Associates, L.P.), taxes imposed by certain foreign jurisdictions, and taxes imposed by certain local and other jurisdictions (e.g., New York City). Since Duff & Phelps, LLC is taxed as a partnership and a flow-through entity for U.S. federal and state income tax purposes, there is no provision for these taxes on income allocable to the noncontrolling interest. |
| | (c) | The provision of income taxes of Duff & Phelps Corporation includes all U.S. federal and state income taxes. |
| | (d) | Income before income taxes, as adjusted, is allocated to the noncontrolling interest based on the total New Class A Units vested for income tax purposes (“Tax-Vested Units”) owned by the noncontrolling interest as a percentage of the aggregate amount of all Tax-Vested Units. This percentage may not necessarily correspond to the total number of New Class A Units at the end of each respective period. |
Distributions and Other Payments to Noncontrolling Unitholders
The following table summarizes distributions and other payments to noncontrolling unitholders, as described more fully below:
| | | Three Months Ended | |
| | | March 31, | | | March 31, | |
| | | 2010 | | | 2009 | |
| Distributions for taxes | | $ | 608 | | | $ | 8,847 | |
| Other distributions | | | 735 | | | | - | |
| Payments pursuant to | | | | | | | | |
| the Tax Receivable Agreement | | | - | | | | - | |
| | | $ | 1,343 | | | $ | 8,847 | |
Distributions for taxes
As a limited liability company, D&P Acquisitions does not incur significant federal or state and local taxes, as these taxes are primarily the obligations of the members of D&P Acquisitions. As authorized by the Third Amended and Restated LLC Agreement of D&P Acquisitions, D&P Acquisitions is required to distribute cash, generally, on a pro rata basis, to its members to the extent necessary to provide funds to pay the members' tax liabilities, if any, with respect to the earnings of D&P Acquisitions. The tax distribution rate has been set at 45% of each member’s allocable share of taxable income of D&P Acquisitions. D&P Acquisitions is only required to make such distributions if cash is available for such purposes as determined by the Company. The Company expects cash will be available to make these distributions. Upon completion of its tax returns with respect to the prior year, D&P Acquisitions may make true-up distributions to its members, if cash is available for such purposes, with respect to actual taxable income for the prior year. The decrease in tax distributions between periods primarily resulted from the timing of quarterly payments. During the three months ended March 31, 2009, the estimated distributions represent each member’s estimated tax liability from taxable income of D&P acquisitions during the fourth quarter of 2008. The corresponding distribution to members for taxable income of D&P acquisitions during the fourth quarter of 2009 was primarily made during the three months ended December 31, 2009.
DUFF & PHELPS CORPORATION AND SUBSIDIARIES
NOTES TO THE CONDENSED CONSOLIDATED FINANCIAL STATEMENTS
(In thousands, except per share amounts)
(Unaudited)
Other distributions
During the three months ended March 31, 2010, the Company distributed $735 to holders of New Class A Units, other than Duff & Phelps Corporation. Concurrent with the payment of the dividend to shareholders of record on March 16, 2010, holders of New Class A Units received a $0.05 distribution per vested unit. This amount totaled $573 and will be treated as a reduction in basis of each member’s ownership interests. Pursuant to the terms of the Third Amended and Restated LLC Agreement of D&P Acquisitions, an amount of $0.05 per unvested unit was deposited into a segregated account and will be distributed once a year with respect to units that vested during that year. During the three months ended March 31, 2010, the Company distributed $162 to members whose units vested during 2009. Any amounts related to unvested units that forfeit are returned to the Company.
Payments pursuant to the Tax Receivable Agreement
As a result of the Company’s acquisition of New Class A Units of D&P Acquisitions, the Company expects to benefit from depreciation and other tax deductions reflecting D&P Acquisitions' tax basis for its assets. Those deductions will be allocated to the Company and will be taken into account in reporting the Company’s taxable income. Further, as a result of a federal income tax election made by D&P Acquisitions applicable to a portion of the Company’s acquisition of New Class A Units of D&P Acquisitions, the income tax basis of the assets of D&P Acquisitions underlying a portion of the units the Company has and will acquire (pursuant to the exchange agreement) will be adjusted based upon the amount that the Company has paid for that portion of its New Class A Units of D&P Acquisitions.
The Company has entered into a tax receivable agreement (“TRA”) with the existing unitholders of D&P Acquisitions (for the benefit of the existing unitholders of D&P Acquisitions) that provides for the payment by the Company to the unitholders of D&P Acquisitions of 85% of the amount of cash savings, if any, in U.S. federal, state and local income tax that the Company realizes (i) from the tax basis in its proportionate share of D&P Acquisitions' goodwill and similar intangible assets that the Company receives as a result of the exchanges and (ii) from the federal income tax election referred to above. D&P Acquisitions expects to make future payments under the TRA to the extent cash is available for such purposes.
As of March 31, 2010, the Company recorded a liability of $105,560, representing the payments due to D&P Acquisitions’ unitholders under the TRA (see current and non-current portion of “Due to noncontrolling unitholders” on the Company’s Condensed Consolidated Balance Sheets).
Within the next 12 month period, the Company expects to pay $4,303 of the total amount. The basis for determining the current portion of the payments due to D&P Acquisitions’ unitholders under the TRA is the expected amount of payments to be made within the next 12 months. The long-term portion of the payments due to D&P Acquisitions’ unitholders under the tax receivable agreement is the remainder. Payments are anticipated to be made annually over 15 years, commencing from the date of each event that gives rise to the TRA benefits, beginning with the date of the closing of the IPO on October 3, 2007. The payments are made in accordance with the terms of the TRA. The timing of the payments is subject to certain contingencies including Duff & Phelps Corporation having sufficient taxable income to utilize all of the tax benefits defined in the TRA.
To determine the current amount of the payments due to D&P Acquisitions’ unitholders under the TRA, the Company estimated the amount of taxable income that Duff & Phelps Corporation has generated over the previous fiscal year. Next, the Company estimated the amount of the specified TRA deductions at year end. This was used as a basis for determining the amount of tax reduction that generates a TRA obligation. In turn, this was used to calculate the estimated payments due under the TRA that the Company expects to pay in the next 12 months. These calculations are performed pursuant to the terms of the TRA.
Obligations pursuant to the TRA are obligations of Duff & Phelps Corporation. They do not impact the noncontrolling interest. These obligations are not income tax obligations and have no impact on the tax provision or the allocation of taxes. Furthermore, the TRA has no impact on the allocation of the provision for income taxes to the Company’s net income. In general, items of income and expense are allocated on the basis of member’s ownership interests pursuant to the Third Amended and Restated Limited Liability Company Agreement of Duff & Phelps Acquisitions, LLC.
DUFF & PHELPS CORPORATION AND SUBSIDIARIES
NOTES TO THE CONDENSED CONSOLIDATED FINANCIAL STATEMENTS
(In thousands, except per share amounts)
(Unaudited)
Note 4 - EARNINGS PER SHARE
Basic earnings per share (“EPS”) measures the performance of an entity over the reporting period. Diluted earnings per share measures the performance of an entity over the reporting period while giving effect to all potentially dilutive common shares that were outstanding during the period. The treasury stock method is used to determine the dilutive potential of stock options, restricted stock awards, restricted stock units, and D&P Acquisitions’ units and Class B common stock that are exchangeable into D&P Class A common stock.
In accordance with FASB ASC 260, Earnings Per Share, all outstanding unvested share-based payments that contain rights to non-forfeitable dividends participate in the undistributed earnings with the common stockholders and are therefore participating securities. Companies with participating securities are required to apply the two-class method in calculating basic and diluted net income per share.
Our restricted stock awards are considered participating securities as they receive non-forfeitable dividends at the same rate as our common stock. The computation of basic and diluted net income per share is reduced for a presumed hypothetical distribution of earnings to the holders of our unvested restricted stock. Accordingly, the effect of the allocation reduces earnings available for common stockholders.
DUFF & PHELPS CORPORATION AND SUBSIDIARIES
NOTES TO THE CONDENSED CONSOLIDATED FINANCIAL STATEMENTS
(In thousands, except per share amounts)
(Unaudited)
The following is a reconciliation of the numerator and denominator used in the basic and diluted EPS calculations:
| | | Three Months Ended | |
| | | March 31, | | | March 31, | |
| | | 2010 | | | 2009 | |
| Basic and diluted net income per share: | | | | | | |
| | | | | | | |
| Numerator | | | | | | |
| Net income available to holders of Class A common stock | | $ | 4,273 | | | $ | 1,765 | |
| Earnings allocated to participating securities | | | (269 | ) | | | (194 | ) |
| Earnings available for common stockholders | | $ | 4,004 | | | $ | 1,571 | |
| | | | | | | | | |
| Denominator for basic net income per share of Class A common stock | | | | | | | | |
| Weighted average shares of Class A common stock | | | 24,986 | | | | 13,479 | |
| | | | | | | | | |
| Denominator for diluted net income per share of Class A common stock | | | | | | | | |
| Weighted average shares of Class A common stock | | | 24,986 | | | | 13,479 | |
| Add dilutive effect of the following: | | | | | | | | |
| Restricted stock awards and units | | | 794 | | | | 494 | |
Assumed conversion of New Class A Units for Class A common stock(a) | | | - | | | | - | |
| Dilutive weighted average shares of Class A common stock | | | 25,780 | | | | 13,973 | |
| | | | | | | | | |
| Basic income per share of Class A common stock | | $ | 0.16 | | | $ | 0.12 | |
| | | | | | | | | |
| Diluted income per share of Class A common stock | | $ | 0.16 | | | $ | 0.11 | |
| | | | | | | | | | |
(a) The following shares were anti-dilutive and excluded from this calculation: | | | | | | | | |
| | | | | | | | | |
| Weighted average New Class A Units outstanding | | | 12,966 | | | | 20,889 | |
| Weighted average IPO Options outstanding | | | 1,812 | | | | 1,993 | |
Anti-dilution is the result of (i) the allocation of income or loss associated with the exchange of New Class A Units for Class A common stock and (ii) options listed above exceeding those outstanding under the treasury stock method.
Shares of Class B common stock do not share in the earnings of the Company and are therefore not participating securities. Accordingly, basic and diluted earnings per share of Class B common stock have not been presented. DUFF & PHELPS CORPORATION AND SUBSIDIARIES
NOTES TO THE CONDENSED CONSOLIDATED FINANCIAL STATEMENTS
(In thousands, except per share amounts)
(Unaudited)
Note 5 - - EQUITY-BASED COMPENSATION
For a detailed description of past equity-based compensation activity, please refer to the Company’s Annual Report on Form 10-K for the year ended December 31, 2009. There have been no significant changes in the Company’s equity-based compensation accounting policies and assumptions from those that were disclosed in the Company’s Annual Report on Form 10-K for the year ended December 31, 2009.
Equity-based compensation with respect to (a) grants of units of D&P Acquisitions prior to the recapitalization transaction that were effectuated in conjunction with the IPO (“Legacy Units”), (b) options to purchase shares of the Company’s Class A common stock granted in connection with the IPO (“IPO Options”) and (c) restricted stock awards and units issued in connection with the Company’s ongoing long-term compensation program (“Ongoing RSAs”) is detailed in the table below:
| | | Three Months Ended | | | Three Months Ended | |
| | | March 31, 2010 | | | March 31, 2009 | |
| | | Client | | | | | | | | | Client | | | | | | | |
| | | Service | | | SG&A | | | Total | | | Service | | | SG&A | | | Total | |
| Legacy Units | | $ | 265 | | | $ | 332 | | | $ | 597 | | | $ | 1,698 | | | $ | 640 | | | $ | 2,338 | |
| IPO Options | | | 333 | | | | 153 | | | | 486 | | | | 633 | | | | 282 | | | | 915 | |
| Ongoing RSAs | | | 3,119 | | | | 968 | | | | 4,087 | | | | 1,931 | | | | 970 | | | | 2,901 | |
| Total | | $ | 3,717 | | | $ | 1,453 | | | $ | 5,170 | | | $ | 4,262 | | | $ | 1,892 | | | $ | 6,154 | |
Restricted stock awards and restricted stock units are granted as a form of incentive compensation and are accounted for similarly. Corresponding expense is recognized based on the fair market value of the Company’s Class A common stock on the date of grant over the service period. Restricted stock units are generally contingent on continued employment and are converted to common stock when restrictions on transfer lapse after three years.
During the three months ended March 31, 2010, the Company issued 1,594 Ongoing RSAs related to annual bonus incentive compensation, performance incentive initiatives, promotions and recruiting efforts. The restrictions on transfer and forfeiture provisions are generally eliminated after three years for all awards granted to non-executives with certain exceptions related to retiree eligible employees and termination of employees without cause.
Of the 1,594 Ongoing RSAs granted, 120 awards were granted to executives on March 10, 2010. The restrictions on transfer and forfeiture provisions are eliminated annually over three years based on ratable vesting for grants made to executives.
DUFF & PHELPS CORPORATION AND SUBSIDIARIES
NOTES TO THE CONDENSED CONSOLIDATED FINANCIAL STATEMENTS
(In thousands, except per share amounts)
(Unaudited)
Below is a summary of restricted award activity during the three months ended March 31, 2010:
| | | | | | Weighted | | | | | | Weighted | |
| | | Restricted | | | Average | | | Restricted | | | Average | |
| | | Stock | | | Grant Date | | | Stock | | | Grant Date | |
| | | Awards | | | Fair Value | | | Units | | | Fair Value | |
| Balance as of December 31, 2009 | | | 2,340 | | | $ | 14.11 | | | | 173 | | | $ | 13.43 | |
| Granted | | | 1,447 | | | | 17.00 | | | | 147 | | | | 17.00 | |
| Converted to Class A common stock | | | | | | | | | | | | | | | | |
| upon lapse of restrictions | | | (211 | ) | | | 16.57 | | | | - | | | | - | |
| Forfeited | | | (63 | ) | | | 14.21 | | | | - | | | | - | |
| Balance as of March 31, 2010 | | | 3,513 | | | $ | 15.19 | | | | 320 | | | $ | 15.32 | |
| | | | | | | | | | | | | | | | | |
| Vested | | | - | | | | | | | | - | | | | | |
| Unvested | | | 3,513 | | | | | | | | 320 | | | | | |
Below is a summary of option activity during the three months ended March 31, 2010:
| | | | | | Weighted | |
| | | | | | Average | |
| | | IPO | | | Grant Date | |
| | | Options | | | Fair Value | |
| Balance as of December 31, 2009 | | | 1,815 | | | $ | 7.33 | |
| Granted | | | - | | | | - | |
| Exercised | | | (1 | ) | | | 7.33 | |
| Forfeited | | | (13 | ) | | | 7.33 | |
| Balance as of March 31, 2010 | | | 1,801 | | | $ | 7.33 | |
| | | | | | | | | |
| Vested | | | 876 | | | | | |
| Unvested | | | 925 | | | | | |
| | | | | | | | | |
| Weighted average exercise price | | $ | 16.00 | | | | | |
| Weighted average remaining contractual term | | | 7.50 | | | | | |
| Total intrinsic value of exercised options | | $ | 2 | | | | | |
| Total fair value of options vested | | $ | 6,420 | | | | | |
| Aggregate intrinsic value | | $ | 1,333 | | | | | |
| Options expected to vest | | | 1,686 | | | | | |
| Aggregate intrinsic value of options expected to vest | | $ | 1,248 | | | | | |
Forfeitures for Legacy Units, IPO Options and Ongoing RSAs are estimated at the time an award is granted and revised, if necessary, in subsequent periods if actual forfeitures differ from those estimates. Pre-vesting forfeitures were estimated to be between 2% and 21% as of March 31, 2010 based on historical experience and future expectations.
DUFF & PHELPS CORPORATION AND SUBSIDIARIES
NOTES TO THE CONDENSED CONSOLIDATED FINANCIAL STATEMENTS
(In thousands, except per share amounts)
(Unaudited)
The following table summarizes activity for New Class A Units attributable to equity-based compensation during the three months ended March 31, 2010:
| | | New | |
| | | Class A Units | |
| | | Attributable to | |
| | | Equity-Based | |
| | | Compensation | |
| Balance as of December 31, 2009 | | | 3,231 | |
| Forfeited | | | (7 | ) |
| Exchanged | | | (22 | ) |
| Balance as of March 31, 2010 | | | 3,202 | |
| | | | | |
| Vested | | | 1,975 | |
| Unvested | | | 1,227 | |
The total unamortized compensation cost related to all non-vested awards was $35,482 at March 31, 2010. The period over which this expense is expected to be recognized is approximately three years; the weighted-average period over which this is expected to be recognized is approximately 1.8 years. A tax benefit of $229 and $439 was recognized for the stock options issued in conjunction with the IPO and Ongoing RSAs for the three months ended March 31, 2010 and 2009, respectively.
DUFF & PHELPS CORPORATION AND SUBSIDIARIES
NOTES TO THE CONDENSED CONSOLIDATED FINANCIAL STATEMENTS
(In thousands, except per share amounts)
(Unaudited)
Note 6 - FAIR VALUE MEASUREMENTS
The following table presents assets and liabilities measured at fair value on a recurring basis at March 31, 2010:
| | | Quoted Prices | | | | | | | | | | |
| | | in Active | | | Significant | | | | | | | |
| | | Markets for | | | Other | | | Significant | | | | |
| | | Identical | | | Observable | | | Unobservable | | | | |
| | | Assets | | | Inputs | | | Inputs | | | | |
| Description | | (Level 1) | | | (Level 2) | | | (Level 3) | | | Total | |
| Investments held in conjunction with | | | | | | | | | | | | |
deferred compensation plan(1)(2) | | $ | - | | | $ | 20,400 | | | $ | - | | | $ | 20,400 | |
| Total assets | | $ | - | | | $ | 20,400 | | | $ | - | | | $ | 20,400 | |
| | | | | | | | | | | | | | | | | |
| Benefits payable in conjunction with | | | | | | | | | | | | | | | | |
deferred compensation plan(1) | | $ | - | | | $ | 21,769 | | | $ | - | | | $ | 21,769 | |
Interest rate swap(3) | | | - | | | | 197 | | | | - | | | | 197 | |
| Total liabilities | | $ | - | | | $ | 21,966 | | | $ | - | | | $ | 21,966 | |
| (1) | The investments held and benefits payable to participants in conjunction with the deferred compensation plan were primarily based on quoted prices for similar assets in active markets. Changes in the fair value of the investments are recognized as an increase or decrease in compensation expense. Changes in the fair value of the benefits payables to participants are recognized as a corresponding offset to compensation expense. The net impact of changes in fair value is not material. The deferred compensation plan is further discussed in Note 9. |
| (2) | Investments held in conjunction with the deferred compensation plan exclude approximately $1,175 which is included in “Cash and cash equivalents” on the Company’s Condensed Consolidated Balance Sheet at March 31, 2010. |
| (3) | The fair value of the interest rate swap was based on quoted prices for similar assets or liabilities in active markets. The Company’s interest rate swap is further discussed in Note 7. |
The Company does not have any material financial assets in a market that is not active.
DUFF & PHELPS CORPORATION AND SUBSIDIARIES
NOTES TO THE CONDENSED CONSOLIDATED FINANCIAL STATEMENTS
(In thousands, except per share amounts)
(Unaudited)
Note 7 - LONG-TERM DEBT
On July 15, 2009, Duff & Phelps, LLC entered into a credit agreement with Bank of America, N.A., as administrative agent and the lenders from time to time party thereto ("Credit Agreement"), providing for a $30,000 senior secured revolving credit facility (“Credit Facility”), including a $10,000 sub-limit for the issuance of letters of credit. The proceeds of the facility are permitted to be used for working capital, permitted acquisitions and general corporate purposes. The maturity date is July 15, 2012 and amounts borrowed may be voluntarily prepaid at any time without penalty or premium, subject to customary breakage costs.
There were no amounts outstanding under the Credit Facility at March 31, 2010 or through the filing date of this Quarterly Report on Form 10-Q. As of March 31, 2010, the Company had $4,237 of outstanding letters of credit of which $3,810 were issued against the Credit Facility. There was $427 of cash deposited into a restricted account to serve as deposits to secure the remaining letters of credit. These letters of credit were issued in connection with real estate leases.
Loans under the Credit Facility will, at the Company's option, bear interest on the principal amount outstanding at either (a) a rate equal to LIBOR, plus an applicable margin or (b) a base rate, plus an applicable margin. The applicable margin rate will be based on the Company's most recent consolidated leverage ratio and ranges from 1.75% to 2.50% per annum depending on the Company's consolidated leverage ratio. In addition, the Company is required to pay an unused commitment fee on the actual daily amount of the unutilized portion of the commitments of the lenders at a rate ranging from 0.25% to 0.50% per annum, based on the Company's most recent consolidated leverage ratio. Based on the Company’s consolidated leverage ratio at March 31, 2010, the Company qualified for the 1.75% applicable margin and 0.25% unused commitment fee.
The Credit Agreement contains customary representations and warranties and customary affirmative and negative covenants, including, among others, limitations on (a) the incurrence of liens, (b) the incurrence of indebtedness, (c) the ability to make dividends and distributions, as well as redeem and repurchase equity interests, and (d) acquisitions, mergers, consolidations and sales of assets. In addition, the Credit Agreement contains financial covenants that do not permit (a) a total leverage ratio of greater than 2.75 to 1.00 until the quarter ending September 30, 2010, and 2.50 to 1.00 thereafter and (b) a consolidated fixed charge coverage ratio of less than 2.00 to 1.00. The financial covenants are tested on the last day of each fiscal quarter based on the last four fiscal quarter periods. Management believes that the Company was in compliance with all of its covenants as of March 31, 2010. The Credit Agreement permits dividend payments or other distributions in the Company’s common stock or other equity interests subject to certain limitations.
The obligation of the Company to pay amounts outstanding under the Credit Facility may be accelerated upon the occurrence of an "Event of Default" as defined in the Credit Agreement. The Company's obligations under the Credit Agreement are guaranteed by D&P Acquisitions, and certain domestic subsidiaries of the Company (collectively, the "Guarantors"). The Credit Agreement is secured by a lien on substantially all of the personal property of the Company and each of the Guarantors.
Interest Rate Swap
The Company has a $8,500 notional amount interest rate swap that effectively converted floating rate LIBOR payments to fixed payments at 4.94%. As a result of the termination of the Company’s former credit facility with General Electric Capital Corporation, the underlying floating rate obligation is no longer outstanding. The swap agreement terminates September 30, 2010. The Company elected not to apply hedge accounting to this instrument. The estimated fair value of the interest rate swap is based on quoted market prices. The gain or loss is recorded in “Other expense” and has a non-cash impact on the Company’s operations. At March 31, 2010, the liability resulting from the interest rate swap was included in “Other current liabilities.”
DUFF & PHELPS CORPORATION AND SUBSIDIARIES
NOTES TO THE CONDENSED CONSOLIDATED FINANCIAL STATEMENTS
(In thousands, except per share amounts)
(Unaudited)
The following table summarizes the estimated fair value and the gain or loss recorded for the change in fair value of the interest rate swap.
| | | Three Months Ended | |
| | | March 31, | | | March 31, | |
| | | 2010 | | | 2009 | |
| Gain resulting from change | | | | | | |
| in fair value of interest rate swap | | $ | 125 | | | $ | 191 | |
| | | | | | | | | |
| Estimated fair value – (liability) | | $ | (197 | ) | | $ | (739 | ) |
DUFF & PHELPS CORPORATION AND SUBSIDIARIES
NOTES TO THE CONDENSED CONSOLIDATED FINANCIAL STATEMENTS
(In thousands, except per share amounts)
(Unaudited)
Note 8 - INCOME TAXES
The Company’s effective tax rate is summarized in the following table:
| | | Three Months Ended | |
| | | March 31, | | | March 31, | |
| | | 2010 | | | 2009 | |
| Provision for income taxes | | $ | 3,650 | | | $ | 2,112 | |
| Effective income tax rate | | | 32.5 | % | | | 24.3 | % |
The tax provision for the current year period is based on our estimate of the Company’s annualized income tax rate. The effective tax rate is calculated by dividing the provision for income taxes by income before income taxes.
The Company's effective tax rate includes a rate benefit attributable to the fact that the Company’s subsidiaries operate as a series of limited liability companies and other flow-through entities which are not subject to federal income tax. Accordingly, a portion of the Company's earnings are not subject to corporate level taxes. This favorable impact is partially offset by the impact of certain permanent items, primarily attributable to certain compensation related expenses that are not deductible for tax purposes.
The Company accounts for uncertainties in income tax positions in accordance with FASB ASC 740, Income Taxes. A reconciliation of the beginning and ending amount of unrecognized tax benefit is summarized as follows:
| Balance as of December 31, 2009 | | $ | 548 | |
| Additional based on tax positions related to the current year | | | 34 | |
| Balance as of March 31, 2010 | | $ | 582 | |
The Company recognizes interest income and expense related to income taxes as a component of interest expense and penalties as a component of selling, general and administrative expenses.
The Company and its subsidiaries file income tax returns in the U.S. federal jurisdiction and various states and foreign jurisdictions. Duff & Phelps, LLC and D&P Acquisitions are open for federal income tax purposes from 2006 forward. These entities are not subject to federal income taxes as they are flow-through entities. The Company is open for federal income tax purposes beginning in 2007.
With respect to state and local jurisdictions and countries outside of the United States, the Company and its subsidiaries are typically subject to examination for four to five years after the income tax returns have been filed. Although the outcome of tax audits is always uncertain, the Company believes that adequate amounts of tax, interest and penalties have been provided for in the accompanying consolidated financial statements for any adjustments that might be incurred due to state, local or foreign audits.
DUFF & PHELPS CORPORATION AND SUBSIDIARIES
NOTES TO THE CONDENSED CONSOLIDATED FINANCIAL STATEMENTS
(In thousands, except per share amounts)
(Unaudited)
Note 9 - DEFERRED COMPENSATION PLAN
The Company maintains the Duff & Phelps Deferred Compensation Plan (“Deferred Compensation Plan”) for key employees. This plan is detailed further in our Annual Report on Form 10-K for the year ended December 31, 2009.
Under the terms of the plan, the Company established a “rabbi trust” as a vehicle for accumulating assets to pay benefits under the plan. Payments under the plan may be paid from the general assets of the Company or from the assets of any such rabbi trust. Payment from any such source reduces the obligation owed to the participant or beneficiary. The rabbi trust invests in an investment vehicle structured as a corporate-owned life insurance (“COLI”) policy with a cash surrender value that mirrors the payable to the participants of the plan and tracks the value of the plan assets. Participants can earn a return on their deferred compensation that is based on hypothetical investment funds. The policy is redeemable on demand in an amount equal to the cash surrender value. The cash surrender value approximates fair value.
The following table summarizes the fair market value of the rabbi trust and the corresponding liability owed to participants:
| | | March 31, | | | December 31, | |
| | | 2010 | | | 2009 | |
| Fair market value of investments in rabbi trust | | $ | 20,400 | | | $ | 17,807 | |
| Payable to participants of the plan | | | 21,769 | | | | 18,051 | |
| (1) | The fair market value of investments in rabbi trust held in conjunction with the deferred compensation plan excludes approximately $1,175 and $251 which is included in cash and cash equivalents at March 31, 2010 and December 31, 2009, respectively. |
The fair market value of the investments in the rabbi trust is included in “Investments related to the deferred compensation plan” with the corresponding deferred compensation obligation included in “Current portion of liability related to deferred compensation plan” and “Liability related to deferred compensation plan, less current portion” on the Condensed Consolidated Balance Sheets. Changes in the fair value of the investments are recognized as compensation expense (or credit). Changes in the fair value of the benefits payables to participants are recognized as a corresponding offset to compensation expense (or credit). The net impact of changes in fair value is not material.
Note 10 - IMPAIRMENT OF CERTAIN INTANGIBLE ASSETS
The impairment of certain intangible assets resulted from a one-time charge incurred to impair certain intangible assets that originated from our acquisition of World Tax Services US, LLC (“WTS”) in July 2008. WTS operated as part of the Financial Advisory segment. The impairment resulted from the departure of the two managing directors who ran the practice and associated staff in March 2010.
Note 11 - COMMITMENTS AND CONTINGENCIES
The Company is involved in various claims or disputes arising in the normal course of business. Management does not believe that these matters would have a material adverse effect on the Company's financial position, results of operations or liquidity.
DUFF & PHELPS CORPORATION AND SUBSIDIARIES
NOTES TO THE CONDENSED CONSOLIDATED FINANCIAL STATEMENTS
(In thousands, except per share amounts)
(Unaudited)
Note 12 - SEGMENT INFORMATION
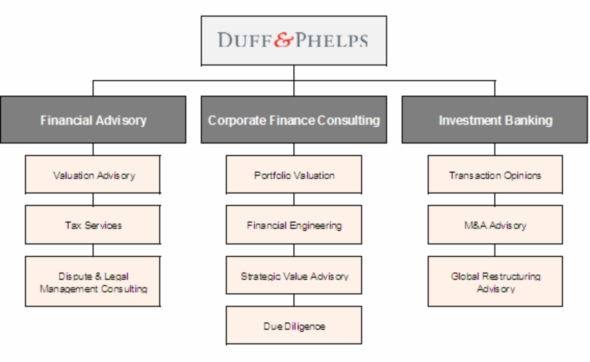
The Company provides services through three segments: Financial Advisory, Corporate Finance Consulting and Investment Banking. The Financial Advisory segment provides services associated with valuation advisory, tax, and dispute and legal management consulting. The Corporate Finance Consulting segment provides services related to portfolio valuation, financial engineering, strategic value advisory and due diligence. The Investment Banking segment provides restructuring advisory services, transaction opinions, and merger and acquisition advisory services.
| | | Three Months Ended | |
| | | March 31, | | | March 31, | |
| | | 2010 | | | 2009 | |
| Financial Advisory | | | | | | |
| Revenues (excluding reimbursables) | | $ | 53,882 | | | $ | 60,891 | |
| Segment operating income | | | 7,538 | | | | 10,349 | |
| Segment operating income margin | | | 14.0 | % | | | 17.0 | % |
| | | | | | | | | |
| Corporate Finance Consulting | | | | | | | | |
| Revenues (excluding reimbursables) | | $ | 14,936 | | | $ | 14,616 | |
| Segment operating income | | | 2,982 | | | | 3,252 | |
| Segment operating income margin | | | 20.0 | % | | | 22.2 | % |
| | | | | | | | | |
| Investment Banking | | | | | | | | |
| Revenues (excluding reimbursables) | | $ | 20,346 | | | $ | 13,758 | |
| Segment operating income | | | 5,057 | | | | 1,543 | |
| Segment operating income margin | | | 24.9 | % | | | 11.2 | % |
| | | | | | | | | |
| Total | | | | | | | | |
| Revenues (excluding reimbursables) | | $ | 89,164 | | | $ | 89,265 | |
| | | | | | | | | |
| Segment operating income | | $ | 15,577 | | | $ | 15,144 | |
| Net client reimbursable expenses | | | (56 | ) | | | 22 | |
| Equity-based compensation from Legacy Units and IPO Options | | | (1,083 | ) | | | (3,253 | ) |
| Depreciation and amortization | | | (2,493 | ) | | | (2,562 | ) |
| Charge from impairment of certain intangible assets | | | (674 | ) | | | - | |
| Operating income | | $ | 11,271 | | | $ | 9,351 | |
Revenues excluding reimbursable expenses attributable to geographic area are summarized as follows:
| | | Three Months Ended | |
| | | March 31, | | | March 31, | |
| | | 2010 | | | 2009 | |
| United States | | $ | 77,071 | | | $ | 81,367 | |
| Europe | | | 11,208 | | | | 6,823 | |
| Asia | | | 885 | | | | 1,075 | |
| Revenues (excluding reimbursables) | | $ | 89,164 | | | $ | 89,265 | |
There were no intersegment revenues during the periods presented. The Company does not maintain separate balance sheet information by segment.
DUFF & PHELPS CORPORATION AND SUBSIDIARIES
NOTES TO THE CONDENSED CONSOLIDATED FINANCIAL STATEMENTS
(In thousands, except per share amounts)
(Unaudited)
For segment reporting purposes, management uses certain estimates and assumptions to allocate revenues and expenses. Revenues and expenses attributable to reportable segments are generally based on which segment and product line a client service professional is a dedicated member. As a result, revenues recognized that relate to the cross utilization of client service professionals across reportable segments occur each period depending on the expertise required for each engagement. In particular, the Financial Advisory segment (primarily Valuation Advisory services) recognized revenues of $2,945 and $4,322 from the cross utilization of its client service professionals on engagements from the Corporate Finance Consulting segment (primarily Portfolio Valuation services) in the three months ended March 31, 2010 and 2009, respectively.
DUFF & PHELPS CORPORATION AND SUBSIDIARIES
NOTES TO THE CONDENSED CONSOLIDATED FINANCIAL STATEMENTS
(In thousands, except per share amounts)
(Unaudited)
Note 13 - RELATED PARTY TRANSACTIONS
Lovell Minnick Partners
Entities affiliated with Lovell Minnick Partners are holders of Class B common stock and an equivalent number of New Class A Units. Two managing directors of Lovell Minnick Partners serve as independent directors on the Company’s Board of Directors.
D&P Acquisitions made distributions to entities affiliated with Lovell Minnick Partners as summarized in the following table:
| | | Three Months Ended | |
| | | March 31, | | | March 31, | |
| | | 2010 | | | 2009 | |
| Distributions for taxes | | $ | 59 | | | $ | 2,361 | |
| Other distributions | | | 181 | | | | - | |
| Payments pursuant to the TRA | | | - | | | | - | |
| | | $ | 240 | | | $ | 2,361 | |
Distributions for taxes, other distributions and payments pursuant to the TRA are further described in Note 3.
An affiliate of Lovell Minnick Partners engaged the Company to provide certain consulting services. As a result of services provided, the Company recorded $31 of revenues resulting from the engagement during the three months ended March 31, 2010.
Vestar Capital Partners
Entities affiliated with Vestar Capital Partners are holders of Class B common stock and an equivalent number of New Class A Units. A managing director of Vestar Capital Partners serves as independent directors on the Company’s Board of Directors.
D&P Acquisitions made distributions to entities affiliated with Vestar Capital Partners as summarized in the following table:
| | | Three Months Ended | |
| | | March 31, | | | March 31, | |
| | | 2010 | | | 2009 | |
| Distributions for taxes | | $ | 74 | | | $ | 2,846 | |
| Other distributions | | | 251 | | | | - | |
| Payments pursuant to the TRA | | | - | | | | - | |
| | | $ | 325 | | | $ | 2,846 | |
Distributions for taxes, other distributions and payments pursuant to the TRA are further described in Note 3.
DUFF & PHELPS CORPORATION AND SUBSIDIARIES
NOTES TO THE CONDENSED CONSOLIDATED FINANCIAL STATEMENTS
(In thousands, except per share amounts)
(Unaudited)
Note 14 - SUBSEQUENT EVENTS
In accordance with FASB ASC 855, Subsequent Events, management of the Company evaluated subsequent events.
Departure of Directors or Certain Officers
On April 22, 2010, the Company announced certain management changes, including that Gerard Creagh, president, will leave the Company to pursue other interests. Noah Gottdiener, chairman and chief executive officer of the Company, will be assuming the additional role of president. Mr. Creagh will not stand for election at the Company’s upcoming annual meeting of stockholders. The Company estimates that it will incur a one-time charge associated with these changes of approximately $3,700 in its second quarter of 2010 related to cash severance and the accounting impact of accelerated vesting of equity-based awards.
Declaration of Quarterly Dividend
On April 29, 2010, the Company announced that its board of directors had declared a quarterly dividend of $0.06 per share on its outstanding Class A common stock. The dividend is payable on May 28, 2010 to shareholders of record on May 18, 2010. Concurrently with the payment of the dividend, the Company will be distributing $0.06 per unit to holders of New Class A Units.
Authorization of Stock Repurchase Program
On April 29, 2010, the Company announced that its Board of Directors had approved a stock repurchase program, authorizing the Company to repurchase in the aggregate up to $50.0 million of its outstanding common stock. Purchases by the Company under this program may be made from time to time at prevailing market prices in open market purchases, privately negotiated transactions, block purchase techniques or otherwise, as determined by the Company’s management. The purchases will be funded from existing cash balances.
This program does not obligate the Company to acquire any particular amount of common stock. The timing, frequency and amount of repurchase activity will depend on a variety of factors such as levels of cash generation from operations, cash requirements for investment in the Company’s business, current stock price, market conditions and other factors. The share repurchase program may be suspended, modified or discontinued at any time and has no set expiration date.
Item 2. Management’s Discussion and Analysis of Financial Condition and Results of Operations.
Disclosure Regarding Forward-Looking Statements
This report contains forward-looking statements within the meaning of Section 27A of the Securities Act of 1933 and Section 21E of the Securities Exchange Act of 1934 (the “Exchange Act”), which reflect the Company’s current views with respect to, among other things, future events and financial performance. The Company generally identifies forward looking statements by terminology such as “outlook,” “believes,” “expects,” “potential,” “continues,” “may,” “will,” “could,” “should,” “seeks,” “approximately,” “predicts,” “intends,” “plans,” “estimates,” “anticipates” or the negative version of those words or other comparable words. Any forward-looking statements contained in this discussion are based upon our historical performance and on our current plans, estimates and expectations. The inclusion of this forward-looking information should not be regarded as a representation by us, or any other person that the future plans, estimates or expectations contemplated by us will be achieved. Such forward-looking statements are subject to various risks and uncertainties and assumptions relating to our operations, financial results, financial condition, business prospects, growth strategy and liquidity. If one or more of these or other risks or uncertainties materialize, or if our underlying assumptions prove to be incorrect, our actual results may vary materially from those indicated in these statements. These factors should not be construed as exhaustive and should be read in conjunction with the other cautionary statements and the risk factors section that are included in our Annual Report on Form 10-K for the year ended December 31, 2009 and any subsequent filings of our Quarterly Reports on Form 10-Q. The forward-looking statements included in this Quarterly Report on Form 10-Q are made only as of the date of this filing with the Securities and Exchange Commission. The Company does not undertake any obligation to publicly update or review any forward-looking statement, whether as a result of new information, future developments or otherwise.
Critical Accounting Policies and Estimates
Management’s discussion and analysis of the Company’s financial condition and results of operations is based upon the Company’s consolidated financial statements, which have been prepared in accordance with accounting principles generally accepted in the United States (“GAAP”). The preparation of financial statements in conformity with GAAP requires management to make estimates and assumptions that affect amounts of assets and liabilities and disclosures of contingent assets and liabilities as of the date of the financial statements and reported amounts of revenues and expenses during the periods presented. Actual results could differ from these estimates. Estimates and assumptions are reviewed periodically and the effects of revisions are reflected in the consolidated financial statements in the period they are deemed to be necessary. Significant estimates made in the accompanying consolidated financial statements include, but are not limited to the following:
| | · | proportional performance under client engagements for the purpose of determining revenue recognition, |
| | · | accounts receivable and unbilled services valuation, |
| | | incentive compensation and other accrued benefits, |
| | · | useful lives of intangible assets, |
| | · | the carrying value of goodwill and intangible assets, |
| | · | amounts due to noncontrolling unitholders, |
| | · | reserves for estimated tax liabilities, |
| | · | certain estimates and assumptions used in the allocation of revenues and expenses for our segment reporting, and |
| | · | certain estimates and assumptions used in the calculation of the fair value of equity compensation issued to employees. |
A summary of the Company’s critical accounting policies and estimates can be found in our Annual Report on Form 10-K for the year ended December 31, 2009. During the three months ended March 31, 2009, there were no significant changes to our critical accounting policies and estimates.
Results of Operations
We are a leading provider of independent financial advisory and investment banking services. Our mission is to help our clients protect, maximize and recover value by providing independent advice on issues involving highly technical and complex assessments in the areas of valuation, transactions, financial restructuring, disputes and taxation. We believe that the Duff & Phelps brand is associated with experienced professionals who give trusted guidance in a responsive manner. We serve a global client base through offices in 23 cities, comprised of offices in 17 U.S. cities, including New York, Chicago, Dallas and Los Angeles, and six international offices located in Amsterdam, London, Munich, Paris, Shanghai and Tokyo.
We provide services through three segments: Financial Advisory, Corporate Finance Consulting and Investment Banking.
Equity-based compensation discussed herein includes (a) grants of units of D&P Acquisitions prior to the recapitalization transaction that were effectuated in conjunction with the IPO (“Legacy Units”), (b) options to purchase shares of the Company’s Class A common stock granted in connection with the IPO (“IPO Options”) and (c) restricted stock awards and units issued in connection with the Company’s ongoing long-term compensation program (“Ongoing RSAs”). The IPO, Recapitalization Transactions and the Company’s capital structure are further detailed in our Annual Report on Form 10-K for the year ended December 31, 2009.
Amounts are reported in thousands, except for per share amounts, headcount or where the context requires otherwise.
Three months ended March 31, 2010 versus three months ended March 31, 2009
The results of operations are summarized as follows:
| | | Three Months Ended | | | | | | | |
| | | March 31, | | | March 31, | | | Unit | | | Percent | |
| | | 2010 | | | 2009 | | | Change | | | Change | |
| Revenues | | $ | 89,164 | | | $ | 89,265 | | | $ | (101 | ) | | | (0.1 | )% |
| Reimbursable expenses | | | 2,798 | | | | 2,037 | | | | 761 | | | | 37.4 | % |
| Total revenues | | | 91,962 | | | | 91,302 | | | | 660 | | | | 0.7 | % |
| | | | | | | | | | | | | | | | | |
| Direct client service costs | | | | | | | | | | | | | | | | |
Compensation and benefits(1) | | | 48,598 | | | | 51,130 | | | | (2,532 | ) | | | (5.0 | )% |
| Other direct client service costs | | | 2,605 | | | | 1,304 | | | | 1,301 | | | | 99.8 | % |
| Reimbursable expenses | | | 2,854 | | | | 2,015 | | | | 839 | | | | 41.6 | % |
| | | | 54,057 | | | | 54,449 | | | | (392 | ) | | | (0.7 | )% |
| | | | | | | | | | | | | | | | | |
| Operating expenses | | | | | | | | | | | | | | | | |
Selling, general and administrative(2) | | | 23,467 | | | | 24,940 | | | | (1,473 | ) | | | (5.9 | )% |
| Depreciation and amortization | | | 2,493 | | | | 2,562 | | | | (69 | ) | | | (2.7 | )% |
| Charge from impairment of certain intangible assets | | | 674 | | | | - | | | | 674 | | | | - | |
| | | | 26,634 | | | | 27,502 | | | | (868 | ) | | | (3.2 | )% |
| | | | | | | | | | | | | | | | | |
| Operating income | | | 11,271 | | | | 9,351 | | | | 1,920 | | | | 20.5 | % |
| | | | | | | | | | | | | | | | | |
| Other expense, net | | | | | | | | | | | | | | | | |
| Interest income | | | (24 | ) | | | (14 | ) | | | (10 | ) | | | 71.4 | % |
| Interest expense | | | 92 | | | | 655 | | | | (563 | ) | | | (86.0 | )% |
| Other (income)/expense | | | (15 | ) | | | 17 | | | | (32 | ) | | | (188.2 | )% |
| | | | 53 | | | | 658 | | | | (605 | ) | | | (91.9 | )% |
| | | | | | | | | | | | | | | | | |
| Income before income taxes | | | 11,218 | | | | 8,693 | | | | 2,525 | | | | 29.0 | % |
| | | | | | | | | | | | | | | | | |
| Provision for income taxes | | | 3,650 | | | | 2,112 | | | | 1,538 | | | | 72.8 | % |
| | | | | | | | | | | | | | | | | |
| Net income | | | 7,568 | | | | 6,581 | | | | 987 | | | | 15.0 | % |
| | | | | | | | | | | | | | | | | |
| Less: Net income attributable to noncontrolling interest | | | 3,295 | | | | 4,816 | | | | (1,521 | ) | | | (31.6 | )% |
| | | | | | | | | | | | | | | | | |
| Net income attributable to Duff & Phelps Corporation | | $ | 4,273 | | | $ | 1,765 | | | $ | 2,508 | | | | 142.1 | % |
| | | | | | | | | | | | | | | | | |
| Other financial and operating data | | | | | | | | | | | | | | | | |
| | | | | | | | | | | | | | | | | |
Adjusted EBITDA(3) | | $ | 15,521 | | | $ | 15,166 | | | $ | 355 | | | | 2.3 | % |
| | | | | | | | | | | | | | | | | |
Adjusted EBITDA(3) as a percentage of revenues | | | 17.4 | % | | | 17.0 | % | | | 0.4 | % | | | 2.5 | % |
| | | | | | | | | | | | | | | | | |
| End of period managing directors | | | 158 | | | | 169 | | | | (11 | ) | | | (6.5 | )% |
| | | | | | | | | | | | | | | | | |
| End of period client service professionals | | | 830 | | | | 948 | | | | (118 | ) | | | (12.4 | )% |
| (1) | Compensation and benefits include $3,717 and $4,262 of equity-based compensation expense for the three months ended March 31, 2010 and 2009, respectively. |
| (2) | Selling, general and administrative expenses include $1,453 and $1,892 of equity-based compensation expense for the three months ended March 31, 2010 and 2009, respectively. |
| (3) | Adjusted EBITDA is a non-GAAP financial measure and is calculated as follows: |
Reconciliation of Adjusted EBITDA
| | | Three Months Ended | |
| | | March 31, | | | March 31, | |
| | | 2010 | | | 2009 | |
| Revenues (excluding client reimbursables) | | $ | 89,164 | | | $ | 89,265 | |
| | | | | | | | | |
| Net income attributable to Duff & Phelps Corporation | | $ | 4,273 | | | $ | 1,765 | |
| Net income attributable to noncontrolling interest | | | 3,295 | | | | 4,816 | |
| Provision for income taxes | | | 3,650 | | | | 2,112 | |
| Other expense, net | | | 53 | | | | 658 | |
| Depreciation and amortization | | | 2,493 | | | | 2,562 | |
| Charge from impairment of certain intangible assets | | | 674 | | | | - | |
| Equity-based compensation associated with Legacy Units and IPO Options | | | 1,083 | | | | 3,253 | |
| Adjusted EBITDA | | $ | 15,521 | | | $ | 15,166 | |
| Adjusted EBITDA as a percentage of revenues | | | 17.4 | % | | | 17.0 | % |
Adjusted EBITDA is a non-GAAP financial measure. We believe that Adjusted EBITDA provides a relevant and useful alternative measure of our ongoing profitability and performance, when viewed in conjunction with GAAP measures, as it adjusts net income or loss attributable to Duff & Phelps Corporation for (a) net income or loss attributable to noncontrolling interest, (b) provision for income taxes, (c) interest expense and depreciation and amortization (a significant portion of which relates to debt and capital investments that have been incurred as the result of acquisitions and investments in stand-alone infrastructure which we do not expect to incur at the same levels in the future), (d) equity-based compensation associated with the Legacy Units of D&P Acquisitions, a significant portion of which is due to certain one-time grants associated with acquisitions prior to our IPO, and options to purchase shares of the Company’s Class A common stock granted in connection with the IPO (“IPO Options”), and (e) impairment charges, acquisition retention expenses and other merger and acquisition costs, which are generally non-recurring in nature or are related to deferred payments associated with prior acquisitions.
Given the level of acquisition activity during the period prior to our IPO, and related capital investments and one time equity grants associated with acquisitions during the this period (which we do not expect to incur at the same levels post IPO) and the IPO, and our belief that, as a professional services organization, our operations are not capital intensive on an ongoing basis, we believe the Adjusted EBITDA measure, in addition to GAAP financial measures, provides a relevant and useful benchmark for investors, in order to assess our financial performance and comparability to other companies in our industry. The Adjusted EBITDA measure is utilized by our senior management to evaluate our overall performance and operating expense characteristics and to compare our performance to that of certain of our competitors. A measure similar to Adjusted EBITDA is the principal measure that determines the compensation of our senior management team. In addition, a measure similar to Adjusted EBITDA is a key measure that determines compliance with certain financial covenants under our credit facility. Management compensates for the inherent limitations associated with using the Adjusted EBITDA measure through disclosure of such limitations, presentation of our financial statements in accordance with GAAP and reconciliation of Adjusted EBITDA to the most directly comparable GAAP measure, net income or loss. Furthermore, management also reviews GAAP measures, and evaluates individual measures that are not included in Adjusted EBITDA such as our level of capital expenditures, equity issuance and interest expense, among other measures.
Adjusted EBITDA, as defined by the Company, consists of net income or loss attributable to Duff & Phelps Corporation before (a) net income or loss attributable to the noncontrolling interest, (b) provision for income taxes, (c) other expense, net, (d) depreciation and amortization, (e) charges from impairment of intangible assets, (f) equity-based compensation associated with Legacy Units and IPO Options included in both compensation and benefits and in selling, general and administrative expenses, (g) acquisition retention expenses, and (h) merger and acquisition costs.
This non-GAAP financial measure is not prepared in accordance with, and should not be considered an alternative to, measurements required by GAAP, such as operating income, net income or loss, net income or loss per share, cash flow from continuing operating activities or any other measure of performance or liquidity derived in accordance with GAAP. The presentation of this additional information is not meant to be considered in isolation or as a substitute for the most directly comparable GAAP measures. In addition, it should be noted that companies calculate Adjusted EBITDA differently and, therefore, Adjusted EBITDA as presented for us may not be comparable to Adjusted EBITDA reported by other companies.
Overview
As we enter what appears to be a period of economic recovery, we are beginning to see modest improvements in certain areas of our business. Certain of our services typically correlated to the volume of M&A transactions have seen recent improvements over the corresponding prior year quarter, including revenues from M&A advisory, transaction opinions and due diligence. Although demand for valuation advisory services has decreased when compared to the corresponding prior year quarter, these services have begun to show sequential improvement since late 2009. In addition, revenues from global restructuring advisory have continued to increase over the corresponding prior year quarter. Overall, we believe that revenue and earnings for the quarter demonstrate the resiliency of our balanced portfolio of services and diversified client base, whose demand for complex financial advisory and valuation services continues.
Revenues
Revenues excluding reimbursable expenses decreased $101 or 0.1% to $89,164 for the three months ended March 31, 2010, compared to $89,265 for the three months ended March 31, 2009. The decrease in revenues primarily resulted from an 11.5% decrease in revenues from our Financial Advisory segment. These decreases were partially offset by a 47.9% increase in revenues from our Investment Banking segment and a 2.2% increase in revenues from our Corporate Finance Consulting segment, as summarized in the following table:
| | | Three Months Ended | | | | | | | |
| | | March 31, | | | March 31, | | | Dollar | | | Percent | |
| | | 2010 | | | 2009 | | | Change | | | Change | |
| Financial Advisory | | | | | | | | | | | | |
| Valuation Advisory | | $ | 35,020 | | | $ | 40,370 | | | $ | (5,350 | ) | | | (13.3 | )% |
| Tax Services | | | 9,447 | | | | 10,878 | | | | (1,431 | ) | | | (13.2 | )% |
| Dispute & Legal Management Consulting | | | 9,415 | | | | 9,643 | | | | (228 | ) | | | (2.4 | )% |
| | | | 53,882 | | | | 60,891 | | | | (7,009 | ) | | | (11.5 | )% |
| | | | | | | | | | | | | | | | | |
| Corporate Finance Consulting | | | | | | | | | | | | | | | | |
| Portfolio Valuation | | | 5,482 | | | | 6,295 | | | | (813 | ) | | | (12.9 | )% |
| Financial Engineering | | | 4,126 | | | | 4,148 | | | �� | (22 | ) | | | (0.5 | )% |
| Strategic Value Advisory | | | 3,158 | | | | 2,620 | | | | 538 | | | | 20.5 | % |
| Due Diligence | | | 2,170 | | | | 1,553 | | | | 617 | | | | 39.7 | % |
| | | | 14,936 | | | | 14,616 | | | | 320 | | | | 2.2 | % |
| | | | | | | | | | | | | | | | | |
| Investment Banking | | | | | | | | | | | | | | | | |
| Global Restructuring Advisory | | | 9,841 | | | | 5,578 | | | | 4,263 | | | | 76.4 | % |
| Transaction Opinions | | | 6,823 | | | | 6,101 | | | | 722 | | | | 11.8 | % |
| M&A Advisory | | | 3,682 | | | | 2,079 | | | | 1,603 | | | | 77.1 | % |
| | | | 20,346 | | | | 13,758 | | | | 6,588 | | | | 47.9 | % |
| Total Revenues (excluding reimbursables) | | $ | 89,164 | | | $ | 89,265 | | | $ | (101 | ) | | | (0.1 | )% |
Our Financial Advisory segment was impacted by lower revenues from valuation advisory and to a lesser extent tax services. Services within valuation advisory were impacted by a reduction of goodwill impairment testing due to improvement in the overall economic environment and a lower volume of real estate valuation activity, partially offset by an increase in revenues from purchase price allocations from an increase in M&A activity. The decrease in revenues from tax services primarily resulted from lower revenues from transactional tax and tax compliance due to the departure of staff principally affiliated with our acquisition of World Tax Services US, LLC (“WTS”) in July 2008. Portfolio valuation decreased from the timing of workflow on several key engagements. Decreases in Financial Advisory and portfolio valuation were partially offset by increases in revenues from global restructuring advisory, M&A advisory, transaction opinions and due diligence.
Our client service headcount decreased to 830 client service professionals at March 31, 2010, compared to 878 client service professionals at December 31, 2009. This decrease resulted from targeted reductions and attrition primarily in our Financial Advisory segment and to a lesser extent in our Corporate Finance Consulting segment.
Direct Client Service Costs
Direct client service costs decreased $392 or 0.7% to $54,057 for the three months ended March 31, 2010, compared to $54,449 for the three months ended March 31, 2009. Direct client service costs include compensation and benefits for client service employees, fees payable to contractors and other expenses related to the execution of engagements. The following table adjusts direct client service costs for equity-based compensation associated with Legacy Units and IPO Options, acquisition retention expenses and reimbursable expenses:
Direct Client S ervice Costs
| | | Three Months Ended | |
| | | March 31, | | | March 31, | |
| | | 2010 | | | 2009 | |
| Revenues (excluding reimbursables) | | $ | 89,164 | | | $ | 89,265 | |
| | | | | | | | | |
| Total direct client service costs | | $ | 54,057 | | | $ | 54,449 | |
| Less: equity-based compensation associated | | | | | | | | |
| with Legacy Units and IPO Options | | | (598 | ) | | | (2,331 | ) |
| Less: reimbursable expenses | | | (2,854 | ) | | | (2,015 | ) |
| Direct client service costs, as adjusted | | $ | 50,605 | | | $ | 50,103 | |
| | | | | | | | | |
| Direct client service costs, as adjusted, | | | | | | | | |
| as a percentage of revenues | | | 56.8 | % | | | 56.1 | % |
Direct client service costs, as adjusted, increased between periods. Higher equity-compensation expense from incremental grants of Ongoing RSAs and higher accrued compensation were partially offset by lower compensation and benefits from the reduction in headcount between periods.
In aggregate, equity-based compensation decreased between periods primarily as a result of the accelerated attribution of expense on awards with graded-tranche vesting in prior periods for Legacy Units and IPO Options and changes in estimates of forfeiture rates, partially offset by an increase in expense from grants of Ongoing RSAs.
Operating Expenses
Operating expenses decreased $868 or 3.2% to $26,634 for the three months ended March 31, 2010, compared to $27,502 for the three months ended March 31, 2009. The decrease in operating expenses resulted from a $1,473 or 5.9% decrease in selling, general and administrative expenses, partially offset by a $674 one-time charge from the impairment of certain intangible assets that originated from our acquisition of WTS in July 2008. The impairment resulted from the departure of the two managing directors who ran this group and associated staff in March 2010. WTS operated as part of our Financial Advisory segment.
The following table adjusts operating expenses for equity-based compensation associated with Legacy Units and IPO Options, depreciation and amortization, and a charge to impair certain intangible assets:
Operating Expenses
| | | Three Months Ended | |
| | | March 31, | | | March 31, | |
| | | 2010 | | | 2009 | |
| Revenues (excluding reimbursables) | | $ | 89,164 | | | $ | 89,265 | |
| | | | | | | | | |
| Total operating expenses | | $ | 26,634 | | | $ | 27,502 | |
| Less: equity-based compensation associated | | | | | | | | |
| with Legacy Units and IPO Options | | | (485 | ) | | | (922 | ) |
| Less: depreciation and amortization | | | (2,493 | ) | | | (2,562 | ) |
| Less: charge to impair certain intangible assets | | | (674 | ) | | | - | |
| Operating expenses, as adjusted | | $ | 22,982 | | | $ | 24,018 | |
| | | | | | | | | |
| Operating expenses, as adjusted, | | | | | | | | |
| as a percentage of revenues | | | 25.8 | % | | | 26.9 | % |
Operating expenses, as adjusted, decreased between periods primarily from lower professional fees and other general expenses.
In aggregate, equity-based compensation decreased between periods primarily as a result of the accelerated attribution of expense on awards with graded-tranche vesting in prior periods for Legacy Units and IPO Options and changes in estimates of forfeiture rates.
Other Income and Expenses
Other income and expenses include interest income, interest expense and other expense. Interest expense decreased primarily as a result of repayment and termination of our former credit facility with General Electric Capital Corporation in May 2009.
Provision for Income Taxes
The provision for income taxes was $3,650 or 32.5% of income before income taxes for the three months ended March 31, 2010, compared to $2,112 or 24.3% of income before income taxes for the three months ended March 31, 2009. The U.S. statutory income tax rate of 35% was decreased to the effective tax rate due to the fact that D&P Acquisitions, LLC and many of its subsidiaries operate as limited liability companies or other flow-through entities which are not subject to federal income tax. This operating structure results in a rate benefit because a portion of the Company’s earnings are not subject to corporate level taxes. This favorable impact is partially offset by an increase due to state and local taxes, the effect of permanent differences and foreign taxes. The increase in the provision for income taxes as a percentage of income before income taxes resulted primarily from a decrease in the rate benefit from operating as an LLC, due to an increase in Duff & Phelps Corporation’s ownership of D&P Acquisitions, LLC.
Net Income Attributable to the Noncontrolling Interest
Net income attributable to the noncontrolling interest represents the portion of net income or loss before income taxes attributable to the ownership interest in D&P Acquisitions held by the existing unitholders to the extent the book value of their interest in D&P Acquisitions is greater than zero. This interest totaled 31.1% and 56.8% at March 31, 2010 and 2009, respectively.
Segment Results – Three months ended March 31, 2010 versus three months ended March 31, 2009
The following table sets forth selected segment operating results:
Results of Operations by Segment
| | | Three Months Ended | | | | | | | |
| | | March 31, | | | March 31, | | | Unit | | | Percent | |
| | | 2010 | | | 2009 | | | Change | | | Change | |
| Financial Advisory | | | | | | | | | | | | |
| Revenues (excluding reimbursables) | | $ | 53,882 | | | $ | 60,891 | | | $ | (7,009 | ) | | | (11.5 | )% |
| Segment operating income | | $ | 7,538 | | | $ | 10,349 | | | $ | (2,811 | ) | | | (27.2 | )% |
| Segment operating income margin | | | 14.0 | % | | | 17.0 | % | | | (3.0 | )% | | | (17.7 | )% |
| | | | | | | | | | | | | | | | | |
| Corporate Finance Consulting | | | | | | | | | | | | | | | | |
| Revenues (excluding reimbursables) | | $ | 14,936 | | | $ | 14,616 | | | $ | 320 | | | | 2.2 | % |
| Segment operating income | | $ | 2,982 | | | $ | 3,252 | | | $ | (270 | ) | | | (8.3 | )% |
| Segment operating income margin | | | 20.0 | % | | | 22.2 | % | | | (2.2 | )% | | | (9.9 | )% |
| | | | | | | | | | | | | | | | | |
| Investment Banking | | | | | | | | | | | | | | | | |
| Revenues (excluding reimbursables) | | $ | 20,346 | | | $ | 13,758 | | | $ | 6,588 | | | | 47.9 | % |
| Segment operating income | | $ | 5,057 | | | $ | 1,543 | | | $ | 3,514 | | | | 227.7 | % |
| Segment operating income margin | | | 24.9 | % | | | 11.2 | % | | | 13.7 | % | | | 121.4 | % |
| | | | | | | | | | | | | | | | | |
| Total | | | | | | | | | | | | | | | | |
| Revenues (excluding reimbursables) | | $ | 89,164 | | | $ | 89,265 | | | | | | | | | |
| | | | | | | | | | | | | | | | | |
| Segment operating income | | $ | 15,577 | | | $ | 15,144 | | | | | | | | | |
| Net client reimbursable expenses | | | (56 | ) | | | 22 | | | | | | | | | |
| Equity-based compensation from | | | | | | | | | | | | | | | | |
| Legacy Units and IPO Options | | | (1,083 | ) | | | (3,253 | ) | | | | | | | | |
| Depreciation and amortization | | | (2,493 | ) | | | (2,562 | ) | | | | | | | | |
| Charge from impairment of certain intangible assets | | | (674 | ) | | | | | | | | | | | | |
| Operating income | | $ | 11,271 | | | $ | 9,351 | | | | | | | | | |
| Average Client Service Professionals | | | | | | | | | | | | | | | | |
| Financial Advisory | | | 607 | | | | 700 | | | | (93 | ) | | | (13.3 | )% |
| Corporate Finance Consulting | | | 124 | | | | 131 | | | | (7 | ) | | | (5.3 | )% |
| Investment Banking | | | 131 | | | | 136 | | | | (5 | ) | | | (3.7 | )% |
| Total | | | 862 | | | | 967 | | | | (105 | ) | | | (10.9 | )% |
| | | | | | | | | | | | | | | | | |
| End of Period Client Service Professionals | | | | | | | | | | | | | | | | |
| Financial Advisory | | | 585 | | | | 681 | | | | (96 | ) | | | (14.1 | )% |
| Corporate Finance Consulting | | | 117 | | | | 130 | | | | (13 | ) | | | (10.0 | )% |
| Investment Banking | | | 128 | | | | 137 | | | | (9 | ) | | | (6.6 | )% |
| Total | | | 830 | | | | 948 | | | | (118 | ) | | | (12.4 | )% |
| | | | | | | | | | | | | | | | | |
| Revenue per Client Service Professional | | | | | | | | | | | | | | | | |
| Financial Advisory | | $ | 89 | | | $ | 87 | | | $ | 2 | | | | 2.3 | % |
| Corporate Finance Consulting | | $ | 120 | | | $ | 112 | | | $ | 8 | | | | 7.1 | % |
| Investment Banking | | $ | 155 | | | $ | 101 | | | $ | 54 | | | | 53.5 | % |
| Total | | $ | 103 | | | $ | 92 | | | $ | 11 | | | | 12.0 | % |
Results of Operations by Segment – Continued
| | | Three Months Ended | | | | | | | |
| | | March 31, | | | March 31, | | | Unit | | | Percent | |
| | | 2010 | | | 2009 | | | Change | | | Change | |
Utilization(1) | | | | | | | | | | | | |
| Financial Advisory | | | 65.3 | % | | | 67.1 | % | | | -1.8 | % | | | (2.7 | )% |
| Corporate Finance Consulting | | | 58.3 | % | | | 55.6 | % | | | 2.7 | % | | | 4.9 | % |
| | | | | | | | | | | | | | | | | |
Rate-Per-Hour(2) | | | | | | | | | | | | | | | | |
| Financial Advisory | | $ | 328 | | | $ | 306 | | | $ | 22 | | | | 7.2 | % |
| Corporate Finance Consulting | | $ | 465 | | | $ | 428 | | | $ | 37 | | | | 8.6 | % |
| | | | | | | | | | | | | | | | | |
|
| Revenues (excluding reimbursables) | | | | | | | | | | | | | | | | |
| Financial Advisory | | $ | 53,882 | | | $ | 60,891 | | | $ | (7,009 | ) | | | (11.5 | )% |
| Corporate Finance Consulting | | | 14,936 | | | | 14,616 | | | | 320 | | | | 2.2 | % |
| Investment Banking | | | 20,346 | | | | 13,758 | | | | 6,588 | | | | 47.9 | % |
| Total | | $ | 89,164 | | | $ | 89,265 | | | $ | (101 | ) | | | (0.1 | )% |
| Average Number of Managing Directors | | | | | | | | | | | | | | | | |
| Financial Advisory | | | 91 | | | | 101 | | | | (10 | ) | | | (9.9 | )% |
| Corporate Finance Consulting | | | 32 | | | | 30 | | | | 2 | | | | 6.7 | % |
| Investment Banking | | | 40 | | | | 36 | | | | 4 | | | | 11.1 | % |
| Total | | | 163 | | | | 167 | | | | (4 | ) | | | (2.4 | )% |
| | | | | | | | | | | | | | | | | |
| End of Period Managing Directors | | | | | | | | | | | | | | | | |
| Financial Advisory | | | 88 | | | | 101 | | | | (13 | ) | | | (12.9 | )% |
| Corporate Finance Consulting | | | 31 | | | | 30 | | | | 1 | | | | 3.3 | % |
| Investment Banking | | | 39 | | | | 38 | | | | 1 | | | | 2.6 | % |
| Total | | | 158 | | | | 169 | | | | (11 | ) | | | (6.5 | )% |
| | | | | | | | | | | | | | | | | |
| Revenue per Managing Director | | | | | | | | | | | | | | | | |
| Financial Advisory | | $ | 592 | | | $ | 603 | | | $ | (11 | ) | | | (1.8 | )% |
| Corporate Finance Consulting | | $ | 467 | | | $ | 487 | | | $ | (20 | ) | | | (4.1 | )% |
| Investment Banking | | $ | 509 | | | $ | 382 | | | $ | 127 | | | | 33.2 | % |
| Total | | $ | 547 | | | $ | 535 | | | $ | 12 | | | | 2.2 | % |
| (1) | The utilization rate for any given period is calculated by dividing the number of hours incurred by client service professionals who worked on client assignments (including internal projects for the Company) during the period by the total available working hours for all of such client service professionals during the same period, assuming a 40 hour work week, less paid holidays and vacation days. Financial Advisory utilization excludes approximately 60 client service professionals associated with Rash & Associates, L.P. (“Rash”), a wholly-owned subsidiary, due to the nature of the work performed. |
| (2) | Average billing rate-per-hour is calculated by dividing applicable revenues for the period by the number of hours worked on client assignments (including internal projects for the Company) during the same period. Financial Advisory revenues used to calculate rate-per-hour exclude approximately $1,583 and $1,892 of revenues associated with Rash in the three months ended March 31, 2010 and 2009, respectively. |
For segment reporting purposes, management uses certain estimates and assumptions to allocate revenues and expenses. Revenues and expenses attributable to reportable segments are generally based on which segment and product line a client service professional is a dedicated member. As a result, revenues recognized that relate to the cross utilization of client service professionals across reportable segments occur each period depending on the expertise required for each engagement. In particular, the Financial Advisory segment (primarily Valuation Advisory services) recognized revenues of $2,945 and $4,322 from the cross utilization of its client service professionals on engagements from the Corporate Finance Consulting segment (primarily Portfolio Valuation services) in the three months ended March 31, 2010 and 2009, respectively.
Financial Advisory
Revenues
Revenues from the Financial Advisory segment decreased $7,009 or 11.5% to $53,882 for the three months ended March 31, 2010, compared to $60,891 for the three months ended March 31, 2009. The overall decline resulted from a decrease in revenues from each business unit, as summarized in the following table:
| | | Three Months | | | | | | | |
| | | March 31, | | | March 31, | | | Dollar | | | Percent | |
| | | 2010 | | | 2009 | | | Change | | | Change | |
| Financial Advisory | | | | | | | | | | | | |
| Valuation Advisory | | $ | 35,020 | | | $ | 40,370 | | | $ | (5,350 | ) | | | (13.3 | )% |
| Tax Services | | | 9,447 | | | | 10,878 | | | | (1,431 | ) | | | (13.2 | )% |
| Dispute & Legal Management Consulting | | | 9,415 | | | | 9,643 | | | | (228 | ) | | | (2.4 | )% |
| | | $ | 53,882 | | | $ | 60,891 | | | $ | (7,009 | ) | | | (11.5 | )% |
Our Financial Advisory segment was impacted by lower revenues from valuation advisory and to a lesser extent tax services. Services within valuation advisory were impacted by a reduction of goodwill impairment testing due to improvement in the overall economic environment and a lower volume of real estate valuation activity, partially offset by an increase in revenues from purchase price allocations from an increase in M&A activity. The decrease in revenues from tax services primarily resulted from lower revenues from transactional tax and tax compliance due to the departure of staff principally affiliated with our acquisition of WTS in July 2008.
Dispute and legal management consulting includes revenues from an engagement to serve as a financial advisor to the court appointed examiner of a large financial services company under bankruptcy protection. This engagement wound down during the first quarter of 2010. Our results for the first quarter of 2010 include approximately $5,500 of revenue from this assignment, primarily recognized in the Financial Advisory and Corporate Finance Consulting segments. We expect approximately $3,700 of deferred revenues related to the court-mandated holdbacks to be recognized hereafter (primarily between the Financial Advisory and Corporate Finance Consulting segments), as and if approved by the bankruptcy court or its fee examiner.
Segment Operating Income
Financial Advisory segment operating income decreased $2,811 or 27.2% to $7,538 for the three months ended March 31, 2010, compared to $10,349 for the three months ended March 31, 2009. Segment operating income margin, defined as segment operating income expressed as a percentage of segment revenues, was 14.0% for the three months ended March 31, 2010, compared to 17.0% for the three months ended March 31, 2009. Despite a decrease in expenses, segment operating income and margin decreased as a result of lower revenues which led to a corresponding increase in direct client service costs as a percentage of revenues.
Corporate Finance Consulting
Revenues
Revenues from the Corporate Finance Consulting segment increased $320 or 2.2% to $14,936 for the three months ended March 31, 2010, compared to $14,616 for the three months ended March 31, 2009. Growth was primarily driven by demand for services related to due diligence, partially offset by a decrease in revenues from portfolio valuation, financial engineering and strategic value advisory on a combined basis, as summarized in the following table:
| | | Three Months Ended | | | | | | | |
| | | March 31, | | | March 31, | | | Dollar | | | Percent | |
| | | 2010 | | | 2009 | | | Change | | | Change | |
| Corporate Finance Consulting | | | | | | | | | | | | |
| Portfolio Valuation | | $ | 5,482 | | | $ | 6,295 | | | $ | (813 | ) | | | (12.9 | )% |
| Financial Engineering | | | 4,126 | | | | 4,148 | | | | (22 | ) | | | (0.5 | )% |
| Strategic Value Advisory | | | 3,158 | | | | 2,620 | | | | 538 | | | | 20.5 | % |
| Due Diligence | | | 2,170 | | | | 1,553 | | | | 617 | | | | 39.7 | % |
| | | $ | 14,936 | | | $ | 14,616 | | | $ | 320 | | | | 2.2 | % |
Revenues from portfolio valuation decreased from the timing of workflow on several key engagements. Due diligence benefited from an increase in M&A activity.
Segment Operating Income
Operating income from the Corporate Finance Consulting segment decreased $270 or 8.3% to $2,982 for the three months ended March 31, 2010, compared to $3,252 for the three months ended March 31, 2009. Segment operating income margin was 20.0% for the three months ended March 31, 2010, compared to 22.2% for the three months ended March 31, 2009. The decrease in segment operating income and margin primarily resulted from an increase in direct client service costs as a percentage of revenues, principally from higher equity-compensation expense from incremental grants of Ongoing RSAs.
Investment Banking
Revenues
Revenues from the Investment Banking segment increased $6,588 or 47.9% to $20,346 for the three months ended March 31, 2010, compared to $13,758 for the three months ended March 31, 2009, as summarized in the following table:
| | | Three Months Ended | | | | |
| | | March 31, | | | March 31, | | | Dollar | | | Percent | |
| | | 2010 | | | 2009 | | | Change | | | Change | |
| Investment Banking | | | | | | | | | | | | |
| Global Restructuring Advisory | | $ | 9,841 | | | $ | 5,578 | | | $ | 4,263 | | | | 76.4 | % |
| Transaction Opinions | | | 6,823 | | | | 6,101 | | | | 722 | | | | 11.8 | % |
| M&A Advisory | | | 3,682 | | | | 2,079 | | | | 1,603 | | | | 77.1 | % |
| | | $ | 20,346 | | | $ | 13,758 | | | $ | 6,588 | | | | 47.9 | % |
Global restructuring advisory benefited from an increase in demand for our domestic and international restructuring services. Revenues from M&A advisory and transaction opinions increased as a result of a higher level of transactional activity.
Segment Operating Income
Operating income from the Investment Banking segment increased $3,514 or 227.7% to $5,057 for the three months ended March 31, 2010, compared to $1,543 for the three months ended March 31, 2009. ��Operating income margin was 24.9% for the three months ended March 31, 2010, compared to 11.2% for the three months ended March 31, 2009. The increase in segment operating income and margin resulted from higher revenues driven in part by additional success fees.
Liquidity and Capital Resources
Our primary sources of liquidity are our existing cash balances and availability under our revolving credit facility. Our historical cash flows are primarily related to the timing of (i) cash receipt of revenues, (ii) payment of base compensation, benefits and operating expenses, (iii) the timing of payment of bonuses to employees, (iv) distributions and other payments to noncontrolling unitholders, (v) corporate tax payments by the Company, (vi) dividends to the extent declared by the board of directors and (vii) funding of our deferred compensation program.
Cash and cash equivalents decreased by $17,332 to $89,979 at March 31, 2010, compared to $107,311 at December 31, 2009. The decrease in cash primarily resulted from $6,493 used in operating activities, $4,974 used in investing activities and $4,339 used in financing activities.
Operating Activities
During the three months ended March 31, 2010, cash of $6,493 was used in operating activities, compared to $13,541 used in the corresponding prior period. The decrease of amounts used in operating activities primarily resulted from (i) an increase in amounts used by accounts payable and accrued expenses, (ii) a decrease in amounts used by unbilled services and (iii) an increase in deferred tax assets.
Investing Activities
During the three months ended March 31, 2010, cash of $4,974 was used in investing activities, compared to $7,792 used in the corresponding prior period. Investing activities during the current period included (i) purchases of property and equipment to support our business, (ii) payments of earn-outs for acquisitions which primarily consisted of an earn-out payment to the sellers of Financial and IP Analysis, Inc. (d/b/a The Lumin Expert Group), and (iii) purchases of investments related to the Company’s deferred compensation plan. Management believes these investments pose limited liquidity risk.
Financing Activities
During the three months ended March 31, 2010, cash of $4,339 was used in financing activities, compared to $9,568 used in the prior year period. Significant financing activities are summarized as follows:
| | · | Distributions and other payments to noncontrolling unitholders – Distributions and other payments to noncontrolling unitholders are summarized as follows: |
| | Three Months Ended | |
| | March 31, | | March 31, | |
| | 2010 | | 2009 | |
| Distributions for taxes | | $ | 608 | | | $ | 8,847 | |
| Other distributions | | | 735 | | | | - | |
Payments pursuant to the Tax Receivable Agreement | | | - | | | | - | |
| | | $ | 1,343 | | | $ | 8,847 | |
Distributions for taxes
As a limited liability company, D&P Acquisitions does not incur significant federal or state and local taxes, as these taxes are primarily the obligations of the members of D&P Acquisitions. As authorized by the Third Amended and Restated LLC Agreement of D&P Acquisitions, D&P Acquisitions is required to distribute cash, generally, on a pro rata basis, to its members to the extent necessary to provide funds to pay the members' tax liabilities, if any, with respect to the earnings of D&P Acquisitions. The tax distribution rate has been set at 45% of each member’s allocable share of taxable income of D&P Acquisitions. D&P Acquisitions is only required to make such distributions if cash is available for such purposes as determined by the Company. The Company expects cash will be available to make these distributions. Upon completion of its tax returns with respect to the prior year, D&P Acquisitions may make true-up distributions to its members, if cash is available for such purposes, with respect to actual taxable income for the prior year. The decrease in tax distributions between periods primarily resulted from the timing of quarterly payments. During the three months ended March 31, 2009, the estimated distributions represent each member’s estimated tax liability from taxable income of D&P acquisitions during the fourth quarter of 2008. The corresponding distribution to members for taxable income of D&P acquisitions during the fourth quarter of 2009 was primarily made during the three months ended December 31, 2009.
Other distributions
During the three months ended March 31, 2010, the Company distributed $735 to holders of New Class A Units, other than Duff & Phelps Corporation. Concurrent with the payment of the dividend to shareholders of record on March 16, 2010, holders of New Class A Units received a $0.05 distribution per vested unit. This amount totaled $573 and will be treated as a reduction in basis of each member’s ownership interests. Pursuant to the terms of the Third Amended and Restated LLC Agreement of D&P Acquisitions, an amount of $0.05 per unvested unit was deposited into a segregated account and will be distributed once a year with respect to units that vested during that year. During the three months ended March 31, 2010, the Company distributed $162 to members whose units vested during 2009. Any amounts related to unvested units that forfeit are returned to the Company.
Payments pursuant to the Tax Receivable Agreement
As a result of the Company’s acquisition of New Class A Units of D&P Acquisitions, the Company expects to benefit from depreciation and other tax deductions reflecting D&P Acquisitions' tax basis for its assets. Those deductions will be allocated to the Company and will be taken into account in reporting the Company’s taxable income. Further, as a result of a federal income tax election made by D&P Acquisitions applicable to a portion of the Company’s acquisition of New Class A Units of D&P Acquisitions, the income tax basis of the assets of D&P Acquisitions underlying a portion of the units the Company has and will acquire (pursuant to the exchange agreement) will be adjusted based upon the amount that the Company has paid for that portion of its New Class A Units of D&P Acquisitions.
The Company has entered into a tax receivable agreement (“TRA”) with the existing unitholders of D&P Acquisitions (for the benefit of the existing unitholders of D&P Acquisitions) that provides for the payment by the Company to the unitholders of D&P Acquisitions of 85% of the amount of cash savings, if any, in U.S. federal, state and local income tax that the Company realizes (i) from the tax basis in its proportionate share of D&P Acquisitions' goodwill and similar intangible assets that the Company receives as a result of the exchanges and (ii) from the federal income tax election referred to above. D&P Acquisitions expects to make future payments under the TRA to the extent cash is available for such purposes.
As of March 31, 2010, the Company recorded a liability of $105,560, representing the payments due to D&P Acquisitions’ unitholders under the TRA (see current and non-current portion of “Due to noncontrolling unitholders” on the Company’s Condensed Consolidated Balance Sheets).
Within the next 12 month period, the Company expects to pay $4,303 of the total amount. The basis for determining the current portion of the payments due to D&P Acquisitions’ unitholders under the TRA is the expected amount of payments to be made within the next 12 months. The long-term portion of the payments due to D&P Acquisitions’ unitholders under the tax receivable agreement is the remainder. Payments are anticipated to be made annually over 15 years, commencing from the date of each event that gives rise to the TRA benefits, beginning with the date of the closing of the IPO on October 3, 2007. The payments are made in accordance with the terms of the TRA. The timing of the payments is subject to certain contingencies including Duff & Phelps Corporation having sufficient taxable income to utilize all of the tax benefits defined in the TRA.
To determine the current amount of the payments due to D&P Acquisitions’ unitholders under the TRA, the Company estimated the amount of taxable income that Duff & Phelps Corporation has generated over the previous fiscal year. Next, the Company estimated the amount of the specified TRA deductions at year end. This was used as a basis for determining the amount of tax reduction that generates a TRA obligation. In turn, this was used to calculate the estimated payments due under the TRA that the Company expects to pay in the next 12 months. These calculations are performed pursuant to the terms of the TRA.
Obligations pursuant to the TRA are obligations of Duff & Phelps Corporation. They do not impact the noncontrolling interest. These obligations are not income tax obligations and have no impact on the tax provision or the allocation of taxes. Furthermore, the TRA has no impact on the allocation of the provision for income taxes to the Company’s net income. In general, items of income and expense are allocated on the basis of member’s ownership interests pursuant to the Third Amended and Restated Limited Liability Company Agreement of Duff & Phelps Acquisitions, LLC.
| | · | Dividends – Cash dividends of $1,403 reflects the payment of quarterly cash dividends of $0.05 per share of our Class A common stock to holders of record as of March 16, 2010. |
| | · | Repurchases of Class A common stock – Repurchases of Class A common stock represents shares of Class A common stock withheld to cover payroll tax withholdings related to the lapse of restrictions on Ongoing RSAs. These shares were not part of a publicly announced repurchase program. |
Credit Facility
On July 15, 2009, Duff & Phelps, LLC entered into a credit agreement with Bank of America, N.A., as administrative agent and the lenders from time to time party thereto ("Credit Agreement"), providing for a $30,000 senior secured revolving credit facility (“Credit Facility”), including a $10,000 sub-limit for the issuance of letters of credit. The proceeds of the facility are permitted to be used for working capital, permitted acquisitions and general corporate purposes. The maturity date is July 15, 2012 and amounts borrowed may be voluntarily prepaid at any time without penalty or premium, subject to customary breakage costs. There were no amounts outstanding under the Credit Facility at March 31, 2010 or through the filing date of this Quarterly Report on Form 10-Q. As of March 31, 2010, the Company had $4,237 of outstanding letters of credit of which $3,810 were issued against the Credit Facility. There was $427 of cash deposited into a restricted account to serve as deposits to secure the remaining letters of credit. These letters of credit were issued in connection with real estate leases.
Loans under the Credit Facility will, at the Company's option, bear interest on the principal amount outstanding at either (a) a rate equal to LIBOR, plus an applicable margin or (b) a base rate, plus an applicable margin. The applicable margin rate will be based on the Company's most recent consolidated leverage ratio and ranges from 1.75% to 2.50% per annum depending on the Company's consolidated leverage ratio. In addition, the Company is required to pay an unused commitment fee on the actual daily amount of the unutilized portion of the commitments of the lenders at a rate ranging from 0.25% to 0.50% per annum, based on the Company's most recent consolidated leverage ratio. Based on the Company’s consolidated leverage ratio at March 31, 2010, the Company qualified for the 1.75% applicable margin and 0.25% unused commitment fee.
The Credit Agreement contains customary representations and warranties and customary affirmative and negative covenants, including, among others, limitations on (a) the incurrence of liens, (b) the incurrence of indebtedness, (c) the ability to make dividends and distributions, as well as redeem and repurchase equity interests, and (d) acquisitions, mergers, consolidations and sales of assets. In addition, the Credit Agreement contains financial covenants that do not permit (a) a total leverage ratio of greater than 2.75 to 1.00 until the quarter ending September 30, 2010, and 2.50 to 1.00 thereafter and (b) a consolidated fixed charge coverage ratio of less than 2.00 to 1.00. The financial covenants are tested on the last day of each fiscal quarter based on the last four fiscal quarter periods. Management believes that the Company was in compliance with all of its covenants as of March 31, 2010. The Credit Agreement permits dividend payments or other distributions in the Company’s common stock or other equity interests subject to certain limitations.
The obligation of the Company to pay amounts outstanding under the Credit Facility may be accelerated upon the occurrence of an "Event of Default" as defined in the Credit Agreement. The Company's obligations under the Credit Agreement are guaranteed by D&P Acquisitions, and certain domestic subsidiaries of the Company (collectively, the "Guarantors"). The Credit Agreement is secured by a lien on substantially all of the personal property of the Company and each of the Guarantors.
Future Needs
Our primary financing need has been to fund our growth. Our growth strategy includes hiring additional revenue-generating client service professionals and expanding our service offerings through existing client service professionals, new hires or acquisitions of new businesses. We intend to fund such growth over the next twelve months with cash on-hand, funds generated from operations and borrowings under our revolving credit agreement. We believe these funds will be adequate to fund future growth.
In October 2009, the Financial Accounting Standards Board (“FASB”) issued Accounting Standards Update (“ASU”) No. 2009-13, Multiple-Deliverable Revenue Arrangements. ASU 2009-13 supersedes certain guidance in FASB Accounting Standards Codification (“ASC”) 605-25, Revenue Recognition – Multiple-Element Arrangements and requires an entity to allocate arrangement consideration at the inception of an arrangement to all of its deliverables based on their relative selling prices (the relative-selling-price method). ASU 2009-13 eliminates the use of the residual method of allocation in which the undelivered element is measured at its estimated selling price and the delivered element is measured as the residual of the arrangement consideration, and requires the relative-selling-price method in all circumstances in which an entity recognizes revenue for an arrangement with multiple deliverable subject to ASU 2009-13. ASU 2009-13 must be adopted no later than the beginning of the first fiscal year beginning on or after June 15, 2010, with early adoption permitted through either prospective application for revenue arrangements entered into, or materially modified, after the effective date or through retrospective application to all revenue arrangements for all periods presented. We are currently evaluating the impact that the adoption of ASU 2009-13 will have on our consolidated financial statements.
| Item 3. | Quantitative and Qualitative Disclosures About Market Risk. |
Market risks at March 31, 2010 have not changed significantly from those discussed in Item 7A of our Annual Report on Form 10-K for the year ended December 31, 2009.
| Item 4. | Controls and Procedures. |
Disclosure Controls and Procedures
Our management, including our Chief Executive Officer and Chief Financial Officer, evaluated the effectiveness of our disclosure controls and procedures pursuant to Rule 13a-15 under the Exchange Act as of the end of the period covered by this report. Based on that evaluation, our Chief Executive Officer and Chief Financial Officer have concluded that, as of the end of the period covered by this quarterly report, our disclosure controls and procedures (as defined in Rule 13a-15(e) under the Exchange Act) are effective, in all material respects, to ensure that information we are required to disclose in reports that we file or submit under the Exchange Act is recorded, processed, summarized and reported within the time periods specified in SEC rules and forms, and that such information is accumulated and communicated to our management, including our Chief Executive Officer and Chief Financial Officer, as appropriate, to allow timely decisions regarding required disclosure.
The effectiveness of our disclosure controls and procedures and our internal control over financial reporting is subject to various inherent limitations, including cost limitations, judgments used in decision making, assumptions about the likelihood of future events, the soundness of our systems, the possibility of human error, and the risk of fraud. Moreover, projections of any evaluation of effectiveness of future periods are subject to the risk that controls may become inadequate because of changes in conditions and the risk that the degree of compliance with policies or procedures may deteriorate over time. Because of these limitations, there can be no assurance that any system of disclosure controls and procedures or internal control over financial reporting will be successful in preventing all errors or fraud or in making all material information known in a timely manner to the appropriate levels of management.
Changes in Internal Controls
No change in our internal control over financial reporting (as defined in Rule 13a-15(f) under the Exchange Act) occurred during our most recent fiscal quarter that has materially affected, or is likely to materially affect, our internal control over financial reporting.
PART II
| Item 1. | Legal Proceedings. |
From time to time, we are involved in legal proceedings and litigation arising in the ordinary course of business. As of the date of this filing, we are not a party to or threatened with any litigation or other legal proceeding that, in our opinion, could have a material adverse effect on our business, operating results or financial condition.
There have been no material changes in the Company’s risk factors since those published in the Company’s Annual Report on Form 10-K for the year ended December 31, 2009.
| Item 2. | Unregistered Sales of Equity Securities and Use of Proceeds. |
Issuer Purchases of Equity Securities
During the first quarter of 2010, we withheld shares of our Class A common stock from holders of restricted stock awards to satisfy the holders’ tax liabilities in connection with the lapse of restrictions on such shares, as summarized in the following table:
| | | Total | | | | |
| | | Number of | | | Average | |
| | | Shares | | | Price Paid | |
| Class A Common Stock | | Purchased | | | Per Share | |
| January 1 through January 31, 2010 | | | - | | | | - | |
| February 1 through February 28, 2010 | | | 34 | | | $ | 16.68 | |
| March 1 through March 31, 2010 | | | 60 | | | | 17.40 | |
| Total | | | 94 | | | $ | 17.14 | |
The total number of shares purchased represents shares of Class A common stock withheld to cover payroll tax withholdings related to the lapse of restrictions on Ongoing RSAs. These shares were not part of a publicly announced repurchase program and were retired upon purchase.
Exchange of New Class A Units to Shares of Class A Common Stock
In connection with the closing of the IPO, we entered into an exchange agreement, dated as of October 3, 2007 (as amended, the “Exchange Agreement”), by and among us, D&P Acquisitions, and certain unitholders of D&P Acquisitions, through which we may issue shares of Class A common stock upon the exchange of the New Class A Units. Pursuant to the Exchange Agreement, in connection with any such exchange, a corresponding number of shares of our Class B common stock will be cancelled. Subject to the terms and notice requirements as set forth in an amendment to the Exchange Agreement, exchanges are scheduled to occur on March 5th, May 15th, August 15th and November 15th of each year.
In March 2010, 22 New Class A Units were exchanged for 22 shares of Class A common stock and 22 shares of Class B common stock were cancelled. We filed a registration statement in order to permit the resale of these shares from time to time, subject to certain blackouts and other restrictions. We received no other consideration in connection with these exchanges.
| Item 3. | Defaults Upon Senior Securities. |
| Item 4. | (Removed and Reserved). |
| Item 5. | Other Information. |
None.
| Exhibit | | |
| Number | | Description |
| | | |
| 31.1 | | Certification of the Chief Executive Officer, pursuant to Rule 13a-14(a)/15d-14(a), as adopted pursuant to Section 302 of the Sarbanes-Oxley Act of 2002. |
| | | |
| 31.2 | | Certification of the Chief Financial Officer, pursuant to Rule 13a-14(a)/15d-14(a), as adopted pursuant to Section 302 of the Sarbanes-Oxley Act of 2002. |
| | | |
| 32.1 | | Certification of the Chief Executive Officer, pursuant to 18 U.S.C. Section 1350, as adopted pursuant to Section 906 of the Sarbanes-Oxley Act of 2002. |
| | | |
| 32.2 | | Certification of the Chief Financial Officer, pursuant to 18 U.S.C. Section 1350, as adopted pursuant to Section 906 of the Sarbanes-Oxley Act of 2002. |
SIGNATURES
Pursuant to the requirements of the Securities Exchange Act of 1934, the registrant has duly caused this report to be signed on its behalf by the undersigned thereunto duly authorized.
| | DUFF & PHELPS CORPORATION | |
| | (Registrant) | |
| | | |
| Date: April 29, 2010 | /s/ Jacob L. Silverman | |
| | JACOB L. SILVERMAN | |
| | Chief Financial Officer | |