UNITED STATES SECURITIES AND EXCHANGE COMMISSION
Washington, D.C. 20549
Form 10-Q
(Mark One)
| | | |
| þ | | QUARTERLY REPORT PURSUANT TO SECTION 13 OR 15(d) OF THE SECURITIES EXCHANGE
ACT OF 1934 |
For the quarterly period ended June 30, 2011
or
| | | |
| o | | TRANSITION REPORT PURSUANT TO SECTION 13 OR 15(d) OF THE SECURITIES EXCHANGE
ACT OF 1934 |
For the transition period from to
Commission File Number: 001-34963
LPL Investment Holdings Inc.
(Exact name of registrant as specified in its charter)
| | | |
|
| Delaware | | 20-3717839 |
| (State or other jurisdiction of | | (I.R.S. Employer |
| incorporation or organization) | | Identification No.) |
One Beacon Street, Boston, MA 02108
(Address of Principal Executive Offices) (Zip Code)
(617) 423-3644
(Registrant’s telephone number, including area code)
Indicate by check mark whether the registrant (1) has filed all reports required to be filed by Section 13 or 15(d) of the Securities Exchange Act of 1934 during the preceding 12 months (or for such shorter period that the registrant was required to file such reports), and (2) has been subject to such filing requirements for the past 90 days.þ Yes o No
Indicate by check mark whether the registrant has submitted electronically and posted on its corporate Web site, if any, every Interactive Data File required to be submitted and posted pursuant to Rule 405 of Regulation S-T (§ 232.405 of this chapter) during the preceding 12 months (or for such shorter period that the registrant was required to submit and post such files).
þ Yes o No
Indicate by check mark whether the registrant is a large accelerated filer, an accelerated filer, a non-accelerated filer, or a smaller reporting company. See the definitions of “large accelerated filer,” “accelerated filer” and “smaller reporting company” in Rule 12b-2 of the Exchange Act. (Check one):
| | | | | | |
| | | | | | | |
| Large accelerated filero | | Accelerated filero | | Non-accelerated filerþ | | Smaller reporting companyo |
| | | | | (Do not check if a smaller reporting company) | | |
Indicate by check mark whether the registrant is a shell company (as defined in Rule 12b-2 of the Exchange Act).
o Yes þ No
The number of shares of Common Stock, par value $0.001 per share, outstanding as of July 26, 2011 was 107,828,819.
WHERE YOU CAN FIND MORE INFORMATION
We are required to file annual, quarterly and current reports and other information required by the Securities Exchange Act of 1934, as amended (the “Exchange Act”), with the Securities and Exchange Commission, or SEC. You may read and copy any document we file with the SEC at the SEC’s public reference room located at 100 F Street, N.E., Washington, D.C. 20549, U.S.A. Please call the SEC at 1-800-SEC-0330 for further information on the public reference room. Our SEC filings are also available to the public from the SEC’s internet site athttp://www.sec.gov.
On our internet website,http://www.lpl.com, we post the following recent filings as soon as reasonably practicable after they are electronically filed with or furnished to the SEC: our annual reports on Form 10-K, our quarterly reports on Form 10-Q, our current reports on Form 8-K, and any amendments to those reports filed or furnished pursuant to Section 13(a) or 15(d) of the Exchange Act. Hard copies of all such filings are available free of charge by request via email (investor.relations@lpl.com), telephone (617) 897-4574, or mail (LPL Financial Investor Relations at One Beacon Street, 22nd Floor, Boston, MA 02108). The information contained or incorporated on our website is not a part of this Quarterly Report on Form 10-Q.
When we use the terms “LPLIH”, “we”, “us”, “our”, and the “Company” we mean LPL Investment Holdings Inc., a Delaware corporation, and its consolidated subsidiaries, taken as a whole, unless the context otherwise indicates.
SPECIAL NOTE REGARDING FORWARD-LOOKING STATEMENTS
Item 2 — “Management’s Discussion and Analysis of Financial Condition and Results of Operations” and other sections of this Quarterly Report on Form 10-Q contain forward-looking statements (regarding future financial position, budgets, business strategy, projected costs, plans, objectives of management for future operations, and other similar matters) that involve risks and uncertainties. Forward-looking statements can be identified by words such as “anticipates”, “expects”, “believes”, “plans”, “predicts”, and similar terms. Forward-looking statements are not guarantees of future performance and there are important factors that could cause our actual results, level of activity, performance or achievements to differ materially from the results, level of activity, performance or achievements expressed or implied by the forward-looking statements including, but not limited to, changes in general economic and financial market conditions, fluctuations in the value of assets under management, effects of competition in the financial services industry, changes in the number of our financial advisors and institutions and their ability to effectively market financial products and services, the effect of current, pending and future legislation and regulation and regulatory actions. In particular, you should consider the numerous risks outlined in Part I, Item IA— “Risk Factors” in our 2010 Annual Report on Form 10-K filed with the SEC.
Although we believe the expectations reflected in the forward-looking statements are reasonable, we cannot guarantee future results, level of activity, performance or achievements. You should not rely upon forward-looking statements as predictions of future events. Unless required by law, we will not undertake and we specifically disclaim any obligation to release publicly the result of any revisions which may be made to any forward-looking statements to reflect events or circumstances after the date of such statements or to reflect the occurrence of events, whether or not anticipated. In that respect, we wish to caution readers not to place undue reliance on any such forward-looking statements, which speak only as of the date made.
ii
PART I — FINANCIAL INFORMATION
Item 1. Financial Statements
LPL INVESTMENT HOLDINGS INC. AND SUBSIDIARIES
Condensed Consolidated Statements of Operations
(Unaudited)
(Dollars in thousands, except per share data)
| | | | | | | | | | | | | | | | | |
| | | Three Months Ended | | | Six Months Ended | |
| | | June 30, | | | June 30, | |
| | | 2011 | | | 2010 | | | 2011 | | | 2010 | |
| REVENUES: | | | | | | | | | | | | | | | | |
| Commissions | | $ | 459,882 | | | $ | 420,169 | | | $ | 911,759 | | | $ | 809,141 | |
| Advisory fees | | | 264,289 | | | | 215,146 | | | | 508,376 | | | | 421,476 | |
| Asset-based fees | | | 90,504 | | | | 77,436 | | | | 180,327 | | | | 148,886 | |
| Transaction and other fees | | | 68,755 | | | | 68,132 | | | | 142,504 | | | | 135,495 | |
| Interest income, net of operating interest expense | | | 5,110 | | | | 4,906 | | | | 10,252 | | | | 9,777 | |
| Other | | | 5,456 | | | | 4,372 | | | | 14,647 | | | | 8,792 | |
| | | | | | | | | | | | | |
| Net revenues | | | 893,996 | | | | 790,161 | | | | 1,767,865 | | | | 1,533,567 | |
| | | | | | | | | | | | | |
| EXPENSES: | | | | | | | | | | | | | | | | |
| Commissions and advisory fees | | | 624,687 | | | | 547,296 | | | | 1,219,365 | | | | 1,052,158 | |
| Compensation and benefits | | | 81,410 | | | | 74,822 | | | | 165,552 | | | | 148,397 | |
| Promotional | | | 14,789 | | | | 11,294 | | | | 34,325 | | | | 25,644 | |
| Depreciation and amortization | | | 18,407 | | | | 22,110 | | | | 36,572 | | | | 47,700 | |
| Occupancy and equipment | | | 12,394 | | | | 11,745 | | | | 27,919 | | | | 23,763 | |
| Professional services | | | 12,489 | | | | 13,468 | | | | 22,653 | | | | 23,267 | |
| Brokerage, clearing and exchange | | | 9,401 | | | | 9,242 | | | | 19,050 | | | | 17,582 | |
| Communications and data processing | | | 8,906 | | | | 8,290 | | | | 17,588 | | | | 16,816 | |
| Regulatory fees and expenses | | | 6,372 | | | | 6,529 | | | | 12,944 | | | | 12,677 | |
| Travel and entertainment | | | 3,218 | | | | 3,224 | | | | 7,021 | | | | 5,620 | |
| Restructuring charges | | | 4,814 | | | | 4,622 | | | | 5,351 | | | | 8,571 | |
| Other | | | 3,476 | | | | 3,229 | | | | 6,162 | | | | 8,030 | |
| | | | | | | | | | | | | |
| Total operating expenses | | | 800,363 | | | | 715,871 | | | | 1,574,502 | | | | 1,390,225 | |
| Non-operating interest expense | | | 18,154 | | | | 27,683 | | | | 36,326 | | | | 52,019 | |
| Loss on extinguishment of debt | | | — | | | | 37,979 | | | | — | | | | 37,979 | |
| | | | | | | | | | | | | |
| Total expenses | | | 818,517 | | | | 781,533 | | | | 1,610,828 | | | | 1,480,223 | |
| | | | | | | | | | | | | |
| INCOME BEFORE PROVISION FOR INCOME TAXES | | | 75,479 | | | | 8,628 | | | | 157,037 | | | | 53,344 | |
| PROVISION FOR INCOME TAXES | | | 29,972 | | | | 628 | | | | 62,531 | | | | 19,790 | |
| | | | | | | | | | | | | |
| NET INCOME | | $ | 45,507 | | | $ | 8,000 | | | $ | 94,506 | | | $ | 33,554 | |
| | | | | | | | | | | | | |
| EARNINGS PER SHARE (Note 13): | | | | | | | | | | | | | | | | |
| Basic | | $ | 0.41 | | | $ | 0.09 | | | $ | 0.86 | | | $ | 0.38 | |
| | | | | | | | | | | | | |
| Diluted | | $ | 0.40 | | | $ | 0.08 | | | $ | 0.82 | | | $ | 0.33 | |
| | | | | | | | | | | | | |
See notes to unaudited condensed consolidated financial statements.
1
LPL INVESTMENT HOLDINGS INC. AND SUBSIDIARIES
Condensed Consolidated Statements of Financial Condition
(Unaudited)
(Dollars in thousands, except par value)
| | | | | | | | | |
| | | June 30, | | | December 31, | |
| | | 2011 | | | 2010 | |
ASSETS | | | | | | | | |
| Cash and cash equivalents | | $ | 681,471 | | | $ | 419,208 | |
| Cash and securities segregated under federal and other regulations | | | 225,888 | | | | 373,634 | |
| Receivables from: | | | | | | | | |
| Clients, net of allowance of $656 at June 30, 2011 and $655 at December 31, 2010 | | | 288,185 | | | | 271,051 | |
| Product sponsors, broker-dealers and clearing organizations | | | 160,345 | | | | 203,332 | |
| Others, net of allowances of $7,356 at June 30, 2011 and $6,796 at December 31, 2010 | | | 187,285 | | | | 169,391 | |
| Securities owned: | | | | | | | | |
| Trading(1) | | | 9,740 | | | | 9,259 | |
| Held-to-maturity | | | 11,651 | | | | 9,563 | |
| Securities borrowed | | | 11,550 | | | | 8,391 | |
| Income taxes receivable | | | 18,060 | | | | 144,041 | |
| Fixed assets, net of accumulated depreciation and amortization of $292,384 at June 30, 2011 and $276,501 at December 31, 2010 | | | 81,274 | | | | 78,671 | |
| Goodwill | | | 1,329,234 | | | | 1,293,366 | |
| Intangible assets, net of accumulated amortization of $191,949 at June 30, 2011 and $172,726 at December 31, 2010 | | | 558,488 | | | | 560,077 | |
| Debt issuance costs, net of accumulated amortization of $16,652 at June 30, 2011 and $14,106 at December 31, 2010 | | | 21,165 | | | | 23,711 | |
| Other assets | | | 78,453 | | | | 82,472 | |
| | | | | | | |
| Total assets | | $ | 3,662,789 | | | $ | 3,646,167 | |
| | | | | | | |
LIABILITIES AND STOCKHOLDERS’ EQUITY | | | | | | | | |
| LIABILITIES: | | | | | | | | |
| Drafts payable | | $ | 137,787 | | | $ | 182,489 | |
| Payables to clients | | | 414,808 | | | | 383,289 | |
| Payables to broker-dealers and clearing organizations | | | 37,139 | | | | 39,070 | |
| Accrued commissions and advisory fees payable | | | 111,336 | | | | 130,408 | |
| Accounts payable and accrued liabilities | | | 161,676 | | | | 154,586 | |
| Unearned revenue | | | 64,078 | | | | 53,618 | |
| Interest rate swaps | | | 2,836 | | | | 7,281 | |
| Securities sold but not yet purchased — at fair value | | | 4,061 | | | | 4,821 | |
| Senior credit facilities | | | 1,339,653 | | | | 1,386,639 | |
| Deferred income taxes — net | | | 125,959 | | | | 130,211 | |
| | | | | | | |
| Total liabilities | | | 2,399,333 | | | | 2,472,412 | |
| | | | | | | |
| STOCKHOLDERS’ EQUITY: | | | | | | | | |
| Common stock, $.001 par value; 600,000,000 shares authorized; 110,125,404 shares issued at June 30, 2011 and 108,714,757 shares issued and outstanding at December 31, 2010 | | | 110 | | | | 109 | |
| Additional paid-in capital | | | 1,123,739 | | | | 1,051,722 | |
| Treasury stock, at cost — 2,283,854 shares at June 30, 2011 and 0 shares at December 31, 2010 | | | (79,568 | ) | | | — | |
| Accumulated other comprehensive loss | | | (1,751 | ) | | | (4,496 | ) |
| Retained earnings | | | 220,926 | | | | 126,420 | |
| | | | | | | |
| Total stockholders’ equity | | | 1,263,456 | | | | 1,173,755 | |
| | | | | | | |
| Total liabilities and stockholders’ equity | | $ | 3,662,789 | | | $ | 3,646,167 | |
| | | | | | | |
| | |
| (1) Includes $900 and $1,010 pledged to clearing organizations at June 30, 2011 and December 31, 2010, respectively. |
See notes to unaudited condensed consolidated financial statements.
2
LPL INVESTMENT HOLDINGS INC. AND SUBSIDIARIES
Condensed Consolidated Statements of Stockholders’ Equity
(Unaudited)
(Amounts in thousands)
| | | | | | | | | | | | | | | | | | | | | | | | | | | | | | | | | | | | | |
| | | | | | | | | | | | | | | | | | | | | | | | | | | Accumulated | | | | | | | | |
| | | | | | | | | | | Additional | | | | | | | | | | | | | | | Other | | | | | | | Total | |
| | | | Common Stock | | | Paid-In | | | Treasury Stock | | | Stockholder | | | Comprehensive | | | Retained | | | Stockholders’ | |
| | | | Shares | | | Amount | | | Capital | | | Shares | | | Amount | | | Loans | | | Loss | | | Earnings | | | Equity | |
| BALANCE — December 31, 2009 | | | 94,215 | | | $ | 87 | | | $ | 679,277 | | | | — | | | $ | — | | | $ | (499 | ) | | $ | (11,272 | ) | | $ | 183,282 | | | $ | 850,875 | |
| Comprehensive income: | | | | | | | | | | | | | | | | | | | | | | | | | | | | | | | | | | | | |
| Net income | | | | | | | | | | | | | | | | | | | | | | | | | | | | | | | 33,554 | | | | 33,554 | |
| Unrealized gain on interest rate swaps, net of tax expense of $1,761 | | | | | | | | | | | | | | | | | | | | | | | | | | | 4,673 | | | | | | | | 4,673 | |
| | | | | | | | | | | | | | | | | | | | | | | | | | | | | | | | | | | | |
| Total comprehensive income | | | | | | | | | | | | | | | | | | | | | | | | | | | | | | | | | | | 38,227 | |
| Exercise of stock options | | | 26 | | | | | | | | 51 | | | | | | | | | | | | | | | | | | | | | | | | 51 | |
| Excess tax benefits from share-based compensation | | | | | | | | | | | 226 | | | | | | | | | | | | | | | | | | | | | | | | 226 | |
| Stockholder loans | | | | | | | | | | | | | | | | | | | | | | | 448 | | | | | | | | | | | | 448 | |
| Share-based compensation | | | | | | | | | | | 7,568 | | | | | | | | | | | | | | | | | | | | | | | | 7,568 | |
| Issuance of common stock | | | 20 | | | | | | | | 468 | | | | | | | | | | | | | | | | | | | | | | | | 468 | |
| | | | | | | | | | | | | | | | | | | | | | | | | | | | | |
| BALANCE — June 30, 2010 | | | 94,261 | | | $ | 87 | | | $ | 687,590 | | | | — | | | $ | — | | | $ | (51 | ) | | $ | (6,599 | ) | | $ | 216,836 | | | $ | 897,863 | |
| | | | | | | | | | | | | | | | | | | | | | | | | | | | | |
| BALANCE — December 31, 2010 | | | 108,715 | | | $ | 109 | | | $ | 1,051,722 | | | | — | | | $ | — | | | $ | — | | | $ | (4,496 | ) | | $ | 126,420 | | | $ | 1,173,755 | |
| Comprehensive income: | | | | | | | | | | | | | | | | | | | | | | | | | | | | | | | | | | | | |
| Net income | | | | | | | | | | | | | | | | | | | | | | | | | | | | | | | 94,506 | | | | 94,506 | |
| Unrealized gain on interest rate swaps, net of tax expense of $1,700 | | | | | | | | | | | | | | | | | | | | | | | | | | | 2,745 | | | | | | | | 2,745 | |
| | | | | | | | | | | | | | | | | | | | | | | | | | | | | | | | | | | | |
| Total comprehensive income | | | | | | | | | | | | | | | | | | | | | | | | | | | | | | | | | | | 97,251 | |
| Treasury stock purchases | | | | | | | | | | | | | | | (2,284 | ) | | | (79,568 | ) | | | | | | | | | | | | | | | (79,568 | ) |
| Exercise of stock options | | | 1,410 | | | | 1 | | | | 6,971 | | | | | | | | | | | | | | | | | | | | | | | | 6,972 | |
| Excess tax benefits from share-based compensation | | | | | | | | | | | 55,847 | | | | | | | | | | | | | | | | | | | | | | | | 55,847 | |
| Share-based compensation | | | | | | | | | | | 9,199 | | | | | | | | | | | | | | | | | | | | | | | | 9,199 | |
| | | | | | | | | | | | | | | | | | | | | | | | | | | | | |
| BALANCE — June 30, 2011 | | | 110,125 | | | $ | 110 | | | $ | 1,123,739 | | | | (2,284 | ) | | $ | (79,568 | ) | | $ | — | | | $ | (1,751 | ) | | $ | 220,926 | | | $ | 1,263,456 | |
| | | | | | | | | | | | | | | | | | | | | | | | | | | | | |
See notes to unaudited condensed consolidated financial statements.
3
LPL INVESTMENT HOLDINGS INC. AND SUBSIDIARIES
Condensed Consolidated Statements of Cash Flows
(Unaudited)
(Dollars in thousands)
| | | | | | | | | |
| | | Six Months Ended | |
| | | June 30, | |
| | | 2011 | | | 2010 | |
| CASH FLOWS FROM OPERATING ACTIVITIES: | | | | | | | | |
| Net income | | $ | 94,506 | | | $ | 33,554 | |
| Adjustments to reconcile net income to net cash provided by operating activities: | | | | | | | | |
| Noncash items: | | | | | | | | |
| Depreciation and amortization | | | 36,572 | | | | 47,700 | |
| Amortization of debt issuance costs | | | 2,546 | | | | 2,350 | |
| Excess tax benefits from share-based compensation | | | (55,847 | ) | | | (226 | ) |
| Share-based compensation | | | 9,199 | | | | 7,568 | |
| Impairment of fixed assets | | | — | | | | 840 | |
| Loss on extinguishment of debt | | | — | | | | 37,979 | |
| Provision for bad debts | | | 799 | | | | 281 | |
| Deferred income tax provision | | | (5,952 | ) | | | (17,519 | ) |
| Impairment of intangible assets | | | 1,716 | | | | — | |
| Lease abandonment | | | 414 | | | | — | |
| Loan forgiveness | | | 756 | | | | 2,788 | |
| Other | | | 245 | | | | 552 | |
| Changes in operating assets and liabilities: | | | | | | | | |
| Cash and securities segregated under federal and other regulations | | | 147,746 | | | | 31,358 | |
| Receivables from clients | | | (17,135 | ) | | | (8,558 | ) |
| Receivables from product sponsors, broker-dealers and clearing organizations | | | 42,987 | | | | 1,692 | |
| Receivables from others | | | (18,675 | ) | | | (9,759 | ) |
| Securities owned | | | (231 | ) | | | (3,250 | ) |
| Securities borrowed | | | (3,159 | ) | | | 3,297 | |
| Other assets | | | (17,397 | ) | | | (5,877 | ) |
| Drafts payable | | | (44,702 | ) | | | 6,471 | |
| Payables to clients | | | 31,519 | | | | (76,140 | ) |
| Payables to broker-dealers and clearing organizations | | | (1,931 | ) | | | 6,664 | |
| Accrued commissions and advisory fees payable | | | (19,072 | ) | | | 11,191 | |
| Accounts payable and accrued liabilities | | | (26,716 | ) | | | (9,057 | ) |
| Unearned revenue | | | 10,460 | | | | 9,090 | |
| Income taxes receivable/payable | | | 181,828 | | | | (18,553 | ) |
| Securities sold but not yet purchased | | | (760 | ) | | | (1,412 | ) |
| | | | | | | |
| Net cash provided by operating activities | | | 349,716 | | | | 53,024 | |
| | | | | | | |
See notes to unaudited condensed consolidated financial statements.
4
LPL INVESTMENT HOLDINGS INC. AND SUBSIDIARIES
Condensed Consolidated Statements of Cash Flows — (Continued)
(Unaudited)
(Dollars in thousands)
| | | | | | | | | |
| | | Six Months Ended | |
| | | June 30, | |
| | | 2011 | | | 2010 | |
| CASH FLOWS FROM INVESTING ACTIVITIES: | | | | | | | | |
| Capital expenditures | | $ | (12,500 | ) | | $ | (3,652 | ) |
| Purchase of securities classified as held-to-maturity | | | (3,782 | ) | | | (2,008 | ) |
| Proceeds from maturity of securities classified as held-to-maturity | | | 1,650 | | | | 3,350 | |
| Acquisitions (Note 3) | | | (37,184 | ) | | | — | |
| Deposits of restricted cash | | | (3,040 | ) | | | (3,016 | ) |
| Release of restricted cash | | | 18,546 | | | | 2,605 | |
| | | | | | | |
| Net cash used in investing activities | | | (36,310 | ) | | | (2,721 | ) |
| | | | | | | |
| CASH FLOWS FROM FINANCING ACTIVITIES: | | | | | | | | |
| Repayment of senior credit facilities | | | (46,986 | ) | | | (5,598 | ) |
| Proceeds from senior credit facilities | | | — | | | | 566,700 | |
| Redemption of subordinated notes | | | — | | | | (579,563 | ) |
| Payment of debt issuance costs | | | — | | | | (7,181 | ) |
| Payment of deferred transaction costs | | | — | | | | (1,259 | ) |
| Purchase of treasury stock | | | (66,976 | ) | | | — | |
| Proceeds from stock options exercised | | | 6,972 | | | | 51 | |
| Excess tax benefits from share-based compensation | | | 55,847 | | | | 226 | |
| Issuance of common stock | | | — | | | | 468 | |
| | | | | | | |
| Net cash used in financing activities | | | (51,143 | ) | | | (26,156 | ) |
| | | | | | | |
| NET INCREASE IN CASH AND CASH EQUIVALENTS | | | 262,263 | | | | 24,147 | |
| CASH AND CASH EQUIVALENTS — Beginning of period | | | 419,208 | | | | 378,594 | |
| | | | | | | |
| CASH AND CASH EQUIVALENTS — End of period | | $ | 681,471 | | | $ | 402,741 | |
| | | | | | | |
| SUPPLEMENTAL DISCLOSURES OF CASH FLOW INFORMATION: | | | | | | | | |
| Interest paid | | $ | 36,362 | | | $ | 54,436 | |
| | | | | | | |
| Income taxes paid | | $ | 29,870 | | | $ | 56,201 | |
| | | | | | | |
| NONCASH DISCLOSURES: | | | | | | | | |
| Pending settlement of treasury stock purchases | | $ | 12,592 | | | $ | — | |
| | | | | | | |
| Capital expenditures purchased through short-term credit | | $ | 3,506 | | | $ | 1,224 | |
| | | | | | | |
| Increase in unrealized gain on interest rate swaps, net of tax expense | | $ | 2,745 | | | $ | 4,673 | |
| | | | | | | |
| Discount on proceeds from senior credit facilities recorded as debt issuance costs | | $ | — | | | $ | 13,300 | |
| | | | | | | |
See notes to unaudited condensed consolidated financial statements.
5
LPL INVESTMENT HOLDINGS INC. AND SUBSIDIARIES
Notes to Condensed Consolidated Financial Statements (Unaudited)
1. Organization and Description of the Company
LPL Investment Holdings Inc. (“LPLIH”), a Delaware holding corporation, together with its consolidated subsidiaries (collectively, the “Company”) provides an integrated platform of proprietary technology, brokerage and investment advisory services to independent financial advisors and financial advisors at financial institutions (collectively “advisors”) in the United States. Through its proprietary technology, custody and clearing platforms, the Company provides access to diversified financial products and services enabling its advisors to offer independent financial advice and brokerage services to retail investors (their “clients”).
2. Basis of Presentation
Quarterly Reporting— The unaudited condensed consolidated financial statements have been prepared pursuant to the rules and regulations of the Securities and Exchange Commission (“SEC”). These unaudited condensed consolidated financial statements reflect all adjustments that are, in the opinion of management, necessary for a fair statement of the results for the interim periods presented. These adjustments are of a normal recurring nature. The Company’s results for any interim period are not necessarily indicative of results for a full year or any other interim period. Certain reclassifications were made to previously reported amounts in the unaudited condensed consolidated financial statements and notes thereto to make them consistent with the current period presentation.
The unaudited condensed consolidated financial statements do not include all information and notes necessary for a complete presentation of financial position, results of operations and cash flows in conformity with generally accepted accounting principles in the United States of America (“GAAP”). Accordingly, these financial statements should be read in conjunction with the Company’s audited consolidated financial statements and the related notes for the year ended December 31, 2010, contained in the Company’s Annual Report on Form 10-K as filed with the SEC. The Company has evaluated subsequent events up to and including the date these unaudited condensed consolidated financial statements were issued.
Consolidation— These unaudited condensed consolidated financial statements include the accounts of LPLIH and its subsidiaries. Intercompany transactions and balances have been eliminated. Equity investments in which the Company exercises significant influence but does not exercise control and is not the primary beneficiary are accounted for using the equity method.
Use of Estimates— The preparation of the unaudited condensed consolidated financial statements in conformity with GAAP requires the Company to make estimates and judgments that affect the reported amounts of assets and liabilities, revenue and expenses and related disclosures of contingent assets and liabilities. On an on-going basis, the Company evaluates estimates, including those related to revenue and related expense recognition, asset impairment, valuation of accounts receivable, valuation of financial derivatives, contingencies and litigation, valuation and recognition of share-based payments and income taxes. These accounting policies are stated in the notes to the audited consolidated financial statements for the year ended December 31, 2010, contained in the Annual Report on Form 10-K as filed with the SEC. These estimates are based on the information that is currently available and on various other assumptions that the Company believes to be reasonable under the circumstances. Actual results could vary from these estimates under different assumptions or conditions and the differences may be material to the unaudited condensed consolidated financial statements.
Reportable Segment— The Company’s internal reporting is organized into three service channels; Independent Advisor Services, Institution Services and Custom Clearing Services, which are designed to enhance the services provided to its advisors and financial institutions. These service channels qualify as individual operating segments, but are aggregated and viewed as one single reportable segment due to their similar economic characteristics, products and services, production and distribution process, regulatory environment and quantitative thresholds.
6
Fair Value of Financial Instruments— The Company’s financial assets and liabilities are carried at fair value or at amounts that, because of their short-term nature, approximate current fair value, with the exception of its indebtedness. The Company carries its indebtedness at amortized cost and measures the implied fair value of its debt instruments using trading levels obtained from a third-party service provider. As of June 30, 2011, the carrying amount and fair value of the Company’s indebtedness was approximately $1,340 million and $1,342 million, respectively. As of December 31, 2010, the carrying amount and fair value were approximately $1,387 million and $1,390 million, respectively. See Note 5 for additional detail regarding the Company’s fair value measurements.
Acquisitions— The Company accounts for acquisitions as business combinations, and recognizes, separately from goodwill, assets acquired and liabilities assumed at their respective fair values as of the acquisition date. Goodwill as of the acquisition date is measured as the excess of consideration transferred and the net of the acquisition date fair values of the assets acquired and the liabilities assumed.
Recently Issued Accounting Pronouncements— Recent accounting pronouncements or changes in accounting pronouncements during the six months ended June 30, 2011, as compared to the recent accounting pronouncements described in the Company’s 2010 Annual Report on Form 10-K, that are of significance, or potential significance, to the Company are discussed below.
In May 2011, the Financial Accounting Standards Board (“FASB”) issued Accounting Standards Update (“ASU”) No. 2011-04,Fair Value Measurement (Topic 820)—Amendments to Achieve Common Fair Value Measurement and Disclosure Requirements in U.S. GAAP and IFRSs (“ASU 2011-04”), which clarifies the wording and disclosures required in Accounting Standards Codification (“ASC”) Topic 820,Fair Value Measurement(“ASC 820”), to converge with those used in International Financial Reporting Standards. The update explains how to measure and disclose fair value under ASC 820. However, the FASB does not expect the changes in this standard’s update to alter the current application of the requirements in ASC 820. The provisions of ASU 2011-04 are effective for public entities prospectively for interim and annual periods beginning after December 15, 2011, and early adoption is prohibited. Therefore, ASU 2011-04 is effective for the Company during the first quarter of fiscal 2012. The Company does not expect ASU 2011-04 to have a material effect on its results of operations, financial condition, and cash flows.
In June 2011, the FASB issued ASU No. 2011-05,Comprehensive Income (ASC Topic 220)—Presentation of Comprehensive Income(“ASU 2011-05”), which amends current comprehensive income guidance by eliminating the option to present the components of other comprehensive income as part of the statement of stockholders’ equity. Instead, the Company must report comprehensive income in either a single continuous statement of comprehensive income which contains two sections, net income and other comprehensive income, or in two separate but consecutive statements. ASU 2011-05 will be effective for public companies during the interim and annual periods beginning after December 15, 2011, with early adoption permitted. The Company does not anticipate the adoption of ASU 2011-05 to have an impact on its results of operations, financial condition, or cash flows as the only requirement is a change in the format of the current presentation.
3. Acquisitions
National Retirement Partners, Inc.
On July 14, 2010, the Company announced a definitive agreement pursuant to which it would acquire certain assets of National Retirement Partners, Inc. (“NRP”). NRP’s advisors offer products and consulting, design and investment services to retirement plan sponsors and participants and comprehensive financial services to high net worth individuals. This strategic acquisition further enhances the capabilities and presence of the Company in the group retirement space.
On February 9, 2011, the transaction closed. The Company paid $17.2 million at the closing of the transaction. As of June 30, 2011, $3.7 million remains in an escrow account subject to adjustment pursuant to the terms of the asset purchase agreement. Such amount has been classified by the Company as restricted cash and is included in other assets on the unaudited condensed consolidated statements of financial condition.
The Company may be required to pay future consideration to former shareholders of NRP that is contingent upon the achievement of certain revenue-based milestones in the third year following the acquisition. There is no maximum amount of contingent consideration; however, as of the acquisition date, the Company estimates the total fair value of contingent
7
consideration to be $5.3 million. At the acquisition date, $2.0 million of the contingent liability had been paid in advance and the remainder of $3.3 million was recorded within accounts payable and accrued liabilities on the unaudited condensed consolidated statements of financial condition. Including the provisional contingent consideration, the total consideration for the acquisition was $24.2 million. Transaction costs associated with the Company’s acquisition of NRP totaling $4.3 million were expensed as incurred through other expense in the unaudited condensed consolidated statements of operations. Of these transaction costs, $2.0 million were incurred during the six months ending June 30, 2011.
Concord Capital Partners, Inc.
On April 20, 2011, the Company announced its intent to acquire all of the outstanding common stock of Concord Capital Partners, Inc. (“Concord Wealth Management” or “CCP”) and certain of its subsidiaries. Concord Wealth Management is an industry leader in providing technology and open architecture investment management solutions for trust departments of financial institutions. Through this acquisition, the Company will have the ability to support both the brokerage and trust business lines of current and prospective financial institutions. The acquisition will also create new expansion opportunities such as giving the Company the ability to custody personal trust assets within banks across the country.
On June 22, 2011, the transaction closed. The Company paid $20.0 million at the closing of the transaction, net of cash acquired. As of June 30, 2011, $2.3 million remains in an escrow account to be paid to former shareholders of Concord Wealth Management in accordance with the terms of the stock purchase agreement. Such amount has been classified by the Company as restricted cash and is included in other assets on the unaudited condensed consolidated statements of financial condition.
The Company may be required to pay future consideration that is contingent upon the achievement of certain gross margin-based milestones for the year ended December 31, 2013. The maximum amount of contingent consideration is $15.0 million. The Company estimates the total fair value of the contingent consideration as $11.5 million at the acquisition date, which has been recorded within accounts payable and accrued liabilities on the unaudited condensed consolidated statements of financial condition. Including the provisional contingent consideration, the total consideration for the acquisition was approximately $33.8 million. During the six months ending June 30, 2011, the Company incurred transaction costs associated with its acquisition of Concord Wealth Management totaling $0.4 million which were recorded as other expense in the unaudited condensed consolidated statements of operations.
The Company is in the process of finalizing the purchase allocations and the value of contingent considerations for NRP and CCP; therefore, the provisional measures of goodwill, intangibles, fixed assets, and contingent consideration are subject to change.
Set forth below is a reconciliation of assets acquired and liabilities assumed during the six months ended June 30, 2011 (in thousands):
| | | | | | | | | | | | | |
| | | CCP | | | NRP | | | Total | |
| Goodwill | | $ | 23,294 | | | $ | 12,574 | | | $ | 35,868 | |
| Accounts receivable | | | 770 | | | | — | | | | 770 | |
| Other assets | | | 190 | | | | — | | | | 190 | |
| Intangibles | | | 7,550 | | | | 11,800 | | | | 19,350 | |
| Fixed assets(1) | | | 3,950 | | | | — | | | | 3,950 | |
| Accounts payable and accrued liabilities | | | (1,993 | ) | | | (190 | ) | | | (2,183 | ) |
| | | | | | | | | | |
| Net assets acquired | | $ | 33,761 | | | $ | 24,184 | | | $ | 57,945 | |
| | | | | | | | | | |
| | |
| (1) | | Fixed assets acquired from CCP relate primarily to internally developed software, which amortizes over 5 years. |
Set forth below is supplemental cash flow information for the six months ended June 30, 2011 (in thousands):
| | | | | | | | | | | | | |
| | | CCP | | | NRP | | | Total | |
| Cash payments, net of cash acquired | | $ | 19,969 | | | $ | 17,215 | | | $ | 37,184 | |
| Cash placed in escrow | | | 2,250 | | | | 3,669 | | | | 5,919 | |
| Contingent consideration | | | 11,542 | | | | 3,300 | | | | 14,842 | |
| | | | | | | | | | |
| Total purchase price | | $ | 33,761 | | | $ | 24,184 | | | $ | 57,945 | |
| | | | | | | | | | |
8
The Company preliminarily allocated the estimated purchase price to specific amortizable intangible asset categories as follows (dollars in thousands):
| | | | | | | | | |
| | Amortization
Period | | Amount
Assigned |
CCP | | | | | | | | |
| Client relationships | | 15.0 years | | | $ | 7,550 | |
| | | | | | | | |
| | | | | | | | | |
NRP | | | | | | | | |
| Client relationships | | 11.0 years | | | | 4,730 | |
| Advisor relationships | | 9.0 years | | | | 4,080 | |
| Product sponsor relationships | | 4.0 years | | | | 2,990 | |
| | | | | | | | |
| Total intangible assets acquired from NRP | | | | | | $ | 11,800 | |
| | | | | | | | |
Pro-forma information related to the acquisitions was not included because the impact on the Company’s unaudited condensed consolidated statements of operations, financial condition and cash flows was not considered to be material.
4. Restructuring
Consolidation of UVEST Financial Services Group, Inc.
On March 14, 2011, the Company committed to a corporate restructuring plan to consolidate the operations of UVEST Financial Services Group, Inc. (“UVEST”) with LPL Financial LLC, (“LPL Financial”). The restructuring plan was effected to enhance the Company’s service offering, while also generating efficiencies. In connection with the consolidation, certain registered representatives currently associated with UVEST will move to LPL Financial through a transfer of their licenses. The transfers are expected to commence in the third quarter of 2011 and to be completed in December 2011. Following the transfer of registered representatives and client accounts to LPL Financial, all registered representatives and client accounts that transferred shall be associated with LPL Financial and all of the Company’s security business will be done through a single broker-dealer. In addition, UVEST will terminate its clearing relationship with a third-party clearing firm.
The Company estimates total expenditures associated with the initiative to be approximately $52.7 million over of the course of the restructuring plan. These expenditures are comprised of advisor retention and related benefits, contract termination fees, technology costs, non-cash charges for the impairment of intangible assets resulting from advisor attrition and other expenses principally relating to the conversion and transfer of registered representatives and client accounts from UVEST to LPL Financial.
The following table summarizes the balance of accrued expenses and the changes in the accrued amounts as of and for the six months ended June 30, 2011 (in thousands):
| | | | | | | | | | | | | | | | | | | | | | | | | |
| | | Accrued | | | | | | | | | | | | | | Accrued | | Total |
| | | Balance at | | | | | | | | | | | | | | Balance at | | Expected |
| | | December 31, | | Costs | | | | | | | | | | | June 30, | | Restructuring |
| | | 2010 | | Incurred(1) | | | Payments | | Non-cash | | 2011 | | Costs |
| Conversion and transfer costs | | $ | — | | | | $2,544 | | | | $(2,114 | ) | | $ | — | | | | $ 430 | | | | $ 28,650 | |
| Contract termination fees | | | — | | | | 394 | | | | — | | | | — | | | | 394 | | | | 11,400 | |
| Advisor retention and related benefits | | | — | | | | 325 | | | | (305 | ) | | | (20 | ) | | | — | | | | 7,000 | |
| Asset impairments | | | — | | | | 1,716 | | | | — | | | | (1,716 | ) | | | — | | | | 5,600 | |
| | | | | | | | | | | | | | | | | | | | | | | |
| Total | | $ | — | | | | $4,979 | | | | $(2,419 | ) | | $ | (1,736 | ) | | | $ 824 | | | | $ 52,650 | |
| | | | | | | | | | | | | | | | | | | | | | | |
| | |
| (1) At June 30, 2011, costs incurred represent the total cumulative costs incurred. |
5. Fair Value Measurements
Fair value is defined as the exchange price that would be received for an asset or paid to transfer a liability (an exit price) in the principal or most advantageous market for the asset or liability in an orderly transaction between market participants at the measurement date. Inputs used to measure fair value are prioritized within a three-level fair value
9
hierarchy. This hierarchy requires entities to maximize the use of observable inputs and minimize the use of unobservable inputs. The three levels of inputs used to measure fair value are as follows:
| • | | Level 1— Quoted prices in active markets for identical assets or liabilities. |
| • | | Level 2— Observable inputs other than quoted prices included in Level 1, such as quoted prices for similar assets and liabilities in active markets; quoted prices for identical or similar assets and liabilities in markets that are not active; or other inputs that are observable or can be corroborated by observable market data. |
| • | | Level 3— Unobservable inputs that are supported by little or no market activity and that are significant to the fair value of the assets or liabilities. This includes certain pricing models, discounted cash flow methodologies and similar techniques that use significant unobservable inputs. |
The Company’s fair value measurements are evaluated within the fair value hierarchy, based on the nature of inputs used to determine the fair value at the measurement date. At June 30, 2011, the Company had the following financial assets and liabilities that are measured at fair value on a recurring basis:
Cash Equivalents— The Company’s cash equivalents include money market funds, which are short term in nature with readily determinable values derived from active markets.
Securities Owned and Securities Sold But Not Yet Purchased— The Company’s trading securities consist of house account model portfolios for the purpose of benchmarking the performance of its fee based advisory platforms and temporary positions resulting from the processing of client transactions. Examples of these securities include money market funds, U.S. treasuries, mutual funds, certificates of deposit, traded equity securities and debt securities.
The Company uses prices obtained from independent third-party pricing services to measure the fair value of its trading securities. Prices received from the pricing services are validated using various methods including comparison to prices received from additional pricing services, comparison to available quoted market prices and review of other relevant market data including implied yields of major categories of securities. In general, these quoted prices are derived from active markets for identical assets or liabilities. When quoted prices in active markets for identical assets and liabilities are not available, the quoted prices are based on similar assets and liabilities or inputs other than the quoted prices that are observable, either directly or indirectly. For certificates of deposit and treasury securities, the Company utilizes market-based inputs including observable market interest rates that correspond to the remaining maturities or the next interest reset dates. At June 30, 2011, the Company did not adjust prices received from the independent third-party pricing services.
Other Assets— The Company’s other assets include deferred compensation plan assets that are invested in money market funds and mutual funds which are actively traded and valued based on quoted market prices in active markets.
Accounts Payable and Accrued Liabilities— The Company’s accounts payable and accrued liabilities include contingent consideration from its acquisitions. See Note 3 for more information regarding the acquisitions and related contingent consideration.
Interest Rate Swaps— The Company’s interest rate swaps are not traded on a market exchange; therefore, the fair values are determined using models which include assumptions about the London Interbank Offered Rate (“LIBOR”) yield curve at interim reporting dates as well as counterparty credit risk and the Company’s own non-performance risk.
There have been no transfers of assets or liabilities between fair value measurement classifications during the six months ended June 30, 2011.
10
The following table summarizes the Company’s financial assets and financial liabilities measured at fair value on a recurring basis at June 30, 2011 (in thousands):
| | | | | | | | | | | | | | | | | |
| | Quoted | | | | | | | | | |
| | Prices in | | | | | | |
| | Active | | Significant | | | | |
| | Markets for | | Other | | Significant | | |
| | Identical | | Observable | | Unobservable | | | |
| | Assets | | Inputs | | Inputs | | Fair Value |
| | (Level 1) | | (Level 2) | | (Level 3) | | Measurements |
At June 30, 2011: | | | | | | | | | | | | | | | | |
Assets | | | | | | | | | | | | | | | | |
| Cash equivalents | | $ | 516,357 | | | $ | — | | | $ | — | | | $ | 516,357 | |
| Securities owned — trading: | | | | | | | | | | | | | | | | |
| Money market funds | | | 529 | | | | — | | | | — | | | | 529 | |
| Mutual funds | | | 7,399 | | | | — | | | | — | | | | 7,399 | |
| Equity securities | | | 74 | | | | — | | | | — | | | | 74 | |
| Debt securities | | | — | | | | 838 | | | | — | | | | 838 | |
| U.S. treasury obligations | | | 900 | | | | — | | | | — | | | | 900 | |
| Total securities owned — trading | | | 8,902 | | | | 838 | | | | — | | | | 9,740 | |
| | | | | | | | | | | | | |
| Other assets | | | 22,819 | | | | — | | | | — | | | | 22,819 | |
| | | | | | | | | | | | | |
| Total assets at fair value | | $ | 548,078 | | | $ | 838 | | | $ | — | | | $ | 548,916 | |
| | | | | | | | | | | | | |
Liabilities | | | | | | | | | | | | | | | | |
| Securities sold but not yet purchased: | | | | | | | | | | | | | | | | |
| Mutual funds | | $ | 3,313 | | | $ | — | | | $ | — | | | $ | 3,313 | |
| Equity securities | | | 162 | | | | — | | | | — | | | | 162 | |
| Debt securities | | | — | | | | 135 | | | | — | | | | 135 | |
| Certificates of deposit | | | — | | | | 451 | | | | — | | | | 451 | |
| | | | | | | | | | | | | |
| Total securities sold but not yet purchased | | | 3,475 | | | | 586 | | | | — | | | | 4,061 | |
| | | | | | | | | | | | | |
| Interest rate swaps | | | — | | | | 2,836 | | | | — | | | | 2,836 | |
| Accounts payable and accrued liabilities | | | — | | | | — | | | | 15,111 | | | | 15,111 | |
| | | | | | | | | | | | | |
| Total liabilities at fair value | | $ | 3,475 | | | $ | 3,422 | | | $ | 15,111 | | | $ | 22,008 | |
| | | | | | | | | | | | | |
Certain assets and liabilities are not measured at fair value on an ongoing basis but are subject to fair value measurement in certain circumstances, for example, when evidence of impairment exists. During the second quarter of 2011, the Company recorded an asset impairment charge of $1.7 million for certain intangible assets that were determined to have no estimated fair value (See Note 7). The fair value was determined based on the loss of future expected cash flows for institutional relationships that were not retained as a result of the Company’s ongoing consolidation of UVEST with LPL Financial. The Company has determined that the impairment qualifies as a Level 3 measurement under the fair value hierarchy.
Changes in Level 3 Recurring Fair Value Measurements
Set forth below is a reconciliation of contingent consideration classified as accounts payable and accrued liabilities on the unaudited condensed consolidated statements of financial condition and measured at fair value on a recurring basis using significant unobservable inputs (Level 3). Contingent consideration is measured by discounting, to present value, the contingent payments expected to be made based on the Company’s estimates of certain financial targets expected to result from the acquisitions.
| |
|
Six Months Ended June 30, 2011(in thousands): |
| | | | | |
|
| Fair value at December 31, 2010 | | $ | — | |
| Issuances of contingent consideration | | | 16,842 | |
| Total unrealized losses included in earnings | | | 269 | |
| Payments | | | (2,000 | ) |
| | | | |
| Fair value at June 30, 2011 | | $ | 15,111 | |
| | | | |
11
The following table summarizes the Company’s financial assets and financial liabilities measured at fair value on a recurring basis at December 31, 2010 (in thousands):
| | | | | | | | | | | | | | | | | |
| | Quoted | | | | | | |
| | Prices in | | | | | | |
| | Active | | Significant | | | | |
| | Markets for | | Other | | Significant | | |
| | Identical | | Observable | | Unobservable | | |
| | Assets | | Inputs | | Inputs | | Fair Value |
| | (Level 1) | | (Level 2) | | (Level 3) | | Measurements |
At December 31, 2010: | | | | | | | | | | | | | | | | |
Assets | | | | | | | | | | | | | | | | |
| Cash equivalents | | $ | 279,048 | | | $ | — | | | $ | — | | | $ | 279,048 | |
| Securities owned — trading: | | | | | | | | | | | | | | | | |
| Money market funds | | | 316 | | | | — | | | | — | | | | 316 | |
| Mutual funds | | | 7,300 | | | | — | | | | — | | | | 7,300 | |
| Equity securities | | | 17 | | | | — | | | | — | | | | 17 | |
| Debt securities | | | — | | | | 516 | | | | — | | | | 516 | |
| U.S. treasury obligations | | | 1,010 | | | | — | | | | — | | | | 1,010 | |
| Certificates of deposit | | | — | | | | 100 | | | | — | | | | 100 | |
| | | | | | | | | | | | | |
| Total securities owned — trading | | | 8,643 | | | | 616 | | | | — | | | | 9,259 | |
| | | | | | | | | | | | | |
| Other assets | | | 17,175 | | | | — | | | | — | | | | 17,175 | |
| | | | | | | | | | | | | |
| Total assets at fair value | | $ | 304,866 | | | $ | 616 | | | $ | — | | | $ | 305,482 | |
| | | | | | | | | | | | | |
Liabilities | | | | | | | | | | | | | | | | |
| Securities sold but not yet purchased: | | | | | | | | | | | | | | | | |
| Mutual funds | | $ | 4,563 | | | $ | — | | | $ | — | | | $ | 4,563 | |
| Equity securities | | | 204 | | | | — | | | | — | | | | 204 | |
| Debt securities | | | — | | | | 54 | | | | — | | | | 54 | |
| | | | | | | | | | | | | |
| Total securities sold but not yet purchased | | | 4,767 | | | | 54 | | | | — | | | | 4,821 | |
| | | | | | | | | | | | | |
| Interest rate swaps | | | — | | | | 7,281 | | | | — | | | | 7,281 | |
| | | | | | | | | | | | | |
| Total liabilities at fair value | | $ | 4,767 | | | $ | 7,335 | | | $ | — | | | $ | 12,102 | |
| | | | | | | | | | | | | |
6. Held-to-Maturity Securities
The Company holds certain investments in securities including U.S. government notes. The Company has both the intent and the ability to hold these investments to maturity and classifies them as such. Interest income is accrued as earned. Premiums and discounts are amortized using a method that approximates the effective yield method over the term of the security and are recorded as an adjustment to the investment yield.
The amortized cost, gross unrealized gains and fair value of securities held-to-maturity were as follows (in thousands):
| | | | | | | | | | | | | |
| | | | | | | Gross | | | |
| | | Amortized | | | Unrealized | | | |
| | | Cost | | | Gains | | Fair Value | |
At June 30, 2011: | | | | | | | | | | | | |
| U.S. government notes | | $ | 11,651 | | | | $ 50 | | | $ | 11,701 | |
| | | | | | | | | | | |
| | | | | | | | | | | | | |
At December 31, 2010: | | | | | | | | | | | | |
| U.S. government notes | | $ | 9,563 | | | | $ 69 | | | $ | 9,632 | |
| | | | | | | | | | | |
The maturities of securities held-to-maturity at June 30, 2011 were as follows (in thousands):
| | | | | | | | | | | | | |
| | | Within 1 Year | | 1-3 Years | | Total | |
| U.S. government notes — at amortized cost | | | $ 7,373 | | | | $ 4,278 | | | $ | 11,651 | |
| | | | | | | | | | | | |
| U.S. government notes — at fair value | | | $ 7,394 | | | | $ 4,307 | | | $ | 11,701 | |
| | | | | | | | | | | | |
12
7. Goodwill and Intangible Assets
A summary of the activity in goodwill is presented below (in thousands):
| | | | | |
|
| Balance at December 31, 2010 | | $ | 1,293,366 | |
| Acquisition of CCP (Note 3) | | | 23,294 | (1) |
| Acquisition of NRP (Note 3) | | | 12,574 | (1) |
| | | | |
| Balance at June 30, 2011 | | $ | 1,329,234 | |
| | | | |
| | |
| (1) | | This is a provisional amount and is subject to change (see Note 3). |
During the second quarter ended June 30, 2011, and in conjunction with the corporate restructuring plan to consolidate UVEST, certain institutional relationships were determined to have no future economic benefit. Accordingly, the Company has recorded an intangible asset impairment charge of $1.7 million. The impairment was determined based upon the attrition of institutions and their related revenue streams during the period of consolidation. The Company has recorded the intangible asset impairment as a restructuring charge (See Note 4) and has classified as such on the unaudited condensed consolidated statements of operations.
The components of intangible assets as of June 30, 2011 and December 31, 2010 are as follows (dollars in thousands):
| | | | | | | | | | | | | | | | | |
| | | Weighted | | Gross | | | | | | | Net | |
| | | Average Life | | Carrying | | | Accumulated | | | Carrying | |
| | | Remaining | | Value | | | Amortization | | | Value | |
At June 30, 2011: | | | | | | | | | | | | | | | | |
| Definite-lived intangible assets: | | | | | | | | | | | | | | | | |
| Advisor and financial institution relationships | | | 13.8 | | | $ | 460,788 | | | $ | (129,410 | ) | | $ | 331,378 | |
| Product sponsor relationships | | | 14.4 | | | | 234,920 | | | | (61,453 | ) | | | 173,467 | |
| Client relationships | | | 13.4 | | | | 14,910 | | | | (1,086 | ) | | | 13,824 | |
| | | | | | | | | | | | | | |
| Total definite-lived intangible assets | | | | | | $ | 710,618 | | | $ | (191,949 | ) | | $ | 518,669 | |
| | | | | | | | | | | | | | |
| Indefinite-lived intangible assets: | | | | | | | | | | | | | | | | |
| Trademark and trade name | | | | | | | | | | | | | | | 39,819 | |
| | | | | | | | | | | | | | | | |
| Total intangible assets | | | | | | | | | | | | | | $ | 558,488 | |
| | | | | | | | | | | | | | | | |
At December 31, 2010: | | | | | | | | | | | | | | | | |
| Definite-lived intangible assets: | | | | | | | | | | | | | | | | |
| Advisor and financial institution relationships | | | | | | $ | 458,424 | | | $ | (116,687 | ) | | $ | 341,737 | |
| Product sponsor relationships | | | | | | | 231,930 | | | | (55,255 | ) | | | 176,675 | |
| Client relationships | | | | | | | 2,630 | | | | (784 | ) | | | 1,846 | |
| | | | | | | | | | | | | | |
| Total definite-lived intangible assets | | | | | | $ | 692,984 | | | $ | (172,726 | ) | | $ | 520,258 | |
| | | | | | | | | | | | | | |
| Indefinite-lived intangible assets: | | | | | | | | | | | | | | | | |
| Trademark and trade name | | | | | | | | | | | | | | | 39,819 | |
| | | | | | | | | | | | | | | | |
| Total intangible assets | | | | | | | | | | | | | | $ | 560,077 | |
| | | | | | | | | | | | | | | | |
Total amortization expense of intangible assets was $9.7 million and $9.3 million for the three months ended June 30, 2011, and 2010, respectively, and $19.2 million and $18.5 million for the six months ended June 30, 2011, and 2010, respectively. Amortization expense for each of the fiscal years ended December 31, 2011 (remainder) through 2015 and thereafter is estimated as follows (in thousands):
| | | | | |
|
| 2011 — remainder | | $ | 19,819 | |
| 2012 | | | 39,190 | |
| 2013 | | | 38,329 | |
| 2014 | | | 38,053 | |
| 2015 | | | 37,172 | |
| Thereafter | | | 346,106 | |
| | | | |
| Total | | $ | 518,669 | |
| | | | |
13
8. Income Taxes
The Company’s effective income tax rate differs from the federal corporate tax rate of 35%, primarily as a result of state taxes, settlement contingencies and expenses that are not deductible for tax purposes. These items resulted in effective tax rates of 39.7% and 7.3% for the three months ended June 30, 2011 and 2010, respectively, and 39.8% and 37.1% for the six months ended June 30, 2011 and 2010, respectively. The reduction in the Company’s effective tax rate for the three months ended June 30, 2010 is primarily related to a change in California’s income sourcing rules that took effect on January 1, 2011.
Deferred income taxes reflect the net tax effects of temporary differences between the carrying amounts of assets and liabilities for financial reporting purposes and the amounts used for income tax purposes. As a result of certain realization requirements of ASC Topic 718,Compensation—Stock Compensation, deferred tax assets and liabilities exclude certain federal and state net operating loss carryforwards and other federal credit carryforwards that arose directly from tax deductions related to equity compensation in excess of share-based compensation recognized for financial reporting. During the six months ended June 30, 2011, the Company recorded an increase in additional paid-in capital of $42.8 million, as some of these tax carryforwards were used to reduce income taxes payable. To the extent that the Company utilizes the remaining tax attributes in the future to reduce income taxes payable, the Company will record an increase to additional paid-in capital of $12.4 million.
9. Indebtedness
Senior Secured Credit Facilities—Term Loans— On May 24, 2010, the Company entered into a Third Amended and Restated Credit Agreement (the “Amended Credit Agreement”). The Amended Credit Agreement amended and restated the Company’s Second Amended and Restated Credit Agreement, dated as of June 18, 2007. Pursuant to the Amended Credit Agreement, the Company established a new term loan tranche of $580.0 million maturing on June 28, 2017 (the “2017 Term Loans”) and recorded $16.6 million in debt issuance costs that are capitalized in the unaudited condensed consolidated statements of financial condition. The Company also extended the maturity of a $500.0 million tranche of its term loan facility to June 25, 2015 (the “2015 Term Loans”), with the remaining $317.1 million tranche of the term loan facility maturing on the original maturity date of June 28, 2013 (the “2013 Term Loans”).
The applicable margin for borrowings with respect to the (a) 2013 Term Loans is currently 0.75% for base rate borrowings and 1.75% for LIBOR borrowings and could change depending on the Company’s credit rating; (b) 2015 Term Loans is currently 1.75% for base rate borrowings and 2.75% for LIBOR borrowings, and (c) 2017 Term Loans is currently 2.75% for base rate borrowings and 3.75% for LIBOR borrowings. The LIBOR Rate with respect to the 2015 Term Loans and the 2017 Term Loans shall in no event be less than 1.50%.
Borrowings under the Company’s senior secured term loan facilities bear interest at a base rate equal to either one, two, three, six, nine or twelve-month LIBOR plus the applicable margin, or an alternative base rate (“ABR”) plus the applicable margin. The ABR is equal to the greater of the prime rate or the effective federal funds rate plus 1/2 of 1.00% for the 2013 Term Loans and the greater of the prime rate, effective federal funds rate plus 1/2 of 1.00%, or 2.50% for the 2015 Term Loans and the 2017 Term Loans. The senior secured credit facilities are subject to certain financial and nonfinancial covenants. As of June 30, 2011 and December 31, 2010, the Company was in compliance with such covenants. The Company may voluntarily repay outstanding loans under its senior secured credit facilities at any time without premium or penalty, other than customary “breakage” costs with respect to LIBOR loans.
On January 31, 2011, the Company repaid $40.0 million of term loans under its senior secured credit facilities using net proceeds received in its initial public offering, which was completed in the fourth quarter of 2010, as well as other cash on hand.
Senior Secured Credit Facilities — Revolving Line of Credit— On January 25, 2010, the Company amended its senior secured credit facilities to increase the revolving credit facility from $100.0 million to $218.2 million, $10.0 million of which is being used to support the issuance of an irrevocable letter of credit for its subsidiary, The Private Trust Company, N.A. (“PTC”). As a result of the amendment, the Company paid $2.8 million in debt issuance costs, which have been capitalized within the unaudited condensed consolidated statements of financial condition and are being amortized as additional interest expense over the expected term of the related debt agreement. The Company also extended the maturity of a $163.5 million tranche of the revolving credit facility to June 28, 2013, while the remaining $54.7 million
14
tranche retains its original maturity date of December 28, 2011. The tranche maturing in 2013 is priced at LIBOR + 3.50% with a commitment fee of 0.75%. The tranche maturing in 2011 maintains its previous pricing of LIBOR + 2.00% with a commitment fee of 0.375%. There was no outstanding balance on the revolving facility at June 30, 2011 or December 31, 2010.
Bank Loans Payable— The Company maintains three uncommitted lines of credit. Two of the lines have an unspecified limit, and are primarily dependent on the Company’s ability to provide sufficient collateral. The other line has a $150.0 million limit and allows for both collateralized and uncollateralized borrowings. The lines were utilized in 2011 and 2010; however, there were no balances outstanding at June 30, 2011 or December 31, 2010.
The Company’s outstanding borrowings were as follows (in thousands):
| | | | | | | | | | | | | | | | | | | | | |
| | | | | | | June 30, 2011 | | December 31, 2010 |
| | | | | | | | | | | Interest | | | | | | Interest |
| | | Maturity | | Balance | | Rate | | Balance | | Rate |
| Senior secured term loan: | | | | | | | | | | | | | | | | | | | | |
| Hedged with interest rate swaps | | | 6/28/2013 | | | $ | 65,000 | | | | 2.00 | %(1) | | $ | 210,000 | | | | 2.05 | %(5) |
| Unhedged: | | | | | | | | | | | | | | | | | | | | |
| 2013 Term Loans | | | 6/28/2013 | | | | 239,074 | | | | 1.94 | %(2) | | | 104,739 | | | | 2.01 | %(6) |
| 2015 Term Loans | | | 6/25/2015 | | | | 479,435 | | | | 4.25 | %(3) | | | 496,250 | | | | 4.25 | %(7) |
| 2017 Term Loans | | | 6/28/2017 | | | | 556,144 | | | | 5.25 | %(4) | | | 575,650 | | | | 5.25 | %(8) |
| | | | | | | | | | | | | | | | | | | |
| Total borrowings | | | | | | | 1,339,653 | | | | | | | | 1,386,639 | | | | | |
| Less current borrowings (maturities within 12 months) | | | | | | | 13,971 | | | | | | | | 13,971 | | | | | |
| | | | | | | | | | | | | | | | | | | |
| Long-term borrowings — net of current portion | | | | | | $ | 1,325,682 | | | | | | | $ | 1,372,668 | | | | | |
| | | | | | | | | | | | | | | | | | | |
| | |
| (1) | | As of June 30, 2011, the variable interest rate for the hedged portion of the 2013 Term Loans is based on the three-month LIBOR of 0.25%, plus the applicable interest rate margin of 1.75%. |
| |
| (2) | | As of June 30, 2011, the variable interest rate for the unhedged portion of the 2013 Term Loans is based on the one-month LIBOR of 0.19%, plus the applicable interest rate margin of 1.75%. |
| |
| (3) | | As of June 30, 2011, the variable interest rate for the unhedged portion of the 2015 Term Loans is based on the greater of the one-month LIBOR of 0.19% or 1.50%, plus the applicable interest rate margin of 2.75%. |
| |
| (4) | | As of June 30, 2011, the variable interest rate for the unhedged portion of the 2017 Term Loans is based on the greater of the one-month LIBOR of 0.19% or 1.50%, plus the applicable interest rate margin of 3.75%. |
| |
| (5) | | As of December 31, 2010, the variable interest rate for the hedged portion of the 2013 Term Loans is based on the three-month LIBOR of 0.30%, plus the applicable interest rate margin of 1.75%. |
| |
| (6) | | As of December 31, 2010, the variable interest rate for the unhedged portion of the 2013 Term Loans is based on the one-month LIBOR of 0.26%, plus the applicable interest rate margin of 1.75%. |
| |
| (7) | | As of December 31, 2010, the variable interest rate for the unhedged portion of the 2015 Term Loans is based on the greater of the one-month LIBOR of 0.26% or 1.50%, plus the applicable interest rate margin of 2.75%. |
| |
| (8) | | As of December 31, 2010, the variable interest rate for the unhedged portion of the 2017 Term Loans is based on the greater of the one-month LIBOR of 0.26% or 1.50%, plus the applicable interest rate margin of 3.75%. |
The average balance outstanding in the revolving and uncommitted line of credit facilities was approximately six thousand dollars and forty thousand dollars for the three months ended June 30, 2011 and 2010, respectively, and approximately six thousand dollars and $4.1 million for the six months ended June 30, 2011 and 2010, respectively. The weighted-average interest rate was 0.82% and 1.50% for the three months ended June 30, 2011, and 2010, respectively, and 1.16% and 1.16% for the six months ended June 30, 2011, and 2010, respectively.
15
The minimum calendar year payments and maturities of the senior secured borrowings as of June 30, 2011 are as follows (in thousands):
| | | | | |
|
| 2011 — remainder | | $ | 6,986 | |
| 2012 | | | 13,971 | |
| 2013 | | | 310,117 | |
| 2014 | | | 10,800 | |
| 2015 | | | 467,735 | |
| Thereafter | | | 530,044 | |
| | | | |
| Total | | $ | 1,339,653 | |
| | | | |
10. Interest Rate Swaps
An interest rate swap is a financial derivative instrument whereby two parties enter into a contractual agreement to exchange payments based on underlying interest rates. The Company uses interest rate swaps to hedge the variability on its floating rate senior secured term loan. The Company is required to pay the counterparty to the agreement fixed interest payments on a notional balance and in turn, receives variable interest payments on that notional balance. Payments are settled quarterly on a net basis.
At June 30, 2011, the Company has an interest rate swap with a notional balance of $65.0 million and a fair value of $2.8 million that carries a fixed pay rate of 4.85% and has a variable receive rate of 0.25%, with a maturity date of June 30, 2012. The effective rate from March 31, 2011 through June 29, 2011 was 0.31%, and the rate resets on the last day of the period. The Company had another interest rate swap with a notional balance of $145.0��million that matured on June 30, 2011.
The interest rate swap qualifies for hedge accounting and has been designated by the Company as a cash flow hedge against specific payments due on its senior secured term loan. As of June 30, 2011, the Company assessed the interest rate swap as being highly effective and expects it to continue to be highly effective. Accordingly, the changes in fair value of the interest rate swap have been recorded as other comprehensive loss, with the fair value included as a liability on the Company’s unaudited condensed consolidated statements of financial condition. The Company has recorded net unrealized gains of $4.4 million and $6.4 million for the three months ended June 30, 2011 and 2010, respectively, and $6.6 million and $9.5 million for the six months ended June 30, 2011 and 2010, respectively, to accumulated other comprehensive loss related to the change in fair value. The Company has reclassified $2.4 million and $4.3 million to interest expense from accumulated other comprehensive loss for the three months ended June 30, 2011, and 2010, respectively. For the six months ended June 30, 2011, and 2010, respectively, the Company reclassified $4.8 million and $8.7 million to interest expense from accumulated other comprehensive loss. Based on current interest rate assumptions and assuming no additional interest rate swap agreements are entered into, the Company expects to reclassify $3.0 million or $1.8 million after tax, from other comprehensive loss as additional interest expense over the next 12 months.
11. Commitments and Contingencies
Leases— The Company leases certain office space and equipment at its headquarter and other locations under various operating leases. These leases are generally subject to scheduled base rent and maintenance cost increases, which are recognized on a straight-line basis over the period of the leases.
Service Contracts— The Company is party to certain long-term contracts for systems and services that enable back office trade processing and clearing for its product and service offerings. One agreement, for clearing services, contains no minimum annual purchase commitment, but the agreement provides for certain penalties should the Company fail to maintain a certain threshold of client accounts.
Future minimum payments under leases, lease commitments and other noncancellable contractual obligations with remaining terms greater than one year as of June 30, 2011 are as follows (in thousands):
| | | | | |
|
| 2011 — remainder | | $ | 15,348 | |
| 2012 | | | 25,049 | |
| 2013 | | | 15,948 | |
| 2014 | | | 9,304 | |
| 2015 | | | 7,030 | |
| Thereafter | | | 7,693 | |
| | | | |
| Total(1) | | $ | 80,372 | |
| | | | |
| | |
| (1) | | Minimum payments have not been reduced by minimum sublease rental income of $6.4 million due in the future under noncancellable subleases. |
16
Total rental expense for all operating leases was $4.5 million and $4.1 million for the three months ended June 30, 2011 and 2010, respectively, and $8.6 million and $8.5 million for the six months ended June 30, 2011 and 2010, respectively.
Guarantees— The Company occasionally enters into certain types of contracts that contingently require it to indemnify certain parties against third-party claims. The terms of these obligations vary and, because a maximum obligation is not explicitly stated, the Company has determined that it is not possible to make an estimate of the amount that it could be obligated to pay under such contracts.
Through its subsidiary LPL Financial, the Company provides guarantees to securities clearing houses and exchanges under their standard membership agreements, which require a member to guarantee the performance of other members. Under these agreements, if a member becomes unable to satisfy its obligations to the clearing houses and exchanges, all other members would be required to meet any shortfall. The Company’s liability under these arrangements is not quantifiable and may exceed the cash and securities it has posted as collateral. However, the potential requirement for the Company to make payments under these agreements is remote. Accordingly, no liability has been recognized for these transactions.
Loan Commitments— From time to time, the Company makes loans to its advisors, primarily to newly recruited advisors to assist in the transition process. Due to timing differences, the Company may make commitments to issue such loans prior to actually funding them. These commitments are generally contingent upon certain events occurring, including but not limited to the advisor joining the Company, and may be forgivable. The Company had no significant unfunded commitments at June 30, 2011.
Litigation— The Company has been named as a defendant or respondent in various legal actions, including arbitrations. In view of the inherent difficulty of predicting the outcome of such matters, particularly in cases in which claimants seek substantial or indeterminate damages, the Company is unable to predict what the eventual loss or range of loss related to such matters will be. The Company recognizes a legal liability when it believes it is probable a liability has occurred and the amount can be reasonably estimated. Defense costs are expensed as incurred and classified as professional services within the unaudited condensed consolidated statements of operations. When there is indemnification or insurance for legal actions, the Company may defend or settle such matters and subsequently seek reimbursement.
In connection with various acquisitions, and pursuant to the purchase and sale agreements, the Company has received third-party indemnification for certain legal proceedings and claims. These matters have been defended and paid directly by the indemnifying party.
On October 1, 2009, the Company’s subsidiary, LPL Holdings, Inc. (“LPLH”), received written notice from a third-party indemnitor under a certain purchase and sale agreement asserting that it is no longer obligated to indemnify the Company for certain claims under the provisions of the purchase and sale agreement. The Company believed that this assertion was without merit and commenced litigation to enforce its indemnity rights. On March 31, 2011, the court entered judgment granting the Company’s motion for summary judgment in all respects, denied all counterclaims by the third party indemnitor and awarded attorney fees to the Company. On May 2, 2011, the third party indemnitor filed a notice of appeal.
During the third quarter of 2010, the Company settled two arbitrations that involve activities covered under the third-party indemnification agreement described above. In connection with these settlements, the Company recorded a receivable from the indemnifying party of $8.9 million that has been fully reserved pending resolution of the litigation described above. The remaining claims outstanding for which the indemnifying party is disputing its obligation involve alleged damages that are not material to the Company’s unaudited condensed consolidated statements of financial condition, operations or cash flows.
The Company believes, based on the information available at this time, after consultation with counsel, consideration of insurance, if any, and indemnifications provided by the third-party indemnitors, notwithstanding the assertions by an
17
indemnifying party noted in the preceding paragraphs, that the outcomes will not have a material adverse impact on unaudited condensed consolidated statements of financial condition, operations or cash flows.
Other Commitments— As of June 30, 2011, the Company had received collateral primarily in connection with client margin loans with a market value of approximately $352.8 million, which it can sell or repledge. Of this amount, approximately $171.5 million has been pledged or sold as of June 30, 2011; $140.8 million was pledged to banks in connection with unutilized secured margin lines of credit, $14.6 million was pledged to the Options Clearing Corporation, and $16.1 million was loaned to the Depository Trust Company (“DTC”) through participation in its Stock Borrow Program. As of December 31, 2010, the Company had received collateral primarily in connection with client margin loans with a market value of approximately $326.9 million, which it can sell or repledge. Of this amount, approximately $167.4 million has been pledged or sold as of December 31, 2010; $145.8 million was pledged to banks in connection with unutilized secured margin lines of credit, $13.5 million was pledged to the Options Clearing Corporation, and $8.1 million was loaned to the DTC through participation in its Stock Borrow Program.
LPL Financial provides a large global insurance company with brokerage, clearing and custody services on a fully disclosed basis; offers its investment advisory programs and platforms; and provides technology and additional processing and related services to its advisors and their clients. The agreements were entered into in 2006 with five year terms, subject to additional 24-month extensions upon mutual agreement by the parties. Termination fees may be payable by a terminating or breaching party depending on the specific cause of termination.
12. Share-Based Compensation
Stock Options and Warrants
Certain employees, advisors, institutions, officers and directors who contribute to the success of the Company participate in the 2010 Omnibus Equity Incentive Plan. Stock options and warrants generally vest in equal increments over a five-year period and expire on the 10th anniversary following the date of grant.
The Company recognizes share-based compensation expense related to employee stock option awards based on the grant date fair value over the requisite service period of the award, which generally equals the vesting period. The Company recognized share-based compensation related to the vesting of employee stock option awards of $3.3 million and $2.3 million during the three months ended June 30, 2011 and 2010, respectively, and $7.1 million and $4.8 million during the six months ended June 30, 2011 and 2010, respectively, which is included in compensation and benefits on the unaudited condensed consolidated statements of operations. As of June 30, 2011, total unrecognized compensation cost related to non-vested share-based compensation arrangements granted was $46.2 million, which is expected to be recognized over a weighted-average period of 3.77 years.
The following table presents the weighted-average assumptions used by the Company in calculating the fair value of its employee stock options with the Black-Scholes valuation model that have been granted during the six months ended June 30, 2011 and 2010:
| | | | | | | | | |
| | | 2011 | | 2010 |
| Expected life (in years) | | | 6.50 | | | | 6.50 | |
| Expected stock price volatility | | | 48.61 | % | | | 50.30 | % |
| Expected dividend yield | | | — | | | | — | |
| Fair value of options | | $ | 17.54 | | | $ | 12.31 | |
| Risk-free interest rate | | | 2.58 | % | | | 2.79 | % |
The Company recognizes share-based compensation expense for stock options and warrants awarded to its advisors and financial institutions based on the fair value of awards at each interim reporting period. The Company recognized share-based compensation of $0.9 million and $2.2 million during the three months ended June 30, 2011, and 2010, respectively, and $1.9 million and $2.8 million during the six months ended June 30, 2011 and 2010, respectively, related to the vesting of stock options and warrants awarded to its advisors and financial institutions, which is classified within commission and advisory fees on the unaudited condensed consolidated statements of operations. As of June 30, 2011, total unrecognized compensation cost related to non-vested share-based compensation arrangements granted was $17.1 million for advisors and financial institutions, which is based on the fair value of the awards as of June 30, 2011, and is expected to be recognized over a weighted-average period of 3.64 years.
18
The following table presents the weighted-average assumptions used by the Company in calculating the fair value of its advisor stock options and financial institution warrants with the Black-Scholes valuation model that have been granted during the six months ended June 30, 2011 and 2010:
| | | | | | | | | |
| | | 2011 | | 2010 |
| Expected life (in years) | | | 9.82 | | | | 9.70 | |
| Expected stock price volatility | | | 49.54 | % | | | 53.18 | % |
| Expected dividend yield | | | — | | | | — | |
| Fair value of options | | $ | 23.09 | | | $ | 25.40 | |
| Risk-free interest rate | | | 3.50 | % | | | 3.18 | % |
The risk-free interest rates are based on the implied yield available on U.S. Treasury constant maturities in effect at the time of the grant with remaining terms equivalent to the respective expected terms of the options. The dividend yield of zero is based on the fact that the Company has no present intention to pay cash dividends. The Company estimates the expected term for its employee option awards using the simplified method in accordance with Staff Accounting Bulletin 110,Certain Assumptions Used in Valuation Methods, because the Company does not have sufficient relevant historical information to develop reasonable expectations about future exercise patterns. The Company estimates the expected term for stock options and warrants awarded to advisors and financial institutions using the contractual term. Expected volatility is calculated based on companies of similar growth and maturity and the Company’s peer group in the industry in which the Company does business because the Company does not have sufficient historical volatility data. The Company will continue to use peer group volatility information until historical volatility of the Company is available to measure expected volatility for future grants. In the future, as the Company gains historical data for volatility of its own stock and the actual term over which stock options and warrants are held, expected volatility and the expected term may change, which could substantially change the grant-date fair value of future awards of stock options and warrants and, ultimately, compensation recorded on future grants.
The Company has assumed an annualized forfeiture rate for its stock options and warrants based on a combined review of industry, employee and advisor turnover data, as well as an analytical review performed of historical pre-vesting forfeitures occurring over the previous year. The Company records additional expense if the actual forfeiture rate is lower than estimated and records a recovery of prior expense if the actual forfeiture is higher than estimated.
The following table summarizes the Company’s activity in its stock option and warrant plans for the six months ended June 30, 2011:
| | | | | | | | | | | | | | | | | |
| | | | | | | | | | | Weighted- | | |
| | | | | | | | | | | Average | | |
| | | | | | | Weighted- | | Remaining | | Aggregate |
| | | Number | | Average | | Contractual | | Intrinsic |
| | | of | | Exercise | | Term | | Value |
| | | Shares | | Price | | (Years) | | (In thousands) |
| Outstanding — December 31, 2010 | | | 10,279,052 | | | $ | 18.12 | | | | | | | | | |
| Granted | | | 603,312 | | | | 34.10 | | | | | | | | | |
| Exercised | | | (1,401,211 | ) | | | 4.73 | | | | | | | | | |
| Forfeited and expired | | | (323,997 | ) | | | 26.29 | | | | | | | | | |
| | | | | | | | | | | | | | | |
| Outstanding — June 30, 2011 | | | 9,157,156 | | | $ | 20.94 | | | | 6.84 | | | $ | 121,558 | |
| | | | | | | | | | | | | | | |
| Exercisable — June 30, 2011 | | | 3,957,985 | | | $ | 12.03 | | | | 4.59 | | | $ | 87,788 | |
| | | | | | | | | | | | | | | |
The following table summarizes information about outstanding stock options and warrants:
| | | | | | | | | | | | | | | | | | | | | |
| | | Outstanding | | Exercisable |
| | | | | | | Weighted- | | Weighted- | | | | | | Weighted- |
| | | Total | | Average | | Average | | | | | | Average |
| | | Number of | | Remaining | | Exercise | | Number of | | Exercise |
| Range of Exercise Prices | | Shares | | Life (Years) | | Price | | Shares | | Price |
| At June 30, 2011: | | | | | | | | | | | | | | | | | | | | |
| $1.35 — $2.38 | | | 2,142,833 | | | | 2.56 | | | $ | 1.68 | | | | 2,142,833 | | | $ | 1.68 | |
| $10.30 — $19.74 | | | 797,549 | | | | 7.45 | | | | 18.46 | | | | 261,337 | | | | 17.58 | |
| $21.60 — $22.08 | | | 1,926,425 | | | | 7.92 | | | | 22.02 | | | | 522,195 | | | | 21.90 | |
| $23.02 — $27.80 | | | 2,049,769 | | | | 7.07 | | | | 26.52 | | | | 1,031,620 | | | | 27.11 | |
| $30.00 — $34.79 | | | 2,240,580 | | | | 9.52 | | | | 34.19 | | | | — | | | | — | |
| | | | | | | | | | | | | | | | | | | |
| | | | 9,157,156 | | | | 6.83 | | | $ | 20.94 | | | | 3,957,985 | | | $ | 12.03 | |
| | | | | | | | | | | | | | | | | | | |
19
Nonqualified Deferred Compensation Plan
On November 19, 2008, the Company established an unfunded, unsecured deferred compensation plan to permit employees and former employees who held non-qualified stock options issued under the 2005 Stock Option Plan for Incentive Stock Options and 2005 Stock Option Plan for Non-qualified Stock Options that were to expire in 2009 and 2010, to receive stock units under the 2008 Nonqualified Deferred Compensation Plan. Stock units represent the right to receive one share of common stock. Distribution will occur at the earliest of (a) a date in 2012 to be determined by the Board of Directors; (b) a change in control of the Company; or (c) death or disability of the participant. Issuance of stock units, which occurred in December 2008, is not taxable for federal and state income tax purposes until the participant receives a distribution under the deferred compensation plan. At June 30, 2011, the Company had 2,823,452 stock units outstanding under the 2008 Nonqualified Deferred Compensation Plan.
Restricted Stock Awards
The Company grants restricted stock awards under its 2010 Omnibus Equity Incentive Plan to its non-employee directors who are in a position to make a significant contribution to the success of the Company. Restricted stock awards vest on the second anniversary of the date of grant and upon termination of service, unvested awards shall immediately be forfeited. On March 4, 2011, the Company issued 12,104 shares of restricted stock awards to certain of its directors at a fair value of $33.05 per share.
A summary of the status of the Company’s restricted stock awards as of and for the six months ending June 30, 2011 was as follows:
| | | | | | | | | |
| | | | | | | Weighted Average |
| | | Number of | | Grant-Date |
| | | Shares | | Fair Value |
| Nonvested at January 1, 2011 | | | 10,692 | | | | $ 28.30 | |
| Granted | | | 12,104 | | | | 33.05 | |
| Vested | | | — | | | | — | |
| Forfeited | | | — | | | | — | |
| | | | | | | | | |
| Nonvested at June 30, 2011 | | | 22,796 | | | | $ 30.82 | |
| | | | | | | | | |
The Company accounts for restricted stock awards granted to its non-employee directors by measuring such awards at their grant date fair value. Share-based compensation expense is recognized ratably over the requisite service period, which generally equals the vesting period. Based upon the Company’s history of termination of non-employee directors, management has assumed zero forfeitures for restricted stock awards. The Company recognized $0.1 million of share-based compensation related to the vesting of restricted stock awards granted to its directors during the six months ended June 30, 2011, which is included in compensation and benefits on the unaudited condensed consolidated statements of operations. As of June 30, 2011, total unrecognized compensation cost was $0.5 million, which is expected to be recognized over a weighted-average remaining period of 1.48 years.
Share Repurchase Program
On May 25, 2011, the Board of Directors approved a share repurchase program pursuant to which the Company may repurchase up to $80.0 million of its issued and outstanding shares of common stock through May 31, 2013. The purchases will be effected in open market transactions with the timing of purchases and the amount of stock purchased determined at the discretion of the Company’s management.
As of June 30, 2011, the Company repurchased 2,283,854 shares of common stock at a weighted-average price of $34.84 per share for an aggregate purchase price of $79.6 million.
Share Reservations
As of June 30, 2011, the Company had approximately 9.8 million authorized unissued shares reserved for issuance upon exercise and conversion of outstanding awards.
20
13. Earnings Per Share
In calculating earnings per share using the two-class method, the Company is required to allocate a portion of its earnings to employees that hold stock units that contain non-forfeitable rights to dividends or dividend equivalents under its 2008 Nonqualified Deferred Compensation Plan. Basic earnings per share is computed by dividing income less earnings attributable to employees that hold stock units under the 2008 Nonqualified Deferred Compensation Plan by the basic weighted average number of shares outstanding. Diluted earnings per share is computed in a manner similar to basic earnings per share, except the weighted average number of shares outstanding is increased to include the dilutive effect of outstanding stock options, warrants and other stock-based awards.
A reconciliation of the income used to compute basic and diluted earnings per share for the periods noted was as follows (in thousands):
| | | | | | | | | | | | | | | | | |
| | | For the Three | | | For the Six | |
| | | Months Ended | | | Months Ended | |
| | | June 30, | | | June 30, | |
| | | 2011 | | | 2010 | | | 2011 | | | 2010 | |
| Basic earnings per share: | | | | | | | | | | | | | | | | |
| Net income, as reported | | $ | 45,507 | | | $ | 8,000 | | | $ | 94,506 | | | $ | 33,554 | |
| Less: allocation of undistributed earnings to stock units | | | (582 | ) | | | (130 | ) | | | (1,212 | ) | | | (544 | ) |
| | | | | | | | | | | | | |
| Net income, for computing basic earnings per share | | $ | 44,925 | | | $ | 7,870 | | | $ | 93,294 | | | $ | 33,010 | |
| | | | | | | | | | | | | |
| Diluted earnings per share: | | | | | | | | | | | | | | | | |
| Net income, as reported | | $ | 45,507 | | | $ | 8,000 | | | $ | 94,506 | | | $ | 33,554 | |
| Less: allocation of undistributed earnings to stock units | | | (561 | ) | | | (113 | ) | | | (1,167 | ) | | | (477 | ) |
| | | | | | | | | | | | | |
| Net income, for computing diluted earnings per share | | $ | 44,946 | | | $ | 7,887 | | | $ | 93,339 | | | $ | 33,077 | |
| | | | | | | | | | | | | |
A reconciliation of the weighted average number of shares outstanding used to compute basic and diluted earnings per share for the periods noted was as follows (in thousands):
| | | | | | | | | | | | | | | | | |
| | | For the Three | | For the Six |
| | | Months Ended | | Months Ended |
| | | June 30, | | June 30, |
| | | 2011 | | 2010 | | 2011 | | 2010 |
| Basic weighted average number of shares outstanding | | | 109,055 | | | | 86,812 | | | | 108,932 | | | | 86,806 | |
| Dilutive common share equivalents | | | 4,095 | | | | 12,675 | | | | 4,223 | | | | 12,442 | |
| | | | | | | | | | | | | |
| Diluted weighted average number of shares outstanding | | | 113,150 | | | | 99,487 | | | | 113,155 | | | | 99,248 | |
| | | | | | | | | | | | | |
Basic and diluted earnings per share for the periods noted were as follows:
| | | | | | | | | | | | | | | | | |
| | | For the Three | | | For the Six | |
| | | Months Ended | | | Months Ended | |
| | | June 30, | | | June 30, | |
| | | 2011 | | | 2010 | | | 2011 | | | 2010 | |
| Basic earnings per share | | $ | 0.41 | | | $ | 0.09 | | | $ | 0.86 | | | $ | 0.38 | |
| Diluted earnings per share | | $ | 0.40 | | | $ | 0.08 | | | $ | 0.82 | | | $ | 0.33 | |
The computation of diluted earnings per share excluded stock options and warrants to purchase 2,975,485 shares and 3,067,470 shares for the three months ended June 30, 2011 and 2010, respectively, and 3,181,435 shares and 3,264,780 shares for the six months ended June, 30 2011 and 2010, respectively, because the effect would have been anti-dilutive.
14. Related Party Transactions
One of the Company’s majority stockholders owns a minority interest in Artisan Partners Limited Partnership (“Artisan”), which pays fees in exchange for product distribution and record-keeping services. During the six months ended June 30, 2011 and 2010, the Company earned $1.5 million and $1.2 million, respectively, in fees from Artisan. Additionally, as of June 30, 2011 and December 31, 2010, Artisan owed the Company $0.8 million and $0.6 million, respectively, which is included in receivables from product sponsors, broker-dealers and clearing organizations on the unaudited condensed consolidated statements of financial condition.
21
One of the Company’s majority stockholders owns a minority interest in XOJET, Inc. (“XOJET”), which provides chartered aircraft services. The Company paid $1.0 million and $0.9 million to XOJET for chartered aircraft services during the six months ended June 30, 2011 and 2010 respectively. For 2011, $0.5 million was incurred in the first quarter for travel to advisor conferences.
Aplifi, Inc. (formerly named Blue Frog Solutions, Inc.) (“Aplifi”), a privately held technology company in which the Company holds an equity interest, provides software licensing for annuity order entry and compliance. The Company paid $1.0 million and $0.9 million to Aplifi for such services during the six months ended June 30, 2011 and 2010, respectively. As of December 31, 2010, the Company had payables to Aplifi of $0.7 million, which is included in accounts payable and accrued liabilities on the unaudited condensed consolidated statements of financial condition.
An immediate family member of one of the Company’s executive officers, is an executive officer of CresaPartners LLC (“CresaPartners”). CresaPartners provides the Company and its subsidiaries real estate advisory, transaction and project management services. The Company paid $0.3 million to CresaPartners during the six months ended June 30, 2011.
15. Net Capital/Regulatory Requirements
The Company’s registered broker-dealers are subject to the SEC’s Uniform Net Capital Rule (Rule 15c3-1 under the Exchange Act), which requires the maintenance of minimum net capital, as defined. Net capital is calculated for each broker-dealer subsidiary individually. Excess net capital of one broker-dealer subsidiary may not be used to offset a net capital deficiency of another broker-dealer subsidiary. Net capital and the related net capital requirement may fluctuate on a daily basis.
Net capital and net capital requirements for the Company’s broker-dealer subsidiaries as of June 30, 2011 are presented in the following table (in thousands):
| | | | | | | | | | | | | |
| | | | | | | Minimum | | |
| | | Net | | Net Capital | | Excess Net |
| | | Capital | | Required | | Capital |
| LPL Financial LLC | | $ | 92,999 | | | $ | 6,412 | | | $ | 86,587 | |
| UVEST Financial Services Group, Inc. | | $ | 23,781 | | | $ | 1,283 | | | $ | 22,498 | |
LPL Financial is a clearing broker-dealer and UVEST is an introducing broker-dealer.
In connection with the Company’s 2009 initiative that consolidated Associated Securities Corp. (“Associated”), Mutual Service Corporation (“MSC”) and Waterstone Financial Group, Inc. (“WFG”), (together, the “Affiliated Entities”) with LPL Financial, Associated and WFG have withdrawn their registration with the Financial Industry Regulatory Authority effective February 5, 2011, and are no longer subject to net capital filing requirements. At June 30, 2011, MSC had net capital of $8.0 million, which was $7.7 million in excess of its minimum required net capital.
PTC is also subject to various regulatory capital requirements. Failure to meet minimum capital requirements can initiate certain mandatory and possible additional discretionary actions by regulators that, if undertaken, could have a direct material effect on the Company’s unaudited condensed consolidated financial statements. As of June 30, 2011 and December 31, 2010, the Company’s registered broker-dealers and PTC have met all capital adequacy requirements to which they are subject.
The Company operates in a highly regulated industry. Applicable laws and regulations restrict permissible activities and investments. These policies require compliance with various financial and customer-related regulations. The consequences of noncompliance can include substantial monetary and nonmonetary sanctions. In addition, the Company is also subject to comprehensive examinations and supervision by various governmental and self-regulatory agencies. These regulatory agencies generally have broad discretion to prescribe greater limitations on the operations of a regulated entity for the protection of investors or public interest. Furthermore, where the agencies determine that such operations are unsafe or unsound, fail to comply with applicable law, or are otherwise inconsistent with the laws and regulations or with the supervisory policies, greater restrictions may be imposed.
22
16. Financial Instruments with Off-Balance-Sheet Credit Risk and Concentrations of Credit Risk
LPL Financial’s client securities activities are transacted on either a cash or margin basis. In margin transactions, LPL Financial extends credit to the client, subject to various regulatory and internal margin requirements, collateralized by cash and securities in the client’s account. As clients write options contracts or sell securities short, LPL Financial may incur losses if the clients do not fulfill their obligations and the collateral in the clients’ accounts is not sufficient to fully cover losses that clients may incur from these strategies. To control this risk, LPL Financial monitors margin levels daily and clients are required to deposit additional collateral, or reduce positions, when necessary.
LPL Financial is obligated to settle transactions with brokers and other financial institutions even if its clients fail to meet their obligation to LPL Financial. Clients are required to complete their transactions on the settlement date, generally three business days after the trade date. If clients do not fulfill their contractual obligations, LPL Financial may incur losses. LPL Financial has established procedures to reduce this risk by generally requiring that clients deposit cash and/or securities into their account prior to placing an order.
LPL Financial may at times hold equity securities on both a long and short basis that are recorded on the unaudited condensed consolidated statements of financial condition at market value. While long inventory positions represent LPL Financial’s ownership of securities, short inventory positions represent obligations of LPL Financial to deliver specified securities at a contracted price, which may differ from market prices prevailing at the time of completion of the transaction. Accordingly, both long and short inventory positions may result in losses or gains to LPL Financial as market values of securities fluctuate. To mitigate the risk of losses, long and short positions are marked-to-market daily and are continuously monitored by LPL Financial.
UVEST is engaged in buying and selling securities and other financial instruments for clients of advisors. Such transactions are introduced and cleared through a third-party clearing firm on a fully disclosed basis. While introducing broker-dealers generally have less risk than clearing firms, their clearing agreements expose them to credit risk in the event that their clients don’t fulfill contractual obligations with the clearing broker-dealer.
23
Item 2.Management’s Discussion and Analysis of Financial Condition and Results of Operations
Overview
We provide an integrated platform of proprietary technology, brokerage and investment advisory services to over 12,600 independent financial advisors and financial advisors at financial institutions (our “advisors”) across the country, enabling them to successfully service their retail investors with unbiased, conflict-free financial advice. In addition, we support over 4,000 financial advisors with customized clearing, advisory platforms and technology solutions. Our singular focus is to support our advisors with the front, middle and back-office support they need to serve the large and growing market for independent investment advice, particularly in the mass affluent market. We believe we are the only company that offers advisors the unique combination of an integrated technology platform, comprehensive self-clearing services and full open architecture access to leading financial products, all delivered in an environment unencumbered by conflicts from product manufacturing, underwriting or market making.
For over 20 years we have served the independent advisor market. We currently support the largest independent advisor base and we believe we have the fourth largest overall advisor base in the United States as of June 30, 2011. Through our advisors, we are also one of the largest distributors of financial products in the United States. Our scale is a substantial competitive advantage and enables us to more effectively attract and retain advisors. Our unique model allows us to invest more resources in our advisors, increasing their revenues and creating a virtuous cycle of growth. We are headquartered in Boston and currently have approximately 2,700 employees across our locations in Boston, Charlotte and San Diego.
Our Sources of Revenue
Our revenues are derived primarily from fees and commissions from products and advisory services offered by our advisors to their clients, a substantial portion of which we pay out to our advisors, as well as fees we receive from our advisors for use of our technology, custody and clearing platforms. We also generate asset-based fees through the distribution of financial products for a broad range of product manufacturers. Under our self-clearing platform, we custody the majority of client assets invested in these financial products, which includes providing statements, transaction processing and ongoing account management. In return for these services, mutual funds, insurance companies, banks and other financial product manufacturers pay us fees based on asset levels or number of accounts managed. We also earn fees for margin lending to our advisors’ clients.
We track recurring revenue, which we define to include our revenues from asset-based fees, advisory fees, our trailing commissions, cash sweep programs and certain transaction and other fees that are based upon accounts and advisors. Because recurring revenue is associated with asset balances, it will fluctuate depending on the market value of the asset balances and current interest rates. Accordingly, recurring revenue can be negatively impacted by adverse external market conditions. However, recurring revenue is meaningful to us despite these fluctuations because it is not based on transaction volumes or other activity-based fees, which are more difficult to predict, particularly in declining or volatile markets.
24
The table below summarizes the sources of our revenue and the underlying drivers:
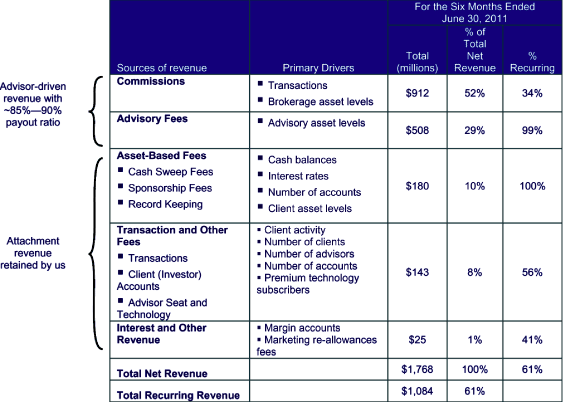
| • | | Commissions and Advisory Fees.Transaction-based commissions and advisory fees both represent advisor-generated revenue, generally 85-90% of which is paid to advisors. |
| |
| | | Commissions.Transaction-based commission revenues represent gross commissions generated by our advisors, primarily from commissions earned on the sale of various financial products such as fixed and variable annuities, mutual funds, general securities, fixed income, alternative investments and insurance and can vary from period to period based on the overall economic environment, number of trading days in the reporting period and investment activity of our advisors’clients. We also earn trailing commission type revenues (a commission that is paid over time, such as 12(b)-1 fees) on mutual funds and variable annuities held by clients of our advisors. Trail commissions are recurring in nature and are earned based on the current market value of investment holdings. |
| |
| | | Advisory Fees.Advisory fee revenues represent fees charged by us and our advisors to their clients based on the value of advisory assets. Advisory fees are typically billed to clients quarterly, in advance, and are recognized as revenue ratably during the quarter. The value of the assets in the advisory account or the billing date determines the amount billed, and accordingly, the revenues earned in the following three month period. The majority of our accounts are billed using values as of the last business day of the quarter. Some of our advisors conduct their advisory business through separate entities by establishing their own Registered Investment Advisor (“RIA”) pursuant to the Investment Advisers Act of 1940, rather than using our corporate registered RIA. These stand-alone RIAs engage us for technology, clearing, regulatory and custody services, as well as access to our investment advisory platforms. The fee-based production generated by the stand-alone RIA is earned by the advisor, and accordingly not included in our advisory fee revenue. We charge fees to stand-alone RIAs including administrative fees based on the value of assets within these advisory accounts. Such fees are included within asset-based fees and transaction and other fees, as described below. |
25
| • | | Asset-Based Fees.Asset-based fees are comprised of fees from cash sweep programs, our financial product manufacturer sponsorship programs, and omnibus processing and networking services. Pursuant to contractual arrangements, uninvested cash balances in our advisors’ client accounts are swept into either insured deposit accounts at various banks or third-party money market funds, for which we receive fees, including administrative and record-keeping fees based on account type and the invested balances. In addition, we receive fees from certain financial product manufacturers in connection with sponsorship programs that support our marketing and sales-force education and training efforts. We also earn fees on mutual fund assets for which we provide administrative and record-keeping services. Our networking fees represent fees paid to us by mutual fund and annuity product manufacturers in exchange for administrative and record-keeping services that we provide to clients of our advisors. Networking fees are correlated to the number of positions we administer, not the value of assets under administration. |
| |
| • | | Transaction and Other Fees.Revenues earned from transaction and other fees primarily consist of transaction fees and ticket charges, subscription fees, Individual Retirement Account (“IRA”) custodian fees, contract and license fees, conference fees and small/inactive account fees. We charge fees to our advisors and their clients for executing transactions in brokerage and fee-based advisory accounts. We earn subscription fees for the software and technology services provided to our advisors and on IRA custodial services that we provide for their client accounts. We charge monthly administrative fees to our advisors. We charge fees to financial product manufacturers for participating in our training and marketing conferences and fees to our advisors and their clients for accounts that do not meet certain specified thresholds of size or activity. In addition, we host certain advisor conferences that serve as training, sales and marketing events in our first and third fiscal quarters and as a result, we anticipate higher transaction and other fees resulting from the collection of revenues from sponsors and advisors, in comparison to other periods. |
| |
| • | | Interest and Other Revenue.Other revenue includes marketing re-allowances from certain financial product manufacturers as well as interest income from client margin accounts and cash equivalents, net of operating interest expense, and other items. |
Our Operating Expenses
| • | | Production Expenses.Production expenses are comprised of the following: gross commissions and advisory fees that are earned and paid out to advisors based on the sale of various products and services; production bonuses for achieving certain levels of production; recognition of share-based compensation expense from stock options and warrants granted to advisors and financial institutions based on the fair value of the awards at each interim reporting period; amounts designated by advisors as deferred commissions in a non-qualified deferred compensation plan that are marked to market at each interim reporting period; and brokerage, clearing and exchange fees. We refer to these expenses as the production “payout”. Substantially all of the production payout is variable and correlated to the revenues generated by each advisor. |
| |
| • | | Compensation and Benefits Expense.Compensation and benefits expense includes salaries and wages and related employee benefits and taxes for our employees (including share-based compensation), as well as compensation for temporary employees and consultants. |
| |
| • | | General and Administrative Expenses.General and administrative expenses include promotional fees, occupancy and equipment, communications and data processing, regulatory fees, travel and entertainment and professional services. We host certain advisor conferences that serve as training, sales and marketing events in our first and third fiscal quarters and as a result, we anticipate higher general and administrative expenses in comparison to other periods. |
| |
| • | | Depreciation and Amortization Expense.Depreciation and amortization expense represents the benefits received for using long-lived assets. Those assets represent significant intangible assets established through our acquisitions, as well as fixed assets which include internally developed software, hardware, leasehold improvements and other equipment. |
| |
| • | | Restructuring Charges.Restructuring charges represent expenses incurred as a result of our 2009 consolidation of Associated Securities Corp., Mutual Service Corporation and Waterstone Financial Group, Inc. (together, the “Affiliated Entities”) and our 2011 consolidation of UVEST Financial Services Group, Inc. (“UVEST”). |
26
| • | | Other Expenses.Other expenses include bank fees, other taxes, bad debt expense and other miscellaneous expenses. |
How We Evaluate Growth
We focus on several business and key financial metrics in evaluating the success of our business relationships and our resulting financial position and operating performance. Our key metrics as of and for the three and six months ended June 30, 2011 and 2010 are as follows:
| | | | | | | | | | | | | |
| | | June 30, | | | |
| | | 2011 | | 2010 | | % Change |
| | | (unaudited) | | | | |
Business Metrics | | | | | | | | | | | | |
| Advisors(1) | | | 12,660 | | | | 12,066 | | | 4.9% |
| Advisory and brokerage assets (in billions)(2) | | $ | 340.8 | | | $ | 276.9 | | | 23.1% |
| Advisory assets under management (in billions)(3) | | $ | 103.2 | | | $ | 78.9 | | | 30.8% |
| Net new advisory assets (in billions)(4) | | $ | 6.8 | | | $ | 3.9 | | | 74.4% |
| Insured cash account balances (in billions)(3) | | $ | 13.2 | | | $ | 11.8 | | | 11.9% |
| Money market account balances (in billions)(3) | | $ | 8.2 | | | $ | 7.2 | | | 13.9% |
| | | | | | | | | | | | | | | | | |
| | | For the Three | | For the Six |
| | | Months Ended | | Months Ended |
| | | June 30, | | June 30, |
| | | 2011 | | 2010 | | 2011 | | 2010 |
| | | (unaudited) |
Financial Metrics | | | | | | | | | | | | | | | | |
| Revenue growth from prior period | | | 13.1 | % | | | 18.1 | % | | | 15.3 | % | | | 16.9 | % |
| Recurring revenue as a % of net revenue(5) | | | 62.4 | % | | | 59.3 | % | | | 61.3 | % | | | 59.7 | % |
| Gross margin (in millions)(6) | | $ | 259.9 | | | $ | 233.6 | | | $ | 529.5 | | | $ | 463.8 | |
| Gross margin as a % of net revenue(6) | | | 29.1 | % | | | 29.6 | % | | | 29.9 | % | | | 30.2 | % |
| Net income (in millions) | | $ | 45.5 | | | $ | 8.0 | | | $ | 94.5 | | | $ | 33.6 | |
| Adjusted EBITDA (in millions) | | $ | 123.0 | | | $ | 109.9 | | | $ | 247.3 | | | $ | 215.3 | |
| Adjusted Earnings (in millions) | | $ | 58.8 | | | $ | 46.4 | | | $ | 118.2 | | | $ | 87.5 | |
| Earnings per share — diluted | | $ | 0.40 | | | $ | 0.08 | | | $ | 0.82 | | | $ | 0.33 | |
| Adjusted Earnings per share — diluted | | $ | 0.52 | | | $ | 0.47 | | | $ | 1.04 | | | $ | 0.88 | |
| | |
| (1) | | Advisors are defined as those investment professionals who are licensed to do business with our broker-dealer subsidiaries. |
| |
| (2) | | Advisory and brokerage assets are comprised of assets that are custodied, networked and non-networked and reflect market movement in addition to new assets, inclusive of new business development and net of attrition. |
| |
| (3) | | Advisory assets under management, insured cash account balances and money market account balances are components of advisory and brokerage assets. |
| |
| (4) | | Represents net new advisory assets that are custodied in our fee-based advisory platforms during the six months ended June 30, 2011. Net new advisory assets for the three months ended June 30, 2011 and 2010 were $3.1 billion and $2.4 billion, respectively. |
| |
| (5) | | Recurring revenue is derived from sources such as advisory fees, asset-based fees, trailing commission fees, fees related to our cash sweep programs, interest earned on margin accounts and technology and service fees. |
| |
| (6) | | Gross margin is calculated as net revenues less production expenses. Production expenses consist of the following expense categories from our unaudited condensed consolidated statements of operations: (i) commissions and advisory fees and (ii) brokerage, clearing and exchange. All other expense categories, including depreciation and amortization, are considered general and administrative in nature. Because our gross margin amounts do not include any depreciation and amortization expense, our gross margin amounts may not be comparable to those of others in our industry. |
27
Adjusted EBITDA
Adjusted EBITDA is defined as EBITDA (net income plus interest expense, income tax expense, depreciation and amortization), further adjusted to exclude certain non-cash charges and other adjustments set forth below. We present Adjusted EBITDA because we consider it an important measure of our performance. Adjusted EBITDA is a useful financial metric in assessing our operating performance from period to period by excluding certain items that we believe are not representative of our core business, such as certain material non-cash items and other adjustments.
We believe that Adjusted EBITDA, viewed in addition to, and not in lieu of, our reported GAAP results, provides useful information to investors regarding our performance and overall results of operations for the following reasons:
| • | | because non-cash equity grants made to employees at a certain price and point in time do not necessarily reflect how our business is performing at any particular time, share-based compensation expense is not a key measure of our operating performance and |
| |
| • | | because costs associated with acquisitions and the resulting integrations, debt refinancing, restructuring and conversions and equity issuance and related offering costs can vary from period to period and transaction to transaction, expenses associated with these activities are not considered a key measure of our operating performance. |
We use Adjusted EBITDA:
| | • | | as a measure of operating performance; |
| |
| | • | | for planning purposes, including the preparation of budgets and forecasts; |
| |
| | • | | to allocate resources to enhance the financial performance of our business; |
| |
| | • | | to evaluate the effectiveness of our business strategies; |
| |
| | • | | in communications with our board of directors concerning our financial performance and |
| |
| | • | | as a factor in determining employee and executive bonuses |
Adjusted EBITDA is a non-GAAP measure and does not purport to be an alternative to net income as a measure of operating performance or to cash flows from operating activities as a measure of liquidity. The term Adjusted EBITDA is not defined under GAAP, and Adjusted EBITDA is not a measure of net income, operating income or any other performance measure derived in accordance with GAAP, and is subject to important limitations.
Adjusted EBITDA has limitations as an analytical tool, and should not be considered in isolation, or as a substitute for analysis of our results as reported under GAAP. Some of these limitations are:
| | • | | Adjusted EBITDA does not reflect all cash expenditures, future requirements for capital expenditures or contractual commitments |
| |
| | • | | Adjusted EBITDA does not reflect changes in, or cash requirements for, working capital needs and |
| |
| | • | | Adjusted EBITDA does not reflect the significant interest expense, or the cash requirements necessary to service interest or principal payments, on our debt |
| |
| | • | | Adjusted EBITDA can differ significantly from company to company depending on long-term strategic decisions regarding capital structure, the tax jurisdictions in which companies operate and capital investments, limiting its usefulness as a comparative measure |
Because of these limitations, Adjusted EBITDA should not be considered as a measure of discretionary cash available to us to invest in our business. We compensate for these limitations by relying primarily on the GAAP results and using Adjusted EBITDA as supplemental information.
28
Set forth below is a reconciliation from our net income to Adjusted EBITDA for the three and six months ended June 30, 2011 and 2010 (in thousands):
| | | | | | | | | | | | | | | | | |
| | | For the Three | | | For the Six | |
| | | Months Ended | | | Months Ended | |
| | | June 30, | | | June 30, | |
| | | 2011 | | | 2010 | | | 2011 | | | 2010 | |
| | | (unaudited) | |
| Net income | | $ | 45,507 | | | $ | 8,000 | | | $ | 94,506 | | | $ | 33,554 | |
| Interest expense | | | 18,154 | | | | 27,683 | | | | 36,326 | | | | 52,019 | |
| Income tax expense | | | 29,972 | | | | 628 | | | | 62,531 | | | | 19,790 | |
| Amortization of purchased intangible assets and software(1) | | | 9,686 | | | | 10,938 | | | | 19,223 | | | | 25,049 | |
| Depreciation and amortization of all other fixed assets | | | 8,721 | | | | 11,172 | | | | 17,349 | | | | 22,651 | |
| | | | | | | | | | | | | |
| EBITDA | | | 112,040 | | | | 58,421 | | | | 229,935 | | | | 153,063 | |
| EBITDA Adjustments: | | | | | | | | | | | | | | | | |
| Share-based compensation expense(2) | | | 3,427 | | | | 2,239 | | | | 7,287 | | | | 4,775 | |
| Acquisition and integration related expenses(3) | | | 1,548 | | | | 3,377 | | | | 2,964 | | | | 3,517 | |
| Restructuring and conversion costs(4) | | | 4,599 | | | | 5,619 | | | | 5,434 | | | | 13,598 | |
| Debt amendment and extinguishment costs(5) | | | — | | | | 38,484 | | | | — | | | | 38,605 | |
| Equity issuance and related offering costs | | | 1,349 | | | | 1,687 | | | | 1,641 | | | | 1,687 | |
| Other(6) | | | 34 | | | | 37 | | | | 67 | | | | 76 | |
| | | | | | | | | | | | | |
| Total EBITDA Adjustments | | | 10,957 | | | | 51,443 | | | | 17,393 | | | | 62,258 | |
| | | | | | | | | | | | | |
| Adjusted EBITDA | | $ | 122,997 | | | $ | 109,864 | | | $ | 247,328 | | | $ | 215,321 | |
| | | | | | | | | | | | | |
| | |
| (1) | | Represents amortization of intangible assets and software as a result of our purchase accounting adjustments from our merger transaction in 2005 and our various acquisitions. |
| |
| (2) | | Represents share-based compensation expense related to vested stock options awarded to employees and non-executive directors based on the grant date fair value under the Black-Scholes valuation model. |
| |
| (3) | | Represents acquisition and integration costs resulting from various acquisitions. |
| |
| (4) | | Represents organizational restructuring charges and conversion and other related costs incurred resulting from the 2009 consolidation of the Affiliated Entities and the 2011 consolidation of UVEST. |
| |
| (5) | | Represents debt amendment costs incurred in 2010 for amending and restating our credit agreement to establish a new term loan tranche and to extend the maturity of an existing tranche on our senior credit facilities. |
| |
| (6) | | Represents other taxes. |
Adjusted Earnings and Adjusted Earnings per share
Adjusted Earnings represents net income before: (a) share-based compensation expense, (b) amortization of intangible assets and software, a component of depreciation and amortization resulting from our merger transaction in 2005 and our various acquisitions, (c) acquisition and integration related expenses, (d) restructuring and conversion costs, (e) debt amendment and extinguishment costs (f) equity issuance and related offering costs and (g) other. Reconciling items are tax effected using the income tax rates in effect for the applicable period, adjusted for any potentially non-deductible amounts.
Adjusted Earnings per share represents Adjusted Earnings divided by weighted average outstanding shares on a fully diluted basis.
We prepared Adjusted Earnings and Adjusted Earnings per share to eliminate the effects of items that we do not consider indicative of our core operating performance.
29
We believe that Adjusted Earnings and Adjusted Earnings per share, viewed in addition to, and not in lieu of, our reported GAAP results provide useful information to investors regarding our performance and overall results of operations for the following reasons:
| | • | | because non-cash equity grants made to employees at a certain price and point in time do not necessarily reflect how our business is performing at any particular time, share-based compensation expense is not a key measure of our operating performance; |
| |
| | • | | because costs associated with acquisitions and related integrations, debt refinancing, restructuring and conversions, and equity issuance and related offering costs can vary from period to period and transaction to transaction, expenses associated with these activities are not considered a key measure of our operating performance and |
| |
| | • | | because amortization expenses can vary substantially from company to company and from period to period depending upon each company’s financing and accounting methods, the fair value and average expected life of acquired intangible assets and the method by which assets were acquired, the amortization of intangible assets obtained in acquisitions are not considered a key measure in comparing our operating performance. |
Since 2010, we have used Adjusted Earnings for internal management reporting and evaluation purposes. We also believe Adjusted Earnings and Adjusted Earnings per share are useful to investors in evaluating our operating performance because securities analysts use them as supplemental measures to evaluate the overall performance of companies, and our investor and analyst presentations include Adjusted Earnings and Adjusted Earnings per share.
Adjusted Earnings and Adjusted Earnings per share are not measures of our financial performance under GAAP and should not be considered as an alternative to net income or earnings per share or any other performance measure derived in accordance with GAAP, or as an alternative to cash flows from operating activities as a measure of our profitability or liquidity.
We understand that, although Adjusted Earnings and Adjusted Earnings per share are frequently used by securities analysts and others in their evaluation of companies, they have limitations as analytical tools, and you should not consider Adjusted Earnings and Adjusted Earnings per share in isolation, or as substitutes for an analysis of our results as reported under GAAP. In particular you should consider:
| | • | | Adjusted Earnings and Adjusted Earnings per share do not reflect our cash expenditures, or future requirements for capital expenditures or contractual commitments; |
| |
| | • | | Adjusted Earnings and Adjusted Earnings per share do not reflect changes in, or cash requirements for, our working capital needs and |
| |
| | • | | Other companies in our industry may calculate Adjusted Earnings and Adjusted Earnings per share differently than we do, limiting their usefulness as comparative measures. |
Management compensates for the inherent limitations associated with using Adjusted Earnings and Adjusted Earnings per share through disclosure of such limitations, presentation of our financial statements in accordance with GAAP and reconciliation of Adjusted Earnings to the most directly comparable GAAP measure, net income.
30
The following table sets forth a reconciliation of net income to Adjusted Earnings and Adjusted Earnings per share (in thousands, except per share data):
| | | | | | | | | | | | | | | | | |
| | | For the Three | | | For the Six | |
| | | Months Ended | | | Months Ended | |
| | | June 30, | | | June 30, | |
| | | 2011 | | | 2010 | | | 2011 | | | 2010 | |
| | | (unaudited) | |
| Net income | | $ | 45,507 | | | $ | 8,000 | | | $ | 94,506 | | | $ | 33,554 | |
| After-Tax: | | | | | | | | | | | | | | | | |
| EBITDA Adjustments(1) | | | | | | | | | | | | | | | | |
| Share-based compensation expense(2) | | | 2,677 | | | | 1,870 | | | | 5,578 | | | | 3,880 | |
| Acquisition and integration related expenses | | | 955 | | | | 2,052 | | | | 1,829 | | | | 2,137 | |
| Restructuring and conversion costs | | | 2,838 | | | | 3,415 | | | | 3,353 | | | | 8,238 | |
| Debt amendment and extinguishment costs | | | — | | | | 23,387 | | | | — | | | | 23,460 | |
| Equity issuance and related offering costs | | | 832 | | | | 1,025 | | | | 1,012 | | | | 1,025 | |
| Other | | | 21 | | | | 22 | | | | 41 | | | | 46 | |
| | | | | | | | | | | | | |
| Total EBITDA Adjustments | | | 7,323 | | | | 31,771 | | | | 11,813 | | | | 38,786 | |
| | | | | | | | | | | | | |
| Amortization of purchased intangible assets and software(1) | | | 5,977 | | | | 6,647 | | | | 11,861 | | | | 15,177 | |
| | | | | | | | | | | | | |
| Adjusted Earnings | | $ | 58,807 | | | $ | 46,418 | | | $ | 118,180 | | | $ | 87,517 | |
| | | | | | | | | | | | | |
| Adjusted Earnings per share(3) | | $ | 0.52 | | | $ | 0.47 | | | $ | 1.04 | | | $ | 0.88 | |
| Weighted average shares outstanding — diluted(4) | | | 113,150 | | | | 99,487 | | | | 113,155 | | | | 99,248 | |
| | |
| (1) | | EBITDA Adjustments and amortization of purchased intangible assets and software have been tax effected using a federal rate of 35.0% and the applicable effective state rate which was 3.30% for the three and six month periods ended June 30, 2011, and 4.23% and 4.32% for the corresponding periods in 2010, net of the federal tax benefit. In April 2010, a step up in basis of $89.1 million for internally developed software that was established at the time of the 2005 merger transaction became fully amortized, resulting in lower balances of intangible assets that are amortized. |
| |
| (2) | | Represents the after-tax expense of non-qualified stock options in which we receive a tax deduction upon exercise, and the full expense impact of incentive stock options granted to employees that have vested and qualify for preferential tax treatment and conversely, we do not receive a tax deduction. Share-based compensation for vesting of incentive stock options was $1.5 million and $1.3 million, respectively, for the three months ended June 30, 2011 and 2010, and $2.8 million and $2.5 million for the six months ended June 30, 2011 and 2010, respectively. |
| |
| (3) | | Represents Adjusted Earnings divided by weighted average number of shares outstanding on a fully diluted basis. Set forth is a reconciliation of earnings per share on a fully diluted basis as calculated in accordance with GAAP to Adjusted Earnings per share: |
| | | | | | | | | | | | | | | | | |
| | | For the Three | | | For the Six | |
| | | Months Ended | | | Months Ended | |
| | | June 30, | | | June 30, | |
| | | 2011 | | | 2010 | | | 2011 | | | 2010 | |
| | | (unaudited) | |
| Earnings per share — diluted | | $ | 0.40 | | | $ | 0.08 | | | $ | 0.82 | | | $ | 0.33 | |
| Adjustment for allocation of undistributed earnings to stock units | | | 0.01 | | | | — | | | | 0.01 | | | | 0.01 | |
| After-Tax: | | | | | | | | | | | | | | | | |
| EBITDA Adjustments per share | | | 0.06 | | | | 0.32 | | | | 0.11 | | | | 0.39 | |
| Amortization of purchased intangible assets and software per share | | | 0.05 | | | | 0.07 | | | | 0.10 | | | | 0.15 | |
| | | | | | | | | | | | | |
| Adjusted Earnings per share | | $ | 0.52 | | | $ | 0.47 | | | $ | 1.04 | | | $ | 0.88 | |
| | | | | | | | | | | | | |
| (4) | | Weighted average shares outstanding on a fully diluted basis increased from 99.2 million shares for the six months ended June 30, 2010 to 113.2 million shares for the six months ended June 30, 2011, due primarily to the successful completion of our Initial Public Offering (“IPO”) in the fourth quarter of 2010. The increase is attributed to the release of the restriction of approximately 7.4 million shares of common stock upon closing of our IPO in the fourth quarter of 2010, the issuance of approximately 1.5 million shares of common stock by the Company pursuant to the over-allotment option granted to the underwriters in connection with the IPO, and shares that were issued upon exercise of options by selling stockholders in connection with the IPO, net of any shares retired to satisfy the exercise price in a cashless exercise. |
31
The following table reflects pro-forma Adjusted Earnings per share and growth in pro-forma Adjusted Earnings per share, assuming weighted average shares outstanding on a fully diluted basis as of June 30, 2011 were also outstanding as of June 30, 2010 (in thousands, except per share data):
| | | | | | | | | | | | | | | | | | | | | | | | | |
| | | For the Three | | | | | | | For the Six | | | | |
| | | Months Ended | | | | | | | Months Ended | | | | |
| | | June 30, | | | | | | | June 30, | | | | |
| | | 2011 | | | 2010 | | | % Change | | 2011 | | | 2010 | | | % Change |
| | | (unaudited) | | | | | | | (unaudited) | | | | | |
| Adjusted Earnings | | $ | 58,807 | | | $ | 46,418 | | | | | | | $ | 118,180 | | | $ | 87,517 | | | | | |
| Weighted average shares outstanding — diluted as of June 30, 2011 | | | 113,150 | | | | 113,150 | | | | | | | | 113,155 | | | | 113,155 | | | | | |
| | | | | | | | | | | | | | | | | | | | | |
| Pro-forma Adjusted Earnings per share | | $ | 0.52 | | | $ | 0.41 | | | 26.8% | | $ | 1.04 | | | $ | 0.77 | | | 35.1% |
| | | | | | | | | | | | | | | | | | | | | |
Acquisitions, Integrations and Divestitures
Acquisition of National Retirement Partners, Inc.
On July 14, 2010, we announced a definitive agreement to acquire certain assets of National Retirement Partners, Inc. (“NRP”). NRP’s advisors offer products and services to retirement plan sponsors and participants and comprehensive financial services to high net worth individuals. This strategic acquisition will further enhance our capabilities and presence in the group retirement plan space. Our existing advisors will benefit from growth opportunities, as well as IRA rollovers and other retirement related services and solutions.
The transaction closed on February 9, 2011, and accordingly 206 advisors previously registered with NRP transferred their securities and advisory licenses and registrations to LPL Financial LLC (“LPL Financial”). These advisors support small and medium sized business with employee retirement solutions, including group annuities and 401(k) plans.
We paid $17.2 million at the closing of the transaction, and $3.7 million of additional funds remain in an escrow account to be paid to former shareholders of NRP pursuant to the terms of the asset purchase agreement. Additionally, we may be required to pay future consideration that is contingent upon the achievement of certain revenue-based milestones in the third year after acquisition. Including the provisional contingent consideration, the total consideration for the acquisition was approximately $24.2 million.
Acquisition of Concord Capital Partners
On April 20, 2011, we announced our intent to acquire all of the outstanding common stock of Concord Capital Partners (“Concord Wealth Management”) and certain of its subsidiaries. Concord Wealth Management is an industry leader in providing technology and open architecture investment management solutions for trust departments of financial institutions. Through this acquisition, we will have the ability to support both the brokerage and trust business lines of current and prospective financial institutions. The acquisition will also create new expansion opportunities such as giving us the ability to custody personal trust assets within banks across the country.
On June 22, 2011, the transaction closed. We paid $20.0 million at the closing of the transaction. As of June 30, 2011, $2.3 million remains in an escrow account to be paid to former shareholders of Concord Wealth Management in accordance with the terms of the stock purchase agreement.
We may be required to pay future consideration that is contingent upon the achievement of certain gross margin-based milestones for the year ended December 31, 2013. The maximum amount of contingent consideration is $15.0 million. We estimate the total fair value of the contingent consideration as $11.5 million at the acquisition date, which has been recorded within accounts payable and accrued liabilities on the unaudited condensed consolidated statements of financial condition. Including the provisional contingent consideration, the total consideration for the acquisition was approximately $33.8 million.
Consolidation of UVEST Financial Services Group, Inc.
On March 14, 2011, we committed to a corporate restructuring plan to enhance our service offering, while generating efficiencies. The restructuring plan includes the consolidation the operations of our subsidiary, UVEST with those of LPL
32
Financial. In connection with the consolidation of UVEST, certain registered representatives currently associated with UVEST will move to LPL Financial through a transfer of their licenses. The transfers are expected to be completed in stages, with the first stage expected to commence in the third quarter of 2011, and the final stage to be completed by December 2011. Following the transfer of registered representatives and client accounts to LPL Financial, all registered representatives and client accounts that transferred shall then be associated with LPL Financial. In addition, UVEST will terminate its clearing relationship with a third-party clearing firm.
We anticipate recording pre-tax expenditures of $52.7 million over the course of the restructuring plan, including a non-cash impairment charge of $5.6 million. These expenditures are comprised of estimated costs of $28.7 million relating to the conversion and transfer of registered representatives and client accounts from UVEST to LPL Financial (including $14.2 million in technology expenditures), $11.4 million of contract termination fees and $7.0 million of advisor retention and related benefits.
During the second quarter ended June 30, 2011, and in conjunction with the corporate restructuring plan to consolidate UVEST, certain institutional relationships were determined to have no future economic benefit. Accordingly, we have recorded an intangible asset impairment charge of $1.7 million. The impairment was determined based upon the attrition of institutions and their related revenue streams during the period of consolidation.
These restructuring activities are expected to be completed by the end of 2011. We expect this restructuring will improve pre-tax profitability by approximately $10 million to $12 million per year upon the completion of integration activities by creating operational efficiencies and revenue opportunities.
Economic Overview and Impact of Financial Market Events
The steady recovery of the equity markets, from the market lows that occurred in March of 2009, progressed through its third year during the first half of 2011. This improvement is reflected in the daily S&P 500, which averaged 1,311 during the first six months of 2011, 16.1% above the daily average of 1,129 in the comparable prior year period; however, significant uncertainty about the sustainability of growth remains with overall employment levels low and housing prices unsteady. While the general direction of the equity markets has been up for the last two years, the markets have experienced brief and sharp contractions during this time in response to uncertainties arising from global economic and political developments.
The second quarter of 2011 proved to be quite volatile for the equity markets reflected by the S&P 500 reaching a high in late April before turning downward, dropping 7.2% by mid-June, and then recovering with a 4.4% increase in the last few days of the quarter. For the second quarter ended June 30, 2011, the S&P closed at 1,321 compared to 1,031 for the prior year period. These fluctuations are influenced by a number of factors: international debt crises, our national debt ceiling debate, strong initial public offerings, high unemployment rates, and strong cash positions among other factors.
In response to the market turbulence and overall economic environment, the central banks, including the Federal Reserve, have maintained historically low interest rates. The average effective rate for federal funds was 0.09% in the second quarter of 2011, a decrease from the average of 0.19% for the second quarter of 2010. During the second quarter of 2011, the quantitative easing program introduced by the Federal Reserve resulted in a decline in the average effective rate on a sequential quarter basis of 6 basis points. The low interest rate environment negatively impacts our revenues from client assets in our cash sweep programs.
As a result of the uncertainties in the market and weak investor confidence following the 2008-2009 crash, our revenues from sales of investment products and from transactions have been slowly recovering to their pre-crash levels. Our results for the second quarter and first six months of 2011 reflect the sustained expansions of investment activities and volumes since early in 2008. This re-engagement of investors is reflected, in part, in our commission revenues, which reached $459.9 million in the second quarter, surpassing our previous quarterly high of $451.9 million set during the first quarter. Advisory fees also hit a record high of $264.3 million for the second quarter of 2011, compared to a previous high of $244.1 million in the first quarter of 2011.
While our business has improved as a result of the more favorable environment, our outlook remains cautiously optimistic and we continue to attempt to mitigate the impact of financial market events on our earnings with a strategic
33
focus on attractive growth opportunities such as business development from attracting new advisors and through expense management activities.
Results of Operations
The following discussion presents an analysis of our results of operations for the three and six months ended June 30, 2011 and 2010. Where appropriate, we have identified specific events and changes that affect comparability or trends, and where possible and practical, have quantified the impact of such items.
| | | | | | | | | | | | | | | | | | | | | | | |
| | | Three Months Ended | | | | | | Six Months Ended | | | | |
| | | June 30, | | | | | | June 30, | | | | |
| | | 2011 | | | 2010 | | | % Change | | 2011 | | | 2010 | | | % Change |
| | | (In thousands) | | | | | | (In thousands) | | | | |
Revenues | | | | | | | | | | | | | | | | | | | | | | |
| Commissions | | $ | 459,882 | | | $ | 420,169 | | | 9.5 | % | | $ | 911,759 | | | $ | 809,141 | | | 12.7 | % |
| Advisory fees | | | 264,289 | | | | 215,146 | | | 22.8 | % | | | 508,376 | | | | 421,476 | | | 20.6 | % |
| Asset-based fees | | | 90,504 | | | | 77,436 | | | 16.9 | % | | | 180,327 | | | | 148,886 | | | 21.1 | % |
| Transaction and other fees | | | 68,755 | | | | 68,132 | | | 0.9 | % | | | 142,504 | | | | 135,495 | | | 5.2 | % |
| Other | | | 10,566 | | | | 9,278 | | | 13.9 | % | | | 24,899 | | | | 18,569 | | | 34.1 | % |
| | | | | | | | | | | | | | | | | | | |
Net revenues | | | 893,996 | | | | 790,161 | | | 13.1 | % | | | 1,767,865 | | | | 1,533,567 | | | 15.3 | % |
| | | | | | | | | | | | | | | | | | | |
Expenses | | | | | | | | | | | | | | | | | | | | | | |
| Production | | | 634,088 | | | | 556,538 | | | 13.9 | % | | | 1,238,415 | | | | 1,069,740 | | | 15.8 | % |
| Compensation and benefits | | | 81,410 | | | | 74,822 | | | 8.8 | % | | | 165,552 | | | | 148,397 | | | 11.6 | % |
| General and administrative | | | 58,168 | | | | 54,550 | | | 6.6 | % | | | 122,450 | | | | 107,787 | | | 13.6 | % |
| Depreciation and amortization | | | 18,407 | | | | 22,110 | | | (16.7 | )% | | | 36,572 | | | | 47,700 | | | (23.3 | )% |
| Restructuring charges | | | 4,814 | | | | 4,622 | | | 4.2 | % | | | 5,351 | | | | 8,571 | | | (37.6 | )% |
| Other | | | 3,476 | | | | 3,229 | | | 7.6 | % | | | 6,162 | | | | 8,030 | | | (23.3 | )% |
| | | | | | | | | | | | | | | | | | | |
Total operating expenses | | | 800,363 | | | | 715,871 | | | 11.8 | % | | | 1,574,502 | | | | 1,390,225 | | | 13.3 | % |
| | | | | | | | | | | | | | | | | | | |
| Non-operating interest expense | | | 18,154 | | | | 27,683 | | | (34.4 | )% | | | 36,326 | | | | 52,019 | | | (30.2 | )% |
| Loss on extinguishment of debt | | | — | | | | 37,979 | | | * | | | | — | | | | 37,979 | | | * | |
| | | | | | | | | | | | | | | | | | | |
Total expenses | | | 818,517 | | | | 781,533 | | | 4.7 | % | | | 1,610,828 | | | | 1,480,223 | | | 8.8 | % |
| | | | | | | | | | | | | | | | | | | |
Income before provision for income taxes | | | 75,479 | | | | 8,628 | | | * | | | | 157,037 | | | | 53,344 | | | 194.4 | % |
Provision for income taxes | | | 29,972 | | | | 628 | | | * | | | | 62,531 | | | | 19,790 | | | * | |
| | | | | | | | | | | | | | | | | | | |
Net income | | $ | 45,507 | | | $ | 8,000 | | | * | | | $ | 94,506 | | | $ | 33,554 | | | 181.7 | % |
| | | | | | | | | | | | | | | | | | | |
* Not Meaningful
Revenues
Commissions
The following table sets forth our commission revenue by product category included in our unaudited condensed consolidated statements of operations for the three months ended June 30, 2011 and 2010 (in thousands):
| | | | | | | | | | | | | | | | | | | | | | | | |
| | | 2011 | | | % Total | | 2010 | | | % Total | | Change | | % Change |
| Variable annuities | | $ | 201,496 | | | | 43.8 | % | | $ | 172,755 | | | | 41.1 | % | | $ | 28,741 | | | 16.6 | % |
| Mutual funds | | | 130,933 | | | | 28.5 | % | | | 117,254 | | | | 27.9 | % | | | 13,679 | | | 11.7 | % |
| Fixed annuities | | | 36,703 | | | | 8.0 | % | | | 39,202 | | | | 9.3 | % | | | (2,499 | ) | | (6.4 | )% |
| Alternative investments | | | 26,467 | | | | 5.7 | % | | | 26,179 | | | | 6.2 | % | | | 288 | | | 1.1 | % |
| Equities | | | 24,466 | | | | 5.3 | % | | | 25,034 | | | | 6.0 | % | | | (568 | ) | | (2.3 | )% |
| Fixed income | | | 22,019 | | | | 4.8 | % | | | 20,943 | | | | 5.0 | % | | | 1,076 | | | 5.1 | % |
| Insurance | | | 16,945 | | | | 3.7 | % | | | 18,216 | | | | 4.4 | % | | | (1,271 | ) | | (7.0 | )% |
| Other | | | 853 | | | | 0.2 | % | | | 586 | | | | 0.1 | % | | | 267 | | | 45.6 | % |
| | | | | | | | | | | | | | | | | | | |
Total commission revenue | | $ | 459,882 | | | | 100.0 | % | | $ | 420,169 | | | | 100.0 | % | | $ | 39,713 | | | 9.5 | % |
| | | | | | | | | | | | | | | | | | | |
Commission revenue increased by $39.7 million, or 9.5%, for the three months ended June 30, 2011 compared with 2010. The increase reflects improving investor sentiment as retail investors increasingly invested in bundled solutions such as variable annuities and alternative investments. Mutual fund commission-based products were bolstered by increasing levels of trail-based commission due to historical growth and market appreciation. Partially offsetting this trend,
34
fixed annuities experienced a decline as fixed annuity interest rates declined. Additionally, insurance commissions declined as term life insurance experienced reduced sales industry-wide.
The following table sets forth our commission revenue by product category included in our unaudited condensed consolidated statements of operations for the six months ended June 30, 2011 and 2010 (in thousands):
| | | | | | | | | | | | | | | | | | | | | | | | | |
| | | 2011 | | | % Total | | 2010 | | | % Total | | Change | | % Change |
| Variable annuities | | $ | 396,573 | | | | 43.5 | % | | $ | 328,447 | | | | 40.6 | % | | $ | 68,126 | | | | 20.7 | % |
| Mutual funds | | | 249,090 | | | | 27.3 | % | | | 232,255 | | | | 28.7 | % | | | 16,835 | | | | 7.2 | % |
| Fixed annuities | | | 79,454 | | | | 8.7 | % | | | 73,090 | | | | 9.0 | % | | | 6,364 | | | | 8.7 | % |
| Alternative investments | | | 54,443 | | | | 6.0 | % | | | 46,197 | | | | 5.7 | % | | | 8,246 | | | | 17.8 | % |
| Equities | | | 52,302 | | | | 5.7 | % | | | 49,140 | | | | 6.1 | % | | | 3,162 | | | | 6.4 | % |
| Fixed income | | | 45,502 | | | | 5.0 | % | | | 41,955 | | | | 5.2 | % | | | 3,547 | | | | 8.5 | % |
| Insurance | | | 32,886 | | | | 3.6 | % | | | 36,894 | | | | 4.6 | % | | | (4,008 | ) | | | (10.9 | )% |
| Other | | | 1,509 | | | | 0.2 | % | | | 1,163 | | | | 0.1 | % | | | 346 | | | | 29.8 | % |
| | | | | | | | | | | | | | | | | | | | |
Total commission revenue | | $ | 911,759 | | | | 100.0 | % | | $ | 809,141 | | | | 100.0 | % | | $ | 102,618 | | | | 12.7 | % |
| | | | | | | | | | | | | | | | | | | | |
Commission revenue increased by $102.6 million, or 12.7%, for the six months ended June 30, 2011 compared with 2010. Growth in annuities commission-based products supported by substantial increases in commissions earned on sales of variable annuities and in trail-based commissions for annuities and mutual funds were the primary factors for the increase. The increase in alternative investments is reflective of improved investor confidence and preferences for diversification. Insurance commissions declined as term life insurance experienced reduced sales industry-wide.
Advisory Fees
Advisory fees increased by $49.1 million, or 22.8%, to $264.3 million for the three months ended June 30, 2011 compared with 2010. Advisory revenue is predominately driven by the prior quarter-end advisory assets under management, which increased 23.1% from March 31, 2010 to March 31, 2011. The increase was primarily due to net new advisory assets of $10.9 billion over this period as a result of strong new business development and a shift by our existing advisors toward more advisory business. This trend continued with an additional $3.1 billion in net new advisory assets this quarter, driving additional revenue growth. The remaining advisory asset growth was driven by its correlation to market growth, as represented by the S&P 500 index growing 13.4% from 1,169 as of March 31, 2010 to 1,326 on March 31, 2011.
Advisory fees increased by $86.9 million, or 20.6%, for the six months ended June 30, 2011 compared with 2010. This growth was supported by the same net new advisory asset flows and market appreciation that impacted our quarterly performance.
The following table summarizes the activity within our advisory assets under management for the three and six months ended June 30, 2011 and 2010 (in billions):
| | | | | | | | | | | | | | | | | |
| | | For the Three | | For the Six | |
| | | Months Ended | | Months Ended | |
| | | June 30, | | June 30, | |
| | | 2011 | | | 2010 | | | 2011 | | | 2010 |
| Beginning of period | | $ | 99.7 | | | $ | 81.0 | | | $ | 93.0 | | | $ | 77.2 | |
| Net new advisory assets | | | 3.1 | | | | 2.4 | | | | 6.8 | | | | 3.9 | |
| Market impacts | | | 0.4 | | | | (4.5 | ) | | | 3.4 | | | | (2.2 | ) |
| | | | | | | | | | | | | |
| End of period | | $ | 103.2 | | | $ | 78.9 | | | $ | 103.2 | | | $ | 78.9 | |
| | | | | | | | | | | | | |
Asset-Based Fees
Asset-based fees increased by $13.1 million, or 16.9%, for the three months ended June 30, 2011 compared with 2010. Revenues from product sponsors and for record-keeping services, which are largely based on the underlying asset values, increased due to the impact of the market’s recovery on the value of those underlying assets and net new sales of eligible assets. The average S&P 500 index for the three months ended June 30, 2011 was 1,318, an increase of 16.2% over the average for the three months ended June 30, 2010. In addition, revenues from our cash sweep programs increased by $0.3 million, or 1.0%, to $29.8 million for the three months ended June 30, 2011 from $29.5 million for the three months ended June 30, 2010. This was driven by an increase in the assets in our cash sweep programs, which averaged $19.5 billion and $18.6 billion for the three months ended June 30, 2011 and 2010, respectively, partially offset by a decline in the effective federal funds rate.
35
Asset-based fees increased by $31.4 million, or 21.1%, for the six months ended June 30, 2011 compared with 2010. Revenues from product sponsors and for record-keeping services increased due to the impact of the market’s recovery on the value of those underlying assets and net new sales of eligible assets. The average S&P 500 index for the six months ended June 30, 2011 was 1,311, an increase of 16.1% over the average for the six months ended June 30, 2010. In addition, revenues from our cash sweep programs increased by $5.9 million, or 10.6%, to $61.5 million for the six months ended June 30, 2011 from $55.6 million for the six months ended June 30, 2010. This was driven by an increase in the assets in our cash sweep programs, which averaged $19.2 billion and $18.5 billion for the six months ended June 30, 2011 and 2010, respectively.
Transaction and Other Fees
Transaction and other fees, which include fees from advisors and their client accounts for various processing, technology and account services increased by $0.6 million, or 0.9%, for the three months ended June 30, 2011 compared with 2010. Revenues increased mostly due to increases in fees from advisors for technology and professional liability insurance services.
Transaction and other fees increased by $7.0 million, or 5.2%, for the six months ended June 30, 2011 compared with 2010. Transactional revenues increased by $4.3 million due to increased volumes in investment activities and related transactional volumes in mutual fund, general securities, fixed income and advisory products. Other fees also increased due to higher advisor count and client account growth.
Other Revenue
Other revenue includes marketing re-allowances from certain product manufacturers, interest income from client margin accounts and cash equivalents, net of operating interest expense and other items. Other revenue increased by $1.3 million, or 13.9%, for the three months ended June 30, 2011 compared with 2010, and $6.3 million, or 34.1%, for the six months ended June 30, 2011 compared to 2010. The increase during the three months ended June 30, 2011 was attributed primarily to unrealized gains on assets held for the advisor deferred commissions non-qualified deferred compensation plan. These assets are marked to market at each interim reporting period. Higher direct investment marketing allowances were received from product sponsor programs during the six months ended June 30, 2011 compared to the same period in 2010, largely based on the market values of the underlying assets.
Expenses
Production Expenses
Production expenses increased by $77.6 million, or 13.9%, for the three months ended June 30, 2011 compared with 2010. This increase aligned with our commission and advisory revenues, which increased by 14.0% during the same period. Our production payout averaged 86.3% for the three months ended June 30, 2011 and 86.1% for the three months ended June 30, 2010. The increase in payout rates from the second quarter of 2010 to the comparable period of 2011 is driven by our annual production bonus incentive structure, which increases throughout the year as our advisors achieve higher production levels. As a result of greater advisor activity year-to-date, advisors are achieving these production bonuses earlier in the year.
Production expenses increased by $168.7 million, or 15.8%, for the six months ended June 30, 2011 compared with 2010. This increase was correlated with our commission and advisory revenues, which increased by 15.4% during the same period. Our production payout averaged 85.9% for the six months ended June 30, 2011 and 85.5% for the six months ended June 30, 2010. Our annual production bonus incentive structure, which increases throughout the year as our advisors achieve higher production levels, is driven by the increase in payout rates from the first half of 2010 to the comparable period of 2011.
36
Compensation and Benefits
Compensation and benefits increased by $6.6 million, or 8.8%, for the three months ended June 30, 2011 compared with 2010. The increase was due to increased staffing to support higher levels of advisor and client activities, an increase in wages and related employee benefits and the recognition of share-based compensation for stock options awarded to employees based on the grant date fair value. Specifically, employee related share-based compensation increased $1.2 million for the three months ended June 30, 2011 compared to 2010, primarily due to vesting of equity grants that were made in December 2010. Our average number of full-time employees increased 6.9% from 2,502 for the three months ended June 30, 2010 to 2,674 for the three months ended June 30, 2011.
Compensation and benefits increased by $17.2 million, or 11.6%, for the six months ended June 30, 2011 compared with 2010. The increase was due to increased staffing to support higher levels of advisor and client activities, an increase in wages and related employee benefits and the recognition of share-based compensation for stock options awarded to employees based on the grant date fair value. Our average number of full-time employees increased 6.8% from 2,483 for the six months ended June 30, 2010 to 2,651 for the six months ended June 30, 2011. Employee related share-based compensation increased $2.5 million for the six months ended June 30, 2011 compared to 2010 primarily due to the vesting of equity grants that were made in December 2010. Also, employee merit-based salary increases went into effect two months earlier during the six months ended June 30, 2011 compared with 2010.
General and Administrative Expenses
General and administrative expenses increased by $3.6 million, or 6.6%, for the three months ended June 30, 2011 compared with 2010. The increase was due primarily to a $4.7 million increase in business development and other promotional expenses.
General and administrative expenses increased by $14.7 million, or 13.6%, for the six months ended June 30, 2011 compared with 2010. Business development and other promotional expenses increased by $7.1 million. Expenses for non-depreciable equipment, licensing fees and software costs increased by $4.1 million and professional fees incurred by $2.6 million.
Depreciation and Amortization
Deprecation and amortization expense decreased by $3.7 million, or 16.7% for the three months ended June 30, 2011 compared with 2010, and decreased by $11.1 million, or 23.3% for the six months ended June 30, 2011 compared with 2010. The decrease was attributed to a step up in basis of $89.1 million in our internally developed software that was established at the time of our 2005 merger transaction and became fully amortized in April 2010. Accordingly, we recorded $1.7 million and $6.5 million, respectively, in amortization expense for the three and six months ended June 30, 2010 that did not recur in 2011. In addition, we had increased our capital expenditures in 2007 and 2008 to support our acquisitions of the Affiliated Entities and UVEST, and have since maintained more moderate levels of capital expenditures resulting in a decrease in depreciation and amortization expense.
Restructuring Charges
Restructuring charges were $4.8 million and $5.4 million for the three and six months ended June 30, 2011, respectively. These charges relate primarily to technology costs and other expenditures incurred for the anticipated conversion and transfer of advisors and their client accounts from UVEST to LPL Financial as well as a $1.7 million impairment charge related to customer intangible assets.
Restructuring charges were $4.6 million and 8.6 million for the three and six months ended June 30, 2010, respectively. These amounts represented charges incurred for severance and termination benefits of $2.1 million, contract termination costs of $2.4 million, asset impairment write-offs of $0.8 million and $3.3 million in other expenditures principally relating to the conversion and transfer of registered representatives and client accounts from the Affiliated Entities to LPL Financial.
37
Other Expenses
Other expenses include bank fees, other taxes, bad debt expense and other miscellaneous expenses. Other expense increased by $0.2 million, or 7.6%, for the three months ended June 30, 2011 compared with 2010, and decreased by $1.9 million, or 23.3%, for the six months ended June 30, 2011 compared with 2010. The six months ended June 30, 2010 include $2.3 million of charges covered under a third-party indemnification agreement whereby the indemnitor is disputing its obligation. Refer to Litigation in Note 11 within the unaudited condensed consolidated financial statements for additional details regarding this matter.
Interest Expense
Interest expense includes non-operating interest expense for our senior secured credit facilities. Interest expense for the three months ended June 30, 2010 also includes non-operating interest expense for our senior unsecured subordinated notes, which we redeemed in May 2010.
Interest expense decreased by $9.5 million, or 34.4%, for the three months ended June 30, 2011 compared with 2010 and $15.7 million, or 30.2%, for the six months ended June 30, 2011 compared with 2010. The reduction in interest expense for the three and six months ended June 30, 2011 is primarily attributed to our debt refinancing in the second quarter of 2010, which included the redemption of our senior unsecured subordinated notes, resulting in a lower cost of borrowing. Interest rate swaps with a notional value of $190.0 million matured on June 30, 2010, reducing our related interest expense by $1.9 million and $3.9 million for the three and six months ended June 30, 2011 compared to 2010, respectively. Additionally, we repaid $40.0 million of term loans under our senior secured credit facilities using net proceeds received in our IPO, as well as other cash on hand, which resulted in interest savings in the 2011 periods.
Provision for Income Taxes
We estimate our full-year effective income tax rate at the end of each interim reporting period. This estimate is used in providing for income taxes on a year-to-date basis and may change in subsequent interim periods. The tax rate in any quarter can be affected positively and negatively by adjustments that are required to be reported in the specific quarter of resolution. The effective income tax rates reflect the impact of state taxes, settlement contingencies and expenses that are not deductible for tax purposes.
During the three months ended June 30, 2011, we recorded income tax expense of $30.0 million compared with an income tax expense of $0.6 million for the three months ended June 30, 2010. Our effective income tax rate was 39.7% and 7.3% for the three months ended June 30, 2011 and 2010, respectively. The effective tax rate for the three month period ended June 30, 2010 was lower primarily due to favorable state apportionment ruling and the revision of certain settlement contingencies recognized in that quarter.
For the six months ended June 30, 2011, we recorded income tax expense of $62.5 million compared with an income tax expense of $19.8 million for the six months ended June 30, 2010. Our effective income tax rate was 39.8% and 37.1% for the six months ended June 30, 2011 and 2010, respectively. The favorable state apportionment ruling and the revision of certain settlement contingencies recognized in the 2010 period contributed to the lower effective tax rate.
Liquidity and Capital Resources
Senior management establishes our liquidity and capital policies. These policies include senior management’s review of short- and long-term cash flow forecasts, review of monthly capital expenditures and daily monitoring of liquidity for our subsidiaries. Decisions on the allocation of capital include projected profitability and cash flow, risks of the business, regulatory capital requirements and future liquidity needs for strategic activities. Our Treasury Department assists in evaluating, monitoring and controlling the business activities that impact our financial condition, liquidity and capital structure and maintains relationships with various lenders. The objectives of these policies are to support the executive business strategies while ensuring ongoing and sufficient liquidity.
38
A summary of changes in cash flow data is provided as follows:
| | | | | | | | | |
| | | Six Months Ended | |
| | | June 30, | |
| | | 2011 | | | 2010 | |
| | | (In thousands) | |
| Net cash flows provided by (used in): | | | | | | | | |
| Operating activities | | $ | 349,716 | | | $ | 53,024 | |
| Investing activities | | | (36,310 | ) | | | (2,721 | ) |
| Financing activities | | | (51,143 | ) | | | (26,156 | ) |
| | | | | | | |
| Net increase in cash and cash equivalents | | | 262,263 | | | | 24,147 | |
| Cash and cash equivalents — beginning of period | | | 419,208 | | | | 378,594 | |
| | | | | | | |
| Cash and cash equivalents — end of period | | $ | 681,471 | | | $ | 402,741 | |
| | | | | | | |
Cash requirements and liquidity needs are primarily funded through our cash flow from operations and our capacity for additional borrowing.
Net cash provided by operating activities includes net income adjusted for non-cash expenses such as depreciation and amortization, restructuring charges, share-based compensation, amortization of debt issuance costs, deferred income tax provision and changes in operating assets and liabilities. Operating assets and liabilities include balances related to settlement and funding of client transactions, receivables from product sponsors and accrued commissions and advisory fees due to our advisors. Operating assets and liabilities that arise from the settlement and funding of transactions by our advisors’ clients are the principal cause of changes to our net cash from operating activities and can fluctuate significantly from day to day and period to period depending on overall trends and client behaviors. Net cash provided by operating activities was $349.7 million and $53.0 million for the six month periods ended June 30, 2011 and 2010, respectively. The increases in net cash provided by operating activities arise from increases in net income, net reductions of income taxes receivable and cash provided by the settlement of client activity as described above. Net cash provided by operating activities for the six months ended June 30, 2011 includes $55.8 million of excess tax benefits resulting from stock options exercised that primarily occurred in May 2011 at the expiration of the IPO lock-up, and a $181.8 million change in tax receivables that arose primarily from a tax benefit resulting from our IPO in November 2010.
Net cash used in investing activities for the six months ended June 30, 2011 and June 30, 2010 totaled $36.3 million and $2.7 million, respectively. The increase for the six months ended June 30, 2011, as compared to the six months ended June 30, 2010 was primarily due to $37.2 million used for the acquisitions of NRP and Concord Wealth Management. Additionally, there was cash used of $12.5 million for capital expenditures for the six months ended June 30, 2011 compared to $3.7 million for the prior year period. Partially offsetting these trends is the release of restricted cash of $18.5 million during the six months ended June 30, 2011, compared to $2.6 million for the same period in the prior year.
Net cash used in financing activities for the six months ended June 30, 2011 and 2010 was $51.1 million and $26.2 million, respectively. Cash flows used in financing activities for the six months ended June 30, 2011, include $67.0 million of cash used to purchase treasury stock and $47.0 million of cash used to repay senior credit facilities, partially offset by $55.8 million from excess tax benefits arising from stock options exercised.
We believe that based on current levels of operations and anticipated growth, cash flow from operations, together with other available sources of funds, which includes three lines of credit available, we will be adequate to satisfy our working capital needs, the payment of all of our obligations and the funding of anticipated capital expenditures for the foreseeable future. In addition, we have certain capital requirements due to our registered broker-dealer entities and have met all capital adequacy requirements for each entity and expect this to also continue for the foreseeable future.
Tax Benefit Analysis
In 2010, upon closing our IPO in the fourth quarter, the restriction on 7.4 million shares of common stock issued to our advisors under the Fifth Amended and Restated 2000 Stock Bonus Plan was released. Accordingly, we recorded a share-based compensation charge and a corresponding tax deduction of $222.0 million in the fourth quarter of 2010, representing the offering price of $30.00 per share multiplied by 7.4 million shares. We were able to take a tax deduction for the share-based compensation charge, as noted below.
39
On January 20, 2011, we received a $45.0 million tax refund for federal taxes paid in 2010. On April 4, 2011, we received $55.3 million and $42.9 million, respectively, for refunds of federal taxes paid in 2009 and 2008.
The following table shows the tax deduction available and the tax benefit expected to be realized in connection with the IPO (in thousands):
| | | | | | | | | | | | | |
| | | Release on the | | | | |
| | | Restriction of | | | | |
| | | Shares of Common | | Stock Option and | | |
| | | Stock | | Warrant Exercises | | Total |
| Tax deduction available | | | $ 221,982 | | | | $ 382,990 | | | $ | 604,972 | |
| Tax benefit expected to be realized | | | 87,072 | | | | 150,228 | | | | 237,300 | |
| Tax benefit recorded in 2010 as income tax receivables on the consolidated statements of financial condition | | | (87,072 | ) | | | (57,474 | ) | | | (144,546 | ) |
| Tax benefit utilized in the fourth quarter of 2010 by not making a quarterly payment | | | — | | | | (37,534 | ) | | | (37,534 | ) |
| Tax benefit utilized in the first six months of 2011 by utilization of NOLs to reduce income taxes payable | | | — | | | | (42,819 | ) | | | (42,819 | ) |
| | | | | | | | | | | | | |
| Total tax benefits realized as of June 30, 2011 | | | (87,072 | ) | | | (137,827 | ) | | | (224,899 | ) |
| | | | | | | | | | | | | |
| Tax benefit expected to be utilized through the use of NOLs from tax deductions resulting from the IPO | | | $ — | | | | $ 12,401 | | | $ | 12,401 | |
| | | | | | | | | | | | | |
The remaining tax benefit expected to be utilized through the use of NOLs from tax deductions resulting from the IPO primarily relate to state taxes are expected to be utilized over the next few years dependent upon each state’s tax laws related to NOL carryforwards.
Operating Capital Requirements
Our primary requirement for working capital relates to funds we loan to our advisors’ clients for trading done on margin and funds we are required to maintain at clearing organizations to support these clients’ trading activities. We require that our advisors’ clients deposit funds with us in support of their trading activities and we hypothecate securities held as margin collateral, which we in turn use to lend to clients for margin transactions and deposit with our clearing organizations. These activities account for the majority of our working capital requirements, which are primarily funded directly or indirectly by our advisors’ clients. Our other working capital needs are primarily limited to regulatory capital requirements and software development, which we have satisfied in the past from internally generated cash flows.
Notwithstanding the self-funding nature of our operations, we may sometimes be required to fund timing differences arising from the delayed receipt of client funds associated with the settlement of client transactions in securities markets. These timing differences are funded either with internally generated cash flow or, if needed, with funds drawn under the revolving credit facility at the holding company, and/or uncommitted lines of credit at our broker-dealer subsidiary, LPL Financial.
Our registered broker-dealers are subject to the SEC’s Uniform Net Capital Rule, which requires the maintenance of minimum net capital. LPL Financial computes net capital requirements under the alternative method, which requires firms to maintain minimum net capital, as defined, equal to the greater of $250,000 or 2% of aggregate debit balances arising from client transactions plus 1% of net commission payable, as defined. LPL Financial is also subject to the Commodity Futures Trading Commission’s minimum financial requirements, which require that it maintain net capital, as defined, equal to 4% of customer funds required to be segregated pursuant to the Commodity Exchange Act, less the market value of certain commodity options, all as defined. UVEST and MSC compute net capital requirements under the aggregate indebtedness method, which requires firms to maintain minimum net capital, as defined, of not less than 6.67% of aggregate indebtedness plus 1% of net commission payable, also as defined.
Our subsidiary, PTC, is subject to various regulatory capital requirements. Failure to meet minimum capital requirements can initiate certain mandatory and possible additional discretionary actions by regulators that, if undertaken, could have a direct material effect on our unaudited condensed consolidated financial statements.
40
Liquidity Assessment
Our ability to meet our debt service obligations and reduce our total debt will depend upon our future performance which, in turn, will be subject to general economic, financial, business, competitive, legislative, regulatory and other conditions, many of which are beyond our control. In addition, our operating results, cash flow and capital resources may not be sufficient for repayment of our indebtedness in the future. Some risks that could materially adversely affect our ability to meet our debt service obligations include, but are not limited to, general economic conditions and economic activity in the financial markets. The performance of our business is correlated with the economy and financial markets, and a slowdown in the economy or financial markets could adversely affect our business, results of operations, cash flows or financial condition.
If our cash flows and capital resources are insufficient to fund our debt service obligations, we may be forced to reduce or delay investments, seek additional capital or restructure or refinance our indebtedness. These measures may not be successful and may not permit us to meet our scheduled debt service obligations. In the absence of sufficient cash flows and capital resources, we could face substantial liquidity constraints and might be required to dispose of material assets or operations to meet our debt service and other obligations. However, our senior secured credit agreement will restrict our ability to dispose of assets and the use of proceeds from any such dispositions. We may not be able to consummate those dispositions, and even if we could consummate such dispositions, to obtain the proceeds that we could realize from them and, in any event, the proceeds may not be adequate to meet any debt service obligations then due.
Indebtedness
On May 24, 2010, we amended and restated our senior secured credit agreement to add a new term loan tranche of $580.0 million maturing at June 28, 2017, which we used, together with cash on hand, to redeem our $550.0 million of senior unsecured subordinated notes, as described below. We also extended the maturity of a $500.0 million tranche of our term loan facility to June 25, 2015, with the remaining $317.1 million tranche maturing at the original maturity date of June 28, 2013.
On May 24, 2010, we gave notice of redemption of all of our outstanding senior unsecured subordinated notes. The redemption price of the senior unsecured subordinated notes was 105.375% of the outstanding aggregate principal amount, plus accrued and unpaid interest thereon up to but not including June 22, 2010 (the “Redemption Date”). All of our outstanding senior unsecured subordinated notes were redeemed on the Redemption Date.
We also maintain a revolving credit facility which is provided through the senior secured credit facilities. On January 25, 2010, we amended our senior secured credit agreement to increase the revolving credit facility from $100 million to $218.2 million. In connection with this amendment, we extended the maturity of a $163.5 million tranche of the revolving credit facility to June 28, 2013. The remaining $54.7 million tranche retains its original maturity date of December 28, 2011.
We maintain three uncommitted lines of credit at LPL Financial. Two of the lines have unspecified limits, and are primarily dependent on our ability to provide sufficient collateral. The other line has a $150.0 million limit and allows for both collateralized and uncollateralized borrowings. The lines were utilized in 2011 and 2010; however, there were no balances outstanding at June 30, 2011 or December 31, 2010.
We also are a party to an interest rate swap agreement, in a notional amount of $65.0 million, to mitigate interest rate risk by hedging the variability of a portion of our floating-rate senior secured term loan.
Interest Rate and Fees
Borrowings under our senior secured credit facilities bear interest at a base rate equal to the one, two, three, six, nine or twelve-month LIBOR plus our applicable margin, or an alternative base rate (“ABR”) plus our applicable margin. The ABR is equal to the greatest of (a) the prime rate in effect on such day, (b) the effective federal funds rate in effect on such day plus 0.5% and (c) solely in the case of the 2015 Term Loans and the 2017 Term Loans, 2.50%.
The applicable margin for borrowings (a) with respect to the 2013 Term Loans is currently 0.75% for base rate borrowings and 1.75% for LIBOR borrowings, (b) with respect to the 2015 Term Loans is currently 1.75% for base rate borrowings and 2.75% for LIBOR borrowings, (c) with respect to the 2017 Term Loans is currently 2.75% for base rate borrowings and 3.75% for LIBOR borrowings, (d) with respect to revolver tranche maturing in 2011 is currently 1.00% for base rate borrowings and 2.00% for LIBOR borrowings and (e) with respect to revolver tranche maturing in 2013 is currently 2.50% for base rate borrowings and 3.50% for LIBOR borrowings. The applicable margin on our 2013 Term Loans could change depending on our credit rating. The LIBOR Rate with respect to the 2015 Term Loans and the 2017 Term Loans shall in no event be less than 1.50%.
41
In addition to paying interest on outstanding principal under the senior secured credit facilities, we are required to pay a commitment fee to the lenders under the revolving credit facility in respect of the unutilized commitments thereunder. The commitment fee rates at June 30, 2010 were 0.375% for our revolver tranche maturing in 2011 and 0.75% for our revolver tranche maturing in 2013, but are subject to change depending on our leverage ratio. We must also pay customary letter of credit fees.
Prepayments
The senior secured credit facilities (other than the revolving credit facility) require us to prepay outstanding amounts under our senior secured term loan facility subject to certain exceptions, with:
| • | | 50% (percentage will be reduced to 25% if our total leverage ratio is 5.00 or less and to 0% if our total leverage ratio is 4.00 or less) of our annual excess cash flow (as defined in our senior secured credit agreement) adjusted for, among other things, changes in our net working capital; |
| |
| • | | 100% of the net cash proceeds of all nonordinary course asset sales or other dispositions of property, if we do not reinvest or commit to reinvest those proceeds in assets to be used in our business or to make certain other permitted investments within 15 months as long as such reinvestment is completed within 180 days; and |
| |
| • | | 100% of the net cash proceeds of any incurrence of debt, other than proceeds from debt permitted under the senior secured credit agreement. |
The foregoing mandatory prepayments will be applied to scheduled installments of principal of the senior secured term loan facility in direct order.
We may voluntarily repay outstanding loans under the senior secured credit agreement at any time without premium or penalty, other than customary “breakage” costs with respect to LIBOR loans.
Amortization
We are required to repay the loans under the senior secured term loan facility in equal quarterly installments in aggregate annual amounts equal to 1% of the original funded principal amount of such facility, with the balance being payable on the final maturity date of the facility.
Principal amounts outstanding under the revolving credit facilities are due and payable in full at maturity.
Guarantee and Security
The senior secured credit facilities are secured primarily through pledges of the capital stock in our subsidiaries.
Certain Covenants and Events of Default
The senior secured credit agreement contains a number of covenants that, among other things, restrict, subject to certain exceptions, our ability to:
| | • | | incur additional indebtedness; |
| |
| | • | | create liens; |
| |
| | • | | enter into sale and leaseback transactions; |
| |
| | • | | engage in mergers or consolidations; |
| |
| | • | | sell or transfer assets; |
42
| | • | | pay dividends and distributions or repurchase our capital stock; |
| |
| | • | | make investments, loans or advances; |
| |
| | • | | prepay certain subordinated indebtedness; |
| |
| | • | | engage in certain transactions with affiliates; |
| |
| | • | | amend material agreements governing certain subordinated indebtedness; and |
| |
| | • | | change our lines of business. |
Our senior secured credit facilities prohibit us from paying dividends and distributions or repurchasing our capital stock except for limited purposes, including, but not limited to payments in connection with: (i) redemption, repurchase, retirement or other acquisition of our equity interests from present or former officers, managers, consultants, employees and directors upon the death, disability, retirement, or termination of employment of any such person or otherwise in accordance with any stock option or stock appreciate rights plan, any management or employee stock ownership plan, stock subscription plan, employment termination agreement or any employment agreements or stockholders’ agreement, in an aggregate amount not to exceed $5.0 million in any fiscal year plus the amount of cash proceeds from certain equity issuances to such persons, the amount of equity interests subject to a certain deferred compensation plan and the amount of certain key-man life insurance proceeds, (ii) franchise taxes, general corporate and operating expenses not to exceed $3.0 million in any fiscal year, and fees and expenses related to any unsuccessful equity or debt offering permitted by the senior secured credit facilities, (iii) tax liabilities to the extent attributable to our business and our subsidiaries and (iv) dividends and other distributions in an aggregate amount not to exceed 50% of our cumulative consolidated net income available to stockholders at such time so long as at the time of such payment of dividend or the making of such distribution, and after giving effect thereto, our leverage ratio is less than 3.50:1.00.
In addition, our financial covenant requirements include a leverage ratio test and an interest coverage ratio test. Under our leverage ratio test, we covenant not to allow the ratio of our consolidated total debt (as defined in our senior secured credit agreement) to an adjusted EBITDA reflecting financial covenants in our senior secured credit facilities (“Credit Agreement Adjusted EBITDA”) to exceed certain prescribed levels set forth in the agreement. Under our interest coverage ratio test, we covenant not to allow the ratio of our Credit Agreement Adjusted EBITDA to our consolidated interest expense (as defined in our senior secured credit agreement) to be less than certain prescribed levels set forth in the agreement. Each of our financial ratios is measured at the end of each fiscal quarter.
Our senior secured credit agreement provides us with a right to cure in the event we fail to comply with our leverage ratio test or our interest coverage test. We must exercise this right to cure within ten days of the delivery of our quarterly certificate calculating the financial ratio for that quarter.
If we fail to comply with these covenants and are unable to cure, we could face substantial liquidity problems and could be forced to sell assets, seek additional capital or seek to restructure or refinance our indebtedness. These alternative measures may not be successful or feasible. Our senior secured credit agreement restricts our ability to sell assets. Even if we could consummate those sales, the proceeds that we realize from them may not be adequate to meet any debt service obligations then due. Furthermore, if an event of default were to occur with respect to our senior secured credit agreement, our creditors could, among other things, accelerate the maturity of our indebtedness.
As of June 30, 2011 and December 31, 2010, we were in compliance with all of our covenant requirements.
Our covenant requirements and actual ratios as of June 30, 2011 and December 31, 2010 are as follows:
| | | | | | | | | | | | | | | | | |
| | | June 30, 2011 | | December 31, 2010 |
| | | Covenant | | Actual | | Covenant | | Actual |
| Financial Ratio | | Requirement | | Ratio | | Requirement | | Ratio |
| Leverage Test (Maximum) | | | 3.25 | | | | 2.03 | | | | 3.70 | | | | 2.64 | |
| Interest Coverage (Minimum) | | | 2.95 | | | | 6.42 | | | | 2.60 | | | | 4.81 | |
43
Set forth below is a reconciliation from EBITDA, Adjusted EBITDA and Credit Agreement Adjusted EBITDA to our net income for the trailing twelve months ending June 30, 2011 and December 31, 2010 (in thousands):
| | | | | | | | | |
| | | June 30, | | December 31, |
| | | 2011 | | 2010 |
| | | (unaudited) | |
| Net income (loss) | | $ | 4,090 | | | $ | (56,862 | ) |
| Interest expense | | | 74,714 | | | | 90,407 | |
| Income tax expense | | | 10,754 | | | | (31,987 | ) |
| Amortization of purchased intangible assets and software(1) | | | 37,832 | | | | 43,658 | |
| Depreciation and amortization of all other fixed assets | | | 37,077 | | | | 42,379 | |
| | | | | | | |
| EBITDA | | | 164,467 | | | | 87,595 | |
| EBITDA Adjustments: | | | | | | | | |
| Share-based compensation expense(2) | | | 12,941 | | | | 10,429 | |
| Acquisition and integration related expenses(3) | | | 12,016 | | | | 12,569 | |
| Restructuring and conversion costs(4) | | | 14,671 | | | | 22,835 | |
| Debt amendment and extinguishment costs(5) | | | 28 | | | | 38,633 | |
| Equity issuance and related offering costs(6) | | | 240,856 | | | | 240,902 | |
| Other(7) | | | 141 | | | | 150 | |
| | | | | | | |
| Total EBITDA Adjustments | | | 280,653 | | | | 325,518 | |
| | | | | | | |
| Adjusted EBITDA | | | 445,120 | | | | 413,113 | |
| Pro-forma adjustments(8) | | | — | | | | — | |
| | | | | | | |
| Credit Agreement Adjusted EBITDA | | $ | 445,120 | | | $ | 413,113 | |
| | | | | | | |
| | |
| (1) | | Represents amortization of intangible assets and software as a result of our purchase accounting adjustments from our merger transaction in 2005 and various acquisitions. |
| |
| (2) | | Represents share-based compensation expense related to vested stock options awarded to employees and non-executive directors based on the grant date fair value under the Black-Scholes valuation model. |
| |
| (3) | | Represents acquisition and integration costs resulting from various acquisitions. Included in the trailing twelve months ended June 30, 2011 and December 31, 2010, are $8.9 million of expenditures for certain legal settlements that have not been resolved with the indemnifying party. See Litigation in Note 11 of our unaudited condensed consolidated financial statements for further discussion on legal settlements. |
| |
| (4) | | Represents organizational restructuring charges and conversion and other related costs incurred resulting from the 2009 consolidation of the Affiliated Entities and the 2011 consolidation of UVEST. |
| |
| (5) | | Represents debt amendment costs incurred in 2010 for amending and restating our credit agreement to establish a new term loan tranche and to extend the maturity of an existing tranche on our senior credit facilities, and debt extinguishment costs to redeem our subordinated notes, as well as certain professional fees incurred. |
| |
| (6) | | Represents equity issuance and related offering costs. Upon closing of the IPO in the fourth quarter of 2010, the restriction on approximately 7.4 million shares of common stock issued to advisors under our Fifth Amended and Restated 2000 Stock Bonus Plan was released. Accordingly, we recorded a share-based compensation charge of $222.0 million, representing the offering price of $30.00 per share multiplied by 7.4 million shares. |
| |
| (7) | | Represents excise and other taxes. |
| |
| (8) | | Credit Agreement Adjusted EBITDA excludes pro forma general and administrative expenditures from acquisitions, as defined under the terms our senior secured credit agreement. There were no such adjustments for the twelve month periods ended June 30, 2011 and December 31, 2010. |
Interest Rate Swaps
An interest rate swap is a financial derivative instrument whereby two parties enter into a contractual agreement to exchange payments based on underlying interest rates. We use an interest rate swap agreement to hedge the variability on our floating interest rate for $65.0 million of our term loan under our senior secured credit facilities. We are required to pay the counterparty to the agreement fixed interest payments on a notional balance and in turn receive variable interest payments on that notional balance. Payments are settled quarterly on a net basis. As of June 30, 2011, we assessed our interest rate swap as being highly effective and we expect it to continue to be highly effective. While approximately $1.3 billion of our term loan remains unhedged as of June 30, 2011, the risk of variability on our floating interest rate is partially mitigated by the client margin loans on which we carry floating interest rates. At June 30, 2011, our receivables from our advisors’ clients for margin loan activity were approximately $252.0 million.
44
Off-Balance Sheet Arrangements
We enter into various off-balance-sheet arrangements in the ordinary course of business, primarily to meet the needs of our advisors’ clients. These arrangements include firm commitments to extend credit. For information on these arrangements, see Notes 11 and 16 to our unaudited condensed consolidated financial statements.
Contractual Obligations
The following table provides information with respect to our commitments and obligations as of June 30, 2011:
| | | | | | | | | | | | | | | | | | | | | |
| | | Payments Due by Period | |
| | | | | | | < 1 | | | 1-3 | | | 3-5 | | | > 5 | |
| | | Total | | Year | | | Years | | | Years | | | Years | |
| | | (In thousands) | |
| Leases and other obligations(1) | | $ | 80,372 | | | $ | 30,130 | | | $ | 31,229 | | | $ | 14,745 | | | $ | 4,268 | |
| Senior secured term loan facilities(2) | | | 1,339,653 | | | | 13,971 | | | | 322,503 | | | | 476,035 | | | | 527,144 | |
| Commitment fee on revolving line of credit(3) | | | 2,409 | | | | 1,261 | | | | 1,148 | | | | — | | | | — | |
| Variable interest payments: (4) | | | | | | | | | | | | | | | | | | | | |
| 2013 Loan (Hedged) | | | 1,315 | | | | 1,315 | | | | — | | | | — | | | | — | |
| 2013 Loan (Unhedged) | | | 10,534 | | | | 4,685 | | | | 5,849 | | | | — | | | | — | |
| 2015 Loan (Unhedged) | | | 80,805 | | | | 20,635 | | | | 40,510 | | | | 19,660 | | | | — | |
| 2017 Loan (Unhedged) | | | 172,300 | | | | 29,568 | | | | 58,048 | | | | 56,892 | | | | 27,792 | |
| Interest rate swap agreement(5) | | | 3,045 | | | | 3,045 | | | | — | | | | — | | | | — | |
| | | | | | | | | | | | | | | | |
| Total contractual cash obligations | | $ | 1,690,433 | | | $ | 104,610 | | | $ | 459,287 | | | $ | 567,332 | | | $ | 559,204 | |
| | | | | | | | | | | | | | | | |
| | |
| (1) | | Minimum payments have not been reduced by minimum sublease rental income of $6.4 million due in the future under noncancelable subleases. Note 11 of our unaudited condensed consolidated financial statements provides further detail on operating lease obligations and obligations under noncancelable service contracts. |
| |
| (2) | | Represents principal payments on our senior secured term loan facilities. See Note 9 of our unaudited condensed consolidated financial statements for further detail. |
| |
| (3) | | Represents commitment fees for unused borrowings on our senior secured revolving line of credit facility. See Note 9 of our unaudited condensed consolidated financial statements for further detail. |
| |
| (4) | | Our senior secured term loan facilities bear interest at floating rates. Variable interest payments are shown assuming the applicable LIBOR rates at June 30, 2011 remain unchanged. See Note 9 of our unaudited condensed consolidated financial statements for further detail. |
| |
| (5) | | Represents fixed interest payments net of variable interest received on our interest rate swap agreements. See Note 10 of our unaudited condensed consolidated financial statements for further detail. |
As of June 30, 2011, we reflect a liability for unrecognized tax benefits of $21.9 million, which we have included in income taxes payable in the unaudited condensed consolidated statements of financial condition. This amount has been excluded from the contractual obligations table because we are unable to reasonably predict the ultimate amount or timing of future tax payments.
Fair Value of Financial Instruments
We use fair value measurements to record certain financial assets and liabilities at fair value and to determine fair value disclosures.
45
We use prices obtained from an independent third-party pricing service to measure the fair value of our trading securities. We validate prices received from the pricing service using various methods including, comparison to prices received from additional pricing services, comparison to available market prices and review of other relevant market data including implied yields of major categories of securities.
At June 30, 2011, we did not adjust prices received from the independent third-party pricing service. For certificates of deposit and treasury securities, we utilize market-based inputs including observable market interest rates that correspond to the remaining maturities or next interest reset dates.
Critical Accounting Policies and Estimates
We have disclosed in our unaudited condensed consolidated financial statements and in “Item 7-Management’s Discussion and Analysis of Financial Condition and Results of Operations” included in our 2010 Annual Report on Form 10-K, those accounting policies that we consider to be significant in determining our results of operations and financial condition. The accounting principles used in preparing our unaudited condensed consolidated financial statements conform in all material respects to GAAP. There have been no material changes to those policies that we consider to be significant since the filing of our 2010 Annual Report on Form 10-K except for the addition of the following:
Acquisitions
When we acquire companies, we recognize separately from goodwill the assets acquired and the liabilities assumed at their acquisition date fair values. Goodwill as of the acquisition date is measured as the excess of consideration transferred and the net of the acquisition date fair values of the assets acquired and the liabilities assumed. While we use our best estimates and assumptions as a part of the purchase price allocation process to accurately value assets acquired and liabilities assumed at the acquisition date, our estimates are inherently uncertain and subject to refinement. As a result, during the measurement period, which may be up to one year from the acquisition date, we record adjustments to the assets acquired and liabilities assumed, with the corresponding offset to goodwill. Upon the conclusion of the measurement period or final determination of the values of assets acquired or liabilities assumed, whichever comes first, any subsequent adjustments are recorded to our consolidated statements of operations.
Accounting for business combinations requires our management to make significant estimates and assumptions, especially at the acquisition date with respect to intangible assets, support liabilities assumed, and pre-acquisition contingencies. Although we believe the assumptions and estimates we have made in the past have been reasonable and appropriate, they are based in part on historical experience, market data and information obtained from the management of the acquired companies and are inherently uncertain.
Examples of critical estimates in valuing certain of the intangible assets we have acquired include but are not limited to: (i) future expected cash flows from client relationships, advisor relationships and product sponsor relationships; (ii) estimates to develop or use software; and (iii) discount rates.
If we determine that a pre-acquisition contingency is probable in nature and estimable as of the acquisition date, we record our best estimate for such a contingency as a part of the preliminary purchase price allocation. We continue to gather information for and evaluate our pre-acquisition contingencies throughout the measurement period and if we make changes to the amounts recorded or if we identify additional pre-acquisition contingencies during the measurement period, such amounts will be included in the purchase price allocation during the measurement period and, subsequently, in our results of operations.
Recent Accounting Pronouncements
Refer to Note 2 of our unaudited condensed consolidated financial statements for a discussion of recent accounting standards and pronouncements.
46
Item 3. Quantitative and Qualitative Disclosures About Market Risk
Market Risk
We maintain trading securities owned and securities sold but not yet purchased in order to facilitate client transactions, to meet a portion of our clearing deposit requirements at various clearing organizations, and to track the performance of our research models. These securities include mutual funds, debt securities issued by the U.S. government, money market funds, corporate debt securities, certificates of deposit and equity securities.
Changes in value of our trading inventory may result from fluctuations in interest rates, credit ratings of the issuer, equity prices and the correlation among these factors. We manage our trading inventory by product type. Our activities to facilitate client transactions generally involve mutual fund activities, including dividend reinvestments. The balances are based upon pending client activities which are monitored by our broker dealer support services department. Because these positions arise from pending client transactions, there are no specific trading or position limits. Positions held to meet clearing deposit requirements consist of U.S. government securities. The amount of securities deposited depends upon the requirements of the clearing organization. The level of securities deposited is monitored by the settlement area within our broker dealer support services department. Our research department develops model portfolios that are used by advisors in developing client portfolios. We currently maintain approximately 175 accounts based on model portfolios. At the time the portfolio is developed, we purchase the securities in that model portfolio in an amount equal to the account minimum for a client. Account minimums vary by product and can range from $10,000 to $50,000 per model. We utilize these positions to track the performance of the research department. The limits on this activity are based at the inception of each new model.
At June 30, 2011, the fair value of our trading securities owned were $9.7 million. Securities sold but not yet purchased were $4.1 million at June 30, 2011. See Note 5 of our unaudited condensed consolidated financial statements for information regarding the fair value of trading securities owned and securities sold but not yet purchased associated with our client facilitation activities. See Note 5 of our unaudited condensed consolidated financial statements for information regarding the fair value of securities held to maturity.
We do not enter into contracts involving derivatives or other similar financial instruments for trading or proprietary purposes.
We also have market risk on the fees we earn that are based on the market value of advisory and brokerage assets, assets on which trail commissions are paid and assets eligible for sponsor payments.
Interest Rate Risk
We are exposed to risk associated with changes in interest rates. As of June 30, 2011, all of the outstanding debt under our senior secured credit facilities, $1.3 billion, was subject to floating interest rate risk. To provide some protection against potential rate increases associated with our floating senior secured credit facilities, we have entered into a derivative instrument in the form of an interest rate swap agreement with Morgan Stanley Capital Services, Inc. covering a portion ($65.0 million) of our senior secured indebtedness. While the unhedged portion of our senior secured debt is subject to increases in interest rates, we do not believe that a short-term change in interest rates would have a material impact on our income before taxes.
The following table summarizes the impact of increasing interest rates on our interest expense from the variable portion of our debt outstanding at June 30, 2011:
| | | | | | | | | | | | | | | | | | | | | |
| | | Outstanding at | | Annual Impact of an Interest Rate Increase of | |
| | | Variable Interest | | 10 Basis | | 25 Basis | | 50 Basis | | 100 Basis |
| Senior Secured Term Loans | | Rates | | Points | | Points | | Points | | Points |
| | | | | | | | | | | (In thousands) | | | | | |
| | | | | | | |
| 2013 Term Loan (Hedged)(1) | | $ | 65,000 | | | | $ | — | | | $ | — | | | $ | — | | | $ | — |
| 2013 Term Loan (Unhedged)(2) | | | 239,074 | | | | | 238 | | | | 595 | | | | 1,189 | | | | 2,379 |
| 2015 Term Loan (Unhedged)(3) | | | 479,435 | | | | | — | | | | — | | | | — | | | | — |
| 2017 Term Loan (Unhedged)(3) | | | 556,144 | | | | | — | | | | — | | | | — | | | | — |
| | | | | | | | | | | | | | | | |
| Variable Rate Debt Outstanding | | $ | 1,339,653 | | | | $ | 238 | | | $ | 595 | | | $ | 1,189 | | | $ | 2,379 |
| | | | | | | | | | | | | | | | |
47
| | |
| |
| (1) | | Represents the portion of our 2013 Term Loan that is hedged by interest rate swap agreements, which have been designated as cash flow hedges against specific payments due on the 2013 Term Loan. Accordingly, any interest rate differential is reflected in an adjustment to interest expense over the term of the interest rate swap agreements. The variable interest rate for the hedged portion of our 2013 Term Loan is based on the three-month LIBOR of 0.25%, plus the applicable interest rate margin of 1.75%. |
| |
| (2) | | Represents the unhedged portion of our 2013 Term Loan outstanding at June 30, 2011. The variable interest rate for the unhedged portion of our 2013 Term Loan is based on the one-month LIBOR of 0.19%, plus the applicable interest rate margin of 1.75%. |
| |
| (3) | | The variable interest rate for our 2015 Term Loan and our 2017 Term Loan is based on the greater of the one-month LIBOR of 0.19% or 1.50%, plus an applicable interest rate margin. |
We offer our advisors and their clients two primary cash sweep programs that are interest rate sensitive: our insured cash programs and money market sweep vehicles involving multiple money market fund providers. Our insured cash programs use multiple non-affiliated banks to provide up to $1.5 million ($3.0 million joint) of FDIC insurance for client deposits custodied at the banks. While clients earn interest for balances on deposit in the insured cash programs, we earn a fee. Our fees from the insured cash programs are based on prevailing interest rates in the current interest rate environment, but may be adjusted in an increasing or decreasing interest rate environment or for other reasons. Changes in interest rates and fees for the insured cash programs are monitored by our fee and rate setting committee (the “FRS committee”), which governs and approves any changes to our fees. By meeting promptly after interest rates change, or for other market or non-market reasons, the FRS committee balances financial risk of the insured cash programs with products that offer competitive client yields. However, as short-term interest rates hit lower levels, the FRS committee may be compelled to lower fees.
The average Federal Reserve effective federal funds rate for the three months ended June 30, 2011 was 0.09%. The following table reflects the approximate annual impact to income before taxes on our insured cash programs (assuming that client balances at June 30, 2011 remain unchanged) of an upward or downward change in short-term interest rates of one basis point:
| | | | | | | |
| | | Annualized Increase or Decrease of Income | | | | |
| Federal Reserve Effective Federal Funds Rate | | Before Taxes per One Basis Point Change | | | | |
| | | (Dollars in thousands) | | | | |
| | | | | | | |
| 0.00% - 0.25% | | | | $ | 1,300 | |
| 0.26% - 1.25% | | | | | 600 | |
| 1.26% - 2.50% | | | | | 300 | |
| > 2.50% | | | | | — | |
Actual impacts may vary depending on interest rate levels, the significance of change, and the FRS committee’s strategy in responding to that change.
Credit Risk
Credit risk is the risk of loss due to adverse changes in a borrower’s, issuer’s or counterparty’s ability to meet its financial obligations under contractual or agreed upon terms. We bear credit risk on the activities of our advisors’ clients, including the execution, settlement, and financing of various transactions on behalf of these clients.
These activities are transacted on either a cash or margin basis. Our credit exposure in these transactions consists primarily of margin accounts, through which we extend credit to clients collateralized by cash and securities in the client’s account. Under many of these agreements, we are permitted to sell or repledge these securities held as collateral and use these securities to enter into securities lending arrangements or to deliver to counterparties to cover short positions.
As our advisors execute margin transactions on behalf of their clients, we may incur losses if clients do not fulfill their obligations, the collateral in the client’s account is insufficient to fully cover losses from such investments, and our advisors fail to reimburse us for such losses. Our loss on margin accounts is immaterial and did not exceed $0.1 million during the three months ended June 30, 2011 and 2010. We monitor exposure to industry sectors and individual securities and perform analyses on a regular basis in connection with our margin lending activities. We adjust our margin requirements if we believe our risk exposure is not appropriate based on market conditions.
48
We are subject to concentration risk if we extend large loans to or have large commitments with a single counterparty, borrower, or group of similar counterparties or borrowers (e.g. in the same industry). Receivables from and payables to clients and stock borrowing and lending activities are conducted with a large number of clients and counterparties and potential concentration is carefully monitored. We seek to limit this risk through careful review of the underlying business and the use of limits established by senior management, taking into consideration factors including the financial strength of the counterparty, the size of the position or commitment, the expected duration of the position or commitment and other positions or commitments outstanding.
Operational Risk
Operational risk generally refers to the risk of loss resulting from our operations, including, but not limited to, improper or unauthorized execution and processing of transactions, deficiencies in our technology or financial operating systems and inadequacies or breaches in our control processes. We operate in diverse markets and are reliant on the ability of our employees and systems to process a large number of transactions. These risks are less direct and quantifiable than credit and market risk, but managing them is critical, particularly in a rapidly changing environment with increasing transaction volumes. In the event of a breakdown or improper operation of systems or improper action by employees or advisors, we could suffer financial loss, regulatory sanctions and damage to our reputation. Business continuity plans exist for critical systems, and redundancies are built into the systems as deemed appropriate. In order to mitigate and control operational risk, we have developed and continue to enhance specific policies and procedures that are designed to identify and manage operational risk at appropriate levels throughout our organization and within various departments. These control mechanisms attempt to ensure that operational policies and procedures are being followed and that our employees and advisors operate within established corporate policies and limits.
Risk Management
We have established various committees of the Board of Directors to manage the risks associated with our business. Our Audit Committee was established for the primary purpose of overseeing (i) the integrity of our consolidated financial statements, (ii) our compliance with legal and regulatory requirements that may impact our consolidated financial statements or financial operations, (iii) the independent auditor’s qualifications and independence and (iv) the performance of our independent auditor and internal audit function. Our Compensation and Human Resources Committee was established for the primary purpose of (i) overseeing our efforts to attract, retain and motivate members of our senior management team in partnership with the Chief Executive Officer, (ii) to carry out the Board’s overall responsibility relating to the determination of compensation for all executive officers, (iii) to oversee all other aspects of our compensation and human resource policies and (iv) to oversee our management resources, succession planning and management development activities. We also have established a Risk Oversight Committee comprised of a group of our senior-most executives to oversee the management of our business risks.
In addition to various committees, we have written policies and procedures that govern the conduct of business by our advisors, our employees, our relationship with advisors’ clients and the terms and conditions of our relationships with product manufacturers. Our client and advisor policies address the extension of credit for client accounts, data and physical security, compliance with industry regulation and codes of ethics to govern employee and advisor conduct among other matters.
Item 4.Controls and Procedures
Evaluation of Disclosure Controls and Procedures
Our Disclosure Committee, with the participation of our Chief Executive Officer and Chief Financial Officer, evaluated the effectiveness of our disclosure controls and procedures, as defined in Rules 13a-15(e) and 15d-15(e) under the Securities Exchange Act of 1934, as amended, as of the end of the period covered by this report. Based on that evaluation, the Chief Executive Officer and Chief Financial Officer concluded that our disclosure controls and procedures as of the end of the period covered by this report were effective.
49
Change in Internal Control over Financial Reporting
There were no changes in our internal control over financial reporting that occurred during the three months ended June 30, 2011, that have materially affected, or are reasonably likely to materially affect, our internal control over financial reporting.
50
PART II — OTHER INFORMATION
Item 1. Legal Proceedings
None.
Item 1A. Risk Factors
Information regarding the Company’s risks is set forth under Part I, “Item 1A. Risk Factors” in the Company’s 2010 Annual Report on Form 10-K.
Item 2. Unregistered Sales of Equity Securities and Use of Proceeds
The table below sets forth information regarding repurchases on a monthly basis during the second quarter of 2011:
| | | | | | | | | | | | | | | | | |
| | | | | | | | | | Total Number | | | Approximate | |
| | | | | | | | | | of Shares | | | Dollar Value of | |
| | | | | | | | | | Purchased as | | | Shares That May | |
| | Total Number | | | | | | Part of Publicly | | | Yet Be | |
| | of Shares | | Average Price | | Announced | | | Purchased Under | |
| Period | Purchased | | Paid per Share | | Program | | | the Program(1) | |
| May 26, 2011 through May 31, 2011 | | | 262,114 | | | $ | 35.39 | | | | 262,114 | | | $ | 70,723,626 | |
| June 1, 2011 through June 30, 2011 | | | 2,021,740 | | | $ | 34.77 | | | | 2,021,740 | | | $ | 432,112 | |
| | | | | | | | | | | | | | | |
| Total | | | 2,283,854 | | | $ | 34.84 | | | | 2,283,854 | | | $ | 432,112 | |
| | | | | | | | | | | | | | | |
| | |
| (1) | | On May 25, 2011, the Board of Directors approved a share repurchase program pursuant to which the Company may repurchase up to $80.0 million of its issued and outstanding shares of common stock through May 31, 2013. The purchases will be effected in open market transactions with the timing of purchases and the amount of stock purchased determined at the discretion of the Company’s management. |
Item 3. Defaults Upon Senior Securities
None.
Item 4. Removed and Reserved
Item 5. Other Information
None.
Item 6. Exhibits
| | | |
|
| 3.1 | | Amended and Restated Certificate of Incorporation (previously filed as Exhibit 3.1 to the registration statement on Form S-1 (File Number 333-167325) on July 9, 2010, and incorporated herein by reference, |
| 3.2 | | Second Amended and Restated Bylaws (previously filed as Exhibit 3.1 to the Current Report on Form 8-K (File Number 000-52609) on July 23, 2010 and incorporated herein by reference, |
| 31.1 | | Certification of the Chief Executive Officer pursuant to Rule 13a-14(a) (filed herewith). |
| 31.2 | | Certification of the Chief Financial Officer pursuant to Rule 13a-14(a) (filed herewith). |
| 32.1 | | Certification of the Chief Executive Officer pursuant to 18 U.S.C. Section 1350, as adopted pursuant to Section 906 of the Sarbanes-Oxley Act of 2002 (furnished herewith). |
| 32.2 | | Certification of the Chief Financial Officer pursuant to 18 U.S.C. Section 1350, as adopted pursuant to Section 906 of the Sarbanes-Oxley Act of 2002 (furnished herewith). |
| | | |
| 101.INS | | XBRL Instance Document |
| 101.SCH | | XBRL Taxonomy Extension Schema |
| 101.CAL | | XBRL Taxonomy Extension Calculation |
51
| | | |
|
| 101.LAB | | XBRL Taxonomy Extension Label |
| 101.PRE | | XBRL Taxonomy Extension Presentation |
52
SIGNATURES
Pursuant to the requirements of the Securities Exchange Act of 1934, the registrant has duly caused this report to be signed on its behalf by the undersigned thereunto duly authorized.
| | | | | |
| | LPL Investment Holdings Inc.
| |
| Date: August 3, 2011 | By: | /s/Mark S. Casady | |
| | | Mark S. Casady | |
| | | Chairman and Chief Executive Officer | |
| | | |
| Date: August 3, 2011 | By: | /s/Robert J. Moore | |
| | | Robert J. Moore | |
| | | Chief Financial Officer | |
| |
53