UNITED STATES
SECURITIES AND EXCHANGE COMMISSION
Washington, D.C. 20549
FORM N-CSR
CERTIFIED SHAREHOLDER REPORT OF REGISTERED
MANAGEMENT INVESTMENT COMPANIES
Investment Company Act file number 811-22067
| Nicholas-Applegate Global Equity & Convertible Income Fund | ||
| (Exact name of registrant as specified in charter) | ||
| 1345 Avenue of the Americas, New York, NY | 10105 | |
| (Address of principal executive offices) | (Zip code) | |
| Lawrence G. Altadonna - 1345 Avenue of the Americas, New York, New York 10105 | ||
| (Name and address of agent for service) | ||
Registrant’s telephone number, including area code: 212-739-3371
Date of fiscal year end: August 31, 2009
Date of reporting period: February 28, 2009
Form N-CSR is to be used by management investment companies to file reports with the Commission not later than 10 days after the transmission to stockholders of any report that is required to be transmitted to stockholders under Rule 30e-1 under the Investment Company Act of 1940 (17 CFR 270.30e-1). The Commission may use the information provided on Form N-CSR in its regulatory, disclosure review, inspection, and policymaking roles.
A registrant is required to disclose the information specified by Form N-CSR, and the Commission will make this information public. A registrant is not required to respond to the collection of information contained in Form N-CSR unless the Form displays a currently valid Office of Management and Budget (“OMB”) control number. Please direct comments concerning the accuracy of the information collection burden estimate and any suggestions for reducing the burden to Secretary, Securities and Exchange Commission, 450 Fifth Street, NW, Washington, DC 20549-0609. The OMB has reviewed this collection of information under the clearance requirements of 44 U.S.C. § 3507.
ITEM 1. REPORT TO SHAREHOLDERS
|
|
|
|
|
|
|
|
|
| Nicholas-Applegate Global Equity & Convertible Income Fund |
|
|
|
|
|
|
|
|
|
|
|
|
|
|
|
|
|
|
|
| Semi - Annual Report |
|
| February 28, 2009 |
|
|
|
|
|
|
|
|
|
|
|
|
|
| Contents |
|
|
|
|
|
| |
|
| 1 | ||
|
|
|
| |
|
| 2-3 | ||
|
|
|
| |
|
| 4 | ||
|
|
|
| |
|
| 5-17 | ||
|
|
|
|
|
|
|
| 18 | |
|
|
|
|
|
|
|
| 19 | |
|
|
|
|
|
|
|
| 20 | |
|
|
|
|
|
|
|
| 21-25 | |
|
|
|
|
|
|
|
| 26 | |
|
|
|
|
|
|
| Annual Shareholder Meeting Results/Proxy Voting Policies & Procedures |
| 27 |


|
Nicholas-Applegate Global Equity & Convertible Income Fund Letter to Shareholders |
April 15, 2009
Dear Shareholder:
Please find enclosed the semiannual report for the Nicholas-Applegate Global Equity & Convertible Fund (“the Fund”) for the fiscal six months ended February 28, 2009.
Corporate securities, including convertible bonds and global stocks, fell sharply during the six-month period as tight credit conditions and global economic slowing prompted investors to favor the relative safety of government bonds. In this environment, the Morgan Stanley Capital International All Country World Net Index declined 43.96% in U.S. dollar terms during the six-month reporting period. The Merrill Lynch All-Convertible Index declined 32.21%, the S&P 500 Index declined 41.82% and the Barclays Global U.S. Treasury Bond Index advanced 5.67% for the six-month period ended February 28, 2009.
Please refer to the following pages for more information on the Fund. If you have any questions regarding the information provided, we encourage you to contact your financial advisor or call the Fund’s shareholder servicing agent at (800) 331-1710. In addition, a wide range of information and resources is available on our Web site, www.allianzinvestors.com/closedendfunds.
Together with Allianz Global Investors Fund Management LLC, the Fund’s investment manager, and Nicholas-Applegate Capital Management LLC, the Fund’s sub-adviser, we thank you for investing with us.
We remain dedicated to serving your financial needs.
|
|
Sincerely, |
|
|
|
|
|
Hans W. Kertess | Brian S. Shlissel |
Chairman | President & Chief Executive Officer |


| 2.28.09 | Nicholas-Applegate Global Equity & Convertible Income Fund Semi-Annual Report 1
|
Nicholas-Applegate Global Equity & Convertible Income Fund Fund Insights |
February 28, 2009 (unaudited) |
|
|
• | For the fiscal six-month period ended February 28, 2009, Nicholas-Applegate Global Equity & Convertible Income Fund declined 38.02% on net asset value and 46.81% on market price. |
| |
Domestic Equity and Convertibles | |
| |
• | The simple conclusion regarding the past six month period ended February 28, 2009 was that the equity, convertible and debt markets experienced one of the most rapid sell-offs of all time. |
|
|
• | The beginning of the decline may be traced to mortgage delinquencies and falling housing prices. The housing downturn led to rapid quality and price declines in collateralized mortgage obligations (“CMOs”). Price declines in the CMO market led to price declines in all collateralized debt and loan obligations (CDOs, CLOs) which, in turn, cut off demand for loans. |
|
|
• | Historically, convertibles have offered downside protection in comparison to equities. During the fiscal six-month period, however, the convertible universe performed roughly in line with the S&P 500 and NASDAQ. While the larger financial sector weighted in the Merrill Lynch All Convertible Index partially explained the convertible performance, rapidly widening corporate bond spreads explained the balance. |
|
|
• | All industries both for equities and convertibles posted negative returns during the six month period. Consumer discretionary underperformance was the most severe of any industry. Materials, industrials and energy industries also underperformed as economic data worsened. The best-performing industries were consumer staples and healthcare. These industries performed well due to favorable operating performance as well as the flight to quality. |
|
|
• | Concurrent with the collapsing markets, the VIX (ticker symbol for the Chicago Board Options Exchange Volatility Index) first peaked in October and then re-peaked in November at an incredulous level of 80.8. These never- before-seen volatility levels were double previous historic highs. In fact, the average volatility during the three months ended February 28, 2009 was 35.7, outpacing historic averages since initial recordings. |
|
|
• | The rapid equity market correction and record spreads and yields experienced will be greatly analyzed. Ultimately, we believe, investors lost confidence in the equity and debt markets, and those sellers brought more sellers through forced liquidations (from leverage triggers or withdrawals) or through sheer panic. |
|
|
• | Have we seen the bottom? The answer is more difficult when looking at equities, but relatively easy when looking at corporate defaults. The high-yield market reached nearly double prior-cycle trough spreads without a significant increase in defaults. In this case, we believe the credit markets are oversold. Should there be a credit rally we expect convertibles issues to participate. |
|
|
• | The duration of the economic downturn is still not clear. Corporate earnings have been poor and economic statistics are weak and are not likely to rebound in the short-term. The Obama administration is being closely watched. How many more Troubled Asset Relief Program (“TARP”) and other bailout programs will combine with economic stimulus plans to attempt to foster growth? From an investor’s standpoint, we believe it will be just as prudent to focus on credit metrics as well as on corporate profits. |
|
|
• | Performance has been volatile as investors balance the uncertain outlook for the economy, corporate profits, and equity valuations versus prior cycles. The delevering of the market has continued into 2009, and it is unclear when the process will end. The tug of war between the deteriorating global economy and the massive and expanding global policy response package continued as the fiscal six-month period ended. |
2 Nicholas-Applegate Global Equity & Convertible Income Fund Semi-Annual Report | 2.28.09 |
|
Nicholas-Applegate Global Equity & Convertible Income Fund Fund Insights |
February 28, 2009 (unaudited) |
|
|
International | |
| |
• | International markets declined sharply during the six-month period ended February 28, 2009, with stocks in all sectors significantly decreasing; not surprisingly, financials stocks suffered the most, followed closely by materials. |
|
|
• | The global financial turmoil caused investors to seek a safe haven in the U.S. dollar, driving the currency higher; gains for the greenback equate to losses for U.S.-based investors in foreign stocks. |
|
|
• | In consumer discretionary holdings, auto companies DaimlerChrysler, Peugeot and Porsche lagged due to concerns regarding declining consumer demand. |
|
|
• | Within the Fund’s industrial holdings, Cookson Group was the most significant detractor from performance – this firm works with metals to produce industrial equipment, and was weak due to broad economic concerns. |
|
|
• | An underweighting in financials stocks contributed positively to relative results, as did the avoidance of many benchmark positions which experienced significant declines. |
|
|
• | An overweighting in telecom services also contributed positively to performance, and the Fund’s position in France Telecom added value on a relative basis – this stock benefited from growth in the French mobile phone market, as well as the firm’s decision to abandon efforts of acquiring Swedish telecom firm TeliaSonera. |
| 2.28.09 | Nicholas-Applegate Global Equity & Convertible Income Fund Semi-Annual Report 3
|
Nicholas-Applegate Global Equity & Convertible Income Fund Performance & Statistics |
February 28, 2009 (unaudited) |
|
|
|
|
|
|
Total Return(1): |
| Market Price |
| Net Asset Value (“NAV”) |
|
Six Months |
| (46.81)% |
| (38.02 | )% |
1 year |
| (48.83)% |
| (40.78 | )% |
Commencement of Operations (9/28/2007) to 2/28/09 |
| (45.55)% |
| (35.56 | )% |
|
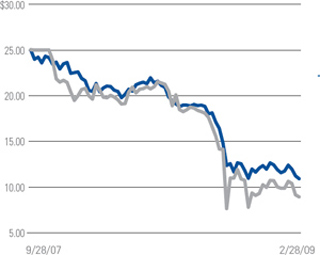
Market Price/NAV Performance: |
|
Commencement of Operations (9/28/2007) to 2/28/09 |
n NAV |
n Market Price |
|
|
|
|
|
Market Price/NAV: |
|
|
|
|
Market Price |
| $ | 8.93 |
|
NAV |
| $ | 10.92 |
|
Discount to NAV |
|
| (18.22 | )% |
Market Price Yield(2) |
|
| 15.68 | % |
|
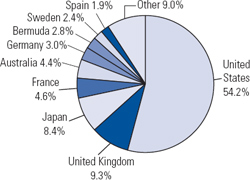
Investment Allocation |
(as a percentage of Common Stock) |
(1) Past performance is no guarantee of future results. Returns are calculated by determining the percentage change in net asset value or market share price (as applicable) during the period specified. The calculation assumes that all the Fund’s income dividends and capital gain distributions have been reinvested. Total return does not reflect broker commissions or sales charges. Total return for a period of less than one year is not annualized. Total return for a period of more than one year represents the average annual total return.
The Fund’s performance at market price will differ from its results at NAV. Although market price returns typically reflect investment results over time, during shorter periods returns at market price can also be influenced by factors such as changing views about the Fund, market conditions, supply and demand for the Fund’s shares, or changes in Fund distributions.
An investment in the Fund involves risk, including the loss of principal. Total return, market price, market price yield and net asset value will fluctuate with changes in market conditions. This data is provided for information only and is not intended for trading purposes. Closed-end funds, unlike open-end funds, are not continuously offered. There is a onetime public offering, and once issued, shares of closed-end funds are sold in the open market through a stock exchange. Net asset value is equal to total assets attributable to shareholders less total liabilities divided by the number of shares outstanding. Holdings are subject to change daily.
(2) Market Price Yield is determined by dividing the most recent (December 2008) annualized quarterly per share distribution to shareholders by the market price per share at February 28, 2009.
4 Nicholas-Applegate Global Equity & Convertible Income Fund Semi-Annual Report | 2.28.09 |
|
Nicholas-Applegate Global Equity & Convertible Income Fund Schedule of Investments |
February 28, 2009 (unaudited) |
|
|
|
|
|
|
|
|
Shares |
|
|
| Value |
| ||
COMMON STOCK—66.5% |
|
|
|
| |||
|
|
|
|
|
|
|
|
|
|
| Australia—1.9% |
|
|
|
|
|
|
|
|
|
|
|
|
|
|
| Airlines—0.2% |
|
|
|
|
|
|
|
|
|
|
|
|
| 152,554 |
| Qantas Airways Ltd. |
| $ | 150,538 |
|
|
|
|
|
|
| ||
|
|
|
|
|
|
|
|
|
|
| Banking—0.5% |
|
|
|
|
|
|
|
|
|
|
|
|
| 19,579 |
| Commonwealth Bank of Australia |
|
| 368,845 |
|
|
|
|
|
|
| ||
|
|
|
|
|
|
|
|
|
|
| Biotechnology—0.5% |
|
|
|
|
|
|
|
|
|
|
|
|
| 17,462 |
| CSL Ltd. (b) |
|
| 403,455 |
|
|
|
|
|
|
| ||
|
|
|
|
|
|
|
|
|
|
| Engineering & Construction—0.2% |
|
|
|
|
|
|
|
|
|
|
|
|
| 14,173 |
| Leighton Holdings Ltd. |
|
| 168,490 |
|
|
|
|
|
|
| ||
|
|
|
|
|
|
|
|
|
|
| Financial Services—0.1% |
|
|
|
|
|
|
|
|
|
|
|
|
| 139,994 |
| Challenger Financial Services Group Ltd. |
|
| 102,816 |
|
|
|
|
|
|
| ||
|
|
|
|
|
|
|
|
|
|
| Metals & Mining—0.4% |
|
|
|
|
|
|
|
|
|
|
|
|
| 13,924 |
| BHP Billiton Ltd. |
|
| 250,488 |
|
|
|
|
|
|
|
|
|
| 58,602 |
| OneSteel Ltd. |
|
| 62,266 |
|
|
|
|
|
|
| ||
|
|
|
|
|
| 312,754 |
|
|
|
|
|
|
| ||
|
|
|
|
|
|
|
|
|
|
| Austria—0.1% |
|
|
|
|
|
|
|
|
|
|
|
|
|
|
| Building Materials—0.0% |
|
|
|
|
|
|
|
|
|
|
|
|
| 3,027 |
| Wienerberger AG |
|
| 24,421 |
|
|
|
|
|
|
| ||
|
|
|
|
|
|
|
|
|
|
| Metals & Mining—0.1% |
|
|
|
|
|
|
|
|
|
|
|
|
| 2,316 |
| Voestalpine AG |
|
| 35,559 |
|
|
|
|
|
|
| ||
|
|
|
|
|
|
|
|
|
|
| Belgium—0.2% |
|
|
|
|
|
|
|
|
|
|
|
|
|
|
| Chemicals—0.2% |
|
|
|
|
|
|
|
|
|
|
|
|
| 5,374 |
| Tessenderlo Chemie NV |
|
| 157,897 |
|
|
|
|
|
|
| ||
|
|
|
|
|
|
|
|
|
|
| Bermuda—3.0% |
|
|
|
|
|
|
|
|
|
|
|
|
|
|
| Apparel—0.1% |
|
|
|
|
|
|
|
|
|
|
|
|
| 19,500 |
| Espirit Holdings Ltd. |
|
| 105,020 |
|
|
|
|
|
|
| ||
|
|
|
|
|
|
|
|
|
|
| Financial Services—1.0% |
|
|
|
|
|
|
|
|
|
|
|
|
| 31,248 |
| Lazard Ltd. |
|
| 758,701 |
|
|
|
|
|
|
| ||
|
|
|
|
|
|
|
|
|
|
| Insurance—1.6% |
|
|
|
|
|
|
|
|
|
|
|
|
| 42,000 |
| Platinum Underwriters Holdings Ltd. |
|
| 1,177,680 |
|
|
|
|
|
|
| ||
|
|
|
|
|
|
|
|
|
|
| Investment Companies—0.3% |
|
|
|
|
|
|
|
|
|
|
|
|
| 59,000 |
| Cheung Kong Infrastructure Holdings Ltd. |
|
| 223,116 |
|
|
|
|
|
|
| ||
|
|
|
|
|
|
|
|
|
|
| Transportation—0.0% |
|
|
|
|
|
|
|
|
|
|
|
|
| 10,500 |
| Orient Overseas International Ltd. |
|
| 23,900 |
|
|
|
|
|
|
| ||
|
|
|
|
|
|
|
|
|
|
| Canada—0.5% |
|
|
|
|
|
|
|
|
|
|
|
|
|
|
| Computers—0.5% |
|
|
|
|
|
|
|
|
|
|
|
|
| 9,100 |
| Research in Motion Ltd. (a) |
|
| 363,454 |
|
|
|
|
|
|
| ||
|
|
|
|
|
|
|
|
|
|
| Cayman Islands—0.2% |
|
|
|
|
|
|
|
|
|
|
|
|
|
|
| Chemicals—0.1% |
|
|
|
|
|
|
|
|
|
|
|
|
| 30,500 |
| Kingboard Chemical Holdings Ltd. |
|
| 49,368 |
|
|
|
|
|
|
| ||
|
|
|
|
|
|
|
|
|
|
| Forest Products & Paper—0.0% |
|
|
|
|
|
|
|
|
|
|
|
|
| 28,000 |
| Lee & Man Paper Manufacturing Ltd. |
|
| 13,181 |
|
|
|
|
|
|
| ||
| 2.28.09 | Nicholas-Applegate Global Equity & Convertible Income Fund Semi-Annual Report 5
|
Nicholas-Applegate Global Equity & Convertible Income Fund Schedule of Investments |
February 28, 2009 (unaudited) |
|
|
|
|
|
|
|
|
Shares |
|
|
| Value |
| ||
|
|
| Insurance—0.1% |
|
|
|
|
|
|
|
|
|
|
|
|
| 19,230 |
| XL Capital, Ltd. Cl A |
| $ | 63,651 |
|
|
|
|
|
|
| ||
|
|
|
|
|
|
|
|
|
|
| Semiconductors—0.0% |
|
|
|
|
|
|
|
|
|
|
|
|
| 16,500 |
| ASM Pacific Technology Ltd. |
|
| 46,738 |
|
|
|
|
|
|
| ||
|
|
|
|
|
|
|
|
|
|
| Denmark—0.1% |
|
|
|
|
|
|
|
|
|
|
|
|
|
|
| Building/Construction—0.1% |
|
|
|
|
|
|
|
|
|
|
|
|
| 2,000 |
| FLSmidth & Co. AS |
|
| 46,787 |
|
|
|
|
|
|
| ||
|
|
|
|
|
|
|
|
|
|
| Finland—0.2% |
|
|
|
|
|
|
|
|
|
|
|
|
|
|
| Food—0.1% |
|
|
|
|
|
|
|
|
|
|
|
|
| 4,984 |
| Kesko Oyj |
|
| 106,541 |
|
|
|
|
|
|
| ||
|
|
|
|
|
|
|
|
|
|
| Telecommunications—0.1% |
|
|
|
|
|
|
|
|
|
|
|
|
| 7,353 |
| Nokia Oyj |
|
| 69,025 |
|
|
|
|
|
|
| ||
|
|
|
|
|
|
|
|
|
|
| France—2.9% |
|
|
|
|
|
|
|
|
|
|
|
|
|
|
| Airlines—0.0% |
|
|
|
|
|
|
|
|
|
|
|
|
| 4,355 |
| Air France-KLM |
|
| 39,641 |
|
|
|
|
|
|
| ||
|
|
|
|
|
|
|
|
|
|
| Automotive—0.2% |
|
|
|
|
|
|
|
|
|
|
|
|
| 9,874 |
| Peugeot S.A. |
|
| 168,325 |
|
|
|
|
|
|
|
|
|
| 1,838 |
| Renault S.A. |
|
| 26,440 |
|
|
|
|
|
|
| ||
|
|
|
|
|
| 194,765 |
|
|
|
|
|
|
| ||
|
|
|
|
|
|
|
|
|
|
| Banking—0.4% |
|
|
|
|
|
|
|
|
|
|
|
|
| 4,922 |
| BNP Paribas |
|
| 159,689 |
|
|
|
|
|
|
|
|
|
| 12,598 |
| Credit Agricole S.A. |
|
| 122,221 |
|
|
|
|
|
|
| ||
|
|
|
|
|
| 281,910 |
|
|
|
|
|
|
| ||
|
|
|
|
|
|
|
|
|
|
| Home Furnishings—0.1% |
|
|
|
|
|
|
|
|
|
|
|
|
| 2,043 |
| SEB S.A. |
|
| 47,701 |
|
|
|
|
|
|
| ||
|
|
|
|
|
|
|
|
|
|
| Machinery-Diversified—0.3% |
|
|
|
|
|
|
|
|
|
|
|
|
| 4,912 |
| Alstom S.A. |
|
| 230,908 |
|
|
|
|
|
|
| ||
|
|
|
|
|
|
|
|
|
|
| Oil & Gas—0.5% |
|
|
|
|
|
|
|
|
|
|
|
|
| 8,490 |
| Total S.A. |
|
| 399,597 |
|
|
|
|
|
|
| ||
|
|
|
|
|
|
|
|
|
|
| Telecommunications—1.4% |
|
|
|
|
|
|
|
|
|
|
|
|
| 47,233 |
| France Telecom S.A. (b) |
|
| 1,057,465 |
|
|
|
|
|
|
| ||
|
|
|
|
|
|
|
|
|
|
| Germany—1.9% |
|
|
|
|
|
|
|
|
|
|
|
|
|
|
| Airlines—0.3% |
|
|
|
|
|
|
|
|
|
|
|
|
| 23,665 |
| Deutsche Lufthansa AG |
|
| 257,666 |
|
|
|
|
|
|
| ||
|
|
|
|
|
|
|
|
|
|
| Automotive—0.7% |
|
|
|
|
|
|
|
|
|
|
|
|
| 17,212 |
| Daimler AG (b) |
|
| 387,597 |
|
|
|
|
|
|
|
|
|
| 3,950 |
| Porsche Automobile Holding SE |
|
| 161,510 |
|
|
|
|
|
|
| ||
|
|
|
|
|
| 549,107 |
|
|
|
|
|
|
| ||
|
|
|
|
|
|
|
|
|
|
| Chemicals—0.5% |
|
|
|
|
|
|
|
|
|
|
|
|
| 7,688 |
| K+S AG |
|
| 342,168 |
|
|
|
|
|
|
| ||
|
|
|
|
|
|
|
|
|
|
| Electric—0.1% |
|
|
|
|
|
|
|
|
|
|
|
|
| 568 |
| RWE AG |
|
| 35,742 |
|
|
|
|
|
|
| ||
|
|
|
|
|
|
|
|
|
|
| Metals & Mining—0.1% |
|
|
|
|
|
|
|
|
|
|
|
|
| 1,548 |
| Salzgitter AG |
|
| 95,395 |
|
|
|
|
|
|
| ||
6 Nicholas-Applegate Global Equity & Convertible Income Fund Semi-Annual Report | 2.28.09 |
|
Nicholas-Applegate Global Equity & Convertible Income Fund Schedule of Investments |
February 28, 2009 (unaudited) |
|
|
|
|
|
|
|
|
Shares |
|
|
| Value |
| ||
|
|
| Miscellaneous Manufacturing—0.2% |
|
|
|
|
|
|
|
|
|
|
|
|
| 2,992 |
| Siemans AG |
| $ | 150,409 |
|
|
|
|
|
|
| ||
|
|
|
|
|
|
|
|
|
|
| Greece—0.1% |
|
|
|
|
|
|
|
|
|
|
|
|
|
|
| Banking—0.1% |
|
|
|
|
|
|
|
|
|
|
|
|
| 4,039 |
| National Bank of Greece S.A. |
|
| 49,464 |
|
|
|
|
|
|
| ||
|
|
|
|
|
|
|
|
|
|
| Hong Kong—1.2% |
|
|
|
|
|
|
|
|
|
|
|
|
|
|
| Airlines—0.3% |
|
|
|
|
|
|
|
|
|
|
|
|
| 197,000 |
| Cathay Pacific Airways Ltd. |
|
| 204,300 |
|
|
|
|
|
|
| ||
|
|
|
|
|
|
|
|
|
|
| Electric—0.1% |
|
|
|
|
|
|
|
|
|
|
|
|
| 38,000 |
| China Resources Power Holdings Co., Ltd. |
|
| 70,318 |
|
|
|
|
|
|
| ||
|
|
|
|
|
|
|
|
|
|
| Financial Services—0.1% |
|
|
|
|
|
|
|
|
|
|
|
|
| 8,000 |
| Hong Kong Exchanges & Clearing Ltd. |
|
| 63,274 |
|
|
|
|
|
|
| ||
|
|
|
|
|
|
|
|
|
|
| Holding Companies Diversified—0.4% |
|
|
|
|
|
|
|
|
|
|
|
|
| 56,000 |
| Swire Pacific Ltd. |
|
| 344,002 |
|
|
|
|
|
|
| ||
|
|
|
|
|
|
|
|
|
|
| Real Estate—0.3% |
|
|
|
|
|
|
|
|
|
|
|
|
| 41,000 |
| Hang Lung Group Ltd. |
|
| 109,080 |
|
|
|
|
|
|
|
|
|
| 118,000 |
| New World Development Ltd. |
|
| 105,325 |
|
|
|
|
|
|
| ||
|
|
|
|
|
| 214,405 |
|
|
|
|
|
|
| ||
|
|
|
|
|
|
|
|
|
|
| Ireland—0.0% |
|
|
|
|
|
|
|
|
|
|
|
|
|
|
| Banking—0.0% |
|
|
|
|
|
|
|
|
|
|
|
|
| 20,740 |
| Anglo Irish Bank Corp. PLC (f) |
|
| 263 |
|
|
|
|
|
|
| ||
|
|
|
|
|
|
|
|
|
|
| Financial Services—0.0% |
|
|
|
|
|
|
|
|
|
|
|
|
| 9,738 |
| Irish Life & Permanent PLC |
|
| 9,250 |
|
|
|
|
|
|
| ||
|
|
|
|
|
|
|
|
|
|
| Italy—0.8% |
|
|
|
|
|
|
|
|
|
|
|
|
|
|
| Aerospace/Defense—0.1% |
|
|
|
|
|
|
|
|
|
|
|
|
| 4,513 |
| Finmeccania SpA |
|
| 57,615 |
|
|
|
|
|
|
| ||
|
|
|
|
|
|
|
|
|
|
| Energy—0.3% |
|
|
|
|
|
|
|
|
|
|
|
|
| 54,358 |
| Enel SpA |
|
| 270,661 |
|
|
|
|
|
|
| ||
|
|
|
|
|
|
|
|
|
|
| Home Furnishings—0.1% |
|
|
|
|
|
|
|
|
|
|
|
|
| 14,735 |
| Indesit Co. SpA |
|
| 42,382 |
|
|
|
|
|
|
| ||
|
|
|
|
|
|
|
|
|
|
| Utilities—0.3% |
|
|
|
|
|
|
|
|
|
|
|
|
| 13,395 |
| ENI SpA |
|
| 267,844 |
|
|
|
|
|
|
| ||
|
|
|
|
|
|
|
|
|
|
| Japan—5.6% |
|
|
|
|
|
|
|
|
|
|
|
|
|
|
| Agriculture—0.0% |
|
|
|
|
|
|
|
|
|
|
|
|
| 16 |
| Japan Tobacco, Inc. |
|
| 38,066 |
|
|
|
|
|
|
| ||
|
|
|
|
|
|
|
|
|
|
| Automotive—0.1% |
|
|
|
|
|
|
|
|
|
|
|
|
| 5,800 |
| Tokai Rika Co., Ltd. |
|
| 45,992 |
|
|
|
|
|
|
| ||
|
|
|
|
|
|
|
|
|
|
| Banking—0.3% |
|
|
|
|
|
|
|
|
|
|
|
|
| 169,000 |
| Hokuhoku Financial Group, Inc. |
|
| 261,420 |
|
|
|
|
|
|
| ||
|
|
|
|
|
|
|
|
|
|
| Electrical Components & Equipment—0.0% |
|
|
|
|
|
|
|
|
|
|
|
|
| 13,000 |
| Toshiba Corp. |
|
| 31,417 |
|
|
|
|
|
|
| ||
| 2.28.09 | Nicholas-Applegate Global Equity & Convertible Income Fund Semi-Annual Report 7
|
Nicholas-Applegate Global Equity & Convertible Income Fund Schedule of Investments |
February 28, 2009 (unaudited) |
|
|
|
|
|
|
|
|
Shares |
|
|
| Value |
| ||
|
|
| Electronics—0.3% |
|
|
|
|
|
|
|
|
|
|
|
|
| 5,500 |
| Mitsumi Electric Co., Ltd. |
| $ | 67,596 |
|
|
|
|
|
|
|
|
|
| 23,000 |
| Nippon Chemi-Con Corp. |
|
| 36,581 |
|
|
|
|
|
|
|
|
|
| 14,000 |
| Star Micronics Co., Ltd. |
|
| 117,254 |
|
|
|
|
|
|
| ||
|
|
|
|
|
| 221,431 |
|
|
|
|
|
|
| ||
|
|
|
|
|
|
|
|
|
|
| Entertainment—0.5% |
|
|
|
|
|
|
|
|
|
|
|
|
| 7,900 |
| Sankyo Co., Ltd. |
|
| 353,642 |
|
|
|
|
|
|
| ||
|
|
|
|
|
|
|
|
|
|
| Financial Services—0.3% |
|
|
|
|
|
|
|
|
|
|
|
|
| 490 |
| ORIX Corp. |
|
| 9,928 |
|
|
|
|
|
|
|
|
|
| 13,600 |
| Promise Co., Ltd. |
|
| 181,189 |
|
|
|
|
|
|
| ||
|
|
|
|
|
| 191,117 |
|
|
|
|
|
|
| ||
|
|
|
|
|
|
|
|
|
|
| Home Furnishings—0.3% |
|
|
|
|
|
|
|
|
|
|
|
|
| 13,300 |
| Sony Corp. |
|
| 222,147 |
|
|
|
|
|
|
| ||
|
|
|
|
|
|
|
|
|
|
| Machinery-Diversified—0.1% |
|
|
|
|
|
|
|
|
|
|
|
|
| 4,700 |
| Shima Seiki Manufacturing Ltd. |
|
| 84,616 |
|
|
|
|
|
|
| ||
|
|
|
|
|
|
|
|
|
|
| Manufacturing—0.4% |
|
|
|
|
|
|
|
|
|
|
|
|
| 3,500 |
| FUJIFILM Holdings Corp. |
|
| 64,908 |
|
|
|
|
|
|
|
|
|
| 5,000 |
| Glory Ltd. |
|
| 81,217 |
|
|
|
|
|
|
|
|
|
| 5,000 |
| Nikon Corp. |
|
| 46,754 |
|
|
|
|
|
|
|
|
|
| 7,000 |
| Olympus Corp. |
|
| 92,108 |
|
|
|
|
|
|
| ||
|
|
|
|
|
| 284,987 |
|
|
|
|
|
|
| ||
|
|
|
|
|
|
|
|
|
|
| Metals & Mining—0.3% |
|
|
|
|
|
|
|
|
|
|
|
|
| 4,300 |
| JFE Holdings, Inc. |
|
| 92,805 |
|
|
|
|
|
|
|
|
|
| 43,000 |
| Nippon Steel Corp. |
|
| 112,589 |
|
|
|
|
|
|
|
|
|
| 25,000 |
| Sumitomo Metal Industries Ltd. |
|
| 46,712 |
|
|
|
|
|
|
| ||
|
|
|
|
|
| 252,106 |
|
|
|
|
|
|
| ||
|
|
|
|
|
|
|
|
|
|
| Pharmaceuticals—0.2% |
|
|
|
|
|
|
|
|
|
|
|
|
| 6,000 |
| Chugai Pharmaceutical Co., Ltd. |
|
| 101,732 |
|
|
|
|
|
|
|
|
|
| 3,300 |
| Daiichi Sankyo Co., Ltd. |
|
| 52,882 |
|
|
|
|
|
|
| ||
|
|
|
|
|
| 154,614 |
|
|
|
|
|
|
| ||
|
|
|
|
|
|
|
|
|
|
| Real Estate—0.1% |
|
|
|
|
|
|
|
|
|
|
|
|
| 2,000 |
| Daito Trust Construction Co., Ltd. |
|
| 62,822 |
|
|
|
|
|
|
| ||
|
|
|
|
|
|
|
|
|
|
| Retail—0.0% |
|
|
|
|
|
|
|
|
|
|
|
|
| 3,000 |
| Aoyama Trading Co., Ltd. |
|
| 36,547 |
|
|
|
|
|
|
| ||
|
|
|
|
|
|
|
|
|
|
| Telecommunications—0.5% |
|
|
|
|
|
|
|
|
|
|
|
|
| 50 |
| KDDI Corp. |
|
| 261,265 |
|
|
|
|
|
|
|
|
|
| 2,100 |
| Nippon Telegraph & Telephone Corp. |
|
| 89,565 |
|
|
|
|
|
|
| ||
|
|
|
|
|
| 350,830 |
|
|
|
|
|
|
| ||
|
|
|
|
|
|
|
|
|
|
| Toys/Games/Hobbies—0.1% |
|
|
|
|
|
|
|
|
|
|
|
|
| 300 |
| Nintendo Co., Ltd. |
|
| 85,431 |
|
|
|
|
|
|
| ||
|
|
|
|
|
|
|
|
|
|
| Transportation—0.8% |
|
|
|
|
|
|
|
|
|
|
|
|
| 1,700 |
| East Japan Railway Co. |
|
| 101,549 |
|
|
|
|
|
|
|
|
|
| 71,000 |
| Mitsui OSK Lines Ltd. |
|
| 358,957 |
|
|
|
|
|
|
|
|
|
| 32,000 |
| Nippon Yusen KK |
|
| 131,668 |
|
|
|
|
|
|
| ||
|
|
|
|
|
| 592,174 |
|
|
|
|
|
|
| ||
8 Nicholas-Applegate Global Equity & Convertible Income Fund Semi-Annual Report | 2.28.09 |
|
Nicholas-Applegate Global Equity & Convertible Income Fund Schedule of Investments |
|
|
|
|
|
|
|
|
Shares |
|
|
| Value |
| ||
| |||||||
|
|
| Wholesale—1.3% |
|
|
|
|
| |||||||
| 54,000 |
| ITOCHU Corp. |
| $ | 241,513 |
|
| |||||||
| 70,000 |
| Marubeni Corp. |
|
| 216,762 |
|
| |||||||
| 26,000 |
| Mitsui & Co., Ltd. |
|
| 238,886 |
|
| |||||||
| 36,900 |
| Sumitomo Corp. |
|
| 307,307 |
|
|
|
|
|
|
| ||
|
|
|
|
|
| 1,004,468 |
|
|
|
|
|
|
| ||
| |||||||
|
|
| Luxembourg—0.1% |
|
|
|
|
| |||||||
|
|
| Metals & Mining—0.1% |
|
|
|
|
| |||||||
| 3,088 |
| ArcelorMittal |
|
| 59,294 |
|
|
|
|
|
|
| ||
| |||||||
|
|
| Netherlands—0.1% |
|
|
|
|
| |||||||
|
|
| Insurance—0.1% |
|
|
|
|
| |||||||
| 14,541 |
| ING Groep NV |
|
| 65,849 |
|
|
|
|
|
|
| ||
| |||||||
|
|
| New Zealand—0.1% |
|
|
|
|
| |||||||
|
|
| Building Materials—0.1% |
|
|
|
|
| |||||||
| 27,259 |
| Fletcher Building Ltd. |
|
| 70,679 |
|
|
|
|
|
|
| ||
| |||||||
|
|
| Norway—0.4% |
|
|
|
|
| |||||||
|
|
| Chemicals—0.3% |
|
|
|
|
| |||||||
| 10,500 |
| Yara International ASA (a) |
|
| 221,491 |
|
|
|
|
|
|
| ||
| |||||||
|
|
| Oil & Gas—0.1% |
|
|
|
|
| |||||||
| 3,400 |
| TGS Nopec Geophysical Co. ASA (a) |
|
| 22,069 |
|
| |||||||
| 8,000 |
| Seadrill Ltd. |
|
| 60,605 |
|
|
|
|
|
|
| ||
|
|
|
|
|
| 82,674 |
|
|
|
|
|
|
| ||
| |||||||
|
|
| Singapore—0.7% |
|
|
|
|
| |||||||
|
|
| Airlines—0.4% |
|
|
|
|
| |||||||
| 40,000 |
| Singapore Airlines Ltd. |
|
| 260,910 |
|
|
|
|
|
|
| ||
| |||||||
|
|
| Banking—0.1% |
|
|
|
|
| |||||||
| 36,000 |
| Oversea-Chinese Banking Corp. |
|
| 102,958 |
|
|
|
|
|
|
| ||
| |||||||
|
|
| Electronics—0.1% |
|
|
|
|
| |||||||
| 26,000 |
| Venture Corp., Ltd. |
|
| 81,806 |
|
|
|
|
|
|
| ||
| |||||||
|
|
| Real Estate—0.0% |
|
|
|
|
| |||||||
| 71,000 |
| Wing Tai Holdings Ltd. |
|
| 33,210 |
|
|
|
|
|
|
| ||
| |||||||
|
|
| Wholesale—0.1% |
|
|
|
|
| |||||||
| 17,000 |
| Jardine Cycle & Carriage Ltd. |
|
| 95,832 |
|
|
|
|
|
|
| ||
| |||||||
|
|
| Spain—1.6% |
|
|
|
|
| |||||||
|
|
| Building/Construction—0.5% |
|
|
|
|
| |||||||
| 9,221 |
| ACS Actividades de Construccion y Servicios S.A. |
|
| 364,812 |
|
| |||||||
| 2,822 |
| Sacyr Vallehermoso S.A. |
|
| 19,596 |
|
| |||||||
|
|
|
|
|
| ||
|
|
|
|
|
| 384,408 |
|
|
|
|
|
|
| ||
| |||||||
|
|
| Telecommunications—1.1% |
|
|
|
|
| |||||||
| 45,274 |
| Telefonica S.A. |
|
| 834,740 |
|
|
|
|
|
|
| ||
| |||||||
|
|
| Sweden—1.3% |
|
|
|
|
| |||||||
|
|
| Banking—0.1% |
|
|
|
|
| |||||||
| 19,000 |
| Nordea Bank AB |
|
| 94,847 |
|
| |||||||
| 4,200 |
| Swedbank AB |
|
| 10,874 |
|
|
|
|
|
|
| ||
|
|
|
|
|
| 105,721 |
|
|
|
|
|
|
| ||
| 2.28.09 | Nicholas-Applegate Global Equity & Convertible Income Fund Semi-Annual Report 9
|
Nicholas-Applegate Global Equity & Convertible Income Fund Schedule of Investments |
|
|
|
|
|
|
|
|
Shares |
|
|
| Value |
| ||
| |||||||
|
|
| Hand/Machine Tools—0.1% |
|
|
|
|
| |||||||
| 20,200 |
| Sandvik AB |
| $ | 107,923 |
|
|
|
|
|
|
| ||
| |||||||
|
|
| Home Furnishings—0.1% |
|
|
|
|
| |||||||
| 5,400 |
| Electrolux AB |
|
| 36,785 |
|
|
|
|
|
|
| ||
| |||||||
|
|
| Machinery-Diversified—0.1% |
|
|
|
|
| |||||||
| 14,200 |
| Volvo AB |
|
| 59,456 |
|
|
|
|
|
|
| ||
| |||||||
|
|
| Manufacturing—0.1% |
|
|
|
|
| |||||||
| 16,000 |
| Trelleborg AB |
|
| 47,217 |
|
|
|
|
|
|
| ||
| |||||||
|
|
| Retail—0.6% |
|
|
|
|
| |||||||
| 13,200 |
| Hennes & Mauritz AB |
|
| 490,242 |
|
|
|
|
|
|
| ||
| |||||||
|
|
| Telecommunications—0.2% |
|
|
|
|
| |||||||
| 15,995 |
| LM Ericson—Class B |
|
| 129,713 |
|
|
|
|
|
|
| ||
| |||||||
|
|
| Switzerland—1.2% |
|
|
|
|
| |||||||
|
|
| Financial Service—0.1% |
|
|
|
|
| |||||||
| 2,773 |
| Credit Suisse Group AG |
|
| 67,764 |
|
|
|
|
|
|
| ||
| |||||||
|
|
| Insurance—0.6% |
|
|
|
|
| |||||||
| 3,450 |
| Zurich Financial Services AG (b) |
|
| 490,614 |
|
|
|
|
|
|
| ||
| |||||||
|
|
| Pharmaceuticals—0.4% |
|
|
|
|
| |||||||
| 5,878 |
| Actelion Ltd. (a) |
|
| 279,137 |
|
|
|
|
|
|
| ||
| |||||||
|
|
| Retail—0.1% |
|
|
|
|
| |||||||
| 656 |
| Swatch Group AG |
|
| 73,274 |
|
|
|
|
|
|
| ||
| |||||||
|
|
| United Kingdom—6.2% |
|
|
|
|
| |||||||
|
|
| Aerospace/Defense—0.1% |
|
|
|
|
| |||||||
| 11,929 |
| BAE Systems PLC |
|
| 62,704 |
|
|
|
|
|
|
| ||
| |||||||
|
|
| Agriculture—0.5% |
|
|
|
|
| |||||||
| 14,650 |
| British American Tobacco PLC (a) (b) |
|
| 372,826 |
|
|
|
|
|
|
| ||
| |||||||
|
|
| Banking—0.2% |
|
|
|
|
| |||||||
| 19,664 |
| Barclays PLC |
|
| 25,684 |
|
| |||||||
| 17,896 |
| Lloyds TSB Group PLC |
|
| 14,627 |
|
| |||||||
| 51,937 |
| Royal Bank of Scotland Group PLC (a) |
|
| 16,841 |
|
| |||||||
| 9,470 |
| Standard Chartered PLC |
|
| 88,858 |
|
|
|
|
|
|
| ||
|
|
|
|
|
| 146,010 |
|
|
|
|
|
|
| ||
| |||||||
|
|
| Commercial Services—0.2% |
|
|
|
|
| |||||||
| 13,579 |
| Aggreko PLC |
|
| 68,626 |
|
| |||||||
| 14,108 |
| Michael Page International PLC |
|
| 43,048 |
|
|
|
|
|
|
| ||
|
|
|
|
|
| 111,674 |
|
|
|
|
|
|
| ||
| |||||||
|
|
| Food—0.4% |
|
|
|
|
| |||||||
| 92,742 |
| WM Morrison Supermarkets PLC (b) |
|
| 339,174 |
|
|
|
|
|
|
| ||
| |||||||
|
|
| Home Furnishings—0.0% |
|
|
|
|
| |||||||
| 72,326 |
| GALIFORM PLC |
|
| 15,090 |
|
|
|
|
|
|
| ||
| |||||||
|
|
| Insurance—0.3% |
|
|
|
|
| |||||||
| 253,484 |
| Old Mutual PLC |
|
| 148,311 |
|
| |||||||
| 45,432 |
| Standard Life PLC |
|
| 112,083 |
|
|
|
|
|
|
| ||
|
|
|
|
|
| 260,394 |
|
|
|
|
|
|
| ||
10 Nicholas-Applegate Global Equity & Convertible Income Fund Semi-Annual Report | 2.28.09 |
|
Nicholas-Applegate Global Equity & Convertible Income Fund Schedule of Investments |
|
|
|
|
|
|
|
|
Shares |
|
|
| Value |
| ||
| |||||||
|
|
| Manufacturing—0.1% |
|
|
|
|
| |||||||
| 17,900 |
| Charter PLC |
| $ | 106,903 |
|
| |||||||
| 49,614 |
| Cookson Group PLC |
|
| 9,135 |
|
|
|
|
|
|
| ||
|
|
|
|
|
| 116,038 |
|
|
|
|
|
|
| ||
| |||||||
|
|
| Media—0.1% |
|
|
|
|
| |||||||
| 12,965 |
| WPP PLC |
|
| 66,970 |
|
|
|
|
|
|
| ||
| |||||||
|
|
| Metals & Mining—1.1% |
|
|
|
|
| |||||||
| 6,416 |
| Anglo American PLC |
|
| 90,107 |
|
| |||||||
| 36,554 |
| BHP Billiton PLC (b) |
|
| 567,203 |
|
| |||||||
| 5,372 |
| Rio Tinto PLC |
|
| 136,533 |
|
| |||||||
| 4,527 |
| Xstrata PLC |
|
| 44,404 |
|
|
|
|
|
|
| ||
|
|
|
|
|
| 838,247 |
|
|
|
|
|
|
| ||
| |||||||
|
|
| Miscellaneous Manufacturer—0.1% |
|
|
|
|
| |||||||
| 4,730 |
| Smiths Group PLC |
|
| 55,669 |
|
|
|
|
|
|
| ||
| |||||||
|
|
| Oil & Gas—2.0% |
|
|
|
|
| |||||||
| 16,993 |
| BG Group PLC |
|
| 241,844 |
|
| |||||||
|
|
| Royal Dutch Shell PLC, |
|
|
|
|
| |||||||
| 16,201 |
| Class A |
|
| 354,130 |
|
| |||||||
| 45,399 |
| Class B (b) |
|
| 948,803 |
|
|
|
|
|
|
| ||
|
|
|
|
|
| 1,544,777 |
|
|
|
|
|
|
| ||
| |||||||
|
|
| Retail—0.6% |
|
|
|
|
| |||||||
| 16,621 |
| Game Group PLC |
|
| 34,404 |
|
| |||||||
| 26,858 |
| Marks & Spencer Group PLC |
|
| 98,888 |
|
| |||||||
| 21,928 |
| Next PLC |
|
| 362,043 |
|
|
|
|
|
|
| ||
|
|
|
|
|
| 495,335 |
|
|
|
|
|
|
| ||
| |||||||
|
|
| Telecommunications—0.4% |
|
|
|
|
| |||||||
| 165,068 |
| Vodafone Group PLC |
|
| 291,203 |
|
|
|
|
|
|
| ||
| |||||||
|
|
| Venture Capital—0.1% |
|
|
|
|
| |||||||
| 17,856 |
| 3i Group PLC |
|
| 50,591 |
|
|
|
|
|
|
| ||
| |||||||
|
|
| United States—36.1% |
|
|
|
|
| |||||||
|
|
| Aerospace/Defense—1.8% |
|
|
|
|
| |||||||
| 10,300 |
| L-3 Communications Holdings, Inc. |
|
| 696,795 |
|
| |||||||
| 16,850 |
| United Technologies Corp. |
|
| 687,986 |
|
|
|
|
|
|
| ||
|
|
|
|
|
| 1,384,781 |
|
|
|
|
|
|
| ||
| |||||||
|
|
| Agriculture—0.7% |
|
|
|
|
| |||||||
| 20,500 |
| Archer-Daniels-Midland Co. |
|
| 546,530 |
|
|
|
|
|
|
| ||
| |||||||
|
|
| Automotive—0.5% |
|
|
|
|
| |||||||
| 31,200 |
| Johnson Controls, Inc. |
|
| 355,056 |
|
|
|
|
|
|
| ||
| |||||||
|
|
| Beverages—2.3% |
|
|
|
|
| |||||||
| 20,100 |
| Coca-Cola Co. |
|
| 821,085 |
|
| |||||||
| 15,600 |
| Molson Coors Brewing Co.—Class B |
|
| 549,588 |
|
| |||||||
| 7,600 |
| PepsiCo., Inc. |
|
| 365,864 |
|
|
|
|
|
|
| ||
|
|
|
|
|
| 1,736,537 |
|
|
|
|
|
|
| ||
| |||||||
|
|
| Coal—0.2% |
|
|
|
|
| |||||||
| 5,900 |
| Peabody Energy Corp. |
|
| 139,653 |
|
|
|
|
|
|
| ||
| 2.28.09 | Nicholas-Applegate Global Equity & Convertible Income Fund Semi-Annual Report 11
|
Nicholas-Applegate Global Equity & Convertible Income Fund Schedule of Investments |
|
|
|
|
|
|
|
|
Shares |
|
|
| Value |
| ||
| |||||||
|
|
| Commercial Services—1.2% |
|
|
|
|
| |||||||
| 21,900 |
| McKesson Corp. |
| $ | 898,338 |
|
|
|
|
|
|
| ||
| |||||||
|
|
| Computers—1.6% |
|
|
|
|
| |||||||
| 51,700 |
| EMC Corp. (a) |
|
| 542,850 |
|
| |||||||
| 7,500 |
| International Business Machines Corp. |
|
| 690,225 |
|
|
|
|
|
|
| ||
|
|
|
|
|
| 1,233,075 |
|
|
|
|
|
|
| ||
| |||||||
|
|
| Cosmetics/Personal Care—1.0% |
|
|
|
|
| |||||||
| 16,500 |
| Procter & Gamble Co. |
|
| 794,805 |
|
|
|
|
|
|
| ||
| |||||||
|
|
| Electric—1.5% |
|
|
|
|
| |||||||
| 12,500 |
| Constellation Energy Group, Inc. |
|
| 247,000 |
|
| |||||||
| 13,855 |
| Entergy Corp. |
|
| 933,688 |
|
|
|
|
|
|
| ||
| |||||||
|
|
|
|
|
| 1,180,688 |
|
|
|
|
|
|
| ||
| |||||||
|
|
| Electric Equipment & Instruments—0.8% |
|
|
|
|
| |||||||
| 9,700 |
| Diamond Offshore Drilling, Inc. |
|
| 607,608 |
|
|
|
|
|
|
| ||
| |||||||
|
|
| Electronics—0.5% |
|
|
|
|
| |||||||
| 14,000 |
| Amphenol Corp. |
|
| 355,880 |
|
|
|
|
|
|
| ||
| |||||||
|
|
| Healthcare-Products—1.5% |
|
|
|
|
| |||||||
| 15,600 |
| Baxter International, Inc. |
|
| 794,196 |
|
| |||||||
| 3,680 |
| Intuitive Surgical, Inc. (a) |
|
| 334,733 |
|
|
|
|
|
|
| ||
|
|
|
|
|
| 1,128,929 |
|
|
|
|
|
|
| ||
| |||||||
|
|
| Insurance—1.4% |
|
|
|
|
| |||||||
| 23,000 |
| Cigna Corp. |
|
| 362,480 |
|
| |||||||
| 46,000 |
| Genworth Financial, Inc.—Class A |
|
| 55,660 |
|
| |||||||
| 23,520 |
| Metlife, Inc. |
|
| 434,179 |
|
| |||||||
| 12,700 |
| Prudential Financial, Inc. |
|
| 208,407 |
|
|
|
|
|
|
| ||
|
|
|
|
|
| 1,060,726 |
|
|
|
|
|
|
| ||
| |||||||
|
|
| Internet—2.2% |
|
|
|
|
| |||||||
| 14,930 |
| Amazon.com, Inc. (a) |
|
| 967,315 |
|
| |||||||
| 2,000 |
| Google, Inc.—Class A (a) |
|
| 675,980 |
|
|
|
|
|
|
| ||
|
|
|
|
|
| 1,643,295 |
|
|
|
|
|
|
| ||
| |||||||
|
|
| Machinery Construction & Mining—0.2% |
|
|
|
|
| |||||||
| 6,400 |
| Joy Global, Inc. |
|
| 111,744 |
|
|
|
|
|
|
| ||
| |||||||
|
|
| Machinery-Diversified—0.9% |
|
|
|
|
| |||||||
| 18,700 |
| AGCO Corp. (a) |
|
| 320,518 |
|
| |||||||
| 14,200 |
| Deere & Co. |
|
| 390,358 |
|
|
|
|
|
|
| ||
|
|
|
|
|
| 710,876 |
|
|
|
|
|
|
| ||
| |||||||
|
|
| Manufacturing—0.5% |
|
|
|
|
| |||||||
| 29,800 |
| General Electric Co. |
|
| 253,598 |
|
| |||||||
| 20,200 |
| Textron, Inc. |
|
| 114,130 |
|
|
|
|
|
|
| ||
|
|
|
|
|
| 367,728 |
|
|
|
|
|
|
| ||
| |||||||
|
|
| Media—0.4% |
|
|
|
|
| |||||||
| 29,919 |
| DISH Network Corp. (a) |
|
| 336,589 |
|
|
|
|
|
|
| ||
| |||||||
|
|
| Metals & Mining—0.4% |
|
|
|
|
| |||||||
| 9,750 |
| Freeport-McMoRan Copper & Gold, Inc. |
|
| 296,595 |
|
|
|
|
|
|
| ||
12 Nicholas-Applegate Global Equity & Convertible Income Fund Semi-Annual Report | 2.28.09 |
|
Nicholas-Applegate Global Equity & Convertible Income Fund Schedule of Investments |
|
|
|
|
|
|
|
|
Shares |
|
|
| Value |
| ||
| |||||||
|
|
| Oil & Gas—1.8% |
|
|
|
|
| |||||||
| 11,600 |
| National Oilwell Varco, Inc. (a) |
| $ | 310,068 |
|
| |||||||
| 5,500 |
| Occidental Petroleum Corp. |
|
| 285,285 |
|
| |||||||
| 11,800 |
| Schlumberger Ltd. |
|
| 449,108 |
|
| |||||||
| 18,800 |
| Valero Energy Corp. |
|
| 364,344 |
|
|
|
|
|
|
| ||
|
|
|
|
|
| 1,408,805 |
|
|
|
|
|
|
| ||
| |||||||
|
|
| Pharmaceuticals—5.3% |
|
|
|
|
| |||||||
| 16,000 |
| Abbott Laboratories |
|
| 757,440 |
|
| |||||||
| 22,800 |
| Gilead Sciences, Inc. (a) |
|
| 1,021,440 |
|
| |||||||
| 43,300 |
| Bristol-Myers Squibb Co. |
|
| 797,153 |
|
| |||||||
| 23,600 |
| Medco Health Solutions, Inc. (a) |
|
| 957,688 |
|
| |||||||
| 21,200 |
| Merck & Co., Inc. |
|
| 513,040 |
|
|
|
|
|
|
| ||
|
|
|
|
|
| 4,046,761 |
|
|
|
|
|
|
| ||
| |||||||
|
|
| Retail—1.7% |
|
|
|
|
| |||||||
| 15,000 |
| McDonalds Corp. |
|
| 783,750 |
|
| |||||||
| 19,500 |
| Target Corp. |
|
| 552,045 |
|
|
|
|
|
|
| ||
|
|
|
|
|
| 1,335,795 |
|
|
|
|
|
|
| ||
| |||||||
|
|
| Semi-Conductors & Semi-Conductor Equipment—1.4% |
|
|
|
|
| |||||||
| 48,000 |
| Intel Corp. |
|
| 611,520 |
|
| |||||||
| 33,900 |
| Texas Instruments, Inc. |
|
| 486,465 |
|
|
|
|
|
|
| ||
|
|
|
|
|
| 1,097,985 |
|
|
|
|
|
|
| ||
| |||||||
|
|
| Software—1.9% |
|
|
|
|
| |||||||
| 35,700 |
| Microsoft Corp. |
|
| 576,555 |
|
| |||||||
| 55,200 |
| Oracle Corp. (a) |
|
| 857,808 |
|
|
|
|
|
|
| ||
|
|
|
|
|
| 1,434,363 |
|
|
|
|
|
|
| ||
| |||||||
|
|
| Telecommunications—4.4% |
|
|
|
|
| |||||||
| 44,800 |
| Cisco Systems, Inc. (a) |
|
| 652,736 |
|
| |||||||
| 5,984 |
| EchoStar Corp. (a) |
|
| 98,018 |
|
| |||||||
| 21,200 |
| Harris Corp. |
|
| 790,336 |
|
| |||||||
| 34,200 |
| Juniper Networks, Inc. (a) |
|
| 485,982 |
|
| |||||||
| 17,000 |
| Qualcomm, Inc. |
|
| 568,310 |
|
| |||||||
| 28,200 |
| Verizon Communications, Inc. |
|
| 804,546 |
|
|
|
|
|
|
| ||
|
|
|
|
|
| 3,399,928 |
|
|
|
|
|
|
| ||
| |||||||
|
|
| Total Common Stock (cost—$121,829,739) |
|
| 50,883,485 |
|
|
|
|
|
|
| ||
| 2.28.09 | Nicholas-Applegate Global Equity & Convertible Income Fund Semi-Annual Report 13
|
Nicholas-Applegate Global Equity & Convertible Income Fund Schedule of Investments |
February 28, 2009 (unaudited) |
|
|
|
|
|
|
|
|
|
|
Principal |
|
|
| Credit Rating |
| Value |
| ||
CONVERTIBLE PREFERRED STOCK—17.2% |
|
|
|
|
|
| |||
|
|
|
|
|
|
|
|
|
|
|
|
| Agriculture—0.9% |
|
|
|
|
|
|
|
|
|
|
|
|
|
|
|
|
$ | 10 |
| Bunge Ltd., 4.875%, 12/31/49 |
| Ba1/BB |
| $ | 660,000 |
|
|
|
|
|
|
|
|
| ||
|
|
|
|
|
|
|
|
|
|
|
|
| Automotive—0.2% |
|
|
|
|
|
|
|
|
|
|
|
|
|
|
|
|
| 60 |
| General Motors Corp., 6.25%, 7/15/33, Ser. C |
| C/C |
|
| 148,200 |
|
|
|
|
|
|
|
|
| ||
|
|
|
|
|
|
|
|
|
|
|
|
| Banking—1.1% |
|
|
|
|
|
|
|
|
|
|
|
|
|
|
|
|
|
|
| Wachovia Corp., |
|
|
|
|
|
|
|
|
|
|
|
|
|
|
|
|
| 35 |
| 13.15%, 3/30/09, Ser. GE (General Electric Co.) (c) |
| Aa3/AA- |
|
| 280,879 |
|
|
|
|
|
|
|
|
|
|
|
| 27 |
| 14.10%, 4/1/09, Ser. JPM (JP Morgan Chase & Co.) (c) |
| Aa3/AA- |
|
| 578,053 |
|
|
|
|
|
|
|
|
| ||
|
|
|
|
|
|
|
| 858,932 |
|
|
|
|
|
|
|
|
| ||
|
|
|
|
|
|
|
|
|
|
|
|
| Commercial Services—0.5% |
|
|
|
|
|
|
|
|
|
|
|
|
|
|
|
|
| 29 |
| United Rentals, Inc., 6.50%, 8/1/28 |
| Caa1/B- |
|
| 382,438 |
|
|
|
|
|
|
|
|
| ||
|
|
|
|
|
|
|
|
|
|
|
|
| Diversified Financial Services—7.2% |
|
|
|
|
|
|
|
|
|
|
|
|
|
|
|
|
|
|
| Bank of America Corp., |
|
|
|
|
|
|
|
|
|
|
|
|
|
|
|
|
| 1 |
| 7.25%, 12/31/49 Ser. L |
| Baa1/BBB |
|
| 315,000 |
|
|
|
|
|
|
|
|
|
|
|
| 19 |
| 10.00%, Ser. JNJ (Johnson & Johnson) (c) |
| A1/AA |
|
| 943,217 |
|
|
|
|
|
|
|
|
|
|
|
| 10 |
| Citigroup, Inc., 6.50%, 12/31/49, Ser. T |
| Ca/C |
|
| 162,225 |
|
|
|
|
|
|
|
|
|
|
|
|
|
| Credit Suisse Group, |
|
|
|
|
|
|
|
|
|
|
|
|
|
|
|
|
| 48 |
| 11.00%, 3/16/09, Ser. MSFT (Microsoft Corp.) (c) |
| Aa1/AA- |
|
| 928,651 |
|
|
|
|
|
|
|
|
|
|
|
| 20 |
| 11.00%, 4/25/09, Ser. KO (Coca-Cola Corp.) (c) |
| Aa1/AA- |
|
| 899,968 |
|
|
|
|
|
|
|
|
|
|
|
|
|
| Eksportfinans AS, |
|
|
|
|
|
|
|
|
|
|
|
|
|
|
|
|
| 28 |
| 10.00%, 3/12/09, Ser. HPQ (Hewlett Packard Co.) (c) |
| Aaa/AA+ |
|
| 961,704 |
|
|
|
|
|
|
|
|
|
|
|
| 8 |
| 10.00%, 6/13/09, Ser. AAPL (Apple, Inc.) (c) |
| Aa1/AA+ |
|
| 1,046,042 |
|
|
|
|
|
|
|
|
|
|
|
|
|
| Lehman Brothers Holdings, Inc., |
|
|
|
|
|
|
|
|
|
|
|
|
|
|
|
|
| 42 |
| 6.00%, 10/12/10, Ser. GIS (General Mills, Inc.) (c) (f) (g) |
| NR/D |
|
| 135,833 |
|
|
|
|
|
|
|
|
|
|
|
| 9 |
| 28.00%, 3/6/09, Ser. RIG (Transocean, Inc.) (c) (f) (g) |
| NR/D |
|
| 126,771 |
|
|
|
|
|
|
|
|
| ||
|
|
|
|
|
|
|
| 5,519,411 |
|
|
|
|
|
|
|
|
| ||
|
|
|
|
|
|
|
|
|
|
|
|
| Electric—2.2% |
|
|
|
|
|
|
|
|
|
|
|
|
|
|
|
|
| 30 |
| AES Trust III, 6.75%, 10/15/29 |
| B3/B- |
|
| 960,000 |
|
|
|
|
|
|
|
|
|
|
|
| 4 |
| NRG Energy, Inc., 5.75%, 3/16/09 |
| B2/CCC+ |
|
| 726,038 |
|
|
|
|
|
|
|
|
| ||
|
|
|
|
|
|
|
| 1,686,038 |
|
|
|
|
|
|
|
|
| ||
|
|
|
|
|
|
|
|
|
|
|
|
| Hand/Machine Tools—0.9% |
|
|
|
|
|
|
|
|
|
|
|
|
|
|
|
|
| 1 |
| Stanley Works, 5.125%, 5/17/12, VRN |
| A2/A |
|
| 660,100 |
|
|
|
|
|
|
|
|
| ||
|
|
|
|
|
|
|
|
|
|
|
|
| Investment Companies—1.1% |
|
|
|
|
|
|
|
|
|
|
|
|
|
|
|
|
| 29 |
| Vale Capital Ltd., 5.50%, 6/15/10, Ser. RIO |
|
|
|
|
|
|
|
|
|
|
|
|
|
|
|
|
|
|
| (Companhia Vale do Rio Doce) (c) |
| NR/NR |
|
| 829,438 |
|
|
|
|
|
|
|
|
| ||
|
|
|
|
|
|
|
|
|
|
|
|
| Oil & Gas—0.4% |
|
|
|
|
|
|
|
|
|
|
|
|
|
|
|
|
| 7 |
| Chesapeake Energy Corp., 5.00%, 12/31/49 |
| NR/B |
|
| 345,050 |
|
|
|
|
|
|
|
|
| ||
|
|
|
|
|
|
|
|
|
|
|
|
| Pharmaceuticals—1.1% |
|
|
|
|
|
|
|
|
|
|
|
|
|
|
|
|
| 5 |
| Schering-Plough Corp., 6.00%, 8/13/10 |
| Baa3/BBB |
|
| 807,500 |
|
|
|
|
|
|
|
|
| ||
|
|
|
|
|
|
|
|
|
|
|
|
| Real Estate (REIT)—0.3% |
|
|
|
|
|
|
|
|
|
|
|
|
|
|
|
|
| 60 |
| FelCor Lodging Trust, Inc., 1.95%, 12/31/49, Ser. A |
| B3/CCC |
|
| 253,200 |
|
|
|
|
|
|
|
|
| ||
|
|
|
|
|
|
|
|
|
|
|
|
| Telecommunications—1.3% |
|
|
|
|
|
|
|
|
|
|
|
|
|
|
|
|
| 23 |
| Crown Castle International Corp., 6.25%, 8/15/12 |
| NR/NR |
|
| 1,006,688 |
|
|
|
|
|
|
|
|
| ||
|
|
| Total Convertible Preferred Stock (cost—$28,520,959) |
|
|
|
| 13,156,995 |
|
|
|
|
|
|
|
|
| ||
14 Nicholas-Applegate Global Equity & Convertible Income Fund Semi-Annual Report | 2.28.09 |
|
Nicholas-Applegate Global Equity & Convertible Income Fund Schedule of Investments |
February 28, 2009 (unaudited) |
|
|
|
|
|
|
|
|
|
|
Principal |
|
|
| Credit Rating |
| Value |
| ||
CONVERTIBLE BONDS & NOTES—11.9% |
| ||||||||
|
|
|
|
|
|
|
|
|
|
|
|
| Advertising—0.4% |
|
|
|
|
|
|
|
|
|
|
|
|
|
|
|
|
$ | 475 |
| Interpublic Group of Cos, Inc., 4.25%, 3/15/23 |
| Ba3/B+ |
| $ | 327,156 |
|
|
|
|
|
|
|
|
| ||
|
|
|
|
|
|
|
|
|
|
|
|
| Automotive—0.4% |
|
|
|
|
|
|
|
|
|
|
|
|
|
|
|
|
| 1,200 |
| Ford Motor Co., 4.25%, 12/15/36 |
| Ca/CCC- |
|
| 274,500 |
|
|
|
|
|
|
|
|
| ||
|
|
|
|
|
|
|
|
|
|
|
|
| Commercial Services—0.8% |
|
|
|
|
|
|
|
|
|
|
|
|
|
|
|
|
| 650 |
| Bowne & Co., Inc., 5.00%, 10/1/33 |
| B3/CCC+ |
|
| 612,625 |
|
|
|
|
|
|
|
|
| ||
|
|
|
|
|
|
|
|
|
|
|
|
| Computers—1.7% |
|
|
|
|
|
|
|
|
|
|
|
|
|
|
|
|
| 1,400 |
| Maxtor Corp., 6.80%, 4/30/10 |
| Ba2/NR |
|
| 1,314,250 |
|
|
|
|
|
|
|
|
| ||
|
|
|
|
|
|
|
|
|
|
|
|
| Electric—1.4% |
|
|
|
|
|
|
|
|
|
|
|
|
|
|
|
|
| 425 |
| PG&E Corp., 9.50%, 6/30/10 |
| NR/NR |
|
| 1,093,844 |
|
|
|
|
|
|
|
|
| ||
|
|
|
|
|
|
|
|
|
|
|
|
| Electrical Composition & Equipment—0.4% |
|
|
|
|
|
|
|
|
|
|
|
|
|
|
|
|
| 785 |
| JA Solar Holdings Co., Ltd., 4.50%, 5/15/13 |
| NR/NR |
|
| 325,775 |
|
|
|
|
|
|
|
|
| ||
|
|
|
|
|
|
|
|
|
|
|
|
| Entertainment—0.8% |
|
|
|
|
|
|
|
|
|
|
|
|
|
|
|
|
| 640 |
| Regal Entertainment Group, 6.25%, 3/15/11 (d) (e) |
| NR/NR |
|
| 584,000 |
|
|
|
|
|
|
|
|
| ||
|
|
|
|
|
|
|
|
|
|
|
|
| Oil & Gas—1.8% |
|
|
|
|
|
|
|
|
|
|
|
|
|
|
|
|
| 675 |
| Nabors Industries, Inc., 0.94%, 5/15/11 |
| NR/BBB+ |
|
| 584,719 |
|
|
|
|
|
|
|
|
|
|
|
| 1,010 |
| Transocean, Inc., 1.50%, 12/15/37 |
| Baa2/BBB+ |
|
| 814,313 |
|
|
|
|
|
|
|
|
| ||
|
|
|
|
|
|
|
| 1,399,032 |
|
|
|
|
|
|
|
|
| ||
|
|
|
|
|
|
|
|
|
|
|
|
| Pharmaceuticals—0.5% |
|
|
|
|
|
|
|
|
|
|
|
|
|
|
|
|
| 400 |
| Mylan, Inc., 1.25%, 3/15/12 |
| NR/B+ |
|
| 338,500 |
|
|
|
|
|
|
|
|
| ||
|
|
|
|
|
|
|
|
|
|
|
|
| Real Estate (REIT)—1.7% |
|
|
|
|
|
|
|
|
|
|
|
|
|
|
|
|
| 500 |
| Developers Diversified Realty Corp., 3.00%, 3/15/12 |
| NR/BBB- |
|
| 220,000 |
|
|
|
|
|
|
|
|
|
|
|
| 380 |
| Healthcare Care REIT, Inc., 4.75%, 12/1/26 |
| Baa2/BBB- |
|
| 335,825 |
|
|
|
|
|
|
|
|
|
|
|
| 960 |
| Vornado Realty Trust, 3.625%, 11/15/26 |
| Baa2/BBB |
|
| 769,200 |
|
|
|
|
|
|
|
|
| ||
|
|
|
|
|
|
|
| 1,325,025 |
|
|
|
|
|
|
|
|
| ||
|
|
|
|
|
|
|
|
|
|
|
|
| Telecommunications—2.0% |
|
|
|
|
|
|
|
|
|
|
|
|
|
|
|
|
| 900 |
| Nextel Communications, Inc., 5.25%, 1/15/10 |
| Ba2/BB |
|
| 850,500 |
|
|
|
|
|
|
|
|
|
|
|
| 800 |
| NII Holdings, Inc., 3.125%, 6/15/12 |
| NR/NR |
|
| 536,000 |
|
|
|
|
|
|
|
|
|
|
|
| 810 |
| Nortel Networks Corp., 2.125%, 4/15/14 |
| WR/D |
|
| 99,225 |
|
|
|
|
|
|
|
|
| ||
|
|
|
|
|
|
|
| 1,485,725 |
|
|
|
|
|
|
|
|
| ||
|
|
|
|
|
|
|
|
|
|
|
|
|
|
|
|
|
|
|
|
|
|
|
|
|
|
|
|
|
|
|
|
| Total Convertible Bonds & Notes (cost—$11,864,014) |
|
|
|
| 9,080,432 |
|
|
|
|
|
|
|
|
| ||
|
|
|
|
|
|
|
|
|
|
CORPORATE BONDS & NOTES—0.2% |
|
|
|
|
| ||||
|
|
|
|
|
|
|
|
|
|
|
|
| Financial Services—0.2% |
|
|
|
|
|
|
|
|
|
|
|
|
|
|
|
|
|
|
| GMAC LLC, |
|
|
|
|
|
|
|
|
|
|
|
|
|
|
|
|
| 260 |
| 7.50%, 12/31/13 (d) (e) |
| NR/CCC |
|
| 109,463 |
|
|
|
|
|
|
|
|
|
|
|
| 312 |
| 8.00%, 12/31/18 (d) (e) |
| NR/CC |
|
| 74,827 |
|
|
|
|
|
|
|
|
| ||
|
|
| Total Corporate Bonds & Notes (cost—$886,562) |
|
|
|
| 184,290 |
|
|
|
|
|
|
|
|
| ||
|
|
|
|
|
|
|
|
|
|
RIGHTS—0.0% |
|
|
|
|
|
| |||
|
|
|
|
|
|
|
|
|
|
Shares |
|
|
|
|
|
|
|
| |
|
|
|
|
|
|
|
| ||
| 595 |
| Cookson Group PLC, expires 3/4/09 (cost—$630,252) |
|
|
|
| 23,761 |
|
|
|
|
|
|
|
|
| ||
| 2.28.09 | Nicholas-Applegate Global Equity & Convertible Income Fund Semi-Annual Report 15
|
Nicholas-Applegate Global Equity & Convertible Income Fund Schedule of Investments |
February 28, 2009 (unaudited) |
|
|
|
|
|
|
|
|
Principal |
|
|
| Value |
| ||
SHORT-TERM INVESTMENT—3.5% |
|
|
| ||||
|
|
|
|
|
|
|
|
|
|
| Time Deposit—3.5% |
|
|
|
|
|
|
|
|
|
|
|
|
$ | 2,652 |
| Citibank—London, 0.08%, 3/2/09 |
|
|
|
|
|
|
|
|
|
|
|
|
|
|
| (cost—$2,651,886) |
| $ | 2,651,886 |
|
|
|
|
|
|
| ||
|
|
|
|
|
|
|
|
|
|
| Total Investments, before call options written |
|
|
|
|
|
|
|
|
|
|
|
|
|
|
| (cost—$166,383,412)—99.3% |
|
| 75,980,849 |
|
|
|
|
|
|
| ||
|
|
|
|
|
|
|
|
CALL OPTIONS WRITTEN (a)—(0.3)% |
|
|
| ||||
|
|
|
|
|
|
|
|
Contracts |
|
|
|
|
|
| |
| 256 |
| DAX Index, OTC, strike price €4,411.62, expires 3/20/09 |
|
| (4,356 | ) |
|
|
|
|
|
|
|
|
| 2,010 |
| Dow Jones € Stoxx 50 Price Index, OTC, strike price €2,214.34, expires 3/20/09 |
|
| (33,784 | ) |
|
|
|
|
|
|
|
|
| 728 |
| FTSE 100 Index, OTC, strike price GBP 4,194.79, expires 3/20/09 |
|
| (27,795 | ) |
|
|
|
|
|
|
|
|
| 46,875 |
| NIKKEI 225 Index, OTC, strike price ¥ 8,358, expires 3/13/09 |
|
| (12,373 | ) |
|
|
|
|
|
|
|
|
| 14,636 |
| OMX Stockholm 30 Index, OTC, strike price SEK 696.84, expires 3/20/09 |
|
| (12,383 | ) |
|
|
|
|
|
|
|
|
| 600 |
| S&P 200 Index, OTC, strike price AUD 3,625, expires 3/19/09 |
|
| (5,418 | ) |
|
|
|
|
|
|
|
|
| 30,985 |
| S&P 500 Index, OTC, strike price $835, expires 3/20/09 |
|
| (109,805 | ) |
|
|
|
|
|
|
|
|
| 6,400 |
| Seadrill, OTC, strike price NOK 70, expires 3/20/09 |
|
| (163 | ) |
|
|
|
|
|
|
|
|
| 190 |
| Swiss Market Index, OTC, strike price CHF 5,112.45, expires 3/20/09 |
|
| (3,333 | ) |
|
|
|
|
|
|
|
|
| 10,375 |
| WP PLC, OTC, strike price GBP 4.30, expires 3/20/09 |
|
| (308 | ) |
|
|
|
|
|
| ||
|
|
| Total Call Options Written (premiums received—$450,776) |
|
| (209,718 | ) |
|
|
|
|
|
| ||
| |||||||
|
|
| Total Investments, net of call options written |
|
|
|
|
|
|
|
|
|
|
|
|
|
|
| (cost—$165,932,636) (h)—99.0% |
|
| 75,771,131 |
|
|
|
|
|
|
| ||
|
|
|
|
|
|
|
|
|
|
| Other assets less other liabilities—1.0% |
|
| 737,952 |
|
|
|
|
|
|
| ||
|
|
|
|
|
|
|
|
|
|
| Net Assets—100.0% |
| $ | 76,509,083 |
|
|
|
|
|
|
| ||
16 Nicholas-Applegate Global Equity & Convertible Income Fund Semi-Annual Report | 2.28.09 |
|
Nicholas-Applegate Global Equity & Convertible Income Fund Schedule of Investments |
February 28, 2009 (unaudited) |
|
|
|
|
Notes to Schedule of Investments: | |
|
|
(a) | Non-income producing. |
|
|
(b) | All or partial amount segregated as collateral for call options written. |
|
|
(c) | Securities exchangeable or convertible into securities of an entity different than the issuer. Such entity is identified in the parenthetical. |
|
|
(d) | 144A Security - Security exempt from registration under Rule 144A of the Securities Act of 1933. These securities may be resold in transactions exempt from registration, typically only to qualified institutional buyers. Unless otherwise indicated, these securities are not considered to be illiquid. |
|
|
(e) | Private Placement. Restricted as to resale and may not have a readily available market. Securities with an aggregate value of $768,290, representing 1.0% of net assets. |
|
|
(f) | Fair-valued - Securities with an aggregate value of $262,867, representing 0.3% of net assets. |
|
|
(g) | Issuer in default. |
|
|
(h) | Securities with an aggregate value of $20,930,692, representing 27.4% of net assets, have been valued utilizing modeling tools provided by a third party vendor as described in Note 1(a) in the Notes to Financial Statements. |
|
|
¥ — Japanese Yen
AUD — Australian Dollar
CHF — Swiss Franc
GBP — Great British Pound
NOK — Norwegian Kroner
NR — Not Rated
REIT — Real Estate Investment Trust
SEK — Swedish Krona
Nicholas-Applegate Global Equity & Convertible Income Fund
See accompanying Notes to Financial Statements | 2.28.09 | Semi-Annual Report 17
|
Nicholas-Applegate Global Equity & Convertible Income Fund Statement of Assets and Liabilities |
February 28, 2009 (unaudited) |
|
|
|
|
|
Assets: |
|
|
|
|
| ||||
Investments, at value (cost—$166,383,412) |
|
| $75,980,849 |
|
|
| |||
| ||||
Foreign currency (cost—$658,382) |
|
| 643,893 |
|
|
| |||
| ||||
Dividends and interest receivable |
|
| 448,159 |
|
|
| |||
| ||||
Prepaid expenses |
|
| 2,141 |
|
|
| |||
| ||||
Total Assets |
|
| 77,075,042 |
|
|
| |||
| ||||
Liabilities: |
|
|
|
|
| ||||
Call options written, at value (premiums received—$450,776) |
|
| 209,718 |
|
|
| |||
| ||||
Payable for investments purchased |
|
| 188,314 |
|
|
| |||
| ||||
Investment management fees payable |
|
| 65,073 |
|
|
| |||
| ||||
Accrued expenses |
|
| 102,854 |
|
|
| |||
| ||||
Total Liabilities |
|
| 565,959 |
|
|
| |||
| ||||
Net Assets |
|
| $76,509,083 |
|
|
| |||
| ||||
Composition of Net Assets |
|
|
|
|
| ||||
Common Stock: |
|
|
|
|
| ||||
Par value ($0.00001 per share applicable to 7,004,189 shares issued and outstanding) |
|
| $70 |
|
|
| |||
| ||||
Paid-in-capital in excess of par |
|
| 166,874,942 |
|
|
| |||
| ||||
Dividends in excess of net investment income |
|
| (702,790 | ) |
|
| |||
| ||||
Accumulated net realized gain |
|
| 518,156 |
|
|
| |||
| ||||
Net unrealized depreciation of investments, call options written and foreign currency transactions |
|
| (90,181,295 | ) |
|
| |||
| ||||
Net Assets |
|
| $76,509,083 |
|
|
| |||
| ||||
Net Asset Value Per Share |
|
| $10.92 |
|
|
|
|
|
| Nicholas-Applegate Global Equity & Convertible Income Fund |
18 | Semi-Annual Report | 2.28.09 | See accompanying Notes to Financial Statements |
|
Nicholas-Applegate Global Equity & Convertible Income Fund Statement of Operations |
Six months ended February 28, 2009 (unaudited) |
|
|
|
|
|
Investment Income: |
|
|
|
|
| ||||
Dividends (net of foreign withholding taxes of $36,035) |
|
| $2,116,978 |
|
|
| |||
| ||||
Interest |
|
| 385,811 |
|
|
| |||
| ||||
Other income |
|
| 36,559 |
|
|
| |||
| ||||
Total Investment Income |
|
| 2,539,348 |
|
|
| |||
| ||||
Expenses: |
|
|
|
|
| ||||
Investment management fees |
|
| 454,570 |
|
|
| |||
| ||||
Shareholder communications |
|
| 58,835 |
|
|
| |||
| ||||
Custodian and accounting agent fees |
|
| 46,140 |
|
|
| |||
| ||||
Audit and tax services |
|
| 32,162 |
|
|
| |||
| ||||
Legal fees |
|
| 17,953 |
|
|
| |||
| ||||
Transfer agent fees |
|
| 14,044 |
|
|
| |||
| ||||
New York Stock Exchange listing fees |
|
| 10,847 |
|
|
| |||
| ||||
Trustees’ fees and expenses |
|
| 10,124 |
|
|
| |||
| ||||
Miscellaneous |
|
| 5,558 |
|
|
| |||
| ||||
Total expenses |
|
| 650,233 |
|
|
| |||
| ||||
Net Investment Income |
|
| 1,889,115 |
|
|
| |||
| ||||
Realized and Change in Unrealized Gain (Loss): |
|
|
|
|
| ||||
Net realized gain (loss) on: |
|
|
|
|
| ||||
Investments |
|
| (2,251,563 | ) |
|
| |||
| ||||
Call options written |
|
| 3,722,665 |
|
|
| |||
| ||||
Foreign currency transactions |
|
| (69,760 | ) |
|
| |||
| ||||
Net change in unrealized appreciation/depreciation of: |
|
|
|
|
| ||||
Investments |
|
| (52,021,219 | ) |
|
| |||
| ||||
Call options written |
|
| 223,881 |
|
|
| |||
| ||||
Foreign currency transactions |
|
| 13,046 |
|
|
| |||
| ||||
Net realized and change in unrealized loss on investments, call options written and foreign currency transactions |
|
| (50,382,950 | ) |
|
| |||
| ||||
Net Decrease in Net Assets Resulting from Investment Operations |
|
| $ (48,493,835 | ) |
|
|
|
|
Nicholas-Applegate Global Equity & Convertible Income Fund |
|
See accompanying Notes to Financial Statements | 2.28.09 | Semi-Annual Report | 19 |
|
Nicholas-Applegate Global Equity & Convertible Income Fund Statements of Changes in Net Assets |
|
|
|
|
|
|
|
|
|
|
|
|
|
| Six Months |
| For the period |
| ||||||
|
|
|
| ||||||||
|
|
|
|
|
|
|
| ||||
| |||||||||||
Net investment income |
|
|
| $1,889,115 |
|
|
|
| $4,578,682 |
|
|
|
|
| |||||||||
| |||||||||||
Net realized gain on investments, call options written and foreign currency transactions |
|
|
| 1,401,342 |
|
|
|
| 12,342,425 |
|
|
|
|
| |||||||||
| |||||||||||
Net change in unrealized appreciation/depreciation of investments, call options written and foreign currency transactions |
|
|
| (51,784,292 | ) |
|
|
| (38,397,003 | ) |
|
|
|
| |||||||||
| |||||||||||
Net decrease in net assets resulting from investment operations |
|
|
| (48,493,835 | ) |
|
|
| (21,475,896 | ) |
|
|
|
| |||||||||
| |||||||||||
Dividends and Distributions to Shareholders from: |
|
|
|
|
|
|
|
|
|
|
|
| |||||||||||
Net investment income |
|
|
| (3,110,774 | ) |
|
|
| (4,196,468 | ) |
|
|
|
| |||||||||
| |||||||||||
Net realized gains |
|
|
| (3,826,875 | ) |
|
|
| (9,262,081 | ) |
|
|
|
| |||||||||
| |||||||||||
Total dividends and distributions to shareholders |
|
|
| (6,937,649 | ) |
|
|
| (13,458,549 | ) |
|
|
|
| |||||||||
| |||||||||||
Capital Share Transactions: |
|
|
|
|
|
|
|
|
|
|
|
| |||||||||||
Net proceeds from the sale of common stock |
|
|
| — |
|
|
|
| 167,125,000 |
|
|
|
|
| |||||||||
| |||||||||||
Offering costs charged to paid-in capital in excess of par |
|
|
| — |
|
|
|
| (350,000 | ) |
|
|
|
| |||||||||
| |||||||||||
Net increase from capital share transactions |
|
|
| — |
|
|
|
| 166,775,000 |
|
|
|
|
| |||||||||
| |||||||||||
Total increase (decrease) in net assets |
|
|
| (55,431,484 | ) |
|
|
| 131,840,555 |
|
|
|
|
| |||||||||
| |||||||||||
Net Assets: |
|
|
|
|
|
|
|
|
|
|
|
| |||||||||||
Beginning of period |
|
|
| 131,940,567 |
|
|
|
| 100,012 |
|
|
|
|
| |||||||||
| |||||||||||
End of period (including undistributed (dividends in excess of) net investment income of $(702,790) and 518,869, respectively) |
|
|
| $76,509,083 |
|
|
|
| $131,940,567 |
|
|
|
|
| |||||||||
| |||||||||||
Shares issued |
|
|
| — |
|
|
|
| 7,000,000 |
|
|
|
|
| |||||||||
* Commencement of operations.
|
|
| Nicholas-Applegate Global Equity & Convertible Income Fund |
20 | Semi-Annual Report | 2.28.09 | See accompanying Notes to Financial Statements |
|
Nicholas-Applegate Global Equity & Convertible Income Fund Notes to Financial Statements |
February 28, 2009 (unaudited) |
1. Organization and Significant Accounting Policies
Nicholas-Applegate Global Equity & Convertible Income Fund, (the “Fund”), was organized as a Massachusetts business trust on May 3, 2007. Prior to commencing operations on September 28, 2007, the Fund had no operations other than matters relating to its organization and registration as a diversified, closed-end management investment company under the Investment Company Act of 1940 and the rules and regulations there under, as amended, and the sale and issuance of 4,189 shares of beneficial interest at an aggregate purchase price of $100,012 to Allianz Global Investors of America L.P. (“Allianz Global”). Allianz Global Investors Fund Management LLC (the “Investment Manager”) serves as the Fund’s investment manager and is an indirect wholly-owned subsidiary of Allianz Global. Allianz Global is an indirect, majority-owned subsidiary of Allianz SE, a publicly traded European insurance and financial services company. The Fund has an unlimited amount of $0.00001 par value per share of common stock authorized.
The Fund issued 7,000,000 shares of common stock in its initial public offering. These shares were all issued at $25.00 per share before an underwriting discount of $1.125 per share. Offering costs of $350,000 (representing $0.05 per share) were offset against the proceeds of the offering and have been charged to paid-in capital in excess of par.
The Fund’s investment objective is to seek total return comprised of capital appreciation, current income and gains. Under normal market conditions the Fund pursues its investment objective by investing in a diversified, global portfolio of equity securities and income-producing convertible securities. The Fund also employs a strategy of writing (selling) call options on stocks held as well as on equity indexes in an attempt to generate gains from option premiums.
The preparation of the financial statements in accordance with accounting principles generally accepted in the United States of America requires management to make estimates and assumptions that affect the reported amounts and disclosures in the financial statements. Actual results could differ from these estimates.
In the normal course of business, the Fund enters into contracts that contain a variety of representations which provide general indemnifications. The Fund’s maximum exposure under these arrangements is unknown as this would involve future claims that may be made against the Fund that have not yet been asserted. However, the Fund expects the risk of any loss to be remote.
The Financial Accounting Standards Board (“FASB”) issued Interpretation No. 48, “Accounting for Uncertainty in Income Taxes—an Interpretation of FASB Statement No. 109” (the “Interpretation”). The Interpretation establishes for all entities, including pass-through entities such as the Fund, a minimum threshold for financial statement recognition of the benefit of positions taken in filing tax returns (including whether an entity is taxable in a particular jurisdiction), and requires certain expanded tax disclosures. The Fund’s management has determined that its evaluation of the Interpretation has resulted in no material impact to the Fund’s financial statements at February 28, 2009. The Fund’s federal tax returns since inception (September 28, 2007) remains subject to examination by the Internal Revenue Service. The following is a summary of significant accounting policies consistently followed by the Fund:
Portfolio securities and other financial instruments for which market quotations are not readily available or if a development/event occurs that may significantly impact the value of a security, are fair-valued, in good faith, pursuant to guidelines established by the Board of Trustees or persons acting at their discretion pursuant to guidelines approved by the Board of Trustees. The Fund’s investments, including over-the-counter options, are valued daily using prices supplied by an independent pricing service or dealer quotations, or by using the last sale price on the exchange that is the primary market for such securities, or the mean between the last quoted bid and ask price for those securities for which the over-the-counter market is the primary market or for listed securities in which there were no sales. Independent pricing services use information provided by market makers or estimates of market values obtained from yield data relating to investments or securities with similar characteristics. Exchange traded options are valued at the settlement price determined by the relevant exchange. Synthetic convertible securities are valued based on quotations obtained from unaffiliated brokers who are the principal market-makers in such securities. Such valuations are derived by brokers from proprietary models which are generally based on readily available market information including valuations of the common stock underlying the synthetic security, and the volatility observed in the market on such common stocks. Short-term securities maturing in 60 days or less are valued at amortized cost, if their original term to maturity was 60 days less, or by amortizing their value on the 61st day prior to maturity, if the original term to maturity exceeded 60 days.
| 2.28.09 | Nicholas-Applegate Global Equity & Convertible Income Fund Semi-Annual Report 21
|
Nicholas-Applegate Global Equity & Convertible Income Fund Notes to Financial Statements |
February 28, 2009 (unaudited) |
1. Organization and Significant Accounting Policies (continued)
Investments initially valued in currencies other than U.S. dollar are converted to the U.S. dollar using exchange rates obtained from pricing services. As a result, the Net Asset Value (“NAV”) of the Fund’s shares may be affected by changes in the value of currencies in relation to the U.S. dollar. The value of securities traded in markets outside the United States or denominated in currencies other than the U.S. dollar may be affected significantly on a day that the New York Stock Exchange (“NYSE”) is closed and the NAV may change on days when an investor is not able to purchase or sell shares. The prices used by the Fund to value securities may differ from the value that would be realized if the securities were sold and these differences could be material to the financial statements of the Fund. The Fund’s NAV is normally determined daily as of the close of regular trading (normally, 4:00 p.m. Eastern time) on the NYSE on each day the NYSE is open for business.
The prices of certain portfolio securities or other financial instruments may be determined at a time prior to the close of regular trading on the NYSE. When fair valuing securities, the Fund may, among other things, consider significant events (which may be considered to include changes in the value of U.S. securities or securities indices) that occur after the close of the relevant market and before the time the Fund’s net asset value is calculated. With respect to certain foreign securities, the Fund may fair-value securities using modeling tools provided by a third-party vendor. The Fund has retained a statistical research service to assist in determining the fair value of foreign securities. This service utilizes statistics and programs based on historical performance of markets and other economic data to assist in making fair value estimates. Fair value estimates used by the Fund for foreign securities may differ from the value realized from the sale of those securities and the difference could be material to the financial statements. Fair value pricing may require subjective determinations about the value of a security or other asset, and fair values used to determine a Fund’s NAV may differ from quoted or published prices, or from prices that are used by others, for the same investments. In addition, the use of fair value pricing may not always result in adjustments to the prices of securities or other assets held by a Fund.
(b) Fair Value Measurements
Effective September 1, 2008, the Fund adopted FASB Statement of Financial Accounting Standards No. 157, Fair Value Measurements (“SFAS 157”). This standard clarifies the definition of fair value for financial reporting, establishes a framework for measuring fair value and requires additional disclosures about the use of the fair value measurements. Under this standard, fair value is defined as the price that would be received to sell an asset or paid to transfer a liability (i.e. “exit price”) in an orderly transaction between market participants. The three levels of the fair value hierarchy under SFAS 157 are described below:
|
|
• | Level 1—quoted prices in active markets for identical investments that the Fund has the ability to access. |
|
|
• | Level 2—valuations based on other significant observable inputs (including quoted prices for similar investments, interest rates, prepayment speeds, credit risk, etc.) or quotes from inactive exchanges. |
|
|
• | Level 3—valuations based on significant unobservable inputs (including the Fund’s own assumptions in determining the fair value of investments). |
The valuation techniques used by the Fund to measure fair value during the six-months ended February 28, 2009 maximized the use of observable inputs and minimized the use of unobservable inputs. The Fund utilized the following fair valuation techniques on Level 3 investments: multi-dimensional relational pricing models.
The inputs and methodology used for valuing securities are not necessarily an indication of the risk associated with investing in those securities.
The following is a summary of the inputs used at February 28, 2009 in valuing the Fund’s investments and other financial instruments carried at value:
|
|
|
|
|
|
|
|
Valuation Inputs |
| Investments in |
| Other Financial |
| ||
| |||||||
Level 1—Quoted Prices |
| $ | 37,363,095 |
| $ | — |
|
Level 2—Other Significant Observable Inputs |
|
| 38,354,887 |
|
| (209,718 | ) |
Level 3—Significant Unobservable Inputs |
|
| 262,867 |
|
| — |
|
|
|
|
| ||||
Total |
| $ | 75,980,849 |
| $ | (209,718 | ) |
|
|
|
| ||||
22 Nicholas-Applegate Global Equity & Convertible Income Fund Semi-Annual Report | 2.28.09 |
|
Nicholas-Applegate Global Equity & Convertible Income Fund Notes to Financial Statements |
February 28, 2009 (unaudited) |
1. Organization and Significant Accounting Policies (continued)
A roll forward of fair value measurements using significant unobservable inputs (Level 3) at February 28, 2009, were as follows:
|
|
|
|
|
|
| Investments |
| |
Beginning balance, August 31, 2008 |
| $ | — |
|
Net purchases (sales) and settlements |
|
| — |
|
Accrued discounts (premiums) |
|
| — |
|
Total realized gain (loss) |
|
| — |
|
Total change in unrealized gain (loss) |
|
| — |
|
Transfers in and/or out of Level 3 |
|
| 262,867 |
|
|
|
| ||
Ending balance, February 28, 2009 |
| $ | 262,867 |
|
|
|
| ||
In March 2008, Statement of Financial Accounting Standards No. 161, “Disclosures about Derivative Instruments and Hedging Activities” (“SFAS 161”) was issued and is effective for financial statements issued for fiscal years and interim periods beginning after November 15, 2008. SFAS 161 requires enhanced disclosures about a fund’s derivative and hedging activities. Management is currently evaluating the impact the adoption of SFAS 161 will have on the Fund’s financial statement disclosures.
|2.28.09 | Nicholas-Applegate Global Equity & Convertible Income Fund Semi-Annual Report 23
|
Nicholas-Applegate Global Equity & Convertible Income Fund Notes to Financial Statements |
February 28, 2009 (unaudited) |
1. Organization and Significant Accounting Policies (continued)
When an option is written, the premium received is recorded as an asset with an equal liability and is subsequently marked to market to reflect the current market value of the option. These liabilities are reflected as call options written in the Statement of Assets and Liabilities. Premiums received from writing options, which expire unexercised, are recorded on the expiration date as a realized gain. The difference between the premium received and the amount paid on effecting a closing purchase transaction, including brokerage commissions, is also treated as a realized gain, or if the premium is less than the amount paid for the closing purchase transactions, as a realized loss. If a call option is exercised, the premium is added to the proceeds from the sale of the underlying security or index option in determining whether there has been a realized gain or loss.
The Fund, as a writer of call options, may have no control over whether the underlying securities or index options may be sold (called). As a result, the Fund bears the market risk of an unfavorable change in the price of the security or index underlying the written call option.
The Fund may also purchase put options on equity and/or equity indexes. The risk associated with purchasing a put option is that the Fund pays a premium whether or not the option is exercised. Additionally, the Fund bears the risk of loss of premium and change in market value should the counterparty be unable or unwilling to perform under the contract. Purchased put options are accounted for in the same manner as portfolio securities. The proceeds from the securities sold through the exercise of put options is decreased by the premiums paid.
The use of derivative transactions may involve elements of both market and credit risk in excess of the amounts reflected on the Statement of Assets and Liabilities.
The Fund does not generally isolate that portion of the results of operations arising as a result of changes in the foreign currency exchange rates from the fluctuations arising from changes in the market prices of securities. Accordingly, such foreign currency gain (loss) is included in net realized gain (loss) on investments.
However, the Fund does isolate the effect of fluctuations in foreign currency exchange rates when determining the gain or loss upon the sale or maturity of foreign currency denominated debt obligations pursuant to U.S. federal income tax regulations; such amount is categorized as foreign currency gain or loss for both financial reporting and income tax reporting purposes.
During the six-months ended February 28, 2009, the Fund held synthetic convertible securities with Lehman Brothers Holdings, Inc. as the counterparty. On September 15, 2008, Lehman Brothers Holdings, Inc. filed for protection under Chapter 11 of the United States Bankruptcy Code. The value of the relevant securities have been written down to their estimated recoverable values.
24 Nicholas-Applegate Global Equity & Convertible Income Fund Semi-Annual Report | 2.28.09 |
|
|
Nicholas-Applegate Global Equity & Convertible Income Fund Notes to Financial Statements | |
February 28, 2009 (unaudited) |
|
|
|
2. Investment Manager/Sub-Adviser
The Fund has entered into an Investment Management Agreement (the “Agreement”) with the Investment Manager. Subject to the supervision of the Fund’s Board of Trustees, the Investment Manager is responsible for managing, either directly or through others selected by it, the Fund’s investment activities, business affairs and administrative matters. Pursuant to the Agreement, the Fund pays the Investment Manager an annual fee, payable monthly, at the annual rate of 1.00% of the Fund’s average daily total managed assets. Total managed assets refer to the total assets of the Fund (including assets attributable to borrowings) minus accrued liabilities (other than liabilities representing borrowings). The Investment Manager has retained its affiliate, Nicholas-Applegate Capital Management LLC (the “Sub-Adviser”), to manage the Fund’s investments. Subject to the supervision of the Investment Manager, the Sub-Adviser makes all of the Fund’s investment decisions. For its services, pursuant to a Sub-Advisory agreement, the Investment Manager and not the Fund, pays the Sub-Adviser a monthly fee.
3. Investment in Securities
For the six months ended February 28, 2009, purchases and sales of investments, other than short-term securities were $7,641,250 and $9,246,398, respectively.
Transactions in call options written for the six months ended February 28, 2009 were:
|
|
|
|
|
|
|
|
|
| Contracts |
| Premiums |
| ||
Options outstanding, August 31, 2008 |
|
| 89,753 |
| $ | 786,666 |
|
Options written |
|
| 532,017 |
|
| 3,416,232 |
|
Options terminated in closing purchase transactions |
|
| (124,863 | ) |
| (1,085,804 | ) |
Options expired |
|
| (383,852 | ) |
| (2,666,318 | ) |
|
|
|
| ||||
Options outstanding, February 28, 2009 |
|
| 113,055 |
| $ | 450,776 |
|
|
|
|
| ||||
4. Income Tax Information
The cost basis of portfolio securities of $166,383,412 is substantially the same for both federal income tax and financial reporting purposes. Aggregated gross unrealized appreciation for securities in which there is an excess value over tax cost is $1,819,495; aggregated gross unrealized depreciation for securities in which there is an excess tax cost over value is $92,222,058; net unrealized depreciation for federal income tax purposes is $90,402,563.
5. Subsequent Dividend Declarations
On March 13, 2009, a dividend of $0.35 per share was declared to shareholders payable March 27, 2009 to shareholders of record on March 23, 2009.
6. Legal Proceedings
In June and September 2004, the Investment Manager and certain of its affiliates (including PEA Capital LLC (“PEA”), Allianz Global Investors Distributors LLC and Allianz Global Investors of America, L.P.) agreed to settle, without admitting or denying the allegations, claims brought by the SEC and the New Jersey Attorney General alleging violations of federal and state securities laws with respect to certain open-end funds for which the Investment Manager serves as investment adviser. The settlements related to an alleged “market timing” arrangement in certain open-end funds formerly sub-advised by PEA. The Investment Manager and its affiliates agreed to pay a total of $68 million to settle the claims. In addition to monetary payments, the settling parties agreed to undertake certain corporate governance, compliance and disclosure reforms related to market timing and consented to cease and desist orders and censures. Subsequent to these events, PEA deregistered as an investment adviser and dissolved. None of the settlements alleged that any inappropriate activity took place with respect to the Fund.
Since February 2004, the Investment Manager and certain of its affiliates and their employees have been named as defendants in a number of pending lawsuits concerning “market timing” which allege the same or similar conduct underlying the regulatory settlements discussed above. The market timing lawsuits have been consolidated in a multi-district litigation proceeding in the U.S. District Court for the District of Maryland. Any potential resolution of these matters may include, but not be limited to, judgments or settlements for damages against the Investment Manager or its affiliates or related injunctions.
The Investment Manager and the Sub-Adviser believe that these matters are not likely to have a material adverse effect on the Fund or on their ability to perform their respective investment advisory activities relating to the Fund.
The foregoing speaks only as of the date hereof.
|
|
| 2.28.09 | Nicholas-Applegate Global Equity & Convertible Income Fund Semi-Annual Report | 25 |
|
|
Nicholas-Applegate Global Equity & Convertible Income Fund Financial Highlights | |
For a share outstanding throughout each period: |
|
|
|
|
|
|
|
|
|
|
|
|
|
|
|
|
| Six Months |
| For the period |
| ||||||
|
|
| |||||||||
Net asset value, beginning of period |
|
|
| $18.84 |
|
|
|
| $23.88 | ** |
|
|
| ||||||||||
|
|
|
|
|
|
|
|
|
|
|
|
Net investment income |
|
|
| 0.27 |
|
|
|
| 0.65 |
|
|
|
| ||||||||||
|
|
|
|
|
|
|
|
|
|
|
|
Net realized and change in unrealized loss on investments, call options written and foreign currency transactions |
|
|
| (7.20 | ) |
|
|
| (3.72 | ) |
|
|
| ||||||||||
|
|
|
|
|
|
|
|
|
|
|
|
Total from investment operations |
|
|
| (6.93 | ) |
|
|
| (3.07 | ) |
|
|
| ||||||||||
|
|
|
|
|
|
|
|
|
|
|
|
Dividends and Distributions to Shareholders from: |
|
|
|
|
|
|
|
|
|
|
|
|
|
|
|
|
|
|
|
|
|
|
|
Net investment income |
|
|
| (0.44 | ) |
|
|
| (0.60 | ) |
|
|
| ||||||||||
|
|
|
|
|
|
|
|
|
|
|
|
Net realized gains |
|
|
| (0.55 | ) |
|
|
| (1.32 | ) |
|
|
| ||||||||||
|
|
|
|
|
|
|
|
|
|
|
|
Total dividends and distributions to shareholders |
|
|
| (0.99 | ) |
|
|
| (1.92 | ) |
|
|
| ||||||||||
|
|
|
|
|
|
|
|
|
|
|
|
Capital Share Transactions: |
|
|
|
|
|
|
|
|
|
|
|
|
|
|
|
|
|
|
|
|
|
|
|
Offering costs charged to paid-in capital in excess of par |
|
|
| — |
|
|
|
| (0.05 | ) |
|
|
| ||||||||||
|
|
|
|
|
|
|
|
|
|
|
|
Net asset value, end of period |
|
|
| $10.92 |
|
|
|
| $18.84 |
|
|
|
| ||||||||||
|
|
|
|
|
|
|
|
|
|
|
|
Market price, end of period |
|
|
| $8.93 |
|
|
|
| $18.10 |
|
|
|
| ||||||||||
|
|
|
|
|
|
|
|
|
|
|
|
Total Investment Return (1) |
|
|
| (46.81 | )% |
|
|
| (20.67 | )% |
|
|
| ||||||||||
|
|
|
|
|
|
|
|
|
|
|
|
RATIOS/SUPPLEMENTAL DATA: |
|
|
|
|
|
|
|
|
|
|
|
|
|
|
|
|
|
|
|
|
|
|
|
Net assets, end of period (000) |
|
|
| $76,509 |
|
|
|
| $131,941 |
|
|
|
| ||||||||||
|
|
|
|
|
|
|
|
|
|
|
|
Ratio of expenses to average net assets |
|
|
| 1.44 | %(2) |
|
|
| 1.23 | %(2) |
|
|
| ||||||||||
|
|
|
|
|
|
|
|
|
|
|
|
Ratio of net investment income to average net assets |
|
|
| 4.18 | %(2) |
|
|
| 3.31 | %(2) |
|
|
| ||||||||||
|
|
|
|
|
|
|
|
|
|
|
|
Portfolio turnover |
|
|
| 8 | % |
|
|
| 105 | % |
|
|
| ||||||||||
|
|
* | Commencement of operations. |
** | Initial public offering price of $25.00 per share less underwriting discount of $1.125 per share. |
(1) | Total investment return is calculated assuming a purchase of a share of common stock at the current market price on the first day of each period and a sale of a share of common stock at the current market price on the last day of each period reported. Dividends and distributions are assumed, for purposes of this calculation, to be reinvested at prices obtained under the Fund’s dividend reinvestment plan. Total investment return does not reflect brokerage commissions or sales charges. Total investment return of a period of less than one year is not annualized. |
(2) | Annualized. |
|
|
| Nicholas-Applegate Global Equity & Convertible Income Fund |
26 | Semi-Annual Report | 2.28.09 | See accompanying Notes to Financial Statements |
|
|
|
Nicholas-Applegate Global Equity & Convertible Income Fund |
| |
|
| Meeting Results/ |
|
| Proxy Voting |
|
| Policies & |
|
| Procedures |
|
| (unaudited) |
Annual Shareholder Meeting Results
The Fund held its annual meeting of shareholders on December 16, 2008. Shareholders voted to re-elect Robert E. Connor, Hans W. Kertess and William B. Ogden, IV and to elect Diana L. Taylor as Trustees, as indicated below.
|
|
|
|
|
|
|
|
|
|
| Affirmative |
| Withheld |
| |||
Re-election of Robert E. Connor—Class I to serve until 2011 |
|
| 6,143,813 |
|
| 162,102 |
| |
Re-election of Hans W. Kertess—Class I to serve until 2011 |
|
| 6,145,813 |
|
| 160,102 |
| |
Re-election of William B. Ogden, IV—Class I to serve until 2011 |
|
| 6,147,963 |
|
| 157,952 |
| |
Election of Diana L. Taylor—Class II to serve until 2009 |
|
| 6,149,163 |
|
| 156,752 |
| |
|
|
|
|
|
|
|
| |
|
|
|
|
|
|
|
| |
|
Proxy Voting Policies & Procedures |
| 2.28.09 | Nicholas-Applegate Global Equity & Convertible Income Fund Semi-Annual Report 27
(This Page Intentionally Left Blank)
Trustees and Fund Officers
|
|
|
Hans W. Kertess |
| Brian S. Shlissel |
Trustee, Chairman of the Board of Trustees |
| President & Chief Executive Officer |
Paul Belica |
| Lawrence G. Altadonna |
Trustee |
| Treasurer, Principal Financial & Accounting Officer |
Robert E. Connor |
| Thomas J. Fuccillo |
Trustee |
| Vice President, Secretary & Chief Legal Officer |
John C. Maney |
| Scott Whisten |
Trustee |
| Assistant Treasurer |
William B. Ogden, IV |
| Richard J. Cochran |
Trustee |
| Assistant Treasurer |
R. Peter Sullivan III |
| Youse E. Guia |
Trustee |
| Chief Compliance Officer |
Diana L. Taylor |
| Kathleen A. Chapman |
Trustee |
| Assistant Secretary |
|
| Lagan Srivastava |
|
| Assistant Secretary |
Investment Manager
Allianz Global Investors Fund Management LLC
1345 Avenue of the Americas
New York, NY 10105
Sub-Adviser
Nicholas-Applegate Capital Management LLC
600 West Broadway, 30th Floor
San Diego, California 92101
Custodian & Accounting Agent
Brown Brothers Harriman & Co.
40 Water Street
Boston, MA 02109
Transfer Agent, Dividend Paying Agent and Registrar
PNC Global Investment Servicing
P.O. Box 43027
Providence, RI 02940-3027
Independent Registered Public Accounting Firm
PricewaterhouseCoopers LLP
300 Madison Avenue
New York, NY 10017
Legal Counsel
Ropes & Gray LLP
One International Place
Boston, MA 02210-2624
This report, including the financial information herein, is transmitted to the shareholders of Nicholas-Applegate Global Equity & Convertible Income Fund for their information. It is not a prospectus, circular or representation intended for use in the purchase of shares of the Fund or any securities mentioned in this report.
The financial information included herein is taken from the records of the Fund without examination by an independent registered accounting firm, who did not express an opinion hereon.
Notice is hereby given in accordance with Section 23(c) of the Investment Company Act of 1940, as amended, that from time to time the Fund may purchase shares of their common stock in the open market.
The Fund files its complete schedule of portfolio holdings with the Securities and Exchange Commission (“SEC”) for the first and third quarters of its fiscal year on Form N-Q. The Fund’s Form N-Q is available on the SEC’s website at www.sec.gov and may be reviewed and copied at the SEC’s Public Reference Room in Washington D.C. Information on the operation of the Public Reference Room may be obtained by calling (800) SEC-0330. The information on Form N-Q is also available on the Fund’s website at www.allianzinvestors.com/closedendfunds.
On January 9, 2009, the Fund submitted a CEO annual certification to the New York Stock Exchange (“NYSE”) on which the Fund’s principal executive officer certified that he was not aware, as of the date, of any violation by the Fund of the NYSE’s Corporate Governance listing standards. In addition, as required by Section 302 of the Sarbanes-Oxley Act of 2002 and related SEC rules, the Fund’s principal executive and principal financial officer made quarterly certifications, included in filings with the SEC on Forms N-CSR and N-Q relating to, among other things, the Fund’s disclosure controls and procedures and internal control over financial reporting, as applicable.
Information on the Fund is available at www.allianzinvestors.com/closedendfunds or by calling the Fund’s shareholder servicing agent at (800) 331-1710.

| ITEM 2. | CODE OF ETHICS |
| Not required in this filing. | |
| ITEM 3. | AUDIT COMMITTEE FINANCIAL EXPERT |
| Not required in this filing. | |
| ITEM 4. | PRINCIPAL ACCOUNTANT FEES AND SERVICES |
| Not required in this filing | |
| ITEM 5. | AUDIT COMMITTEE OF LISTED REGISTRANT |
| Not required in this filing | |
| ITEM 6. | SCHEDULE OF INVESTMENTS |
| Schedule of Investments is included as part of the Report to Shareholders filed under Item 1 of this form. | |
| ITEM 7. | DISCLOSURE OF PROXY VOTING POLICIES AND PROCEDURES FOR CLOSED-END MANAGEMENT INVESTMENT COMPANIES |
| Not required in this filing | |
| ITEM 8. | PORTFOLIO MANAGERS OF CLOSED-END MANAGEMENT INVESTMENT COMPANIES |
| Not required in this filing | |
| ITEM 9. | PURCHASES OF EQUITY SECURITIES BY CLOSED-END MANAGEMENT INVESTMENT COMPANY AND AFFILIATED COMPANIES |
| None |
| ITEM 10. | SUBMISSION OF MATTERS TO A VOTE OF SECURITY HOLDERS |
| There have been no material changes to the procedures by which shareholders may recommend nominees to the Fund’s Board of Trustees since the Fund last provided disclosure in response to this item. | |
| ITEM 11. | CONTROLS AND PROCEDURES |
| (a) The registrant’s President and Chief Executive Officer and Treasurer, Principal Financial & Accounting Officer have concluded that the registrant’s disclosure controls and procedures (as defined in Rule 30a-2(c) under the Act (17 CFR 270.30a -3(c))), as amended are effective based on their evaluation of these controls and procedures as of a date within 90 days of the filing date of this document. | |
| (b) There were no significant changes in the registrant’s internal controls (over financial reporting as defined in Rule 30a-3(d) under the Act (17 CFR 270.30a -3(d))) that occurred during the second fiscal quarter of the period covered by this report that has materially affected, or is reasonably likely to materially affect, the registrants control over financial reporting. | |
| ITEM 12. | EXHIBITS |
| (a) Exhibit 99.302 Cert. - Certification pursuant to Section 302 of the Sarbanes-Oxley Act of 2002 | |
| (b) Exhibit 99.906 Cert. - Certification pursuant to Section 906 of the Sarbanes-Oxley Act of 2002 |
Signature
Pursuant to the requirements of the Securities Exchange Act of 1934 and the Investment Company Act of 1940, the registrant has duly caused this report to be signed on its behalf by the undersigned, thereunto duly authorized.
(Registrant) Nicholas-Applegate Global Equity & Convertible Income Fund
By /s/ Brian S. Shlissel
President & Chief Executive Officer
Date May 4, 2009
By /s/ Lawrence G. Altadonna
Treasurer, Principal Financial & Accounting Officer
Date May 4, 2009
Pursuant to the requirements of the Securities Exchange Act of 1934 and the Investment Company Act of 1940, this report has been signed below by the following persons on behalf of the registrant and in the capacities and on the dates indicated.
By /s/ Brian S. Shlissel
President & Chief Executive Officer
Date May 4, 2009
By /s/ Lawrence G. Altadonna
Treasurer, Principal Financial & Accounting Officer
Date May 4, 2009