UNITED STATES
SECURITIES AND EXCHANGE COMMISSION
Washington, D.C. 20549
FORM N-CSR
CERTIFIED SHAREHOLDER REPORT OF REGISTERED
MANAGEMENT INVESTMENT COMPANIES
Investment Company Act file number | 811-22067 | |||||||
| ||||||||
AllianzGI Global Equity & Convertible Income Fund | ||||||||
(Exact name of registrant as specified in charter) | ||||||||
| ||||||||
1633 Broadway, New York, NY |
| 10019 | ||||||
(Address of principal executive offices) |
| (Zip code) | ||||||
| ||||||||
Lawrence G. Altadonna – 1633 Broadway, New York, New York 10019 | ||||||||
(Name and address of agent for service) | ||||||||
| ||||||||
Registrant’s telephone number, including area code: | 212-739-3371 |
| ||||||
| ||||||||
Date of fiscal year end: | August 31, 2013 |
| ||||||
| ||||||||
Date of reporting period: | February 28, 2013 |
| ||||||
ITEM 1. REPORT TO SHAREHOLDERS
February 28, 2013
AllianzGI Global Equity & Convertible Income Fund
(formerly AGIC Global Equity & Convertible Income Fund)

Contents |
|
|
|
Letter to Shareholders | 2–3 |
|
|
Fund Insights | 4–6 |
|
|
Performance & Statistics | 7 |
|
|
Schedule of Investments | 8–24 |
|
|
Statement of Assets and Liabilities | 25 |
|
|
Statement of Operations | 26 |
|
|
Statement of Changes in Net Assets | 27 |
|
|
Notes to Financial Statements | 28–33 |
|
|
Financial Highlights | 34 |
|
|
Annual Shareholder Meeting Results/Proxy Voting Policies & Procedures | 35 |
2.28.13 | AllianzGI Global Equity & Convertible Income Fund Semi-Annual Report 1
Dear Shareholder:
Global stock markets neared multi-year highs during the six-month fiscal reporting period ended February 28, 2013. The period was marked by efforts in Europe to stabilize the euro zone which helped to restore confidence. Although, the European Union’s (“E.U.”) economic contraction, which began in the third quarter of 2011, continued, China showed signs of a rebound and in the US, strengthening indicators on housing, auto sales and private-sector job creation provided encouragement.
Six-Months in Review through February 28, 2013 For the six-month fiscal reporting period ended February 28, 2013, AllianzGI Global Equity & Convertible Income Fund (the “Fund”) returned 9.42% on net asset value (“NAV”) and 10.37% on market price.
The MSCI All Country World Index, an unmanaged global index generally reflective of developed equity markets, rose 10.99% in U.S. dollar terms. The BofA Merrill Lynch All Convertibles Index, an unmanaged index generally representative of the convertible securities market, rose 9.33%. The Standard & Poor’s 500 Index (“S&P”), an unmanaged index that is generally representative of the US stock market, advanced 8.95% and the Barclays US Credit Index, the credit component of the US Government/Credit Index, returned 1.46% during the six-month fiscal period.
In the United States, representing approximately 68.6% of Fund assets on February 28, 2013, the economy grew, albeit unevenly. At the start of the fiscal six-month period, gross domestic product (“GDP”), the value of goods and services produced in the country, the broadest measure of US economic activity and the principal indicator of economic performance, was growing at an annualized rate of 3.1%. GDP declined during the fourth quarter of 2012 to a negative 0.1% pace, which the government indicated was due to the sharp reduction in defense spending. |
|
Hans W. Kertess Chairman
Brian S. Shlissel President & CEO |


There were many encouraging signs in the private sector. US unemployment fell slightly during the reporting period to 7.7% from 7.8%, with the strongest job creation during February 2013. The S&P/Case-Shiller Home Price Index, a leading measure of the US residential housing market, indicated that home prices rose 7.3% on a
2 AllianzGI Global Equity & Convertible Income Fund Semi-Annual Report | 2.28.13
national basis during the twelve-months ended December 31, 2012. Autodata, which tracks the motor vehicle industry, reported sales of cars and trucks grew 13% on a year-on-year basis in 2012, the strongest year since 2007.
As the economy strengthened during the fiscal six-month period, investors shifted assets out of US Treasuries and into stocks. The yield on the benchmark 10-year bond rose from 1.51% to 1.89% during the six-month period.
Positioned to Face Today’s Challenges |
|
|
If reductions in defense spending were the principal cause of slower economic growth between October and December 2012, then the further reductions, which began subsequent to the end of the fiscal year, may hamper growth over the near term. Despite this concern, we see positive signs for the US economy in 2013. The economy is expected to grow 2.50% to 2.75%, driven in large part by the strengthening housing market. Home prices are anticipated to appreciate 10% on a national basis and the improving labor market is expected to drive wage gains beyond the drag created by the December 31, 2012 expiration of the 2% payroll tax holiday. |
| Receive this report |
|
| |
|
|
For specific information on the Fund and its performance, please refer to the following pages. If you have any questions regarding the information provided, we encourage you to contact your financial advisor or call the Fund’s shareholder servicing agent at (800) 254-5197. In addition, a wide range of information and resources is available on our website, us.allianzgi.com/closedendfunds.
Together with Allianz Global Investors Fund Management LLC, the Fund’s investment manager, and Allianz Global Investors U.S. LLC, the Fund’s sub-adviser, we thank you for investing with us.
We remain dedicated to serving your investment needs.
Sincerely,
|
|
Hans W. Kertess | Brian S. Shlissel |
Chairman of the Board of Trustees | President & Chief Executive Officer |


2.28.13 | AllianzGI Global Equity & Convertible Income Fund Semi-Annual Report 3
AllianzGI Global Equity & Convertible Income Fund Fund Insights
February 28, 2013 (unaudited)
For the period of September 1, 2012 through February 28, 2013, as provided by Doug Forsyth, Portfolio Manager.
For the six-months ended February 28, 2013, AllianzGI Global Equity & Convertible Income Fund (the “Fund”) returned 9.42% on net asset value (“NAV”) and 10.37% on market price.
Market Environment
The equity and convertible markets moved higher over the period due to stable corporate profits, global stimulus efforts and improving credit fundamentals.
Initially, macro factors that had led investor demand higher and enhanced returns preceeding the reporting period carried into September 2012. Central bank commitments to stabilize economies in the US and Asia and diminish tail risks in Europe continued to bolster markets.
In the months that ensued, equity volatility increased and coincided with a negative shift in investor sentiment. Mixed third-quarter corporate earnings in conjunction with US budget debate concerns and instability in Europe initiated a stock market selloff.
However, stocks rebounded sharply, as the advancement remained intact through February 2013. A fiscal cliff compromise aided the advance, however, a host of other catalysts supported the market’s rise. Healthy fourth-quarter earnings, improving US economic data points and ongoing accommodative central bank policies were among the most impactful factors.
During the reporting period, non-US developed market equities moved higher thanks to improving euro-zone sentiment and accelerating market fundamentals. In particular, investors focused on central bank stimulus packages and the potential for economies to grow their way out of turmoil, with concerns over Spain, Greece, Italy, and Portugal gradually dissipating. Similar to US equities, global market strength continued through the end of calendar year 2012 and into 2013. Japan announced plans to weaken its
4 AllianzGI Global Equity & Convertible Income Fund Semi-Annual Report | 2.28.13
AllianzGI Global Equity & Convertible Income Fund Fund Insights
February 28, 2013 (unaudited) (continued)
currency in an effort to become more competitive, this initiative was viewed favorably by market participants.
The convertible market benefited from stock market strength. Furthermore, convertible bonds benefited from credit-spread tightening. Improving balance-sheet strength experienced throughout the period was the primary driver of credit improvement.
Sector level performance was mostly positive. In general, Industrials, Health Care, Energy, Financials and Consumer Discretionary were among the strongest-performing sectors. In contrast, the Information Technology sector and select Materials issuers underperformed the overall market.
Benchmark country results were led by Greece, Finland and Switzerland, where Israel, Norway and Italy lagged. Sector results were mixed, with Financial and Consumer Discretionary stocks outperforming, and Energy and Telecommunication Services stocks posting negative returns for the reporting period.
Levels of implied volatility, as measured by the Chicago Board Options Exchange Volatility Index (the “VIX” or the “Index”), were muted in comparison to more recent reporting periods. The VIX ended August 2012 at 17.47 and declined into September before trending higher during the ensuing months. The Index rose sharply into June corresponding with European macro fears and weak US economic statistics. After peaking just below 28 in June, volatility flattened out before spiking in the final days of December due to the impending US fiscal cliff. With a budget compromise, the VIX immediately fell below 15 where it would remain before reaching an intraday high of 19.28 in late February 2013 on hawkish comments from the Federal Reserve. Implied volatility of the Euro Stoxx 50, Europe’s blue chip index, followed a similar trend.
Portfolio Specifics
The Fund rallied with the market during the reporting period. Strength was evident in a variety of holdings and industries. Exposure to convertible
2.28.13 | AllianzGI Global Equity & Convertible Income Fund Semi-Annual Report 5
AllianzGI Global Equity & Convertible Income Fund Fund Insights
February 28, 2013 (unaudited) (continued)
bonds helped cushion the Fund from downside volatility during equity market declines and provided upside participation when equities rallied.
In the US equity sleeve, sector allocations that helped relative performance versus the Russell 1000 Growth Index in the reporting period were Information Technology, Healthcare and Financials. Stock selection and asset allocation effects across all three sectors were positive for returns. In contrast, security selection within the Energy, Utilities and Materials sectors hindered relative returns.
In the International equity sleeve, stock selections lagged the MSCI EAFE Index in the reporting period. Specifically, stock selection in the United Kingdom and France offset results given our more conservative investments in each country, while Germany and Australia added to performance as a result of bottom-up selections in airlines and automobiles. From a sector perspective, a relative underweighting to Financials, specifically commercial banks, hurt performance as this sector was the best index performer for the period. Stock selection in Telecommunications Services lowered results, as did a modest overweighting to the Energy sector. Conversely, Health Care outperformed thanks to bottom-up stock picking in biotechnology, while an underweighting to Utilities proved advantageous given relative weakness in the sector.
In the convertibles sleeve, sector allocations that helped relative performance versus the convertibles universe were Technology, Financials and Transportation. The Fund benefitted from an underweighting in Technology, an overweighting in Transportation and higher issuer-specific performance in Financials. Conversely, sectors that hampered relative performance were Energy, Health Care and Telecommunications. All of the aforementioned sectors exhibited lower issuer-specific performance versus the respective universes.
The Fund benefitted from opportunistically over-writing on individual equity positions. Single stock implied volatilities for the front month continued to be low. Despite the challenging equity market, acceptable single stock premiums were recognized. As select equity holdings moved higher, the covered calls were actively managed to higher strike prices.
6 AllianzGI Global Equity & Convertible Income Fund Semi-Annual Report | 2.28.13
AllianzGI Global Equity & Convertible Income Fund
Performance & Statistics
February 28, 2013 (unaudited)
Total Return(1): |
| Market Price | NAV |
Six Month |
| 10.37% | 9.42% |
1 Year |
| 5.28% | 5.74% |
5 Year |
| 2.65% | 3.20% |
Commencement of Operations (9/28/07) to 2/28/13 |
| -1.13% | 1.08% |
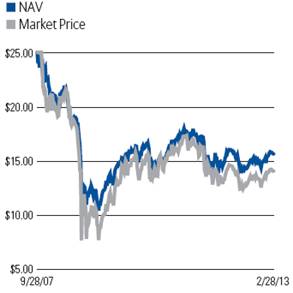
Market Price/NAV Performance: | Market Price/NAV: |
|
|
Commencement of Operations (9/28/07) to 2/28/13 | Market Price |
| $14.06 |
| NAV |
| $15.63 |
Discount to NAV |
| (10.04)% | |
Market Price Yield(2) |
| 3.65% | |
Investment Allocation (as a % of common/preferred stock)
| |||
(1) Past performance is no guarantee of future results. Total return is calculated by determining the percentage change in NAV or market price (as applicable) in the specified period. The calculation assumes that all income dividends, capital gain and return of capital distributions, if any, have been reinvested. Total return does not reflect broker commissions or sales charges in connection with the purchase or sale of Fund shares. Total return for a period of less than one year is not annualized. Total return for a period of more than one year represents the average annual total return.
Performance at market price will differ from results at NAV. Although market price returns typically reflect investment results over time, during shorter periods returns at market price can also be influences by factors such as changing views about the Fund, market conditions, supply and demand for the Fund’s shares, or changes in the Fund’s dividends and distributions.
An investment in the Fund involves risk, including the loss of principal. Total return, market price, market price yield and NAV will fluctuate with changes in market conditions. This data is provided for information purposes only and is not for trading purposes. Closed-end funds, unlike open-end funds, are traded in the open market through a stock exchange. NAV is equal to total assets less liabilities divided by the number of shares outstanding. Holdings are subject to change daily.
(2) Market Price Yield is determined by dividing the portion of the annualized current quarterly dividend per share that is comprised of net investment income and net short-term capital gains, if any, by the market price per share at February 28, 2013.
2.28.13 | AllianzGI Global Equity & Convertible Income Fund Semi-Annual Report 7
AllianzGI Global Equity & Convertible Income Fund Schedule of Investments
February 28, 2013 (unaudited)
Shares |
|
|
|
| Value |
|
COMMON STOCK – 80.6% |
|
|
| |||
|
|
|
| |||
Australia – 2.5% |
|
|
| |||
Airlines – 0.2% |
|
|
| |||
152,554 |
| Qantas Airways Ltd. (a) |
| $255,233 |
| |
Biotechnology – 1.0% |
|
|
| |||
17,462 |
| CSL Ltd. (b) |
| 1,070,092 |
| |
Construction & Engineering – 0.3% |
|
|
| |||
14,173 |
| Leighton Holdings Ltd. |
| 339,849 |
| |
Diversified Financial Services – 0.5% |
|
|
| |||
139,994 |
| Challenger Ltd. |
| 514,124 |
| |
Metals & Mining – 0.5% |
|
|
| |||
58,602 |
| Arrium Ltd. |
| 71,347 |
| |
13,924 |
| BHP Billiton Ltd. |
| 521,289 |
| |
|
|
|
| 592,636 |
| |
Austria – 0.1% |
|
|
| |||
Building Products – 0.0% |
|
|
| |||
3,027 |
| Wienerberger AG |
| 32,721 |
| |
Metals & Mining – 0.1% |
|
|
| |||
2,316 |
| Voestalpine AG |
| 77,926 |
| |
Belgium – 0.1% |
|
|
| |||
Chemicals – 0.1% |
|
|
| |||
5,374 |
| Tessenderlo Chemie NV |
| 157,414 |
| |
Bermuda – 0.3% |
|
|
| |||
Insurance – 0.3% |
|
|
| |||
20,240 |
| Assured Guaranty Ltd. |
| 377,881 |
| |
Brazil – 0.6% |
|
|
| |||
Metals & Mining – 0.6% |
|
|
| |||
32,439 |
| Vale S.A., Class B, ADR |
| 616,017 |
| |
Canada – 0.1% |
|
|
| |||
Communications Equipment – 0.1% |
|
|
| |||
9,100 |
| Research In Motion Ltd. (a) |
| 121,485 |
| |
China – 0.3% |
|
|
| |||
Electronic Equipment, Instruments – 0.1% |
|
|
| |||
30,500 |
| Kingboard Chemical Holdings Ltd. |
| 92,678 |
| |
Independent Power Producers – 0.1% |
|
|
| |||
38,000 |
| China Resources Power Holdings Co., Ltd. |
| 103,525 |
| |
Paper & Forest Products – 0.1% |
|
|
| |||
112,000 |
| Lee & Man Paper Manufacturing Ltd. |
| 83,802 |
| |
Denmark – 0.1% |
|
|
| |||
Construction & Engineering – 0.1% |
|
|
| |||
2,000 |
| FLSmidth & Co. AS |
| 136,395 |
| |
Finland – 0.2% |
|
|
| |||
Communications Equipment – 0.0% |
|
|
| |||
7,353 |
| Nokia Oyj |
| 26,720 |
| |
|
|
|
|
|
| |
|
|
|
|
|
| |
8 AllianzGI Global Equity & Convertible Income Fund Semi-Annual Report | 2.28.13
AllianzGI Global Equity & Convertible Income Fund Schedule of Investments
February 28, 2013 (unaudited) (continued)
Shares |
|
|
|
| Value |
|
Food & Staples Retailing – 0.2% |
|
|
| |||
4,984 |
| Kesko Oyj, Class B |
| $155,388 |
| |
France – 1.8% |
|
|
| |||
Airlines – 0.0% |
|
|
| |||
4,355 |
| Air France – KLM (a) |
| 46,139 |
| |
Automobiles – 0.2% |
|
|
| |||
9,874 |
| Peugeot S.A. (a) |
| 74,352 |
| |
1,838 |
| Renault S.A. |
| 116,099 |
| |
|
|
|
| 190,451 |
| |
Commercial Banks – 0.4% |
|
|
| |||
4,922 |
| BNP Paribas S.A. |
| 275,308 |
| |
12,598 |
| Credit Agricole S.A. (a) |
| 117,539 |
| |
|
|
|
| 392,847 |
| |
Diversified Telecommunication – 0.4% |
|
|
| |||
47,233 |
| France Telecom S.A. (b) |
| 455,560 |
| |
Electrical Equipment – 0.2% |
|
|
| |||
4,912 |
| Alstom S.A. |
| 215,895 |
| |
Household Durables – 0.1% |
|
|
| |||
2,043 |
| SEB S.A. |
| 151,713 |
| |
Metals & Mining – 0.1% |
|
|
| |||
154 |
| APERAM |
| 2,032 |
| |
3,088 |
| ArcelorMittal |
| 46,233 |
| |
|
|
|
| 48,265 |
| |
Oil, Gas & Consumable Fuels – 0.4% |
|
|
| |||
8,490 |
| Total S.A. |
| 423,870 |
| |
Germany – 2.1% |
|
|
| |||
Airlines – 0.4% |
|
|
| |||
23,665 |
| Deutsche Lufthansa AG |
| 476,449 |
| |
Automobiles – 0.9% |
|
|
| |||
17,212 |
| Daimler AG (b) |
| 1,022,412 |
| |
Chemicals – 0.3% |
|
|
| |||
7,688 |
| K+S AG |
| 360,481 |
| |
Industrial Conglomerates – 0.2% |
|
|
| |||
1,496 |
| Siemens AG |
| 155,271 |
| |
Metals & Mining – 0.1% |
|
|
| |||
1,548 |
| Salzgitter AG |
| 73,569 |
| |
Multi-Utilities – 0.0% |
|
|
| |||
568 |
| RWE AG |
| 20,821 |
| |
Semiconductors & Semiconductor Equipment – 0.2% |
|
|
| |||
2,911 |
| Aixtron AG |
| 38,504 |
| |
15,947 |
| Infineon Technologies AG |
| 136,058 |
| |
|
|
|
| 174,562 |
| |
Greece – 0.0% |
|
|
| |||
Commercial Banks – 0.0% |
|
|
| |||
4,039 |
| National Bank of Greece S.A. (a) |
| 5,149 |
| |
|
|
|
|
|
| |
|
|
|
|
|
| |
2.28.13 | AllianzGI Global Equity & Convertible Income Fund Semi-Annual Report 9
AllianzGI Global Equity & Convertible Income Fund Schedule of Investments
February 28, 2013 (unaudited) (continued)
Shares |
|
|
|
| Value |
|
Hong Kong – 2.1% |
|
|
| |||
Airlines – 0.3% |
|
|
| |||
197,000 |
| Cathay Pacific Airways Ltd. |
| $368,263 |
| |
Diversified Financial Services – 0.1% |
|
|
| |||
8,000 |
| Hong Kong Exchanges & Clearing Ltd. |
| 143,847 |
| |
Electric Utilities – 0.4% |
|
|
| |||
59,000 |
| Cheung Kong Infrastructure Holdings Ltd. |
| 386,300 |
| |
Industrial Conglomerates – 0.2% |
|
|
| |||
3,600 |
| Jardine Matheson Holdings Ltd. |
| 227,939 |
| |
Marine – 0.1% |
|
|
| |||
10,500 |
| Orient Overseas International Ltd. |
| 73,786 |
| |
Real Estate Management & Development – 0.8% |
|
|
| |||
41,000 |
| Hang Lung Group Ltd. |
| 249,178 |
| |
118,000 |
| New World Development Co., Ltd. |
| 215,643 |
| |
28,000 |
| Swire Pacific Ltd., Class A |
| 362,269 |
| |
19,600 |
| Swire Properties Ltd. |
| 73,490 |
| |
|
|
|
| 900,580 |
| |
Semiconductors & Semiconductor Equipment – 0.2% |
|
|
| |||
16,500 |
| ASM Pacific Technology Ltd. |
| 217,975 |
| |
Specialty Retail – 0.0% |
|
|
| |||
19,981 |
| Esprit Holdings Ltd. |
| 26,044 |
| |
Ireland – 0.5% |
|
|
| |||
Banks – 0.0% |
|
|
| |||
20,740 |
| Irish Bank Resolution Corp., Ltd. (a) (c) |
| 271 |
| |
Insurance – 0.5% |
|
|
| |||
9,738 |
| Permanent TSB Group Holdings PLC (a) |
| 394 |
| |
19,230 |
| XL Group PLC, Class A |
| 550,747 |
| |
|
|
|
| 551,141 |
| |
Israel – 0.1% |
|
|
| |||
Pharmaceuticals – 0.1% |
|
|
| |||
3,501 |
| Teva Pharmaceutical Industries Ltd., ADR |
| 130,937 |
| |
Italy – 0.6% |
|
|
| |||
Electric Utilities – 0.2% |
|
|
| |||
54,358 |
| Enel SpA |
| 196,189 |
| |
Household Durables – 0.1% |
|
|
| |||
14,735 |
| Indesit Co. SpA |
| 107,500 |
| |
Oil, Gas & Consumable Fuels – 0.3% |
|
|
| |||
13,395 |
| ENI SpA |
| 304,867 |
| |
Japan – 5.1% |
|
|
| |||
Auto Components – 0.1% |
|
|
| |||
5,800 |
| Tokai Rika Co., Ltd. |
| 103,283 |
| |
Commercial Banks – 0.4% |
|
|
| |||
169,000 |
| Hokuhoku Financial Group, Inc. |
| 291,328 |
| |
4,896 |
| Sumitomo Mitsui Financial Group, Inc. |
| 195,395 |
| |
|
|
|
| 486,723 |
| |
|
|
|
|
|
| |
|
|
|
|
|
| |
10 AllianzGI Global Equity & Convertible Income Fund Semi-Annual Report | 2.28.13
AllianzGI Global Equity & Convertible Income Fund Schedule of Investments
February 28, 2013 (unaudited) (continued)
Shares |
|
|
|
| Value |
|
Computers & Peripherals – 0.1% |
|
|
| |||
13,000 |
| Toshiba Corp. |
| $59,830 |
| |
Diversified Financial Services – 0.0% |
|
|
| |||
490 |
| ORIX Corp. |
| 54,594 |
| |
Diversified Telecommunication – 0.1% |
|
|
| |||
2,100 |
| Nippon Telegraph & Telephone Corp. |
| 95,955 |
| |
Electronic Equipment, Instruments – 0.3% |
|
|
| |||
3,500 |
| FUJIFILM Holdings Corp. |
| 67,190 |
| |
5,500 |
| Mitsumi Electric Co., Ltd. |
| 32,391 |
| |
23,000 |
| Nippon Chemi-Con Corp. |
| 63,674 |
| |
14,000 |
| Star Micronics Co., Ltd. |
| 142,411 |
| |
|
|
|
| 305,666 |
| |
Health Care Equipment & Supplies – 0.1% |
|
|
| |||
7,000 |
| Olympus Corp. |
| 153,530 |
| |
Household Durables – 0.2% |
|
|
| |||
13,300 |
| Sony Corp. |
| 193,988 |
| |
Leisure Equipment & Products – 0.4% |
|
|
| |||
5,000 |
| Nikon Corp. |
| 112,330 |
| |
7,900 |
| Sankyo Co., Ltd. |
| 332,934 |
| |
|
|
|
| 445,264 |
| |
Machinery – 0.2% |
|
|
| |||
5,000 |
| Glory Ltd. |
| 114,610 |
| |
4,700 |
| Shima Seiki Manufacturing Ltd. |
| 100,619 |
| |
|
|
|
| 215,229 |
| |
Marine – 0.3% |
|
|
| |||
71,000 |
| Mitsui OSK Lines Ltd. |
| 248,349 |
| |
32,000 |
| Nippon Yusen KK |
| 80,314 |
| |
|
|
|
| 328,663 |
| |
Metals & Mining – 0.3% |
|
|
| |||
4,300 |
| JFE Holdings, Inc. |
| 92,066 |
| |
84,160 |
| Nippon Steel & Sumitomo Metal Corp. |
| 227,840 |
| |
|
|
|
| 319,906 |
| |
Pharmaceuticals – 0.2% |
|
|
| |||
6,000 |
| Chugai Pharmaceutical Co., Ltd. |
| 129,747 |
| |
3,300 |
| Daiichi Sankyo Co., Ltd. |
| 59,021 |
| |
|
|
|
| 188,768 |
| |
Road & Rail – 0.1% |
|
|
| |||
1,700 |
| East Japan Railway Co. |
| 125,384 |
| |
Software – 0.0% |
|
|
| |||
300 |
| Nintendo Co., Ltd. |
| 29,021 |
| |
Specialty Retail – 0.1% |
|
|
| |||
3,000 |
| Aoyama Trading Co., Ltd. |
| 64,124 |
| |
Tobacco – 0.1% |
|
|
| |||
3,200 |
| Japan Tobacco, Inc. |
| 101,037 |
| |
|
|
|
|
|
| |
|
|
|
|
|
| |
|
|
|
|
|
| |
|
|
|
|
|
| |
2.28.13 | AllianzGI Global Equity & Convertible Income Fund Semi-Annual Report 11
AllianzGI Global Equity & Convertible Income Fund Schedule of Investments
February 28, 2013 (unaudited) (continued)
Shares |
|
|
|
| Value |
|
Trading Companies & Distribution – 1.8% |
|
|
| |||
54,000 |
| ITOCHU Corp. |
| $623,090 |
| |
70,000 |
| Marubeni Corp. |
| 510,570 |
| |
26,000 |
| Mitsui & Co., Ltd. |
| 384,892 |
| |
36,900 |
| Sumitomo Corp. |
| 450,629 |
| |
|
|
|
| 1,969,181 |
| |
Wireless Telecommunication Services – 0.3% |
|
|
| |||
5,000 |
| KDDI Corp. |
| 375,529 |
| |
Netherlands – 0.1% |
|
|
| |||
Diversified Financial Services – 0.1% |
|
|
| |||
14,541 |
| ING Groep NV (a) |
| 116,413 |
| |
New Zealand – 0.2% |
|
|
| |||
Construction Materials – 0.2% |
|
|
| |||
27,259 |
| Fletcher Building Ltd. |
| 205,834 |
| |
Norway – 0.6% |
|
|
| |||
Chemicals – 0.5% |
|
|
| |||
10,500 |
| Yara International ASA |
| 500,631 |
| |
Energy Equipment & Services – 0.1% |
|
|
| |||
3,400 |
| TGS Nopec Geophysical Co. ASA |
| 128,493 |
| |
Singapore – 1.3% |
|
|
| |||
Airlines – 0.3% |
|
|
| |||
40,000 |
| Singapore Airlines Ltd. |
| 350,993 |
| |
Commercial Banks – 0.3% |
|
|
| |||
36,000 |
| Oversea-Chinese Banking Corp. Ltd. |
| 292,795 |
| |
Distributors – 0.3% |
|
|
| |||
9,000 |
| Jardine Cycle & Carriage Ltd. |
| 374,037 |
| |
Electronic Equipment, Instruments – 0.2% |
|
|
| |||
26,000 |
| Venture Corp., Ltd. |
| 179,128 |
| |
Real Estate Management & Development – 0.1% |
|
|
| |||
71,000 |
| Wing Tai Holdings Ltd. |
| 111,145 |
| |
Transportation Infrastructure – 0.1% |
|
|
| |||
29,200 |
| SATS Ltd. |
| 69,309 |
| |
Spain – 0.7% |
|
|
| |||
Construction & Engineering – 0.2% |
|
|
| |||
9,221 |
| ACS Actividades de Construccion y Servicios S.A. |
| 218,756 |
| |
2,822 |
| Sacyr Vallehermoso S.A. (a) |
| 6,187 |
| |
|
|
|
| 224,943 |
| |
Diversified Telecommunication – 0.5% |
|
|
| |||
45,274 |
| Telefonica S.A. |
| 590,932 |
| |
Sweden – 1.5% |
|
|
| |||
Commercial Banks – 0.3% |
|
|
| |||
19,000 |
| Nordea Bank AB |
| 219,191 |
| |
4,200 |
| Swedbank AB, Class A |
| 100,756 |
| |
|
|
|
| 319,947 |
| |
|
|
|
|
|
| |
|
|
|
|
|
| |
|
|
|
|
|
| |
12 AllianzGI Global Equity & Convertible Income Fund Semi-Annual Report | 2.28.13
AllianzGI Global Equity & Convertible Income Fund Schedule of Investments
February 28, 2013 (unaudited) (continued)
Shares |
|
|
|
| Value |
|
Household Durables – 0.1% |
|
|
| |||
5,400 |
| Electrolux AB, Class B |
| $137,425 |
| |
Machinery – 0.7% |
|
|
| |||
20,200 |
| Sandvik AB |
| 326,962 |
| |
16,000 |
| Trelleborg AB, Class B |
| 226,150 |
| |
14,200 |
| Volvo AB, Class B |
| 212,303 |
| |
|
|
|
| 765,415 |
| |
Specialty Retail – 0.4% |
|
|
| |||
13,200 |
| Hennes & Mauritz AB, Class B |
| 472,702 |
| |
Switzerland – 1.8% |
|
|
| |||
Biotechnology – 0.3% |
|
|
| |||
5,878 |
| Actelion Ltd. (a) |
| 302,534 |
| |
Capital Markets – 0.1% |
|
|
| |||
2,773 |
| Credit Suisse Group AG (a) |
| 73,922 |
| |
Energy Equipment & Services – 0.2% |
|
|
| |||
20,647 |
| Weatherford International Ltd. (a) |
| 245,287 |
| |
Insurance – 0.9% |
|
|
| |||
3,450 |
| Zurich Financial Services AG (a) (b) |
| 941,933 |
| |
Textiles, Apparel & Luxury Goods – 0.3% |
|
|
| |||
656 |
| Swatch Group AG |
| 372,560 |
| |
United Kingdom – 8.2% |
|
|
| |||
Aerospace & Defense – 0.1% |
|
|
| |||
11,929 |
| BAE Systems PLC |
| 64,085 |
| |
Capital Markets – 0.1% |
|
|
| |||
17,856 |
| 3i Group PLC |
| 86,523 |
| |
Chemicals – 0.0% |
|
|
| |||
4,961 |
| Alent PLC (a) |
| 28,072 |
| |
Commercial Banks – 0.5% |
|
|
| |||
50,729 |
| Barclays PLC |
| 235,379 |
| |
18,343 |
| Lloyds TSB Group PLC (a) |
| 15,078 |
| |
5,193 |
| Royal Bank of Scotland Group PLC (a) |
| 25,438 |
| |
9,470 |
| Standard Chartered PLC |
| 257,059 |
| |
|
|
|
| 532,954 |
| |
Commercial Services & Supplies – 0.3% |
|
|
| |||
13,154 |
| Aggreko PLC |
| 337,191 |
| |
Food & Staples Retailing – 0.3% |
|
|
| |||
92,742 |
| WM Morrison Supermarkets PLC (b) |
| 364,640 |
| |
Industrial Conglomerates – 0.1% |
|
|
| |||
4,730 |
| Smiths Group PLC |
| 90,200 |
| |
Insurance – 0.8% |
|
|
| |||
221,798 |
| Old Mutual PLC |
| 678,840 |
| |
45,432 |
| Standard Life PLC |
| 242,117 |
| |
|
|
|
| 920,957 |
| |
Machinery – 0.0% |
|
|
| |||
4,961 |
| Vesuvius PLC |
| 28,596 |
| |
|
|
|
|
|
| |
|
|
|
|
|
| |
|
|
|
|
|
| |
2.28.13 | AllianzGI Global Equity & Convertible Income Fund Semi-Annual Report 13
AllianzGI Global Equity & Convertible Income Fund Schedule of Investments
February 28, 2013 (unaudited) (continued)
Shares |
|
|
|
| Value |
|
Metals & Mining – 1.6% |
|
|
| |||
6,416 |
| Anglo American PLC |
| $185,915 |
| |
36,554 |
| BHP Billiton PLC (b) |
| 1,153,493 |
| |
5,372 |
| Rio Tinto PLC |
| 287,254 |
| |
4,527 |
| Xstrata PLC |
| 79,455 |
| |
|
|
|
| 1,706,117 |
| |
Multiline Retail – 0.9% |
|
|
| |||
26,858 |
| Marks & Spencer Group PLC |
| 150,791 |
| |
12,486 |
| Next PLC |
| 794,073 |
| |
|
|
|
| 944,864 |
| |
Oil, Gas & Consumable Fuels – 2.1% |
|
|
| |||
16,993 |
| BG Group PLC |
| 299,646 |
| |
|
| Royal Dutch Shell PLC, |
|
|
| |
16,201 |
| Class A |
| 532,115 |
| |
45,399 |
| Class B (b) |
| 1,527,709 |
| |
|
|
|
| 2,359,470 |
| |
Professional Services – 0.1% |
|
|
| |||
14,108 |
| Michael Page International PLC |
| 91,497 |
| |
Specialty Retail – 0.2% |
|
|
| |||
16,621 |
| Game Group PLC (a) (c) |
| 252 |
| |
72,326 |
| Howden Joinery Group PLC |
| 233,959 |
| |
|
|
|
| 234,211 |
| |
Tobacco – 0.7% |
|
|
| |||
14,650 |
| British American Tobacco PLC (b) |
| 762,143 |
| |
Wireless Telecommunication Services – 0.4% |
|
|
| |||
165,068 |
| Vodafone Group PLC |
| 414,023 |
| |
United States – 49.6% |
|
|
| |||
Aerospace & Defense – 1.9% |
|
|
| |||
1,716 |
| Engility Holdings, Inc. (a) |
| 32,381 |
| |
10,300 |
| L-3 Communications Holdings, Inc. |
| 785,581 |
| |
45,800 |
| Textron, Inc. (b) |
| 1,321,330 |
| |
|
|
|
| 2,139,292 |
| |
Auto Components – 1.3% |
|
|
| |||
5,779 |
| BorgWarner, Inc. (a) |
| 430,015 |
| |
31,200 |
| Johnson Controls, Inc. |
| 981,864 |
| |
|
|
|
| 1,411,879 |
| |
Auto Manufacturers – 0.0% |
|
|
| |||
1,535 |
| Motors Liquidation Co. GUC Trust (a) |
| 35,459 |
| |
Automobiles – 1.1% |
|
|
| |||
82,000 |
| Ford Motor Co. |
| 1,034,020 |
| |
6,114 |
| General Motors Co. (a) |
| 165,995 |
| |
|
|
|
| 1,200,015 |
| |
Beverages – 2.1% |
|
|
| |||
28,200 |
| Coca-Cola Co. |
| 1,091,904 |
| |
15,600 |
| Molson Coors Brewing Co., Class B |
| 689,676 |
| |
7,600 |
| PepsiCo, Inc. |
| 575,852 |
| |
|
|
|
| 2,357,432 |
| |
|
|
|
|
|
| |
14 AllianzGI Global Equity & Convertible Income Fund Semi-Annual Report | 2.28.13
AllianzGI Global Equity & Convertible Income Fund Schedule of Investments
February 28, 2013 (unaudited) (continued)
Shares |
|
|
|
| Value |
|
Biotechnology – 1.1% |
|
|
| |||
27,600 |
| Gilead Sciences, Inc. (a) (b) |
| $1,178,796 |
| |
Chemicals – 0.2% |
|
|
| |||
2,500 |
| Monsanto Co. (b) |
| 252,575 |
| |
Communications Equipment – 3.0% |
|
|
| |||
5,266 |
| Aviat Networks, Inc. (a) |
| 18,747 |
| |
44,800 |
| Cisco Systems, Inc. |
| 934,080 |
| |
5,984 |
| EchoStar Corp., Class A (a) |
| 226,435 |
| |
21,200 |
| Harris Corp. |
| 1,019,084 |
| |
17,000 |
| Qualcomm, Inc. |
| 1,115,710 |
| |
|
|
|
| 3,314,056 |
| |
Computers & Peripherals – 2.0% |
|
|
| |||
2,400 |
| Apple, Inc. |
| 1,059,360 |
| |
51,700 |
| EMC Corp. (a) |
| 1,189,617 |
| |
|
|
|
| 2,248,977 |
| |
Diversified Financial Services – 1.6% |
|
|
| |||
11,728 |
| Citigroup, Inc. |
| 492,224 |
| |
24,837 |
| JP Morgan Chase & Co. |
| 1,215,026 |
| |
|
|
|
| 1,707,250 |
| |
Diversified Telecommunication Services – 1.2% |
|
|
| |||
6,769 |
| Frontier Communications Corp. |
| 28,024 |
| |
28,200 |
| Verizon Communications, Inc. |
| 1,312,146 |
| |
|
|
|
| 1,340,170 |
| |
Electric Utilities – 1.1% |
|
|
| |||
13,855 |
| Entergy Corp. |
| 862,612 |
| |
11,625 |
| Exelon Corp. |
| 360,259 |
| |
|
|
|
| 1,222,871 |
| |
Electronic Equipment, Instruments & Components – 0.9% |
|
|
| |||
13,500 |
| Amphenol Corp., Class A (b) |
| 956,610 |
| |
Energy Equipment & Services – 3.0% |
|
|
| |||
9,700 |
| Diamond Offshore Drilling, Inc. |
| 675,896 |
| |
15,500 |
| National Oilwell Varco, Inc. |
| 1,056,015 |
| |
20,100 |
| Schlumberger Ltd. |
| 1,564,785 |
| |
|
|
|
| 3,296,696 |
| |
Food Products – 1.0% |
|
|
| |||
34,884 |
| Archer-Daniels-Midland Co. |
| 1,111,404 |
| |
Health Care Equipment & Supplies – 2.0% |
|
|
| |||
15,600 |
| Baxter International, Inc. (b) |
| 1,054,560 |
| |
2,300 |
| Intuitive Surgical, Inc. (a) |
| 1,172,747 |
| |
|
|
|
| 2,227,307 |
| |
Health Care Providers & Services – 1.4% |
|
|
| |||
10,800 |
| McKesson Corp. |
| 1,146,204 |
| |
5,691 |
| WellPoint, Inc. |
| 353,866 |
| |
|
|
|
| 1,500,070 |
| |
Hotels, Restaurants & Leisure – 1.0% |
|
|
| |||
11,900 |
| McDonald’s Corp. |
| 1,141,210 |
| |
|
|
|
|
|
| |
|
|
|
|
|
| |
2.28.13 | AllianzGI Global Equity & Convertible Income Fund Semi-Annual Report 15
AllianzGI Global Equity & Convertible Income Fund Schedule of Investments
February 28, 2013 (unaudited) (continued)
Shares |
|
|
|
| Value |
|
Household Products – 1.1% |
|
|
| |||
16,500 |
| Procter & Gamble Co. |
| $1,256,970 |
| |
Independent Power Producers & Energy Traders – 0.8% |
|
|
| |||
38,461 |
| NRG Energy, Inc. |
| 923,064 |
| |
Industrial Conglomerates – 1.3% |
|
|
| |||
62,026 |
| General Electric Co. |
| 1,440,244 |
| |
Insurance – 1.9% |
|
|
| |||
2,679 |
| American International Group, Inc. (a) |
| 101,829 |
| |
46,000 |
| Genworth Financial, Inc., Class A (a) |
| 392,840 |
| |
16,771 |
| MetLife, Inc. |
| 594,364 |
| |
17,000 |
| Prudential Financial, Inc. |
| 944,690 |
| |
|
|
|
| 2,033,723 |
| |
Internet Software & Services – 1.2% |
|
|
| |||
1,600 |
| Google, Inc., Class A (a) (b) |
| 1,281,920 |
| |
IT Services – 1.2% |
|
|
| |||
5,200 |
| International Business Machines Corp. |
| 1,044,316 |
| |
1,600 |
| Visa, Inc., Class A |
| 253,824 |
| |
|
|
|
| 1,298,140 |
| |
Machinery – 3.0% |
|
|
| |||
18,700 |
| AGCO Corp. |
| 962,676 |
| |
2,221 |
| Colfax Corp. (a) |
| 96,391 |
| |
14,200 |
| Deere & Co. |
| 1,247,186 |
| |
14,900 |
| Joy Global, Inc. |
| 943,766 |
| |
|
|
|
| 3,250,019 |
| |
Media – 0.9% |
|
|
| |||
29,919 |
| DISH Network Corp., Class A |
| 1,041,181 |
| |
Metals & Mining – 0.7% |
|
|
| |||
23,400 |
| Freeport-McMoRan Copper & Gold, Inc. |
| 746,928 |
| |
Multiline Retail – 1.1% |
|
|
| |||
19,500 |
| Target Corp. |
| 1,227,720 |
| |
Multi-Utilities – 1.1% |
|
|
| |||
28,169 |
| PG&E Corp. |
| 1,201,126 |
| |
Oil, Gas & Consumable Fuels – 1.6% |
|
|
| |||
5,500 |
| Occidental Petroleum Corp. |
| 452,815 |
| |
19,400 |
| Peabody Energy Corp. |
| 418,264 |
| |
18,800 |
| Valero Energy Corp. |
| 857,092 |
| |
|
|
|
| 1,728,171 |
| |
Pharmaceuticals – 2.5% |
|
|
| |||
15,100 |
| Abbott Laboratories |
| 510,229 |
| |
36,200 |
| Bristol-Myers Squibb Co. (b) |
| 1,338,314 |
| |
21,200 |
| Merck & Co., Inc. |
| 905,876 |
| |
|
|
|
| 2,754,419 |
| |
Professional Services – 0.6% |
|
|
| |||
18,840 |
| Nielsen Holdings NV (a) |
| 634,720 |
| |
Semiconductors & Semiconductor Equipment – 2.0% |
|
|
| |||
48,000 |
| Intel Corp. |
| 1,000,800 |
| |
33,900 |
| Texas Instruments, Inc. |
| 1,165,143 |
| |
|
|
|
| 2,165,943 |
| |
|
|
|
|
|
| |
16 AllianzGI Global Equity & Convertible Income Fund Semi-Annual Report | 2.28.13
AllianzGI Global Equity & Convertible Income Fund Schedule of Investments
February 28, 2013 (unaudited) (continued)
Shares |
|
|
|
| Value |
|
Software – 2.3% |
|
|
| |||
44,500 |
| Microsoft Corp. |
| $1,237,100 |
| |
36,900 |
| Oracle Corp. |
| 1,264,194 |
| |
|
|
|
| 2,501,294 |
| |
Specialty Retail – 0.3% |
|
|
| |||
4,000 |
| Home Depot, Inc. (b) |
| 274,000 |
| |
Trading Companies & Distributors – 0.1% |
|
|
| |||
1,404 |
| United Rentals, Inc. (a) |
| 74,988 |
| |
Total Common Stock (cost-$130,512,594) |
| 88,437,214 |
| |||
|
|
|
| |||
CONVERTIBLE PREFERRED STOCK – 9.7% |
|
|
| |||
|
|
|
| |||
Aerospace & Defense – 0.4% |
|
|
| |||
8,500 |
| United Technologies Corp., 7.50%, 8/1/15 |
| 495,125 |
| |
Airlines – 0.6% |
|
|
| |||
14,985 |
| Continental Airlines Finance Trust II, 6.00%, 11/15/30 |
| 649,974 |
| |
Auto Components – 0.4% |
|
|
| |||
10,700 |
| Goodyear Tire & Rubber Co., 5.875%, 4/1/14 |
| 485,138 |
| |
Automobiles – 0.4% |
|
|
| |||
60,000 |
| Escrow GM Corp., 7/15/33 (a) (c) |
| – |
| |
11,800 |
| General Motors Co., 4.75%, 12/1/13, Ser. B |
| 492,886 |
| |
|
|
|
| 492,886 |
| |
Capital Markets – 0.5% |
|
|
| |||
4,600 |
| AMG Capital Trust I, 5.10%, 4/15/36 |
| 270,394 |
| |
|
| Escrow Lehman Brothers Holdings, Inc., (a) (c) (d), |
|
|
| |
42,200 |
| 6.00%, 10/12/10, Ser. GIS |
| 134,432 |
| |
9,300 |
| 28.00%, 3/6/09, Ser. RIG |
| 121,760 |
| |
|
|
|
| 526,586 |
| |
Commercial Banks – 0.5% |
|
|
| |||
1,700 |
| Fifth Third Bancorp, 8.50%, 6/30/13, Ser. G (f) |
| 241,931 |
| |
250 |
| Wells Fargo & Co., 7.50%, 3/15/13, Ser. L (f) |
| 317,000 |
| |
|
|
|
| 558,931 |
| |
Commercial Services & Supplies – 0.4% |
|
|
| |||
5,884 |
| United Rentals, Inc., 6.50%, 8/1/28 |
| 387,241 |
| |
Computer Storage/Peripherals – 0.3% |
|
|
| |||
10,260 |
| The Goldman Sachs Group, Inc., 8.00%, 3/14/13 (NetApp, Inc.) (e) |
| 339,267 |
| |
Diversified Financial Services – 0.7% |
|
|
| |||
600 |
| Bank of America Corp., 7.25%, 12/31/49, Ser. L (f) |
| 720,000 |
| |
Electric Utilities – 0.4% |
|
|
| |||
4,900 |
| NextEra Energy, Inc., 5.599%, 6/1/15 |
| 254,036 |
| |
3,875 |
| PPL Corp., 9.50%, 7/1/13 |
| 212,350 |
| |
|
|
|
| 466,386 |
| |
Food Products – 1.0% |
|
|
| |||
10,000 |
| Bunge Ltd., 4.875%, 12/31/49 (f) |
| 1,068,500 |
| |
Health Care Providers & Services – 0.5% |
|
|
| |||
435 |
| HealthSouth Corp., 6.50%, 12/31/49, Ser. A (f) |
| 499,543 |
| |
|
|
|
|
|
| |
|
|
|
|
|
| |
2.28.13 | AllianzGI Global Equity & Convertible Income Fund Semi-Annual Report 17
AllianzGI Global Equity & Convertible Income Fund Schedule of Investments
February 28, 2013 (unaudited) (continued)
Shares |
|
|
|
| Value |
|
Insurance – 0.3% |
|
|
| |||
7,100 |
| MetLife, Inc., 5.00%, 3/26/14 |
| $335,120 |
| |
IT Services – 0.1% |
|
|
| |||
2,000 |
| Unisys Corp., 6.25%, 3/1/14 |
| 130,280 |
| |
Household Durables – 0.2% |
|
|
| |||
2,000 |
| Stanley Black & Decker, Inc., 4.75%, 11/17/15 |
| 248,520 |
| |
Metals & Mining – 0.5% |
|
|
| |||
21,140 |
| ArcelorMittal, 6.00%, 1/15/16 |
| 500,424 |
| |
Multi-Utilities – 0.5% |
|
|
| |||
11,000 |
| AES Trust III, 6.75%, 10/15/29 |
| 552,750 |
| |
Oil, Gas & Consumable Fuels – 0.9% |
|
|
| |||
8,300 |
| Apache Corp., 6.00%, 8/1/13 |
| 358,394 |
| |
4,700 |
| ATP Oil & Gas Corp., 8.00%, 10/1/14 (f) (g) (h) |
| 2,585 |
| |
6,700 |
| Chesapeake Energy Corp., 5.00%, 12/31/49 (f) |
| 581,644 |
| |
|
|
|
| 942,623 |
| |
Real Estate Investment Trust – 0.6% |
|
|
| |||
10,700 |
| Alexandria Real Estate Equities, Inc., 7.00%, 4/20/13 (f) |
| 292,431 |
| |
5,570 |
| Health Care REIT, Inc., 6.50%, 4/20/18, Ser. I (f) |
| 335,314 |
| |
|
|
|
| 627,745 |
| |
Road & Rail – 0.5% |
|
|
| |||
47,690 |
| 2010 Swift Mandatory Common Exchange Security Trust, 6.00%, 12/31/13 (h) |
| 588,642 |
| |
Total Convertible Preferred Stock (cost-$12,399,229) |
| 10,615,681 |
| |||
|
|
|
| |||
Principal |
|
|
|
|
|
|
|
|
|
| |||
CONVERTIBLE BONDS & NOTES – 8.5% |
|
|
| |||
|
|
|
| |||
Aerospace & Defense – 0.3% |
|
|
| |||
$190 |
| GenCorp, Inc., 4.063%, 12/31/39 |
| 277,044 |
| |
Biotechnology – 0.1% |
|
|
| |||
150 |
| Dendreon Corp., 2.875%, 1/15/16 |
| 124,500 |
| |
Capital Markets – 0.9% |
|
|
| |||
500 |
| Ares Capital Corp., 5.75%, 2/1/16 |
| 544,375 |
| |
475 |
| BGC Partners, Inc., 4.50%, 7/15/16 |
| 454,813 |
| |
|
|
|
| 999,188 |
| |
Coal – 0.4% |
|
|
| |||
475 |
| Alpha Appalachia Holdings, Inc., 3.25%, 8/1/15 |
| 455,703 |
| |
Construction Materials – 0.5% |
|
|
| |||
505 |
| Cemex S.A.B. de C.V., 4.875%, 3/15/15 |
| 589,588 |
| |
Electrical Equipment – 0.6% |
|
|
| |||
495 |
| EnerSys, 3.375%, 6/1/38 (i) |
| 595,240 |
| |
Hotels, Restaurants & Leisure – 0.7% |
|
|
| |||
450 |
| MGM Resorts International, 4.25%, 4/15/15 |
| 485,437 |
| |
295 |
| Morgans Hotel Group Co., 2.375%, 10/15/14 |
| 279,513 |
| |
|
|
|
| 764,950 |
| |
|
|
|
|
|
| |
|
|
|
|
|
| |
18 AllianzGI Global Equity & Convertible Income Fund Semi-Annual Report | 2.28.13
AllianzGI Global Equity & Convertible Income Fund Schedule of Investments
February 28, 2013 (unaudited) (continued)
Principal |
|
|
|
| Value |
|
Internet Software & Services – 0.1% |
|
|
| |||
$150 |
| WebMD Health Corp., 2.50%, 1/31/18 |
| $135,656 |
| |
IT Services – 0.6% |
|
|
| |||
300 |
| Alliance Data Systems Corp., 1.75%, 8/1/13 |
| 603,937 |
| |
Machinery – 1.0% |
|
|
| |||
515 |
| Greenbrier Cos, Inc., 3.50%, 4/1/18 |
| 502,769 |
| |
150 |
| Meritor, Inc., 7.875%, 3/1/26 (g) (h) |
| 145,969 |
| |
500 |
| Navistar International Corp., 3.00%, 10/15/14 |
| 473,750 |
| |
|
|
|
| 1,122,488 |
| |
Marine – 0.4% |
|
|
| |||
550 |
| DryShips, Inc., 5.00%, 12/1/14 |
| 474,031 |
| |
Media – 0.9% |
|
|
| |||
|
| Liberty Interactive LLC, |
|
|
| |
310 |
| 3.125%, 3/30/23 |
| 463,256 |
| |
1,000 |
| 3.50%, 1/15/31 |
| 530,625 |
| |
|
|
|
| 993,881 |
| |
Metals & Mining – 0.2% |
|
|
| |||
200 |
| Steel Dynamics, Inc., 5.125%, 6/15/14 |
| 225,500 |
| |
Oil, Gas & Consumable Fuels – 0.2% |
|
|
| |||
485 |
| Endeavour International Corp., 5.50%, 7/15/16 |
| 238,863 |
| |
Real Estate Investment Trust – 0.3% |
|
|
| |||
250 |
| Boston Properties LP, 3.75%, 5/15/36 |
| 263,438 |
| |
Semiconductors & Semiconductor Equipment – 0.7% |
|
|
| |||
500 |
| JA Solar Holdings Co., Ltd., 4.50%, 5/15/13 |
| 477,500 |
| |
300 |
| SunPower Corp., 4.75%, 4/15/14 |
| 298,500 |
| |
|
|
|
| 776,000 |
| |
Software – 0.1% |
|
|
| |||
125 |
| TeleCommunication Systems, Inc., 4.50%, 11/1/14 (g) (h) |
| 120,859 |
| |
Thrifts & Mortgage Finance – 0.4% |
|
|
| |||
|
| MGIC Investment Corp., |
|
|
| |
200 |
| 5.00%, 5/1/17 |
| 169,875 |
| |
395 |
| 9.00%, 4/1/63 (g) (h) |
| 242,184 |
| |
|
|
|
| 412,059 |
| |
Trading Companies & Distributors – 0.1% |
|
|
| |||
125 |
| Titan Machinery, Inc., 3.75%, 5/1/19 (g) (h) |
| 128,359 |
| |
Total Convertible Bonds & Notes (cost-$9,472,799) |
| 9,301,284 |
| |||
|
|
|
| |||
Shares |
|
|
|
|
|
|
|
|
|
| |||
PREFERRED STOCK – 0.3% |
|
|
| |||
|
|
|
| |||
Germany – 0.3% |
|
|
| |||
Automobiles – 0.3% |
|
|
| |||
3,950 |
| Porsche Automobile Holding SE (cost-$899,346) |
| 311,987 |
| |
|
|
|
|
|
| |
|
|
|
|
|
| |
|
|
|
|
|
| |
|
|
|
|
|
| |
|
|
|
|
|
| |
2.28.13 | AllianzGI Global Equity & Convertible Income Fund Semi-Annual Report 19
AllianzGI Global Equity & Convertible Income Fund Schedule of Investments
February 28, 2013 (unaudited) (continued)
Units |
|
|
|
| Value |
|
WARRANTS (a) – 0.1% |
|
|
| |||
|
|
|
| |||
Automobiles – 0.1% |
|
|
| |||
|
| General Motors Co., |
|
|
| |
5,558 |
| expires 7/10/16 |
| $99,822 |
| |
5,558 |
| expires 7/10/19 |
| 62,805 |
| |
Total Warrants (cost-$775,632) |
| 162,627 |
| |||
|
|
|
| |||
Principal |
|
|
|
|
|
|
|
|
|
| |||
SHORT-TERM INVESTMENT – 0.7% |
|
|
| |||
|
|
|
| |||
Time Deposit – 0.7% |
|
|
| |||
$799 |
| Citibank-London, 0.03%, 3/1/13 (cost-$799,035) |
| 799,035 |
| |
Total Investments, before call options written (cost-$154,858,635) – 99.9% |
| 109,627,828 |
| |||
|
|
|
| |||
Contracts |
|
|
|
|
|
|
|
|
|
| |||
CALL OPTIONS WRITTEN (a) – (0.0)% |
|
|
| |||
|
|
|
|
|
| |
|
| Amphenol Corp., (ASE), |
|
|
| |
95 |
| strike price $75, expires 4/20/13 |
| (6,888 | ) | |
|
| Baxter International, Inc., (CBOE), |
|
|
| |
110 |
| strike price $70, expires 4/20/13 |
| (11,770 | ) | |
|
| Bristol-Myers Squibb Co., (ASE), |
|
|
| |
250 |
| strike price $38, expires 3/16/13 |
| (2,125 | ) | |
|
| Gilead Sciences, Inc., (CBOE), |
|
|
| |
165 |
| strike price $43.75, expires 3/16/13 |
| (6,517 | ) | |
|
| Google, Inc., (ASE), |
|
|
| |
11 |
| strike price $810, expires 3/16/13 |
| (7,975 | ) | |
|
| Home Depot, Inc., (CBOE), |
|
|
| |
30 |
| strike price $70, expires 3/16/13 |
| (1,020 | ) | |
|
| Monsanto Co., (ASE), |
|
|
| |
15 |
| strike price $105, expires 4/20/13 |
| (2,362 | ) | |
|
| Textron, Inc., (ASE), |
|
|
| |
180 |
| strike price $31, expires 3/16/13 |
| (630 | ) | |
|
| Visa, Inc., (ASE), |
|
|
| |
10 |
| strike price $165, expires 3/16/13 |
| (330 | ) | |
Total Call Options Written (premiums received-$38,627) |
| (39,617 | ) | |||
Total Investments, net of call options written |
| 109,588,211 |
| |||
Other assets less other liabilities – 0.1% |
| 144,490 |
| |||
Net Assets – 100.0% |
| $109,732,701 |
| |||
|
|
|
| |||
|
|
|
| |||
|
|
|
| |||
|
|
|
| |||
|
|
|
| |||
|
|
|
| |||
|
|
|
| |||
|
|
|
| |||
|
|
|
| |||
|
|
|
| |||
|
|
|
| |||
20 AllianzGI Global Equity & Convertible Income Fund Semi-Annual Report | 2.28.13
AllianzGI Global Equity & Convertible Income Fund Notes to Schedule of Investments
February 28, 2013 (unaudited) (continued)
|
|
|
|
|
| |
|
| |||||
Notes to Schedule of Investments: |
| |||||
(a) | Non-income producing. |
| ||||
(b) | All or partial amount segregated for the benefit of the counterparty as collateral for call options written. |
| ||||
(c) | Fair-Valued–Securities with an aggregate value of $256,715, representing 0.2% of net assets. See Note 1(a) in the Notes to Financial Statements. |
| ||||
(d) | In default. |
| ||||
(e) | Securities exchangeable or convertible into securities of an entity different than the issuer or structured by the issuer to provide exposure to securities of an entity different than the issuer (synthetic convertible securities). Such entity is identified in the parenthetical. |
| ||||
(f) | Perpetual maturity. Maturity date shown is the next call date. |
| ||||
(g) | Private Placement–Restricted as to resale and may not have a readily available market. Securities with an aggregate value of $639,956, representing 0.6% of net assets. |
| ||||
(h) | 144A–Exempt from registration under Rule 144A of the Securities Act of 1933. These securities may be resold in transactions exempt from registration, typically only to qualified institutional buyers. Unless otherwise indicated, these securities are not considered to be illiquid. |
| ||||
(i) | Step Bond–Coupon is a fixed rate for an initial period then resets at a specific date and rate. |
| ||||
(j) | Securities with an aggregrate value of $32,201,613, representing 29.3% of net assets, were valued utilizing modeling tools provided by a third-party vendor. See Note 1(a) and Note 1(b) in the Notes to Finanacial Statements. |
| ||||
(k) | Transactions in call options written for the six months ended February 28, 2013: |
| ||||
|
|
| ||||
|
| Contracts |
| Premiums |
| |
Options outstanding, August 31, 2012 |
| 600 |
| $49,879 |
| |
Options written |
| 3,776 |
| 248,259 |
| |
Options terminated in closing transactions |
| (1,156) |
| (102,975 | ) | |
Options excercised |
| (110) |
| (8,169 | ) | |
Options expired |
| (2,244) |
| (148,367 | ) | |
Options outstanding, February 28, 2013 |
| 866 |
| $38,627 |
| |
|
|
|
|
|
| |
|
|
|
|
|
| |
|
|
|
|
|
| |
|
|
|
|
|
| |
|
|
|
|
|
| |
|
|
|
|
|
| |
|
|
|
|
|
| |
|
|
|
|
|
| |
|
|
|
|
|
| |
|
|
|
|
|
| |
|
|
|
|
|
| |
|
|
|
|
|
| |
|
|
|
|
|
| |
|
|
|
|
|
| |
|
|
|
|
|
| |
|
|
|
|
|
| |
|
|
|
|
|
| |
|
|
|
|
|
| |
|
|
|
|
|
| |
|
|
|
|
|
| |
|
|
|
|
|
| |
|
|
|
|
|
| |
|
|
|
|
|
| |
|
|
|
|
|
| |
|
|
|
|
|
| |
2.28.13 | AllianzGI Global Equity & Convertible Income Fund Semi-Annual Report 21
AllianzGI Global Equity & Convertible Income Fund Notes to Schedule of Investments
February 28, 2013 (unaudited) (continued)
|
| ||||||||
(l) Fair Value Measurements – See Note 1(b) in Notes to Financial Statements. |
| ||||||||
|
| Level 1 – |
| Level 2 – |
| Level 3 – |
| Value at |
|
Investments in Securities – Assets |
|
|
|
|
|
|
|
|
|
Common Stock: |
|
|
|
|
|
|
|
|
|
Australia |
| – |
| $2,771,934 |
| – |
| $2,771,934 |
|
Austria |
| – |
| 110,647 |
| – |
| 110,647 |
|
Belgium |
| – |
| 157,414 |
| – |
| 157,414 |
|
China |
| – |
| 280,005 |
| – |
| 280,005 |
|
Denmark |
| – |
| 136,395 |
| – |
| 136,395 |
|
Finland |
| – |
| 182,108 |
| – |
| 182,108 |
|
France |
| – |
| 1,924,740 |
| – |
| 1,924,740 |
|
Germany |
| – |
| 2,283,565 |
| – |
| 2,283,565 |
|
Greece |
| – |
| 5,149 |
| – |
| 5,149 |
|
Hong Kong |
| – |
| 2,344,734 |
| – |
| 2,344,734 |
|
Ireland |
| $550,747 |
| 394 |
| $271 |
| 551,412 |
|
Italy |
| – |
| 608,556 |
| – |
| 608,556 |
|
Japan |
| – |
| 5,615,675 |
| – |
| 5,615,675 |
|
Netherlands |
| – |
| 116,413 |
| – |
| 116,413 |
|
New Zealand |
| – |
| 205,834 |
| – |
| 205,834 |
|
Norway |
| – |
| 629,124 |
| – |
| 629,124 |
|
Singapore |
| – |
| 1,377,407 |
| – |
| 1,377,407 |
|
Spain |
| – |
| 815,875 |
| – |
| 815,875 |
|
Sweden |
| – |
| 1,695,489 |
| – |
| 1,695,489 |
|
Switzerland |
| 245,287 |
| 1,690,949 |
| – |
| 1,936,236 |
|
United Kingdom |
| 28,072 |
| 8,937,219 |
| 252 |
| 8,965,543 |
|
All Other |
| 55,722,959 |
| – |
| – |
| 55,722,959 |
|
Convertible Preferred Stock: |
|
|
|
|
|
|
|
|
|
Airlines |
| – |
| 649,974 |
| – |
| 649,974 |
|
Automobiles |
| 492,886 |
| – |
| –† |
| 492,886 |
|
Capital Markets |
| – |
| 270,394 |
| 256,192 |
| 526,586 |
|
Commercial Banks |
| 317,000 |
| 241,931 |
| – |
| 558,931 |
|
Commercial Services & Supplies |
| – |
| 387,241 |
| – |
| 387,241 |
|
Computer Storage/Peripherals |
| – |
| – |
| 339,267 |
| 339,267 |
|
Health Care Providers & Services |
| – |
| 499,543 |
| – |
| 499,543 |
|
Metals & Mining |
| – |
| 500,424 |
| – |
| 500,424 |
|
Oil, Gas & Consumable Fuels |
| 358,394 |
| 584,229 |
| – |
| 942,623 |
|
Road & Rail |
| – |
| 588,642 |
| – |
| 588,642 |
|
All Other |
| 5,129,564 |
| – |
| – |
| 5,129,564 |
|
Convertible Bonds & Notes |
| – |
| 9,301,284 |
| – |
| 9,301,284 |
|
Preferred Stock |
| – |
| 311,987 |
| – |
| 311,987 |
|
Warrants |
| 162,627 |
| – |
| – |
| 162,627 |
|
Short-Term Investments |
| – |
| 799,035 |
| – |
| 799,035 |
|
|
| $63,007,536 |
| $46,024,310 |
| $595,982 |
| $109,627,828 |
|
Investments in Securities – Liabilities |
|
|
|
|
|
|
|
|
|
Call Options Written, at value: |
|
|
|
|
|
|
|
|
|
Market price |
| (39,617) |
| – |
| – |
| (39,617) |
|
Totals |
| $62,967,919 |
| $46,024,310 |
| $595,982 |
| $109,588,211 |
|
|
| ||||||||
At February 28, 2013, a security valued at $394 was transferred from Level 1 to Level 2. This change was the result of a security trading outside the U.S. whose value was not adjusted by the application of a modeling tool at August 31, 2012, which was applied on February 28, 2013. |
| ||||||||
|
| ||||||||
|
| ||||||||
|
| ||||||||
22 AllianzGI Global Equity & Convertible Income Fund Semi-Annual Report | 2.28.13
AllianzGI Global Equity & Convertible Income Fund Notes to Schedule of Investments
February 28, 2013 (unaudited) (continued)
A roll forward of fair value measurements using significant unobservable inputs (Level 3) for the six months ended February 28, 2013, was as follows: |
| |||||||||||||||||||||||||
|
|
|
|
|
|
|
|
|
|
|
|
|
|
|
|
|
|
|
| |||||||
|
| Beginning |
| Purchases |
| Sales |
| Accrued |
| Net |
| Net Change |
| Transfers |
| Transfers |
| Ending |
| |||||||
Investments in Securities – Assets |
|
|
|
|
|
|
|
|
|
|
|
|
|
|
| |||||||||||
Common Stock: |
|
|
|
|
|
|
|
|
|
|
|
|
|
|
|
|
|
|
| |||||||
Ireland |
| $261 |
| – |
| – |
| – |
| – |
| $10 |
| – |
| – |
| $271 |
| |||||||
United Kingdom |
| 264 |
| – |
| – |
| – |
| – |
| (12) |
| – |
| – |
| 252 |
| |||||||
Convertible Preferred Stock: |
|
|
|
|
|
|
|
|
|
|
|
|
|
|
|
|
|
|
| |||||||
Automobiles |
| – | † | – |
| – |
| – |
| – |
| – |
| – |
| – |
| – | † | |||||||
Capital Markets |
| 332,377 |
| – |
| – |
| – |
| – |
| (76,185) |
| – |
| – |
| 256,192 |
| |||||||
Computer Storage/ Peripherals |
| – |
| – |
| – |
| – |
| – |
| – |
| $339,267 |
| – |
| 339,267 |
| |||||||
Totals |
| $332,902 |
| – |
| – |
| – |
| – |
| $(76,187) |
| $339,267 |
| – |
| $595,982 |
| |||||||
|
| |||||||||||||||||||||||||
† Escrow GM Corp. is fair-valued at $0. * Transferred out of Level 2 into Level 3 because the price provided by a third-party pricing vendor was a single broker quote. |
| |||||||||||||||||||||||||
|
| |||||||||||||||||||||||||
The net change in unrealized appreciation/depreciation of Level 3 investments, at February 28, 2013 was $(76,187). Net change in unrealized appreciation/depreciation is reflected on the Statement of Operations. |
| |||||||||||||||||||||||||
|
| |||||||||||||||||||||||||
The following table presents additional information about valuation techniques and inputs used for investments that are measured at fair value and categorized within Level 3 at February 28, 2013: |
| |||||||||||||||||||||||||
|
| |||||||||||||||||||||||||
|
| Ending Balance |
| Valuaton |
| Unobservable |
| Input Values |
| |||||||||||||||||
Investments in Securities – Assets |
|
|
|
|
|
|
| |||||||||||||||||||
Convertible Preferred Stock: |
|
|
|
|
|
|
|
|
| |||||||||||||||||
Capital Markets |
| $256,192 |
| Fundamental Analytical Data Relating to the Investment |
| Expected Recovery Value |
| $3.19-$13.09 |
| |||||||||||||||||
Computer Storage/ |
| 339,267 |
| Third-Party Pricing Vendor |
| Single Broker Quote |
| $33.07 |
| |||||||||||||||||
|
|
|
|
|
|
|
|
|
| |||||||||||||||||
|
|
|
|
|
|
|
|
|
| |||||||||||||||||
|
|
|
|
|
|
|
|
|
| |||||||||||||||||
|
|
|
|
|
|
|
|
|
| |||||||||||||||||
|
|
|
|
|
|
|
|
|
| |||||||||||||||||
|
|
|
|
|
|
|
|
|
| |||||||||||||||||
|
|
|
|
|
|
|
|
|
| |||||||||||||||||
|
|
|
|
|
|
|
|
|
| |||||||||||||||||
|
|
|
|
|
|
|
|
|
| |||||||||||||||||
2.28.13 | AllianzGI Global Equity & Convertible Income Fund Semi-Annual Report 23
AllianzGI Global Equity & Convertible Income Fund Notes to Schedule of Investments
February 28, 2013 (unaudited) (continued)
|
| |||
(m) The following is a summary of the fair valuation of derivative instruments categorized by risk exposure: |
| |||
|
| |||
The effect of derivatives on the Statement of Assets and Liabilities at February 28, 2013: |
| |||
|
|
|
| |
Location |
| Market Price |
| |
Liability derivatives: |
|
|
| |
Call options written, at value |
| $(39,617) |
| |
|
|
|
| |
The effect of derivatives on the Statement of Operations for the six months ended February 28, 2013: |
|
|
| |
|
|
|
| |
Location |
| Market Price |
| |
Net realized gain (loss) on: |
|
|
| |
Call options written |
| $(7,260) |
| |
Net change in unrealized appreciation/depreciation of: |
|
|
| |
Call options written |
| $(25,067) |
| |
|
|
|
| |
The average volume (measured at each fiscal quarter-end) of derivative activity during the six months ended February 28, 2013 was 589 call options written contracts. |
| |||
|
| |||
|
| |||
Glossary: |
| |||
ADR | - American Depositary Receipt |
| ||
ASE | - American Stock Exchange |
| ||
CBOE | - Chicago Board Options Exchange |
| ||
GUC | - General Unsecured Creditors |
| ||
REIT | - Real Estate Investment Trust |
| ||
|
| |||
|
| |||
|
| |||
|
| |||
|
| |||
|
| |||
|
| |||
|
| |||
|
| |||
AllianzGI Global Equity & Convertible Income Fund | |
| | 2.28.13 | See accompanying Notes to Financial Statements. |
AllianzGI Global Equity & Convertible Income Fund
Statement of Assets and Liabilities
February 28, 2013 (unaudited)
|
|
|
|
Assets: |
|
|
|
Investments, at value (cost-$154,858,635) |
| $109,627,828 |
|
Foreign currency (cost-$5,317) |
| 5,264 |
|
Dividends and interest receivable (net of foreign withholding taxes) |
| 329,971 |
|
Receivable for investments sold |
| 2,439 |
|
Prepaid expenses |
| 2,459 |
|
Total Assets |
| 109,967,961 |
|
|
|
|
|
Liabilities: |
|
|
|
Investment management fees payable |
| 84,607 |
|
Call options written, at value (premiums received-$38,627) |
| 39,617 |
|
Accrued expenses |
| 111,036 |
|
Total Liabilities |
| 235,260 |
|
Net Assets |
| $109,732,701 |
|
|
|
|
|
Composition of Net Assets: |
|
|
|
Common Shares: |
|
|
|
Par value ($0.00001 per share, applicable to 7,019,923 shares issued and outstanding) |
| $70 |
|
Paid-in-capital in excess of par |
| 160,302,058 |
|
Dividends in excess of net investment income |
| (3,726,995 | ) |
Accumulated net realized loss |
| (1,610,693 | ) |
Net unrealized depreciation |
| (45,231,739 | ) |
Net Assets |
| $109,732,701 |
|
Net Asset Value Per Share |
| $15.63 |
|
AllianzGI Global Equity & Convertible Income Fund |
|
See accompanying Notes to Financial Statements. | 2.28.13 | Semi-Annual Report |
|
AllianzGI Global Equity & Convertible Income Fund
Statement of Operations
Six Months ended February 28, 2013 (unaudited)
|
|
|
|
|
|
|
|
Investment Income: |
|
|
|
Dividends (net of foreign withholding taxes of $17,061) |
| $1,294,451 |
|
Interest |
| 232,061 |
|
Total Investment Income |
| 1,526,512 |
|
|
|
|
|
Expenses: |
|
|
|
Investment management |
| 527,994 |
|
Custodian and accounting agent |
| 60,039 |
|
Audit and tax services |
| 37,967 |
|
Shareholder communications |
| 24,850 |
|
Transfer agent |
| 18,241 |
|
New York Stock Exchange listing |
| 8,147 |
|
Legal |
| 6,961 |
|
Trustees |
| 4,510 |
|
Miscellaneous |
| 6,257 |
|
Total Expenses |
| 694,966 |
|
|
|
|
|
Net Investment Income |
| 831,546 |
|
|
|
|
|
Realized and Change in Unrealized Gain (Loss): |
|
|
|
Net realized gain (loss) on: |
| 1,174,239 |
|
Call options written |
| (7,260 | ) |
Foreign currency transactions |
| (1,858 | ) |
Net change in unrealized appreciation/depreciation of: |
| 7,627,179 |
|
Call options written |
| (25,067 | ) |
Foreign currency transactions |
| 290 |
|
Net realized and change in unrealized gain |
| 8,767,523 |
|
Net Increase in Net Assets Resulting from Investment Operations |
| $9,599,069 |
|
AllianzGI Global Equity & Convertible Income Fund | |
| | 2.28.13 | See accompanying Notes to Financial Statements. |
AllianzGI Global Equity & Convertible Income Fund
Statement of Changes in Net Assets
|
|
|
|
|
|
|
|
| Six Months |
|
| Year ended |
|
Investment Operations: |
|
|
|
|
|
|
Net investment income |
| $831,546 |
|
| $2,177,698 |
|
Net realized gain |
| 1,165,121 |
|
| 1,044,578 |
|
Net change in unrealized appreciation/depreciation |
| 7,602,402 |
|
| 576,866 |
|
Net increase in net assets resulting from investment operations |
| 9,599,069 |
|
| 3,799,142 |
|
|
|
|
|
|
|
|
Dividends and Distributions to Shareholders from: |
|
|
|
|
|
|
Net investment income |
| (4,211,954 | ) |
| (3,008,509 | ) |
Net realized gains |
| – |
|
| (3,721,167 | ) |
Return of capital |
| – |
|
| (1,689,511 | ) |
Total dividends and distributions to shareholders |
| (4,211,954 | ) |
| (8,419,187 | ) |
|
|
|
|
|
|
|
Capital Share Transactions: |
|
|
|
|
|
|
Reinvestment of dividends and distributions |
| – |
|
| 221,691 |
|
Total increase (decrease) in net assets |
| 5,387,115 |
|
| (4,398,354 | ) |
|
|
|
|
|
|
|
Net Assets: |
|
|
|
|
|
|
Beginning of period |
| 104,345,586 |
|
| 108,743,940 |
|
End of period* |
| $109,732,701 |
|
| $104,345,586 |
|
*Including dividends in excess of net investment income of: |
| $(3,726,995 | ) |
| $(346,587 | ) |
|
|
|
|
|
|
|
Shares Issued in Reinvestment of Dividends and Distributions |
| – |
|
| 15,734 |
|
AllianzGI Global Equity & Convertible Income Fund |
|
See accompanying Notes to Financial Statements. | 2.28.13 | Semi-Annual Report |
|
AllianzGI Global Equity & Convertible Income Fund
Notes to Financial Statements
February 28, 2013 (unaudited)
1. Organization and Significant Accounting Policies
AllianzGI Global Equity & Convertible Income Fund (the “Fund”), formerly known as AGIC Global Equity & Convertible Income Fund, was organized as a Massachusetts business trust on May 3, 2007. Prior to commencing operations on September 28, 2007, the Fund had no operations other than matters relating to its organization and registration as a diversified, closed-end management investment company under the Investment Company Act of 1940 and the rules and regulations thereunder, as amended. Allianz Global Investors Fund Management LLC (the “Investment Manager”) and Allianz Global Investors U.S. LLC (the “Sub-Adviser”), formerly Allianz Global Investors Capital LLC, serve as the Fund’s investment manager and sub-adviser, respectively, and are indirect wholly-owned subsidiaries of Allianz Asset Management of America L.P. (“AAM”). The Sub-Adviser name change occurred on January 1, 2013 in connection with several corporate reorganization transactions within the Allianz Global Investors U.S. business. AAM is an indirect, wholly-owned subsidiary of Allianz SE, a publicly traded European insurance and financial services company. The Fund has authorized an unlimited amount of common shares with $0.00001 par value.
The Fund’s investment objective is to seek total return comprised of capital appreciation, current income and gains. Under normal market conditions the Fund pursues its investment objective by investing in a diversified, global portfolio of equity securities and income-producing convertible securities. The Fund also employs a strategy of writing (selling) call options on stocks held, as well as on equity indexes, in an attempt to generate gains from option premiums. The extent of the Fund’s use of the option strategy will vary depending on market conditions and other factors, and the Fund may determine from to write call options on only a portion, or none, of the stocks in its equity portfolio. There can be no assurance that the Fund will meet its stated objective.
The preparation of the Fund’s financial statements in accordance with accounting principles generally accepted in the United States of America requires the Fund management to make estimates and assumptions that affect the reported amounts and disclosures in the Fund’s financial statements. Actual results could differ from those estimates.
In the normal course of business, the Fund enters into contracts that contain a variety of representations that provide general indemnifications. The Fund’s maximum exposure under these arrangements is unknown as this would involve future claims that may be made against the Fund that have not yet occurred.
In December 2011, the Financial Accounting Standards Board issued Accounting Standards Update No. 2011-11, “Disclosures About Offsetting Assets and Liabilities,” which requires enhanced disclosures that will enable users to evaluate the effect or potential effect of netting arrangements on an entity’s financial position, including the effect or potential effect of rights of setoff associated with certain financial instruments and derivative instruments. The amendments are effective for fiscal years beginning on or after January 1, 2013. The Fund’s management is currently evaluating the effect that the guidance may have on the Fund’s financial statements.
The following is a summary of significant accounting policies consistently followed by the Fund:
(a) Valuation of Investments
Portfolio securities and other financial instruments for which market quotations are readily available are stated at market value. Market value is generally determined on the basis of last reported sales prices, or if no sales are reported, on the basis of quotes obtained from a quotation reporting system, established market makers, or independent pricing services. The Fund’s investments are valued daily using prices supplied by an independent pricing service or dealer quotations, or by using the last sale price on the exchange that is the primary market for such securities, or the mean between the last quoted bid and ask price. Independent pricing services use information provided by market makers or estimates of market values obtained from yield data relating to investments or securities with similar characteristics.
The Board of Trustees (the “Board”) has adopted procedures for valuing portfolio securities and other financial derivative instruments in circumstances where market quotes are not readily available, and has delegated the responsibility for applying the valuation methods to the Investment Manager and the Sub-Adviser. The Fund’s Valuation Committee was established by the Board to oversee the implementation of the Fund’s valuation methods and to make fair value determinations on behalf of the Board, as instructed. The Sub-Adviser monitors the continued appropriateness of methods applied and determines if adjustments should be made in light of market changes, events affecting the issuer, or other factors. If the Sub-Adviser determines that a valuation method may no longer be appropriate, another valuation method may be selected, or the Valuation Committee will be convened to consider the matter and take any appropriate action in accordance with procedures set forth by the Board. The Board shall review the appropriateness of the valuation methods and these methods may be amended or supplemented from time to time by the Valuation Committee.
28 AllianzGI Global Equity & Convertible Income Fund Semi-Annual Report | 2.28.13
AllianzGI Global Equity & Convertible Income Fund
Notes to Financial Statements
February 28, 2013 (unaudited)
1. Organization and Significant Accounting Policies (continued)
Synthetic convertible securities are valued based on quotations obtained from unaffiliated brokers who are the principal market-makers in such securities. Such valuations are derived by the brokers from proprietary models which are generally based on readily available market information including valuations of the common stock underlying the synthetic security.
Short-term securities maturing in 60 days or less are valued at amortized cost, if their original term to maturity was 60 days or less, or by amortizing their value on the 61st day prior to maturity, if the original term to maturity exceeded 60 days.
Investments initially valued in currencies other than the U.S. dollar are converted to the U.S. dollar using exchange rates obtained from pricing services. As a result, the net asset value (“NAV”) of the Fund’s shares may be affected by changes in the value of currencies in relation to the U.S. dollar. The value of securities traded in markets outside the United States or denominated in currencies other than the U.S. dollar may be affected significantly on a day that the New York Stock Exchange (“NYSE”) is closed.
The prices used by the Fund to value securities may differ from the value that would be realized if the securities were sold and these differences could be material to the Fund’s financial statements. The Fund’s NAV is normally determined at the close of regular trading (normally, 4:00 p.m. Eastern time) on the NYSE on each day the NYSE is open for business.
The prices of certain portfolio securities may be determined at a time prior to the close of regular trading on the NYSE. When fair-valuing the securities, the Fund may, among other things, consider significant events (which may be considered to include changes in the value of U.S. securities or securities indices) that occur after the close of the relevant market and before the time the Fund’s NAV is calculated. With respect to certain foreign securities, the Fund may fair-value securities using modeling tools provided by third-party vendors. The Fund has retained a statistical research service to assist in determining the fair value of foreign securities. This service utilizes statistics and programs based on historical performance of markets and other economic data to assist in making fair value estimates. Fair value estimates used by the Fund for foreign securities may differ from the value realized from the sale of those securities and these differences could be material to the financial statements. Fair value pricing may require subjective determinations about the value of a security or other assets, and fair values used to determine the Fund’s NAV may differ from quoted or published prices, or from prices that are used by others, for the same investments. In addition, the use of fair value pricing may not always result in adjustments to the prices of securities or other assets held by the Fund.
(b) Fair Value Measurements
Fair value is defined as the price that would be received to sell an asset or paid to transfer a liability (i.e. the “exit price”) in an orderly transaction between market participants. The three levels of the fair value hierarchy are described below:
· Level 1 – quoted prices in active markets for identical investments that the Fund has the ability to access
· Level 2 – valuations based on other significant observable inputs, which may include, but not limited to, quoted prices for similar assets and liabilities, interest rates, yield curves, volatilities, prepayment speeds, loss severities, credit risk and default rates or other market corroborated inputs
· Level 3 – valuations based on significant unobservable inputs (including the Sub-Adviser’s or Valuation Committee’s own assumptions and single broker quotes in determining the fair value of investments)
The inputs or methodology used for valuing securities are not necessarily an indication of the risk associated with investing in those securities. The following are certain inputs and techniques that the Fund generally uses to evaluate how to classify each major category of assets and liabilities for Level 2 and Level 3, in accordance with Generally Accepted Accounting Principles (“GAAP”).
Equity Securities (Common and Preferred Stock) — Equity securities traded in inactive markets and certain foreign equity securities are valued using inputs which include broker-dealer quotes, recently executed transactions adjusted for changes in the benchmark index, or evaluated price quotes received from independent pricing services that take into account the integrity of the market sector and issuer, the individual characteristics of the security, and information received from broker-dealers and other market sources pertaining to the issuer or security. To the extent that these inputs are observable, the values of equity securities are categorized as Level 2. To the extent that these inputs are unobservable the values are categorized as Level 3.
2.28.13 | AllianzGI Global Equity & Convertible Income Fund Semi-Annual Report 29
AllianzGI Global Equity & Convertible Income Fund
Notes to Financial Statements
February 28, 2013 (unaudited)
1. Organization and Significant Accounting Policies (continued)
Convertible Bonds & Notes — Convertible bonds & notes are valued by independent pricing services using various inputs and techniques, which include broker-dealer quotations from relevant market makers and recently executed transactions in securities of the issuer or comparable issuers. The broker-dealer quotations received are supported by credit analysis of the issuer that takes into consideration credit quality assessments, daily trading activity, and the activity of the underlying equities, listed bonds and sector-specific trends. To the extent that these inputs are observable, the values of convertible bonds & notes are categorized as Level 2. To the extent that these inputs are unobservable the values are categorized as Level 3.
Option Contracts — Option contracts traded over-the-counter (“OTC”) and flexible exchange (“FLEX”) are valued by independent pricing services based on pricing models that incorporate various inputs such as interest rates, credit spreads, currency exchange rates and volatility measurements for in-the-money, at-the-money, and out-of-the-money contracts based on a given strike price. To the extent that these inputs are observable, the values of OTC and FLEX option contracts are categorized as Level 2. To the extent that these inputs are unobservable the values are categorized as Level 3.
The valuation techniques used by the Fund to measure fair value during the six months ended February 28, 2013 were intended to maximize the use of observable inputs and to minimize the use of unobservable inputs.
The Fund’s policy is to recognize transfers between levels at the end of the reporting period. An investment asset’s or liability’s level within the fair value hierarchy is based on the lowest level input, individually or in aggregate, that is significant to fair value measurement. The objective of fair value measurement remains the same even when there is a significant decrease in the volume and level of activity for an asset or liability and regardless of the valuation techniques used. Investments categorized as Level 1 or 2 as of period end may have been transferred between Levels 1 and 2 since the prior period due to changes in the valuation method utilized in valuing the investments.
(c) Investment Transactions and Investment Income
Investment transactions are accounted for on the trade date. Realized gains and losses on investments are determined on the identified cost basis. Dividend income is recorded on the ex-dividend date. Interest income adjusted for the accretion of discount and amortization of premium is recorded on an accrual basis. Discounts or premiums on debt securities purchased are accreted or amortized, respectively, to interest income. Conversion premium is not amortized. Payments received on synthetic convertible securities are generally included in dividend income. Payments received from certain investments may be comprised of dividends, realized gains and return of capital. These payments may initially be recorded as dividend income and subsequently be reclassified as realized gains and/or return of capital upon receipt of information from the issuer.
(d) Federal Income Taxes
The Fund intends to distribute all of its taxable income and to comply with the other requirements of Subchapter M of the U.S. Internal Revenue Code of 1986, as amended, applicable to regulated investment companies. Accordingly, no provision for U.S. federal income taxes is required.
Accounting for uncertainty in income taxes establishes for all entities, including pass-through entities such as the Fund, a minimum threshold for financial statement recognition of the benefit of positions taken in filing tax returns (including whether an entity is taxable in a particular jurisdiction), and requires certain expanded tax disclosures. The Fund’s management has determined that its evaluation of the positions taken in the tax returns has resulted in no material impact on the Fund’s financial statements at February 28, 2013. The Fund’s federal tax returns for the prior three fiscal years remain subject to examination by the Internal Revenue Service.
(e) Dividends and Distributions
The Fund declares dividends and distributions on a quarterly basis. These dividends and distributions may be comprised in varying proportions of net investment income, gains from option premiums and the sale of portfolio securities and return of capital. The Fund records dividends and distributions on the ex-dividend date. The amount of dividends from net investment income and distributions from net realized capital gains is determined in accordance with federal income tax regulations, which may differ from GAAP. These “book-tax” differences are considered either temporary or permanent in nature. To the extent these differences are permanent in nature, such amounts are reclassified within the capital accounts based on their federal income tax treatment. Temporary differences do not require reclassification. To the extent dividends and/or distributions exceed current and accumulated earnings and profits for federal income tax purposes, they are reported as dividends and/or distributions to shareholders from return of capital. At February 28, 2013, it is anticipated that the Fund will have a return of capital at fiscal year end.
30 AllianzGI Global Equity & Convertible Income Fund Semi-Annual Report | 2.28.13
AllianzGI Global Equity & Convertible Income Fund
Notes to Financial Statements
February 28, 2013 (unaudited)
1. Organization and Significant Accounting Policies (continued)
(f) Foreign Currency Translations
The Fund’s accounting records are maintained in U.S. dollars as follows: (1) the foreign currency market value of investments and other assets and liabilities denominated in foreign currency are translated at the prevailing exchange rate at the end of the period; and (2) purchases and sales, income and expenses are translated at the prevailing exchange rate on the respective dates of such transactions. The resulting net foreign currency gain (loss) is included in the Fund’s Statement of Operations.
The Fund does not generally isolate that portion of the results of operations arising as a result of changes in the foreign currency exchange rates from the fluctuations arising from changes in the market prices of securities. Accordingly, such foreign currency gain (loss) is included in net realized and unrealized gain (loss) on investments. However, the Fund does isolate the effect of fluctuations in foreign currency exchange rates when determining the gain (loss) upon the sale or maturity of foreign currency denominated debt obligations pursuant to U.S. federal income tax regulations; such amount is categorized as foreign currency gain (loss) for both financial reporting and income tax reporting purposes.
(g) Convertible Securities
It is the Fund’s policy to invest a portion of its assets in convertible securities. Although convertible securities do derive part of their value from the securities into which they are convertible, they are not considered derivative financial instruments. However, certain of the Fund’s investments in convertible securities include features which render them more sensitive to price changes in their underlying securities. The value of structured/synthetic convertible securities can be affected by interest rate changes and credit risks of the issuer. Such securities may be structured in ways that limit their potential for capital appreciation and the entire value of the security may be at risk of loss depending on the performance of the underlying equity security. Consequently, the Fund is exposed to greater downside risk than traditional convertible securities, but still less than that of the underlying stock.
2. Principal Risks
In the normal course of business, the Fund trades financial instruments and enters into financial transactions where risk of potential loss exists due to, among other things, changes in the market (market risk) or failure of the other party to a transaction to perform (counterparty risk). The Fund is also exposed to other risks such as, but not limited to, interest rate, foreign currency, credit and leverage risks.
Interest rate risk is the risk that fixed income securities will decline in value because of changes in interest rates. As nominal interest rates rise, the value of certain fixed income securities held by the Fund is likely to decrease. A nominal interest rate can be described as the sum of a real interest rate and an expected inflation rate. Fixed income securities with longer durations tend to be more sensitive to changes in interest rates, usually making them more volatile than securities with shorter durations. Duration is used primarily as a measure of the sensitivity of a fixed income security’s market price to interest rate (i.e. yield) movements.
The Fund is exposed to credit risk, which is the risk of losing money if the issuer or guarantor of a fixed income security is unable or unwilling, or is perceived (whether by market participants, rating agencies, pricing services or otherwise) as unable or unwilling, to make timely principal and/or interest payments, or to otherwise honor its obligations. Securities are subject to varying degrees of credit risk, which are often reflected in credit ratings.
To the extent the Fund invests directly in foreign currencies or in securities that trade in, and receive revenues in, foreign currencies, or in derivatives that provide exposure to foreign currencies, it will be subject to the risk that those currencies will decline in value relative to the U.S. dollar, or, in the case of hedging positions, that the U.S. dollar will decline in value relative to the currency being hedged. Currency rates in foreign countries may fluctuate significantly over short periods of time for a number of reasons, including economic growth, inflation, changes in interest rates, intervention (or the failure to intervene) by U.S. or foreign governments, central banks or supranational entities such as the International Monetary Fund, or by the imposition of currency controls or other political developments in the United States or abroad. As a result, the Fund’s investments in foreign currency-denominated securities may reduce the returns of the Fund.
The Fund is subject to elements of risk not typically associated with investments in the U.S., due to concentrated investments in foreign issuers located in a specific country or region. Such concentrations will subject the Fund to additional risks resulting from future political or economic conditions in such country or region and the possible imposition of adverse governmental laws or currency exchange restrictions affecting such country or region, which
2.28.13 | AllianzGI Global Equity & Convertible Income Fund Semi-Annual Report 31
AllianzGI Global Equity & Convertible Income Fund
Notes to Financial Statements
February 28, 2013 (unaudited)
2. Principal Risks (continued)
could cause the securities and their markets to be less liquid and prices more volatile than those of comparable U.S. companies.
The market values of securities may decline due to general market conditions ( market risk) which are not specifically related to a particular company, such as real or perceived adverse economic conditions, changes in the general outlook for corporate earnings, changes in interest or currency rates or adverse investor sentiment. They may also decline due to factors which affect a particular industry or industries, such as labor shortages or increased production costs and competitive conditions within an industry. Equity securities and equity-related investments generally have greater market price volatility than fixed income securities.
The Fund is exposed to counterparty risk, or the risk that an institution or other entity with which the Fund has unsettled or open transactions will default. The potential loss to the Fund could exceed the value of the financial assets recorded in the Fund’s financial statements. Financial assets, which potentially expose the Fund to counterparty risk, consist principally of cash due from counterparties and investments. The Fund’s Sub-Adviser seeks to minimize the Fund’s counterparty risk by performing reviews of each counterparty and by minimizing concentration of counterparty risk by undertaking transactions with multiple customers and counterparties on recognized and reputable exchanges. Delivery of securities sold is only made once the Fund has received payment. Payment is made on a purchase once the securities have been delivered by the counterparty. The trade will fail if either party fails to meet its obligation.
The counterparty risk associated with certain contracts may be reduced by master netting arrangements to the extent that if an event of default occurs, all amounts with the counterparty are terminated and settled on a net basis. The Fund’s overall exposure to counterparty risk with respect to transactions subject to master netting arrangements can change substantially within a short period, as it is affected by each transaction subject to the arrangement.
The Fund is exposed to risks associated with leverage. Leverage may cause the value of the Fund’s shares to be more volatile than if the Fund did not use leverage. This is because leverage tends to exaggerate the effect of any increase or decrease in the value of the Fund’s portfolio securities. The Fund may engage in transactions or purchase instruments that give rise to forms of leverage. In addition, to the extent the Fund employs leverage, dividend and interest costs may not be recovered by any appreciation of the securities purchased with the leverage proceeds and could exceed the Fund’s investment returns, resulting in greater losses.
The Fund holds synthetic convertible securities in escrow with a Lehman Brothers entity as counterparty at the time the relevant Lehman Brothers entity filed for bankruptcy protection or was placed in administration. These securities are valued using a discount on previous sale prices.
3. Financial Derivative Instruments
Disclosure about derivatives and hedging activities requires qualitative disclosure regarding objectives and strategies for using derivatives, quantitative disclosure about fair value amounts of gains and losses on derivatives, and disclosure about credit-risk related contingent features in derivative agreements. The disclosure requirements distinguish between derivatives which are accounted for as “hedges,” and those that do not qualify for such accounting. Although the Fund sometimes uses derivatives for hedging purposes, the Fund reflects derivatives at fair value and recognizes changes in fair value through the Fund’s Statement of Operations, and such derivatives do not qualify for hedge accounting treatment.
Option Transactions
The Fund writes (sells) call options on securities and indices to earn premiums, for hedging purposes, risk management purposes or otherwise as part of its investment strategies. When an option is written, the premium received is recorded as an asset with an equal liability which is subsequently marked to market to reflect the market value of the option written. These liabilities are reflected as call options written in the Fund’s Statement of Assets and Liabilities. Premiums received from writing options which expire unexercised are recorded on the expiration date as a realized gain. The difference between the premium received and the amount paid on effecting a closing purchase transaction, including brokerage commissions, is also treated as a realized gain, or if the premium is less than the amount paid for the closing purchase transactions, as a realized loss. If a call option written is exercised, the premium is added to the proceeds from the sale of the underlying security in determining whether there has been a realized gain or loss. If a put option written is exercised, the premium reduces the cost basis of the security. In writing an option, the Fund bears the market risk of an unfavorable change in the price of the security underlying the written option. Exercise of a written option could result in the Fund purchasing a security at a price different from its current market value.
32 AllianzGI Global Equity & Convertible Income Fund Semi-Annual Report | 2.28.13
AllianzGI Global Equity & Convertible Income Fund
Notes to Financial Statements
February 28, 2013 (unaudited)
4. Investment Manager/Sub-Adviser
The Fund has an Investment Management Agreement (the “Agreement”) with the Investment Manager. Subject to the supervision of the Fund’s Board of Trustees, the Investment Manager is responsible for managing, either directly or through others selected by it, the Fund’s investment activities, business affairs and administrative matters. Pursuant to the Agreement, the Investment Manager receives an annual fee, payable monthly, at the annual rate of 1.00% of the Fund’s average daily total managed assets. Total managed assets refer to the total assets of the Fund (including assets attributable to borrowings that may be outstanding) minus accrued liabilities (other than liabilities representing borrowings).
The Investment Manager has retained the Sub-Adviser to manage the Fund’s investments. Subject to the supervision of the Investment Manager, the Sub-Adviser is responsible for making all of the Fund’s investment decisions. The Investment Manager, and not the Fund, pays a portion of the fees it receives as Investment Manager to the Sub-Adviser in return for its services.
5. Investment in Securities
For the six months ended February 28, 2013, purchases and sales of investments, other than short-term securities, were $25,665,512 and $29,456,565, respectively.
6. Income Tax Information
At February 28, 2013, the cost basis of portfolio securities (before call options written) for federal income tax purposes was $155,971,385. Gross unrealized appreciation was $5,268,910; gross unrealized depreciation was $51,612,467; and net unrealized depreciation was $46,343,557. The difference between book and tax cost basis was attributable to wash sale loss deferrals.
7. Subsequent Events
In preparing these financial statements, Fund management has evaluated events and transactions for potential recognition or disclosure through the date the financial statements were issued. On March 8, 2013, a quarterly dividend of $0.30 per share was declared to shareholders, payable March 28, 2013 to shareholders of record on March 18, 2013.
There were no other subsequent events that require recognition or disclosure.
2.28.13 | AllianzGI Global Equity & Convertible Income Fund Semi-Annual Report 33
AllianzGI Global Equity & Convertible Income Fund Financial Highlights
For a share outstanding throughout each period:
|
|
|
|
| ||||||||||||||
|
| Six Months |
| Year ended August 31, |
| For the Period | ||||||||||||
|
| (unaudited) |
| 2012 |
| 2011 |
| 2010 |
| 2009 |
| 2008 | ||||||
Net asset value, beginning of period |
| $14.86 |
|
| $15.53 |
|
| $14.54 |
|
| $14.71 |
|
| $18.84 |
|
| $23.88 | ** |
Investment Operations: |
|
|
|
|
|
|
|
|
|
|
|
|
|
|
|
|
|
|
Net investment income |
| 0.12 |
|
| 0.31 |
|
| 0.31 |
|
| 0.27 |
|
| 0.44 |
|
| 0.65 |
|
Net realized and change in unrealized gain (loss) |
| 1.25 |
|
| 0.22 |
|
| 1.88 |
|
| 0.76 |
|
| (2.93 | ) |
| (3.72 | ) |
Total from investment operations |
| 1.37 |
|
| 0.53 |
|
| 2.19 |
|
| 1.03 |
|
| (2.49 | ) |
| (3.07 | ) |
Dividend and Distributions to Shareholders from: |
|
|
|
|
|
|
|
|
|
|
|
|
|
|
|
|
|
|
Net investment income |
| (0.60 | ) |
| (0.43 | ) |
| (0.27 | ) |
| (0.33 | ) |
| (0.55 | ) |
| (0.60 | ) |
Net realized gains |
| – |
|
| (0.53 | ) |
| (0.93 | ) |
| (0.69 | ) |
| (0.55 | ) |
| (1.32 | ) |
Return of capital |
| – |
|
| (0.24 | ) |
| – |
|
| (0.18 | ) |
| (0.54 | ) |
| – |
|
Total dividends and distributions to shareholders |
| (0.60 | ) |
| (1.20 | ) |
| (1.20 | ) |
| (1.20 | ) |
| (1.64 | ) |
| (1.92 | ) |
Common Share Transactions: |
|
|
|
|
|
|
|
|
|
|
|
|
|
|
|
|
|
|
Offering costs charged to paid-in capital in excess of par |
| – |
|
| – |
|
| – |
|
| – |
|
| – |
|
| (0.05 | ) |
Net asset value, end of period |
| $15.63 |
|
| $14.86 |
|
| $15.53 |
|
| $14.54 |
|
| $14.71 |
|
| $18.84 |
|
Market price, end of period |
| $14.06 |
|
| $13.30 |
|
| $14.75 |
|
| $14.10 |
|
| $12.99 |
|
| $18.10 |
|
Total Investment Return (1) |
| 10.37 | % |
| (1.62 | )% |
| 12.59 | % |
| 17.66 | % |
| (17.63 | )% |
| (20.67 | )% |
RATIOS/SUPPLEMENTAL DATA: |
|
|
|
|
|
|
|
|
|
|
|
|
|
|
|
|
|
|
Net assets, end of period (000s) |
| $109,733 |
|
| $104,346 |
|
| $108,744 |
|
| $101,845 |
|
| $103,052 |
|
| $131,941 |
|
Ratio of expenses to average net assets |
| 1.32 | %(2) |
| 1.29 | % |
| 1.29 | % |
| 1.30 | % |
| 1.39 | % |
| 1.23 | %(2) |
Ratio of net investment income to average net assets |
| 1.57 | %(2) |
| 2.08 | % |
| 1.86 | % |
| 1.74 | % |
| 3.45 | % |
| 3.31 | %(2) |
Portfolio turnover rate |
| 24 | % |
| 63 | % |
| 120 | % |
| 75 | % |
| 26 | % |
| 105 | % |
* |
| Commencement of operations. |
** |
| Initial public offering of $25.00 per share less underwriting discount of $1.125 per share. |
(1) |
| Total investment return is calculated assuming a purchase of a share at the market price on the first day and a sale of a share at the market price on the last day of each period reported. Income dividends, capital gain and return of capital distributions, if any, are assumed, for purposes of this calculation, to be reinvested at prices obtained under the Fund’s dividend reinvestment plan. Total investment return does not reflect brokerage commissions or sales charges in connection with the purchase or sale of Fund shares. Total investment return for a period of less than one year is not annualized. |
(2) |
| Annualized. |
| AllianzGI Global Equity & Convertible Income Fund
| | 2.28.13 | See accompanying Notes to Financial Statements.
|
AllianzGI Global Equity & Convertible Income Fund
Annual Shareholder Meeting Results/Proxy Voting Policies & Procedures (unaudited)
|
Annual Shareholder Meeting Results:
The Fund held its annual meeting of shareholders on December 19, 2012. Shareholders voted as indicated below:
|
|
|
| Withheld |
| ||
|
| Affirmative |
| Authority |
| ||
Re-election of Deborah A. DeCotis – Class II to serve until the Annual Meeting for the 2015-2016 fiscal year |
| 6,088,004 |
|
| 182,612 |
|
|
|
|
|
|
|
|
|
|
Re-election of John C. Maney† – Class II to serve until the Annual Meeting for the 2015-2016 fiscal year |
| 6,118,245 |
|
| 152,371 |
|
|
The other members of the Board of Trustees at the time of the meeting, namely Messrs. Bradford K. Gallagher, James A. Jacobson, Hans W. Kertess, William B. Ogden, IV and Allan Rappaport, continue to serve as Trustees of the Fund. |
† Interested Trustee
|
Proxy Voting Policies & Procedures:
A description of the policies and procedures that the Fund has adopted to determine how to vote proxies relating to portfolio securities and information about how the Fund voted proxies relating to portfolio securities held during the most recent twelve-month period ended June 30 is available (i) without charge, upon request, by calling the Fund’s shareholder servicing agent at (800) 254-5197; (ii) on the Fund’s website at www.us.allianzgi.com/closedendfunds; and (iii) on the Securities and Exchange Commission’s website at www.sec.gov. |
2.28.13 | AllianzGI Global Equity & Convertible Income Fund Semi-Annual Report 35
Trustees |
| Fund Officers |
Hans W. Kertess |
| Brian S. Shlissel |
Chairman of the Board of Trustees |
| President & Chief Executive Officer |
Deborah A. DeCotis |
| Lawrence G. Altadonna |
Bradford K. Gallagher |
| Treasurer, Principal Financial & Accounting Officer |
James A. Jacobson |
| Thomas J. Fuccillo |
John C. Maney |
| Vice President, Secretary & Chief Legal Officer |
William B. Ogden, IV |
| Scott Whisten |
Alan Rappaport |
| Assistant Treasurer |
|
| Richard J. Cochran |
|
| Assistant Treasurer |
|
| Orhan Dzemaili |
|
| Assistant Treasurer |
|
| Youse E. Guia |
|
| Chief Compliance Officer |
|
| Lagan Srivastava |
|
| Assistant Secretary |
Investment Manager
Allianz Global Investors Fund Management LLC
1633 Broadway
New York, NY 10019
Sub-Adviser
Allianz Global Investors U.S. LLC
600 West Broadway, 30th Floor
San Diego, CA 92101
Custodian & Accounting Agent
Brown Brothers Harriman & Co.
40 Water Street
Boston, MA 02109
Transfer Agent, Dividend Paying Agent and Registrar
American Stock Transfer & Trust Company, LLC
6201 15th Avenue
Brooklyn, NY 11219
Independent Registered Public Accounting Firm
PricewaterhouseCoopers LLP
300 Madison Avenue
New York, NY 10017
Legal Counsel
Ropes & Gray LLP
Prudential Tower
800 Boylston Street
Boston, MA 02199
This report, including the financial information herein, is transmitted to the shareholders of AllianzGI Global Equity & Convertible Income Fund for their information. It is not a prospectus, circular or representation intended for use in the purchase of shares of the Fund or any securities mentioned in this report.
The financial information included herein is taken from the records of the Fund without examination by an independent registered public accounting firm, who did not express an opinion herein.
Notice is hereby given in accordance with Section 23(c) of the Investment Company Act of 1940, as amended, that from time to time the Fund may purchase its common shares in the open market.
The Fund files its complete schedule of portfolio holdings with the Securities and Exchange Commission (“SEC”) for the first and third quarters of its fiscal year on Form N-Q. The Fund’s Form N-Q is available on the SEC’s website at www.sec.gov and may be reviewed and copied at the SEC’s Public Reference Room in Washington D.C. Information on the operation of the Public Reference Room may be obtained by calling (800) SEC-0330. The information on Form N-Q is also available on the Fund’s website at www.us.allianzgi.com/closedendfunds.
Information on the Fund is available at www.us.allianzgi.com/closedendfunds or by calling the Fund’s shareholder servicing agent at (800) 254-5197.

Receive this report electronically and eliminate paper mailings.
To enroll, go to www.us.allianzgi.com/edelivery.
AGI-2013-03-04-6042
Allianz Global Investors Distributors LLC | AZ605SA_022813 |
ITEM 2. CODE OF ETHICS
Not required in this filing.
ITEM 3. AUDIT COMMITTEE FINANCIAL EXPERT
Not required in this filing.
ITEM 4. PRINCIPAL ACCOUNTANT FEES AND SERVICES
Not required in this filing
ITEM 5. AUDIT COMMITTEE OF LISTED REGISTRANT
Not required in this filing
ITEM 6. INVESTMENTS
(a) The registrant’s Schedule of Investments is included as part of the report to shareholders filed under Item 1 of this form.
(b) Not applicable.
ITEM 7. DISCLOSURE OF PROXY VOTING POLICIES AND PROCEDURES FOR CLOSED-END MANAGEMENT INVESTMENT COMPANIES
Not required in this filing
ITEM 8. PORTFOLIO MANAGERS OF CLOSED-END MANAGEMENT INVESTMENT COMPANIES
Not required in this filing
ITEM 9. PURCHASES OF EQUITY SECURITIES BY CLOSED-END MANAGEMENT INVESTMENT COMPANY AND AFFILIATED COMPANIES
None
ITEM 10. SUBMISSION OF MATTERS TO A VOTE OF SECURITY HOLDERS
There have been no material changes to the procedures by which shareholders may recommend nominees to the Fund’s Board of Trustees since the Fund last provided disclosure in response to this item.
ITEM 11. CONTROLS AND PROCEDURES
(a) The registrant’s President and Chief Executive Officer and Treasurer, Principal Financial & Accounting Officer have concluded that the registrant’s disclosure controls and procedures (as defined in Rule 30a-3(c) under the Act (17 CFR 270.30a-3(c))) are effective based on their evaluation of these controls and procedures as of a date within 90 days of the filing date of this document.
(b) There were no significant changes in the registrant’s internal control over financial reporting (as defined in Rule 30a-3(d) under the Act (17 CFR 270.30a-3(d))) that occurred during the second fiscal quarter of the period covered by this report that has materially affected, or is reasonably likely to materially affect, the registrant’s internal control over financial reporting.
ITEM 12. EXHIBITS
(a) (1) Not required in this filing.
(a) (2) Exhibit 99.302 Cert. — Certification pursuant to Section 302 of the Sarbanes-Oxley Act of 2002
(a) (3) Not applicable
(b) Exhibit 99.906 Cert. — Certification pursuant to Section 906 of the Sarbanes-Oxley Act of 2002
Signatures
Pursuant to the requirements of the Securities Exchange Act of 1934 and the Investment Company Act of 1940, the registrant has duly caused this report to be signed on its behalf by the undersigned, thereunto duly authorized.
AllianzGI Global Equity & Convertible Income Fund |
| |
|
| |
By: | /s/ Brian S. Shlissel |
|
| Brian S. Shlissel |
|
| President & Chief Executive Officer |
|
|
| |
Date: May 1, 2013 |
| |
|
| |
By: | /s/ Lawrence G. Altadonna |
|
| Lawrence G. Altadonna |
|
| Treasurer, Principal Financial & Accounting Officer |
|
|
| |
Date: May 1, 2013 |
| |
Pursuant to the requirements of the Securities Exchange Act of 1934 and the Investment Company Act of 1940, this report has been signed below by the following persons on behalf of the registrant and in the capacities and on the dates indicated.
By: | /s/ Brian S. Shlissel |
|
| Brian S. Shlissel |
|
| President & Chief Executive Officer |
|
|
| |
Date: May 1, 2013 |
| |
|
| |
By: | /s/ Lawrence G. Altadonna |
|
| Lawrence G. Altadonna |
|
| Treasurer, Principal Financial & Accounting Officer |
|
|
| |
Date: May 1, 2013 |
| |