 August 4, 2015 Ticker (NYSE: G) Genpact Q2 2015 Earnings Presentation Exhibit 99.2 |
 DESIGN • TRANSFORM • RUN 2 © 2015 Copyright Genpact. All Rights Reserved. These materials contain certain statements concerning our future growth prospects and forward-looking statements, as defined in the safe harbor provisions of the U.S. Private Securities Litigation Reform Act of 1995. These statements are based on Genpact’s current expectations and beliefs, as well as a number of assumptions concerning future events. These statements involve a number of risks, uncertainties and other factors that could cause actual results to differ materially from those in such forward-looking statements. These risks and uncertainties include but are not limited to a slowdown in the economies and sectors in which our clients operate, a slowdown in the BPO and IT Services sectors, the risks and uncertainties arising from our past and future acquisitions, our ability to convert bookings to revenues, our ability to manage growth, factors which may impact our cost advantage, wage increases, our ability to attract and retain skilled professionals, risks and uncertainties regarding fluctuations in our earnings, dependence on tax legislation, general economic conditions affecting our industry as well as other risks detailed in our reports filed with the U.S. Securities and Exchange Commission (the “SEC”), including the Company's Annual Report on Form 10-K. These filings are available at www.sec.gov or on the investor relations section of our website, www.genpact.com. Genpact may from time to time make additional written and oral forward-looking statements, including statements contained in our filings with the SEC. The Company undertakes no obligation to update any forward- looking statements that may be made from time to time by or on behalf of the Company. These materials also include measures defined by the SEC as non-GAAP financial measures. Genpact believes that these non- GAAP measures can provide useful supplemental information to investors regarding financial and business trends relating to its financial condition and results of operations when read in conjunction with the Company’s reported results. Reconciliations of these non-GAAP measures from GAAP are available in this presentation and in our earnings release dated August 4, 2015. Forward-Looking Statements Non-GAAP Financial Measures |
 DESIGN • TRANSFORM • RUN 3 © 2015 Copyright Genpact. All Rights Reserved. Q2 2015 – Key Financial Highlights Solid quarter driven by continued strength in Global Client BPO revenue Q2 ‘15 versus Q2 ‘14 performance: Total Revenue: +9% Revenue from Global Clients: +12% GE Revenue: -4% Q2 2015 Adjusted Income from Operations grew 15%, with a margin (1) of 16.5%, driven by operating efficiencies, favorable foreign exchange rates and certain non-recurring benefits Global Client growth was broad-based across most of our target verticals – including Banking and Financial Services, Insurance, Life Sciences, High Tech and CPG From a service line perspective, Finance & Accounting, our Core Vertical Operations, Analytics and Consulting Services all contributed to growth Notes: 1. Adjusted income from operations is a non-GAAP measure. Q2 ‘15 GAAP income from operations margin was 14.7%. |
 DESIGN • TRANSFORM • RUN 4 © 2015 Copyright Genpact. All Rights Reserved. New Digital Technologies Combined With Our Lean Six Sigma and Domain Strength Positions Us Well To Partner With Our Clients Big trends impacting the way companies run their businesses Clients are looking for partners that can help them navigate through transformative journeys Big trends and companies’ need to transform, represent a tremendous opportunity for Genpact Recent investment activity has added depth to our digital capabilities and strengthened our value proposition |
 DESIGN • TRANSFORM • RUN 5 © 2015 Copyright Genpact. All Rights Reserved. Continued Momentum On Large Deal Wins And Healthy Pipeline Continued momentum in converting and winning big deals; signed two large transformational engagements in the second quarter, bringing the total to 10 over the last 18 months Pipeline continues to be healthy across our key target industry verticals, service lines and geographies Win rates continue to hold at very good levels with improving sales force productivity |
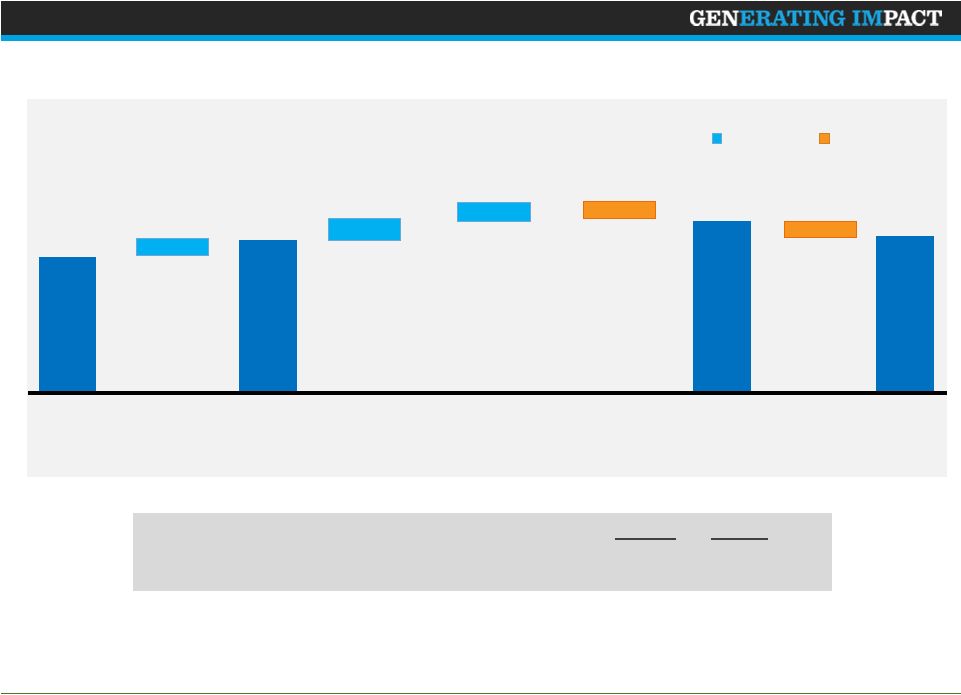
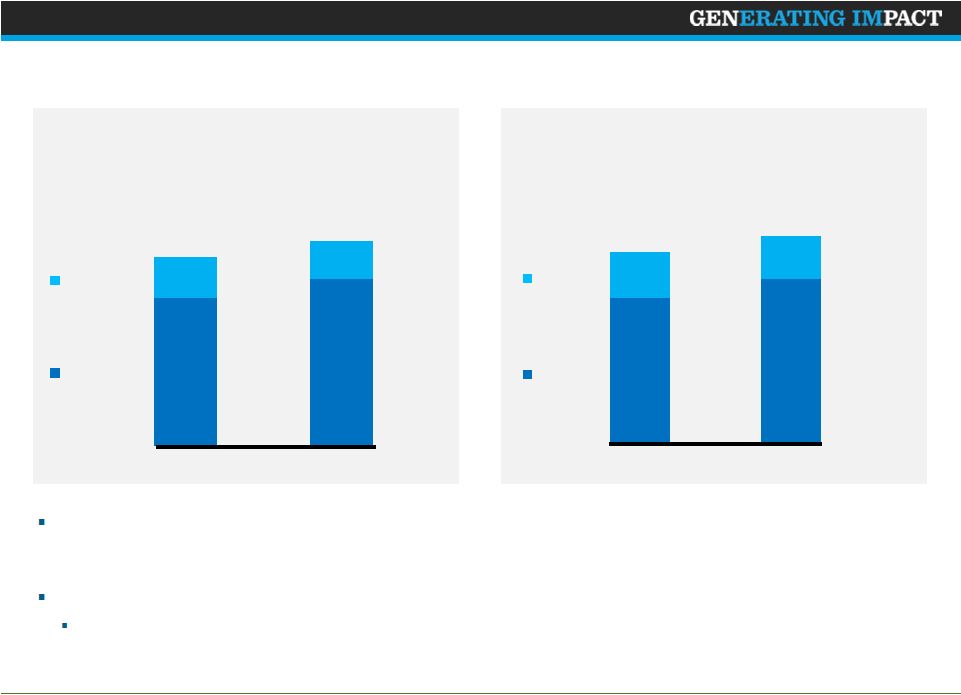 DESIGN • TRANSFORM • RUN 6 © 2015 Copyright Genpact. All Rights Reserved. 424.8 481.2 136.8 128.3 441.8 495.0 119.8 114.5 Q2 2015 Revenue Summary Total growth on a constant currency basis was 11%; excluding Pharmalink, total revenue growth was 7%, or 10% on a constant currency basis Q2 2015 Global Clients BPO revenues increased 18% and ITO revenues declined 5% Global Clients GE BPO ITO 9% YoY Growth% 12% (4%) 9% (6%) 13% YoY Growth% Q2 ‘14 Q2 ‘15 Q2 ‘14 Q2 ‘15 ($ in millions) ($ in millions) $561.6 $609.5 $609.5 $561.6 |
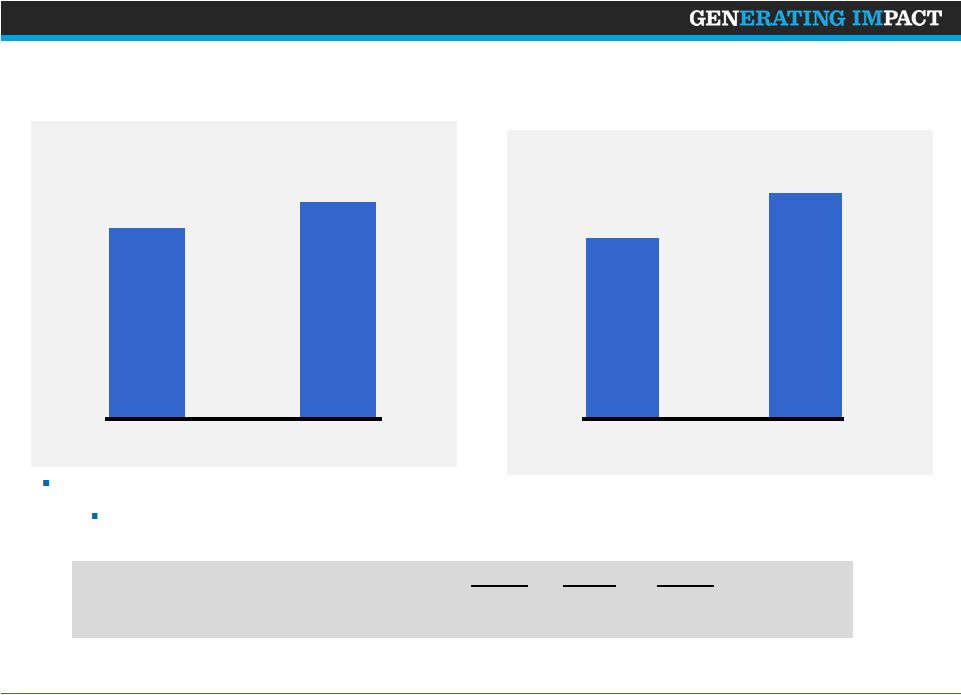
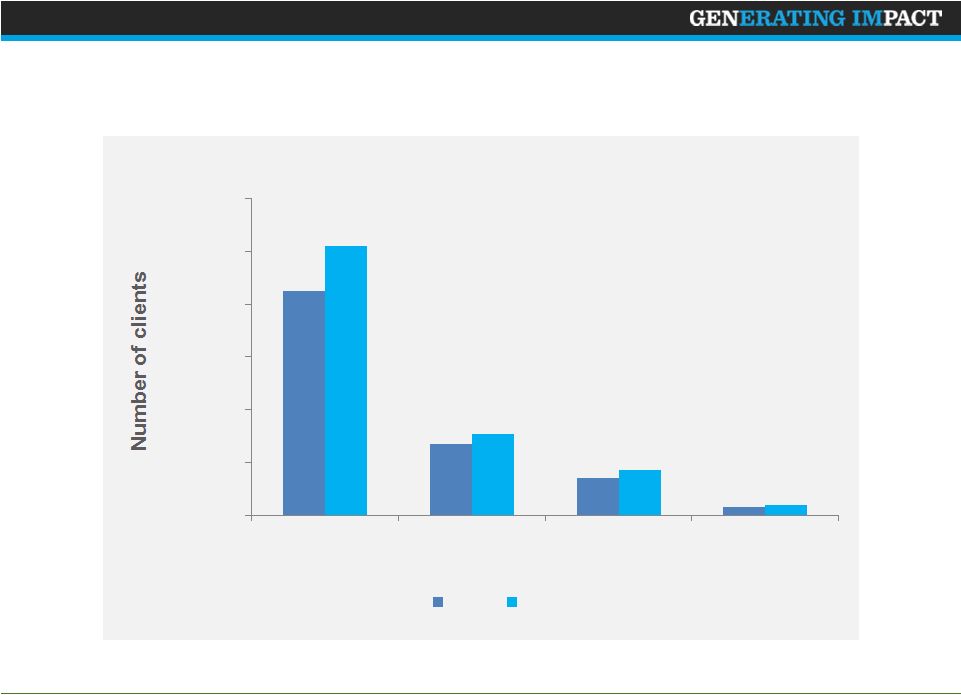 DESIGN • TRANSFORM • RUN 7 © 2015 Copyright Genpact. All Rights Reserved. Continue to Expand Client Relationships Notes: 1. Relationship size = annual revenues based on last four rolling quarters Relationship Size (1) 85 27 14 3 102 31 17 4 0 20 40 60 80 100 120 > $5 MM > $15 MM >$25 MM >$50 MM Q2 14 Q2 15 |
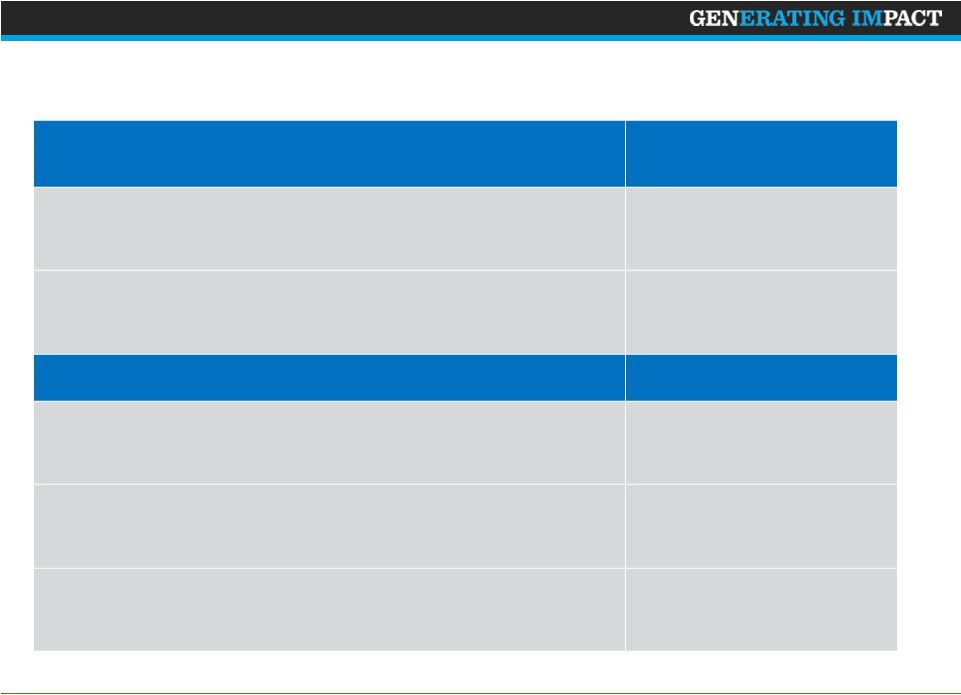
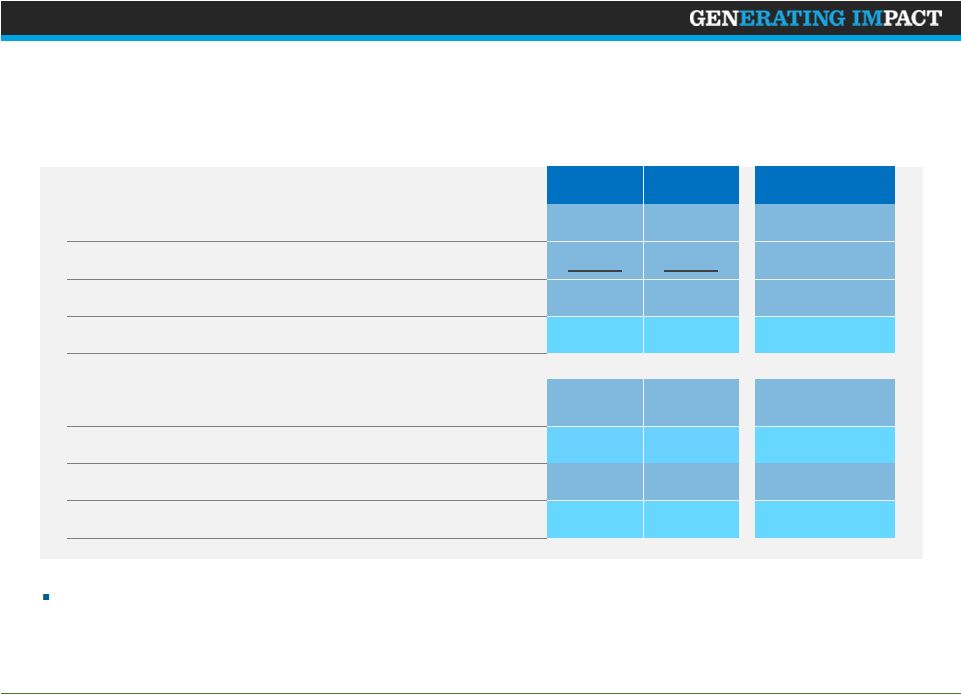 DESIGN • TRANSFORM • RUN 8 © 2015 Copyright Genpact. All Rights Reserved. Q2 reflects investments in capabilities more than offset by lower G&A expenses driven by productivity and FX gains Q2‘14 Q2’15 YoY Revenue 561.6 609.5 8.5% Cost of Revenue 340.1 366.3 7.7% Gross Profit 221.5 243.2 9.8% Gross Profit % of Revenue 39.4% 39.9% 50 bps SG&A 142.7 149.2 4.6% SG&A % of Revenue 25.4% 24.5% -90 bps Adjusted Income from Operations 87.6 100.6 14.9% Adjusted Income from Operations Margin 15.6% 16.5% 90 bps ($ millions) Notes: 1. Adjusted income from operations is a non-GAAP measure. Income from operations was $73.1 million in Q2 ‘14 and $89.4 million in Q2 ’15. Gross profit margin increase was driven by operating efficiencies and favorable foreign exchange rates. (1) |
 DESIGN • TRANSFORM • RUN 9 © 2015 Copyright Genpact. All Rights Reserved. EPS Year-over-Year Bridge Q2 ‘14 Q2 ‘15 Adjusted Net Income ($ millions) 59.4 71.7 Diluted Shares Outstanding (millions) (2) 221.5 221.0 22 5 FX Re-measurement Gains Q2 ‘14 GAAP EPS 28 (Cents per share) Net Adjustments (1) 27 5 Net Adjustments (1) Q2 ‘14 Adjusted EPS Q2 ‘15 Adjusted EPS Q2 ‘15 GAAP EPS Higher Adjusted Income from Operations -4 Increase Decrease Notes: 1. Adjustments primarily include amortization of acquired intangible assets, stock-based compensation expenses and acquisition-related expenses. 2. Weighted average number of diluted shares outstanding; diluted shares outstanding includes the impact of 3.6 million shares repurchased through June 30, 2015. - The above bridge reflects only significant variance items year over year and is illustrative and subject to rounding. - EPS = Diluted earnings per share 32 4 Higher Financing Costs (Debt Refinance write-off) -3 |
 PROCESS • ANALYTICS • TECHNOLOGY 10 93 115 79 90 Cash From Operations Q2 2015 cash from operations up $11 MM Cash from operations driven by higher revenue and improved operating margin. Q2 ‘14 Q2 ‘15 15% Notes: 1) Cash and Liquid Assets = Cash and cash equivalents and short-term deposits 23% YTD ‘14 YTD ‘15 YoY Growth% YoY Growth% ($ in millions) ($ in millions) Q2 ’14 Q1’15 Q2 ‘15 Days Sales Outstanding 84 81 82 Cash and Liquid Assets ($ millions) (1) 377 434 442 |
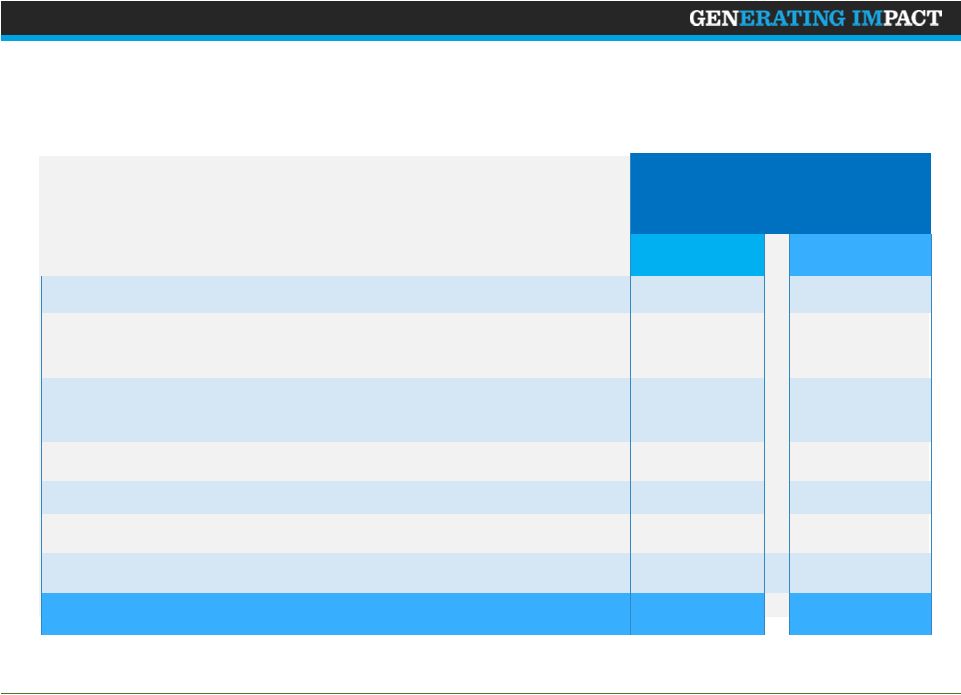
 DESIGN • TRANSFORM • RUN 11 © 2015 Copyright Genpact. All Rights Reserved. Full Year 2015 Outlook Revenues ($B) FY 2015 Adjusted Income from Operations - Margin ~15.0 - 15.2% 2.46 - 2.50 Other Metrics Cash Flow From Operations Effective Tax Rate 5% - 10% > 2014 22 - 23% Capital Expenditure (% of revenue) ~3.0% |
 DESIGN • TRANSFORM • RUN 12 © 2015 Copyright Genpact. All Rights Reserved. Annexure 1: Reconciliation of Adjusted Income From Operations – Q2 2015 (USD, in thousands) 2014 2015 Income from operations per GAAP $ 73,051 $ 89,353 Add: Stock-based compensation 6,906 6,654 Add: Amortization of acquired intangible assets 5,010 6,120 Add: Acquisition-related expenses 1,977 - Add/Less: Other income (expense), net excluding net interest 517 811 Add/Less: Gain (loss) on equity-method investment activity, net 34 (2,340) Add/Less: Net loss (income) attributable to noncontrolling interest 84 - Adjusted income from operations $ 87,579 $ 100,598 Quarter ended June 30, |
 DESIGN • TRANSFORM • RUN 13 © 2015 Copyright Genpact. All Rights Reserved. Annexure 2: Reconciliation of Adjusted Net Income – Q2 2015 (USD, in thousands, except per share data) Quarter ended June 30, 2014 2015 Net income attributable to Genpact Limited shareholders per GAAP $ 48,984 $ 62,701 Add: Stock-based compensation 6,906 6,654 Add: Amortization of acquired intangible assets 5,010 6,120 Add: Acquisition-related expenses 1,977 - Less: Tax impact on stock-based compensation (1,751) (1,864) Less: Tax impact on amortization of acquired intangibles (1,631) (1,909) Less: Tax impact on acquisition-related expenses (53) - Adjusted net income $ 59,442 $ 71,702 Adjusted diluted earnings per share $ 0.27 $ 0.32 |
 Thank You |