October 9, 2012
BY HAND AND EDGAR
Duc Dang
Securities and Exchange Commission
Division of Corporate Finance
100 F Street, N.E.
Washington, DC 20549-7010
| Re: | Realogy Holdings Corp. |
| Registration Statement on Form S-1 |
| File No. 333-181988 |
Dear Mr. Dang:
On behalf of Realogy Holdings Corp., formerly known as Domus Holdings Corp. (the “Company”), enclosed please find attachments that were provided to the staff of the Commission (the “Staff”) in connection with (i) comment number 6 of the Staff set forth in the Staff’s letter to the Company dated as of September 5, 2012 and (ii) comment number 10 of the Staff set forth in the Staff’s letter to the Company dated as of September 17, 2012.
Please telephone the undersigned at (212) 735-3497 if you have any questions or require any additional information.
Very truly yours,
/s/ Stacy J. Kanter
Stacy J. Kanter
Realogy - RFG Reporting Unit
Impairment Analysis – 2008
(In millions)
As Reported | ||||
Goodwill: | ||||
Original RFG Goodwill at Acquisition plus $4 other acquisitions in 2007 | $ | 2,265 | ||
Fair Value of Goodwill per 2008 “Step 2” valuation report | 1,556 | |||
|
| |||
Cumulative Impairment to Goodwill at December 31, 2008 | (709 | ) | ||
Intangible Assets: | ||||
Franchise Agreement with NRT at Acquisition | 1,671 | |||
Fair Value of Franchise Agreement per 2008 “Step 2” valuation report | 1,145 | |||
|
| |||
Cumulative Impairment to Franchise Agreement at December 31, 2008 | (526 | ) | ||
|
| |||
Cumulative Impairment on a Combined Basis | $ | (1,235 | ) | |
|
| |||
Pro Forma - If NRT Franchise Agreement with RFG had been recorded as Goodwill | ||||
Original RFG Goodwill at Acquisition plus $4 other acquisitions in 2007 | $ | 2,265 | ||
Franchise Agreement with NRT at Acquisition | 1,671 | |||
|
| |||
Combined Goodwill | 3,936 | |||
Fair Value of Goodwill per 2008 “Step 2” valuation report | 1,556 | |||
Fair Value of Franchise Agreement per 2008 “Step 2” valuation report | 1,145 | |||
|
| |||
Fair Value of Combined Goodwill | 2,701 | |||
|
| |||
Cumulative Impairment on a Combined Basis | $ | (1,235 | ) | |
|
| |||
Difference in Cumulative Impairment on a Combined Basis | $ | — | ||
|
| |||
Realogy Corporation
CALCULATIONS RELATED TO THE ASC 350 REVIEW FOR REALOGY CORPORATION SUMMARY OF STEP 1 CONCLUSION
(Amounts in millions)
As of October 1, 2011
| Fair Value of Reporting Unit | Carrying Value of Reporting Unit | Difference | Implied Impairment (Y/N) | |||||||||||||
RFG | $ | 4,498 | $ | 3,041 | $ | 1,457 | NO | |||||||||
NRT | 2,050 | 958 | 1,092 | NO | ||||||||||||
Cartus | 1,098 | 529 | 569 | NO | ||||||||||||
TRG | 328 | 177 | 151 | NO | ||||||||||||
|
|
|
| |||||||||||||
Total Reporting Units | $ | 7,974 | $ | 4,705 | ||||||||||||
As of October 1, 2010
| Fair Value of Reporting Unit | Carrying Value of Reporting Unit | Difference | Implied Impairment (Y/N) | |||||||||||||
RFG | $ | 4,941 | $ | 3,192 | $ | 1,749 | NO | |||||||||
NRT | 2,310 | 929 | 1,381 | NO | ||||||||||||
Cartus | 1,288 | 540 | 748 | NO | ||||||||||||
TRG | 408 | 189 | 219 | NO | ||||||||||||
|
|
|
| |||||||||||||
Total Reporting Units | $ | 8,947 | $ | 4,850 | ||||||||||||
As of October 1, 2009
| Fair Value of Reporting Unit | Carrying Value of Reporting Unit | Difference | Implied Impairment (Y/N) | |||||||||||||
RFG | $ | 4,498 | $ | 3,347 | $ | 1,151 | NO | |||||||||
NRT | 1,956 | 882 | 1,074 | NO | ||||||||||||
Cartus | 806 | 445 | 361 | NO | ||||||||||||
TRG | 418 | 167 | 250 | NO | ||||||||||||
|
|
|
| |||||||||||||
Total Reporting Units | $ | 7,678 | $ | 4,842 | ||||||||||||
Realogy Corporation
CALCULATIONS RELATED TO THE SFAS 142 REVIEW FOR RFC
As of October 1, 2008
SUMMARY OF STEP 2 CONCLUSION
(Amounts in millions)
DETERMINATION OF IMPAIRMENT | As Reported | Pro Forma As Adjusted | ||||||
Total Fair Value of Reporting Unit | $ | 3,097 | $ | 3,097 | ||||
Add: Other Liabilities | 1,716 | 1,716 | ||||||
Less: Other Assets | 174 | 174 | ||||||
Less: Fair Value of Identified Intangible Assets (excluding RFG Franchise Agreement with NRT) | 1,938 | 1,938 | ||||||
Less: Fair Value of RFG Franchise Agreement with NRT | 1,145 | — | ||||||
|
|
|
| |||||
Fair Value of Goodwill | 1,556 | 2,701 | ||||||
Goodwill Balance | 2,265 | 3,936 | * | |||||
|
|
|
| |||||
Goodwill Impairment | $ | 709 | $ | 1,235 | ||||
|
|
|
| |||||
| * | Pro Forma As Adjusted Goodwill includes the acquisition value of the RFG Franchise Agreement with NRT of $1,671 million. |
RFG FRANCHISE AGREEMENT WITH NRT | ||||
RFG Franchise Agreement with NRT at Acquisition | $ | 1,671 | ||
Fair Value of RFG Franchise Agreement with NRT | 1,145 | |||
|
| |||
Impairment to NRT Franchise Agreement | 526 | |||
|
| |||
Total Impairment of Goodwill and RFG Franchise Agreement with NRT | $ | 1,235 | ||
|
| |||
CAPITALIZATION
The following table sets forth our cash and cash equivalents and capitalization as of June 30, 2012:
| • | on an actual basis; |
| • | on a pro forma basis giving effect to the conversion of approximately $1.903 billion aggregate principal amount of Convertible Notes by the Significant Holders into 73,006,178 shares of common stock substantially concurrently with the closing of this offering; and |
| • | on a pro forma as adjusted basis giving effect to (i) our sale of 40,000,000 shares of common stock in this offering at an assumed initial public offering price of $25.00 per share, which is the midpoint of the offering price range set forth on the cover page of this prospectus, and our expected use of the net proceeds of this offering as described in “Use of Proceeds” and (ii) the issuance of 9,125,776 shares of common stock to the Significant Holders pursuant to the Significant Holders letter agreements described under “Prospectus Summary—Letter Agreements with Holders of Convertible Notes.” |
To the extent that any Convertible Notes not owned by the Significant Holders are converted into common stock, the portion of the net proceeds of this offering that would have been used to pay the redemption price for such Convertible Notes will instead be applied to the repayment of our other indebtedness.
You should read this table in conjunction with the information included under the headings “Unaudited Pro Forma Financial Information,” “Selected Historical Consolidated and Combined Financial Statements,” “Use of Proceeds,” “Management’s Discussion and Analysis of Financial Condition and Results of Operations” and our financial statements and notes thereto included elsewhere in this prospectus.
| As of June 30, 2012 | ||||||||||||
| Capitalization (excluding securitization obligations) | Actual | Pro Forma | Pro Forma As Adjusted | |||||||||
| (In millions) | ||||||||||||
Cash and cash equivalents(1) | $ | 138 | $ | 138 | $ | 49 | ||||||
|
|
|
|
|
| |||||||
Long-term debt (including current portion): | ||||||||||||
Senior Secured Credit Facility: | ||||||||||||
Extended revolving credit facility(2) | 109 | 109 | 201 | |||||||||
Extended term loan facility(3) | 1,822 | 1,822 | 1,822 | |||||||||
7.625% First Lien Notes due 2020 | 593 | 593 | 593 | |||||||||
7.875% First and a Half Lien Notes due 2019 | 700 | 700 | 700 | |||||||||
9.000% First and a Half Lien Notes due 2020 | 325 | 325 | 325 | |||||||||
Second Lien Loans(4) | 650 | 650 | — | |||||||||
Other bank indebtedness(5) | 105 | 105 | 105 | |||||||||
10.50% Senior Notes due 2014 | 64 | 64 | — | |||||||||
11.00/11.75% Senior Toggle Notes due 2014 | 41 | 41 | — | |||||||||
12.375% Senior Subordinated Notes due 2015(6) | 188 | 188 | 188 | |||||||||
11.50% Senior Notes due 2017(7) | 489 | 489 | 489 | |||||||||
12.00% Senior Notes due 2017(8) | 129 | 129 | 129 | |||||||||
13.375% Senior Subordinated Notes due 2018 | 10 | 10 | 10 | |||||||||
11.00% Convertible Notes due 2018(9) | 2,110 | 207 | — | |||||||||
|
|
|
|
|
| |||||||
Total long-term debt (including current portion) | 7,335 | 5,432 | 4,562 | |||||||||
|
|
|
|
|
| |||||||
Equity: | ||||||||||||
Common stock; 178,000,000 authorized shares; 8,021,276 shares issued and outstanding (actual); 81,027,454 shares issued and outstanding (pro forma); 130,153,230 shares issued and outstanding (pro forma as adjusted) | — | 1 | 1 | |||||||||
Additional paid-in capital(10) | 2,035 | 3,937 | 5,136 | |||||||||
Accumulated deficit(11) | (3,728 | ) | (3,734 | ) | (4,078 | ) | ||||||
Accumulated other comprehensive income (loss) | (30 | ) | (30 | ) | (30 | ) | ||||||
Noncontrolling interests | 2 | 2 | 2 | |||||||||
|
|
|
|
|
| |||||||
Total equity (deficit) | (1,721 | ) | 176 | 1,031 | ||||||||
|
|
|
|
|
| |||||||
Total capitalization(12) | $ | 5,614 | $ | 5,608 | $ | 5,593 | ||||||
|
|
|
|
|
| |||||||
55
| (1) | Readily available cash as of June 30, 2012 was $89 million. Readily available cash includes cash and cash equivalents less statutory cash required for our title business. Pro forma as adjusted cash and cash equivalents reflects (i) the payment of interest of approximately $59 million, representing the interest on indebtedness that will be repaid as described in “Use of Proceeds,” and (ii) the cash payment of approximately $105 million pursuant to the Significant Holders letter agreements as described in “Use of Proceeds.” The amount of such payment is equal to the interest that the Significant Holders would have otherwise been entitled to receive with respect to the Convertible Notes held by them if they held such Convertible Notes through October 15, 2012, the next regularly scheduled interest payment date. The Significant Holders will not receive the interest payment to be paid on the Convertible Notes on October 15, 2012. See footnote 2 of the Notes to Unaudited Pro Forma Financial Information under the heading “Unaudited Pro Forma Financial Information.” |
| (2) | Interest rates with respect to revolving loans under the senior secured credit facility are based on, at our option, (a) adjusted LIBOR plus 3.25% or (b) JPMorgan Chase Bank, N.A.’s prime rate (“ABR”) plus 2.25% in each case subject to reductions based on the attainment of certain leverage ratios. The available capacity under this facility was reduced by $89 million of outstanding letters of credit as of June 30, 2012. On September 17, 2012, the Company had $ 60 million outstanding on the extended revolving credit facility and $ 95 million of outstanding letters of credit, leaving$ 208 million of available capacity. |
| (3) | Interest rates with respect to term loans under the senior secured credit facility are based on, at our option, (a) adjusted LIBOR plus 4.25% or (b) the higher of the Federal Funds Effective Rate plus 1.75% and JPMorgan Chase Bank, N.A.’s prime rate plus 3.25%. |
| (4) | The Second Lien Loans accrue interest at a rate of 13.50% per annum. |
| (5) | Consists of revolving credit facilities that are supported by letters of credit issued under the senior secured credit facility, a portion of which are issued under the synthetic letter of credit facility; $50 million is due in January 2013, $50 million is due in July 2013, and $5 million is due in August 2013. |
| (6) | Consists of $190 million of 12.375% Senior Subordinated Notes, less a discount of $2 million. |
| (7) | Consists of $492 million of 11.50% Senior Notes, less a discount of $3 million. |
| (8) | Consists of $130 million of 12.00% Senior Notes, less a discount of $1 million. |
| (9) | The Significant Holders have agreed to convert all of their Convertible Notes into common stock substantially concurrently with the closing of this offering, representing in the aggregate approximately $1.903 billion principal amount of outstanding Convertible Notes. |
| (10) | Pro forma additional paid-in capital reflects the conversion of approximately $1.903 billion of our Convertible Notes by the Significant Holders. |
Pro forma as adjusted additional paid-in capital includes the impact of the following transactions: (i) the net proceeds from this offering of approximately $946 million; (ii) the fair value of the shares of common stock issued to the Significant Holders pursuant to the Significant Holders letter agreements of $228 million; and (iii) the $25 million portion of the Management Agreement Termination Fee to be paid in shares of our common stock on January 15, 2013.
| (11) | Pro forma accumulated deficit reflects a $6 million loss on the extinguishment of debt, related to the write-off of deferred financing costs due to the conversion of the Convertible Notes held by the Significant Holders. |
Pro forma as adjusted accumulated deficit includes the impact of (i) the expense of $ 228 million, which represents the fair value of the shares of common stock issued to the Significant Holders pursuant to the Significant Holders letter agreements ; (ii) $105 million of expense related to the cash payment to be made pursuant to the Significant Holders letter agreements as described in “Use of Proceeds”; (iii) interest expense of $59 million, which represents the interest payable from April 15, 2012 through the anticipated prepayment date on the indebtedness that will be repaid as described in “Use of Proceeds”; (i v) $40 million of expense to be recognized related to the Management Agreement Termination Fee payment to be paid $15 million in cash and $25 million in shares of our common stock on January 15, 2013; (v) $7 million of prepayment fees associated with the prepayment of our indebtedness; (vi) a $4 million loss on the extinguishment of debt, related to the write-off of deferred financing costs on other indebtedness; offset by
56
(a) a $21 million gain related to the $207 million of Convertible Notes redeemed by the Company at 90 % of the principal amount thereof, (b) a $44 million reduction of accrued interest recorded on the Convertible Notes held by the Significant Holders which will not be paid as a result of the cash payment made pursuant to the Significant Holders letter agreements, (c) a $26 million reduction in accrued interest recorded as of June 30, 2012 which is included in the interest expense of $59 million reflected above and (d) an $8 million reduction in the amount accrued related to the management fee agreement.
| (12) | Total capitalization excludes our securitization obligations which are collateralized by relocation related assets and appear in our current liabilities |
57
UNAUDITED PRO FORMA FINANCIAL INFORMATION
We derived the unaudited pro forma financial data set forth below by the application of pro forma adjustments to the audited and unaudited consolidated financial statements included elsewhere in this prospectus.
The unaudited pro forma condensed consolidated balance sheet at June 30, 2012 and pro forma consolidated statement of operations for the year ended December 31, 2011 and the pro forma condensed consolidated statement of operations for the six months ended June 30, 2012 have been presented:
| • | on a pro forma basis which gives effect to the conversion of approximately $1.903 billion aggregate principal amount of the Convertible Notes by the Significant Holders into 73,006,178 shares of common stock substantially concurrently with the closing of this offering; and |
| • | on a pro forma as adjusted basis, which gives effect to (i) our sale of 40,000,000 shares of common stock in this offering at an initial public offering price of $ 25.00 per share, which is the midpoint of the offering price range set forth on the cover page of this prospectus, and our expected use of the net proceeds of this offering as described in “Use of Proceeds” and (ii) the issuance of 9,125,776 shares of common stock to the Significant Holders pursuant to the Significant Holders letter agreements described under “Prospectus Summary—Letter Agreements with Holders of Convertible Notes.” |
The pro forma condensed consolidated balance sheet gives effect to the pro forma adjustments as if they occurred on June 30, 2012 and the pro forma consolidated statement of operations gives effect to the pro forma adjustments as if they occurred on January 1, 2011. In addition, the pro forma condensed consolidated balance sheet at June 30, 2012 has also been presented on a pro forma basis and on a pro forma as adjusted basis giving further effect to the conversion of all of the approximately $207 million aggregate principal amount of the Convertible Notes not held by the Significant Holders. See footnotes 7-9 of the Notes to Unaudited Pro Forma Financial Information.
The pro forma adjustments set forth below were based on available information and certain assumptions made by our management and may be revised as additional information becomes available. The unaudited pro forma financial information is presented for informational purposes only, and does not purport to represent what our balance sheet and results of operations would actually have been if the transactions had occurred on the dates indicated, nor does it purport to project our results of operations or financial condition that we may achieve in the future.
You should read our unaudited pro forma financial information and the accompanying notes in conjunction with all of the historical financial statements and related notes included elsewhere in this prospectus and the financial and other information appearing elsewhere in this prospectus, including information contained in “Risk Factors,” “Selected Historical Consolidated Financial Data,” “Use of Proceeds,” “Capitalization” and “Management’s Discussion and Analysis of Financial Condition and Results of Operations.”
61
REALOGY HOLDINGS CORP.
PRO FORMA CONDENSED CONSOLIDATED BALANCE SHEET
June 30, 2012
(In millions)
| Actual | Convertible Notes Pro Forma Adjustments(1) | Pro Forma | Offering Transaction Adjustments(2) | Pro Forma As Adjusted | ||||||||||||||||
ASSETS | ||||||||||||||||||||
Current assets: | ||||||||||||||||||||
Cash and cash equivalents | $ | 138 | $ | — | $ | 138 | $ | (89 | ) | $ | 49 | |||||||||
Trade receivables | 147 | — | 147 | — | 147 | |||||||||||||||
Relocation receivables | 419 | — | 419 | — | 419 | |||||||||||||||
Relocation properties held for sale | 10 | — | 10 | — | 10 | |||||||||||||||
Deferred income taxes | 59 | — | 59 | — | 59 | |||||||||||||||
Other current assets | 97 | — | 97 | — | 97 | |||||||||||||||
|
|
|
|
|
|
|
|
|
| |||||||||||
Total current assets | 870 | — | 870 | (89 | ) | 781 | ||||||||||||||
Property and equipment, net | 151 | — | 151 | — | 151 | |||||||||||||||
Goodwill | 2,618 | — | 2,618 | — | 2,618 | |||||||||||||||
Trademarks | 732 | — | 732 | — | 732 | |||||||||||||||
Franchise agreements, net | 2,808 | — | 2,808 | — | 2,808 | |||||||||||||||
Other intangibles, net | 418 | — | 418 | — | 418 | |||||||||||||||
Other non-current assets | 225 | (6 | ) | 219 | (4 | ) | 215 | |||||||||||||
|
|
|
|
|
|
|
|
|
| |||||||||||
Total assets | $ | 7,822 | $ | (6 | ) | $ | 7,816 | $ | (93 | ) | $ | 7,723 | ||||||||
|
|
|
|
|
|
|
|
|
| |||||||||||
LIABILITIES AND EQUITY (DEFICIT) | ||||||||||||||||||||
Current liabilities: | ||||||||||||||||||||
Accounts payable | $ | 214 | $ | — | $ | 214 | $ | — | $ | 214 | ||||||||||
Securitization obligations | 267 | — | 267 | — | 267 | |||||||||||||||
Due to former parent | 76 | — | 76 | — | 76 | |||||||||||||||
Revolving credit facilities and current portion of long-term debt | 214 | — | 214 | 92 | 306 | |||||||||||||||
Accrued expenses and other current liabilities | 583 | — | 583 | (78 | ) | 505 | ||||||||||||||
|
|
|
|
|
|
|
|
|
| |||||||||||
Total current liabilities | 1,354 | — | 1,354 | 14 | 1,368 | |||||||||||||||
Long-term debt | 7,121 | (1,903 | ) | 5,218 | (962 | ) | 4,256 | |||||||||||||
Deferred income taxes | 895 | — | 895 | — | 895 | |||||||||||||||
Other non-current liabilities | 173 | — | 173 | — | 173 | |||||||||||||||
|
|
|
|
|
|
|
|
|
| |||||||||||
Total liabilities | 9,543 | (1,903 | ) | 7,640 | (948 | ) | 6,692 | |||||||||||||
|
|
|
|
|
|
|
|
|
| |||||||||||
Total equity (deficit) | (1,721 | ) | 1,897 | 176 | 855 | 1,031 | ||||||||||||||
|
|
|
|
|
|
|
|
|
| |||||||||||
Total liabilities and equity (deficit) | $ | 7,822 | $ | (6 | ) | $ | 7,816 | $ | (93 | ) | $ | 7,723 | ||||||||
|
|
|
|
|
|
|
|
|
| |||||||||||
See Notes to Unaudited Pro Forma Financial Information.
62
REALOGY HOLDINGS CORP.
PRO FORMA CONSOLIDATED STATEMENT OF OPERATIONS
YEAR ENDED DECEMBER 31, 2011
(In millions, except per share data)
| Actual | Convertible Notes Pro Forma Adjustments(3) | Pro Forma | Offering Transaction Adjustments(4) | Pro Forma As Adjusted | ||||||||||||||||
Revenues | ||||||||||||||||||||
Gross commission income | $ | 2,926 | $ | — | $ | 2,926 | $ | — | $ | 2,926 | ||||||||||
Service revenue | 752 | — | 752 | — | 752 | |||||||||||||||
Franchise fees | 256 | — | 256 | — | 256 | |||||||||||||||
Other | 159 | — | 159 | — | 159 | |||||||||||||||
|
|
|
|
|
|
|
|
|
| |||||||||||
Net revenues | 4,093 | — | 4,093 | — | 4,093 | |||||||||||||||
|
|
|
|
|
|
|
|
|
| |||||||||||
Expenses | ||||||||||||||||||||
Commission and other agent-related costs | 1,932 | — | 1,932 | — | 1,932 | |||||||||||||||
Operating | 1,270 | — | 1,270 | — | 1,270 | |||||||||||||||
Marketing | 185 | — | 185 | — | 185 | |||||||||||||||
General and administrative | 254 | — | 254 | 7 | 261 | |||||||||||||||
Former parent legacy costs (benefit), net | (15 | ) | — | (15 | ) | — | (15 | ) | ||||||||||||
Restructuring costs | 11 | — | 11 | — | 11 | |||||||||||||||
Merger costs | 1 | — | 1 | — | 1 | |||||||||||||||
Depreciation and amortization | 186 | — | 186 | — | 186 | |||||||||||||||
Interest expense, net | 666 | (210 | ) | 456 | (120 | ) | 336 | |||||||||||||
Loss on the early extinguishment of debt | 36 | — | 36 | — | 36 | |||||||||||||||
|
|
|
|
|
|
|
|
|
| |||||||||||
Total expenses | 4,526 | (210 | ) | 4,316 | (113 | ) | 4,203 | |||||||||||||
|
|
|
|
|
|
|
|
|
| |||||||||||
Loss before income taxes, equity in earnings and noncontrolling interests | (433 | ) | 210 | (223 | ) | 113 | (110 | ) | ||||||||||||
Income tax expense | 32 | — | 32 | — | 32 | |||||||||||||||
Equity in earnings of unconsolidated entities | (26 | ) | — | (26 | ) | — | (26 | ) | ||||||||||||
|
|
|
|
|
|
|
|
|
| |||||||||||
Net loss | (439 | ) | 210 | (229 | ) | 113 | (116 | ) | ||||||||||||
Less: Net income attributable to noncontrolling interests | (2 | ) | — | (2 | ) | — | (2 | ) | ||||||||||||
|
|
|
|
|
|
|
|
|
| |||||||||||
Net loss attributable to Realogy Holdings | $ | (441 | ) | $ | 210 | $ | (231 | ) | $ | 113 | $ | (118 | ) | |||||||
|
|
|
|
|
|
|
|
|
| |||||||||||
Loss per share attributable to Realogy Holdings: | ||||||||||||||||||||
Basic loss per share: | $ | (55.01 | ) | $ | (2.85 | ) | $ | (0.91 | ) | |||||||||||
Diluted loss per share: | (55.01 | ) | (2.85 | ) | (0.91 | ) | ||||||||||||||
Weighted average common and common equivalent shares of Realogy Holdings outstanding: | ||||||||||||||||||||
Basic: | 8.0 | 81.0 | 130.1 | |||||||||||||||||
Diluted: | 8.0 | 81.0 | 130.1 | |||||||||||||||||
See Notes to Unaudited Pro Forma Financial Information.
63
REALOGY HOLDINGS CORP.
PRO FORMA CONDENSED CONSOLIDATED STATEMENT OF OPERATIONS
SIX MONTHS ENDED JUNE 30, 2012
(In millions, except per share data)
| Actual | Convertible Notes Pro Forma Adjustments (5) | Pro Forma | Offering Transaction Adjustments (6) | Pro Forma As Adjusted | ||||||||||||||||
Revenues | ||||||||||||||||||||
Gross commission income | $ | 1,589 | $ | — | $ | 1,589 | $ | — | $ | 1,589 | ||||||||||
Service revenue | 380 | — | 380 | — | 380 | |||||||||||||||
Franchise fees | 130 | — | 130 | — | 130 | |||||||||||||||
Other | 85 | — | 85 | — | 85 | |||||||||||||||
|
|
|
|
|
|
|
|
|
| |||||||||||
Net revenues | 2,184 | — | 2,184 | — | 2,184 | |||||||||||||||
|
|
|
|
|
|
|
|
|
| |||||||||||
Expenses | ||||||||||||||||||||
Commission and other agent-related costs | 1,064 | — | 1,064 | — | 1,064 | |||||||||||||||
Operating | 643 | — | 643 | — | 643 | |||||||||||||||
Marketing | 103 | — | 103 | — | 103 | |||||||||||||||
General and administrative | 156 | — | 156 | 4 | 160 | |||||||||||||||
Former parent legacy costs (benefit), net | (3 | ) | — | (3 | ) | — | (3 | ) | ||||||||||||
Restructuring costs | 5 | — | 5 | — | 5 | |||||||||||||||
Depreciation and amortization | 89 | — | 89 | — | 89 | |||||||||||||||
Interest expense, net | 346 | (105 | ) | 241 | (60 | ) | 181 | |||||||||||||
Loss on the early extinguishment of debt | 6 | — | 6 | — | 6 | |||||||||||||||
Other (income)/expense, net | 1 | — | 1 | — | 1 | |||||||||||||||
|
|
|
|
|
|
|
|
|
| |||||||||||
Total expenses | 2,410 | (105 | ) | 2,305 | (56 | ) | 2,249 | |||||||||||||
|
|
|
|
|
|
|
|
|
| |||||||||||
Loss before income taxes, equity in earnings and noncontrolling interests | (226 | ) | 105 | (121 | ) | 56 | (65 | ) | ||||||||||||
Income tax expense | 15 | — | 15 | — | 15 | |||||||||||||||
Equity in earnings of unconsolidated entities | (25 | ) | — | (25 | ) | — | (25 | ) | ||||||||||||
|
|
|
|
|
|
|
|
|
| |||||||||||
Net loss | (216 | ) | 105 | (111 | ) | 56 | (55 | ) | ||||||||||||
Less: Net income attributable to noncontrolling interests | (1 | ) | — | (1 | ) | — | (1 | ) | ||||||||||||
|
|
|
|
|
|
|
|
|
| |||||||||||
Net loss attributable to Realogy Holdings | $ | (217 | ) | $ | 105 | $ | (112 | ) | $ | 56 | $ | (56 | ) | |||||||
|
|
|
|
|
|
|
|
|
| |||||||||||
Loss per share attributable to Realogy Holdings: | ||||||||||||||||||||
Basic loss per share: | $ | (27.07 | ) | $ | (1.38 | ) | $ | (0.43 | ) | |||||||||||
Diluted loss per share: | (27.07 | ) | (1.38 | ) | (0.43 | ) | ||||||||||||||
Weighted average common and common equivalent shares of Realogy Holdings outstanding: | ||||||||||||||||||||
Basic: | 8.0 | 81.0 | 130.1 | |||||||||||||||||
Diluted: | 8.0 | 81.0 | 130.1 | |||||||||||||||||
See Notes to Unaudited Pro Forma Financial Information.
64
REALOGY HOLDINGS CORP.
PRO FORMA CONDENSED CONSOLIDATED BALANCE SHEET
(ASSUMING CONVERSION OF ALL OF THE CONVERTIBLE NOTES)
June 30, 2012
(In millions)
| Actual | Convertible Notes Pro Forma Adjustments(7) | Pro Forma | Offering Transaction Adjustments(8) | Pro Forma As Adjusted | ||||||||||||||||
ASSETS | ||||||||||||||||||||
Current assets: | ||||||||||||||||||||
Cash and cash equivalents | $ | 138 | $ | — | $ | 138 | $ | (89 | ) | $ | 49 | |||||||||
Trade receivables | 147 | — | 147 | — | 147 | |||||||||||||||
Relocation receivables | 419 | — | 419 | — | 419 | |||||||||||||||
Relocation properties held for sale | 10 | — | 10 | — | 10 | |||||||||||||||
Deferred income taxes | 59 | — | 59 | — | 59 | |||||||||||||||
Other current assets | 97 | — | 97 | — | 97 | |||||||||||||||
|
|
|
|
|
|
|
|
|
| |||||||||||
Total current assets | 870 | — | 870 | (89 | ) | 781 | ||||||||||||||
Property and equipment, net | 151 | — | 151 | — | 151 | |||||||||||||||
Goodwill | 2,618 | — | 2,618 | — | 2,618 | |||||||||||||||
Trademarks | 732 | — | 732 | — | 732 | |||||||||||||||
Franchise agreements, net | 2,808 | — | 2,808 | — | 2,808 | |||||||||||||||
Other intangibles, net | 418 | — | 418 | — | 418 | |||||||||||||||
Other non-current assets | 225 | (7 | ) | 218 | (3 | ) | 215 | |||||||||||||
|
|
|
|
|
|
|
|
|
| |||||||||||
Total assets | $ | 7,822 | $ | (7 | ) | $ | 7,815 | $ | (92 | ) | $ | 7,723 | ||||||||
|
|
|
|
|
|
|
|
|
| |||||||||||
LIABILITIES AND EQUITY (DEFICIT) | ||||||||||||||||||||
Current liabilities: | ||||||||||||||||||||
Accounts payable | $ | 214 | $ | — | $ | 214 | $ | — | $ | 214 | ||||||||||
Securitization obligations | 267 | — | 267 | — | 267 | |||||||||||||||
Due to former parent | 76 | — | 76 | — | 76 | |||||||||||||||
Revolving credit facilities and current portion of long-term debt | 214 | — | 214 | (94 | ) | 120 | ||||||||||||||
Accrued expenses and other current liabilities | 583 | 583 | (79 | ) | 504 | |||||||||||||||
|
|
|
|
|
|
|
|
|
| |||||||||||
Total current liabilities | 1,354 | — | 1,354 | (173 | ) | 1,181 | ||||||||||||||
Long-term debt | 7,121 | (2,110 | ) | 5,011 | (755 | ) | 4,256 | |||||||||||||
Deferred income taxes | 895 | — | 895 | — | 895 | |||||||||||||||
Other non-current liabilities | 173 | — | 173 | — | 173 | |||||||||||||||
|
|
|
|
|
|
|
|
|
| |||||||||||
Total liabilities | 9,543 | (2,110 | ) | 7,433 | (928 | ) | 6,505 | |||||||||||||
|
|
|
|
|
|
|
|
|
| |||||||||||
Total equity (deficit)(9) | (1,721 | ) | 2,103 | 382 | 836 | 1,218 | ||||||||||||||
|
|
|
|
|
|
|
|
|
| |||||||||||
Total liabilities and equity (deficit) | $ | 7,822 | $ | (7 | ) | $ | 7,815 | $ | (92 | ) | $ | 7,723 | ||||||||
|
|
|
|
|
|
|
|
|
| |||||||||||
See Notes to Unaudited Pro Forma Financial Information.
65
Notes to Unaudited Pro Forma Financial Information
Balance Sheet
| (1) | Pro forma gives effect to the conversion of approximately $1,903 million aggregate principal amount of the Convertible Notes held by the Significant Holders substantially concurrently with the closing of this offering. The pro forma balance sheet also reflects the write-off of deferred financing costs of $6 million as a result of the repayment of outstanding debt as described in “Use of Proceeds.” |
| (2) | Pro forma as adjusted gives effect to the following: |
| • | Anticipated gross proceeds from the sale of common stock in this offering | $ | 1,000 | |||
| • | Use of cash on hand | 89 | ||||
| • | Borrowings under our revolving credit facility | 92 | ||||
| Less | ||||||
| • | Transaction related costs, including 447.5 million in underwriting discounts and commissions | (54 | ) | |||
| • | Prepayment of all of the aggregate outstanding principal amount of the Second Lien Loans | (650 | ) | |||
| • | Redemption of all of the aggregate outstanding principal amount of the 10.40% Senior Notes | (64 | ) | |||
| • | Redemption of all of the aggregate outstanding principal amount of the Senior Toggle Notes | (41 | ) | |||
| • | Payment of prepayment premiums and fees | (7 | ) | |||
| • | Redemption of the approximately $207 million aggregate principal amount of the convertible Notes that are not held by the significant Holders following the closing date of this offering at a redemption price equal to 90% of the principal amount hereof | (186 | ) | |||
| • | Payment of the cash portion of the Management Agreement Termination Fee to be paid on January 15, 2013 | (15 | ) | |||
| • | Payment of cash pursuant to the Significant Holders letter agreements (the Significant Holders will not receive the interest payment to be paid on the Convertible Notes on October 15, 2012, the next regularly scheduled interest payment date for the Convertible Notes) | (105 | ) | |||
| • | Payment of interest ($26 million was accrued at June 30, 2012), which represents the interest payable from April 15, 2012 through the anticipated prepayment date on the indebtedness that will be repaid as described in “Use of Proceeds.” | (59 | ) | |||
The decrease in other non-current assets reflects the write-off of deferred financing costs of $4 million as a result of the repayment of outstanding debt as described in “Use of Proceeds.”
The reduction in accrued liabilities of $78 million is due to: (a) a $44 million reduction in accrued interest recorded as of June 30, 2012 on the Convertible Notes held by the Significant Holders which will not be paid as a result of the conversion of their Convertible Notes pursuant to the Significant Holders letter agreements; (b) a $26 million reduction in accrued interest recorded as of June 30, 2012 which is included in the interest expense of $59 million reflected above; and (c) an $8 million reduction in the amount accrued related to the management fee agreement.
The decrease in long -term debt of $962 million is comprised of the prepayment of $650 million principal amount of the Second Lien Loans, $64 million principal amount of the 10.50% Senior Notes , $41 million principal amount of the Senior Toggle Notes and $207 million principal amount of the Convertible Notes.
Statement of Operations for the Year Ended December 31, 2011
| (3) | Pro forma gives effect to the reduction in interest expense due to the conversion of approximately $1,903 million aggregate principal amount of the Convertible Notes held by the Significant Holders. The |
66
adjustment to interest expense includes a $209 million reduction in interest expense due to the conversion of such Convertible Notes and a $1 million reduction in deferred financing costs which are amortized to interest expense. The Company has not included in the pro forma statement of operations the loss on the extinguishment of debt as it is nonrecurring.
Pro forma also gives effect to the issuance of 73,006,178 additional shares as a result of the conversion of approximately $1,903 million aggregate principal amount of the Convertible Notes held by the Significant Holders.
| (4) | Pro forma as adjusted gives effect to the use of net proceeds from this offering, cash on hand and borrowings under our revolving credit facility to facilitate: |
| • | Prepayment of all of the aggregate outstanding principal amount of the Second Lien Loans | $ | (650 | ) | ||
| • | Redemption of all of the aggregate outstanding principal amount of the 10.50% Senior Notes | (64 | ) | |||
| • | Redemption of all of the aggregate outstanding principal amount of the Senior Toggle Notes | (41 | ) | |||
| • | Redemption of the approximately $207 million aggregate principal amount of the Convertible Notes that are not held by the Significant Holders following the closing date of this offering at a redemption price equal to 90% of the principal amount thereof | (186 | ) |
The adjustment to interest expense includes a $121 million reduction in interest expense due to the repayment of outstanding debt noted above and a $2 million reduction in deferred financing costs, which are amortized to interest expense ; offset by a $3 million increase in interest expense related to additional borrowings under our revolving credit facility.
If the $207 million aggregate principal amount of Convertible Notes not held by the Significant Holders are converted into common stock instead of being redeemed, the Company will utilize the $186 million of proceeds from this offering that otherwise would have been applied to redeem the Convertible Notes to instead repay other indebtedness, which would result in additional annual interest savings.
The increase in general and administrative expenses of $7 million is for stock compensation expense for the grant of stock options (vesting over four years) and restricted stock (vesting over three years) in connection with this offering assuming an initial public offering price of $25.00 per share, which is the midpoint of the offering price range set forth on the cover page of this prospectus.
We have not included in our pro forma statement of operations the impact of non-recurring charges which include the following:
| • | Expense which represents the fair value of the shares of common stock to be issued to the Significant Holders pursuant to the Significant Holders letter agreements | $ | 228 | |||
| • | Expense related to the cash payment to be made pursuant to the Significant Holders letter agreements as described in “Use of Proceeds” | 105 | ||||
| • | Expense to be recognized related to the Management Agreement Termination Fee to be paid $15 million in cash and $25 million in shares of our common stock on January 15, 2013 | 40 | ||||
| • | Payment of prepayment premiums and fees associated with the prepayment of our indebtedness as described in “Use of Proceeds” | 7 | ||||
| • | Loss on the extinguishment of debt, related to the write-off of deferred financing costs | 4 |
67
| Offset by | ||||||
| • | Gain related to the approximately $207 million principal amount of Convertible Notes to be redeemed by the Company at 90% of the principal amount thereof | 21 | ||||
| • | Reduction in accrued interest recorded as of June 30, 2012 on the Convertible Notes held by the Significant Holders which will not be paid as a result of the conversion of their Convertible Notes pursuant to the Significant Holders letter agreements | 44 | ||||
| • | Reduction in accrued interest recorded as of June 30, 2012 which is included in the interest expense of $59 million reflected above | 26 | ||||
| • | Reduction in the amount accrued related to the management fee agreement | 8 | ||||
Pro forma as adjusted also gives effect to the issuance of 9,125,776 additional shares pursuant to the Significant Holders letter agreements and the issuance of 40,000,000 shares in this offering.
Statement of Operations for the Six Months Ended June 30, 2012
| (5) | Pro forma gives effect to the reduction in interest expense due to the conversion of $1,903 million aggregate principal amount of Convertible Notes held by the Significant Holders. The adjustment to interest expense includes a $105 million reduction in interest expense due to the conversion of the Convertible Notes. The Company has not included in the pro forma statement of operations the loss on the extinguishment of debt as it is nonrecurring. |
Pro forma also gives effect to the issuance of 73,006,178 additional shares as a result of the conversion of $1,903 million aggregate principal amount of the Convertible Notes held by the Significant Holders.
| (6) | Pro forma as adjusted gives effect to the use of net proceeds related to the offering, cash on hand and borrowings under our revolving credit facility to facilitate: |
| • | Prepayment of all of the aggregate outstanding principal amount of the Second Lien Loans | $ | (650 | ) | ||
| • | Redemption of all of the aggregate outstanding principal amount of the 10.50% Senior Notes | (64 | ) | |||
| • | Redemption of all of the aggregate outstanding principal amount of the Senior Toggle Notes | (41 | ) | |||
| • | Redemption of the approximately $207 million aggregate principal amount of the Convertible Notes that are not held by the Significant Holders following the closing date of this offering at a redemption price equal to 90% of the principal amount thereof | (186 | ) |
The adjustment to interest expense includes a $61 million reduction in interest expense due to the repayment of outstanding debt noted above and a $1 million reduction in deferred financing costs, which are amortized to interest expense; offset by a $2 million increase in interest expense related to additional borrowings under our revolving credit facility.
If the $207 million aggregate principal amount of Convertible Notes not held by the Significant Holders are converted into common stock instead of being redeemed, the Company will utilize the $186 million of proceeds from this offering that otherwise would have been applied to redeem the Convertible Notes to instead repay other indebtedness, which would result in additional annual interest savings.
The increase in general and administrative expenses of $4 million is for stock compensation expense for the grant of stock options (vesting over 4 years) and restricted stock (vesting over 3 years) in connection with this offering assuming an initial public offering price of $25.00 per share, which is the midpoint of the offering price range set forth on the cover page of this prospectus.
Pro forma as adjusted also gives effect to the issuance of 9,125,776 additional shares pursuant to the Significant Holders letter agreements and the issuance of 40,000,000 shares of common stock in this offering.
68
Notes to Unaudited Pro Forma Financial Information
(Assuming Conversion of all of the Convertible Notes)
Balance Sheet (assuming conversion of all of the Convertible Notes)
| (7) | Pro forma gives effect to the conversion of all of the approximately $1,903 million aggregate principal amount of the Convertible Notes held by the Significant Holders substantially concurrently with the closing of this offering and the assumed conversion of the approximately $207 million of Convertible Notes within 30 days from the closing of this offering , representing all of the Convertible Notes that will remain outstanding. The pro forma balance sheet also reflects the write-off of deferred financing costs of $7 million as a result of the repayment of outstanding debt. |
| (8) | Pro forma as adjusted gives effect to the following: |
| • | Anticipated gross proceeds from the sale of common stock in this offering | $ | 1,000 | |||
| • | Use of cash on hand | 89 | ||||
| • | Borrowings under our revolving credit facility | 6 | ||||
| Less | ||||||
| • | Transaction related costs, including $47.5 million in underwriting discounts and commissions | (54 | ) | |||
| • | Prepayment of all of the aggregate outstanding principal amount of the Second Lien Loans | (650 | ) | |||
| • | Redemption of all of the aggregate outstanding principal amount of the 10.50% Senior Notes | (64 | ) | |||
| • | Redemption of all of the aggregate outstanding principal amount of the Senior Toggle Notes | (41 | ) | |||
| • | Payment of prepayment premiums and fees | (7 | ) | |||
| • | Repayment of other bank indebtedness | (100 | ) | |||
| • | Payment of the cash portion of the Management Agreement Termination Fee to be paid on January 15, 2013 | (15 | ) | |||
| • | Payment of cash pursuant to the Significant Holders letter agreements (the Significant Holders will not receive the interest payment to be paid on the Convertible Notes on October 15, 2012, the next regularly scheduled interest payment date for the Convertible Notes) | (105 | ) | |||
| • | Payment of interest ($26 million was accrued at June 30, 2012), which represents the interest payable from April 15, 2012 through the anticipated prepayment date on the indebtedness that will be repaid as described in “Use of Proceeds.” | (59 | ) | |||
The decrease in other non-current assets reflects the write-off of deferred financing costs of $3 million as a result of the repayment of outstanding debt.
The decrease in short-term debt of $94 million is comprised of the prepayment of $100 million of other bank indebtedness, offset by $6 million of borrowings under our revolving credit facility.
The reduction in accrued liabilities of $79 million is due to: (a) a $44 million reduction in accrued interest recorded as of June 30, 2012 on the Convertible Notes held by the Significant Holders which will not be paid as a result of the conversion of their Convertible Notes pursuant to the Significant Holders letter agreements; (b) a $26 million reduction in accrued interest recorded as of June 30, 2012 which is included in the interest expense of $59 million reflected above; and (c) an $8 million reduction in the amount accrued related to the management fee agreement.
The decrease in long-term debt of $755 million is comprised of the prepayment of $650 million principal amount of the Second Lien Loans , $64 million principal amount of the 10.50% Senior Notes and $41 million principal amount of the Senior Toggle Notes.
| (9) | Pro forma reflects interest savings of $ 233 million as a result of the conversion of all of the $2,110 million aggregate principal amount of Convertible Notes and pro forma as adjusted reflects interest savings of $107 |
69
million as a result of proceeds being utilized to repay $650 million principal amount of the Second Lien Loans, $64 million principal amount of the 10.50% Senior Notes, $41 million principal amount of the Senior Toggle Notes, $100 million of other bank indebtedness and $86 million of reduced borrowings under our revolving credit facility resulting in total interest savings of $340 million.
Pro forma gives effect to the issuance of 81,032,3 79 additional shares as a result of the conversion of all of the $2,110 million aggregate principal amount of Convertible Notes. Pro forma as adjusted gives effect to the issuance of 9,739,901 additional shares pursuant to the letter agreements and the issuance of 40,000,000 shares in this offering.
The table below sets forth selected pro forma condensed consolidated statement of operations data for the six months ended June 30, 2012 on a pro forma basis and on a pro forma as adjusted basis giving further effect to the conversion of all of the approximately $207 million aggregate principal amount of the Convertible Notes not held by the Significant holders.
| Actual | Pro Forma | Pro Forma As Adjusted | ||||||||||
Loss attributable to Realogy Holdings | $ | (441 | ) | $ | (231 | ) | $ | (118 | ) | |||
Additional interest savings | — | 23 | 10 | |||||||||
|
|
|
|
|
| |||||||
Adjusted net loss attributable to Realogy Holdings | $ | (441 | ) | $ | (208 | ) | $ | (108 | ) | |||
|
|
|
|
|
| |||||||
Loss per share attributable to Realogy Holdings: | ||||||||||||
Basic loss per share: | $ | (55.01 | ) | $ | (2.34 | ) | $ | (0.78 | ) | |||
Diluted loss per share: | (55.01 | ) | (2.34 | ) | (0.78 | ) | ||||||
Weighted average common and common equivalent shares of Realogy Holdings outstanding: | ||||||||||||
Basic: | 8.0 | 89.0 | 138.8 | |||||||||
Diluted: | 8.0 | 89.0 | 138.8 | |||||||||
70
Allowance for doubtful accounts
We estimate the allowance necessary to provide for uncollectible accounts receivable. The estimate is based on historical experience, combined with a review of current developments, and includes specific accounts for which payment has become unlikely. The process by which we calculate the allowance begins in the individual business units where specific problem accounts are identified and reserved and an additional reserve is generally recorded driven by the age profile of the receivables. Our allowance for doubtful accounts was $58 million, $64 million and $67 million at June 30, 2012, December 31, 2011 and 2010, respectively.
Impairment of goodwill and other indefinite-lived intangible assets
With regard to the goodwill and other indefinite-lived intangible assets recorded in connection with business combinations, we annually, or more frequently if circumstances indicate impairment may have occurred, analyze their carrying values to determine if an impairment exists. In performing this analysis, we are required to make an assessment of fair value for our goodwill and other indefinite-lived intangible assets. We determine the fair value of our reporting units utilizing our best estimate of future revenues, operating expenses, cash flows, market and general economic conditions as well as assumptions that we believe marketplace participants would utilize including discount rates, cost of capital, and long term growth rates. Although we believe our assumptions are reasonable, actual results may vary significantly. A change in these underlying assumptions could cause a change in the results of the tests and, as such, could cause the fair value to be less than the respective carrying amount. In such an event, we would be required to record a charge, which would impact earnings.
The aggregate carrying value of our goodwill and other indefinite-lived intangible assets was $2,618 million and $1,887 million, respectively, at June 30, 2012. It is difficult to quantify the impact of an adverse change in financial results and related cash flows, as certain changes may be isolated to one of our four reporting units or spread across our entire organization. Based upon the impairment analysis performed in the fourth quarter of 2011, there was no impairment for 2011. Management did evaluate the effect of lowering the estimated fair value for each of the reporting units by 10% and determined that no impairment of goodwill would have been recognized under this evaluation.
Common stock valuation
On occasion, we grant stock-based awards to certain senior management employees and directors. These awards are measured at the grant date based on the fair value as calculated using the Black-Scholes option pricing model and are recognized as expense over the service period based on the vesting requirements, or when requisite performance metrics or milestones are achieved. Determining the fair value of stock-based awards at the grant date requires considerable judgment, including estimating expected volatility, expected term and risk-free rate.
In April 2012, the Compensation Committee of our Board of Directors granted 972,000 of time vesting stock options and 80,000 of performance based options to certain senior management employees. Our expected volatility for these options is based on the average volatility rates of similar actively traded companies. The expected holding period of the option is calculated based on the simplified method and is estimated to be 6.25 year. The risk-free rate is derived from the U.S. Treasuries, the period of which relates to the grant’s holding period. If factors change and we employ different assumptions, the fair value of future awards and resulting stock-based compensation expense may differ significantly from what we have estimated historically.
The estimate of the intrinsic value of these options (share value at the time of issuance less exercise price) was based on a contemporaneous share valuation prepared with the assistance of a third party specialist. In conjunction with the preparation of this valuation, we adhered to the guidance provided by the AICPA as prescribed in its Practice Aid entitled, “Valuation of Privately-Held-Company Equity Securities Issued as Compensation.” This Practice Aid specifically addresses valuation of common stock in private companies and outlines approaches that can be taken for that valuation, as well as providing guidelines for each approach. The approaches outlined in the Practice Aid are: (1) discounted cash flow, or income; (2) public company market approach (market multiples); and (3) the guideline transaction (M&A) market approach. Consistent with these
123
guidelines, we employed the income (discounted cash flows) and public company market (market multiples) approaches when performing the valuation, which provided an arm’s length transaction that established an observable price for our shares in the absence of having a quoted market price on an active exchange.
Two inputs for the discounted cash flow model were comprised of our internal forecasts along with a weighted average cost of capital (discount rate). The Company’s weighted average cost of capital provides an expected rate of return based on the Company’s capital structure, the required yield on the Company’s equity and the required yield on the Company’s interest-bearing debt. The inputs used for deriving the multiples that were employed in the market approach analysis were obtained from published financial information from comparable companies, as well as from our historical and forecasted financial results. The results from these two valuation approaches, income (DCF) and market multiples, were given equal weight to determine the value of the enterprise. The Company chose the probability weighted expected return method, as described in the AICPA Practice Aid cited above, given the existing plans to pursue an initial public offering. Two scenarios were prepared, one assuming the Company continued as a private company and one where the company successfully completed an initial public offering based on its then current financial position and the uncertainty of the housing market as of the date of grant. After consideration of these factors, the two scenarios were equally weighted. The results of each scenario were averaged to determine the fair value of our shares of $20.50.
The information used in the above model was based on the most readily available and relevant information at the time the valuation was performed. The valuation model employed both observable and objective inputs, such as market data, as well as inputs which were more subjective, such as assumptions used in preparing our forecasts, which were based on our best estimates at the valuation date. Additional factors such as a marketability discount were factored into the final determination of the fair value of our shares. The below table details the grant prices and grant totals for stock option grants issued in April 2012:
Type of Grant | Number of options granted | Estimated share value used for fair value calculation | Fair value of options at grant date | Option exercise price | ||||||||||||
Time Vested | 972,000 | $ | 20.50 | $ | 10.25 | $ | 17.50 | |||||||||
Performance Based | 80,000 | $ | 20.50 | $ | 9.75 | $ | 17.50 | |||||||||
Based upon an estimated offering price of $25.00 per share, which is the midpoint of the estimated public offering price range set forth on the cover page of this prospectus, the April 2012 options would have an intrinsic value of approximately $8 million.
Income taxes
We recognize deferred tax assets and liabilities based on the differences between the financial statement carrying amounts and the tax bases of assets and liabilities. We regularly review our deferred tax balances to assess their potential realization and establish a valuation allowance for amounts that we believe will not be ultimately realized. In performing this review, we make estimates and assumptions regarding projected future taxable income, the expected timing of the reversals of existing temporary differences and the identification of tax planning strategies. A change in these assumptions could cause an increase or decrease to our valuation allowance resulting in an increase or decrease in our effective tax rate, which could materially impact our results of operations.
124
Domus Holdings (Realogy Corp)
Summary Memo: 2007 Acquired Intangibles
The Company has carefully reconsidered its previous valuation of identified acquired intangibles to determine how the value derived from the Company owned brokerages should be reflected on our opening balance sheet recorded as part of our original purchase accounting in April 2007. After further evaluation, we conclude that in valuing acquired intangible assets, we should ignore the intercompany contractual commitment associated with the NRT franchise agreement and assess what additional asset value should have been attributed to the Company’s owned brokerages. As our Company owned brokerage operations derive their revenues (value) from their ability to exclusively license the applicable trade names in their selected locations, we believe it is appropriate to include both the third party franchise royalty feesandthe income earned by the Company’s owned brokerages in determining the value of the acquired trade names. Accordingly, in recalculating the original purchase accounting value for the trade name, we separately evaluated each of the distinct revenue streams as noted below.
Franchise Royalties
A third party broker earns revenue from a homesale transaction. When a homesale occurs, the third party broker collects, in this example, 6% of the selling price of the home from the seller and records this amount as gross commission income on its financial statements. From this revenue, the broker pays (1) commissions to its independent real estate agents (typically about 65% of the gross commission income), (2) marketing costs, (3) overhead costs to operate its real estate offices (rent, salaries of office personnel, etc), and (4) royalties to Realogy, calculated in accordance with its franchise agreement (typically 6% of the gross commission income). (See Exhibit A attached for a walk down of a sample real estate transaction for a third party broker.) The value of the trade name was calculated using an income approach, specifically the relief from royalty method for this portion of the analysis. The calculation assumes that in lieu of ownership, the Company could obtain comparable rights to use the trade name via a license from a hypothetical third-party owner to determine a market royalty rate. (In fact, the Company has such arm’s length third party agreements with Sotheby’s and Better Homes and Gardens trade name owners.) As a result, the fair value of the asset is estimated by calculating the present value of licensing fees avoided because the trade names are owned and not licensed from third parties. As these license fees would be required to support the overall value of the franchise operations to its franchise customers, future estimated third party royalty revenue was multiplied by a market participant royalty rate, and then discounted back to present value to arrive at fair value. The portion of the intangible asset attributable to third party franchisees was recalculated to exclude the intercompany royalty revenue, in order to include all company owned brokerage revenues in the determination of the value of trade names, as described below.
1
Company Owned Brokerages
Our company owned brokerage operations records revenue, listed as gross commission income on the face of our statement of operations, of approximately 6% (in this example) of the selling price of the home from the seller. From this revenue the company owned broker pays the following costs to third parties: (1) commissions to its independent real estate agents (typically about 65% of the gross commission income), (2) marketing costs, and (3) overhead costs to operate its real estate offices. (See Exhibit A attached for walk down of sample real estate transaction for company owned brokerage.) Even if we exclude the intercompany royalty fees that are paid by the company owned brokerage, the costs of operating the brokerage are substantial, resulting in the Company retaining only about 10% of revenue. As a result, we determined that it would be inappropriate to value this portion of the trade name intangible asset using the relief from royalties method, because the third party market royalty rate is based on a net royalty paid, rather than gross commission income, or revenue, of the brokerage. In addition, as NRT is three times larger than its nearest competitor and 26 times larger than our largest franchisee (both as measured by 2011 sales volume), we were unable to determine an appropriate arm’s-length third party market royalty rate for NRT, as such rates vary with volume. Therefore, we determined that the proper methodology for valuing this portion of the trade name was the excess earnings method, which is an acceptable alternate method used to derive the value of an intangible asset. The excess earnings method derives the value of an asset by calculating profit and deducting a charge for the utilization of the identified assets (the contributory charge). This contributory charge specifically excludes any expense relating to the intercompany agreement.
After recalculating the fair market value of its intangible assets and goodwill, including our related impairment analysis, for all years since 2007, the table below shows net increases / (decreases) to our balance sheet, as compared to reported balances.
($ in millions)
As of December 31, | 2007 | 2008 | 2009 | 2010 | 2012 | |||||||||||||||
Net carrying value of total intangible assets | (56 | ) | 24 | 24 | 24 | 24 | ||||||||||||||
Net carrying value of goodwill | 5 | (14 | ) | (14 | ) | (14 | ) | (14 | ) | |||||||||||
Deferred tax liability | (22 | ) | 10 | 10 | 10 | 10 | ||||||||||||||
Retained earnings | (29 | ) | 0 | 0 | 0 | 0 | ||||||||||||||
(See exhibit B for a detailed roll forward of impairment as reported and as revised per the methodology described above for December 31, 2007 and 2008.) The Company recalculated its annual impairment analysis of trade names as well as its Step 1 impairment analysis of goodwill for the years ended December 31, 2009, 2010, and 2011, which resulted in no additional impairment. (See Exhibit C for a summary of the annual impairment analysis of trade names and goodwill for the years ended December 31, 2009, 2010, and 2011.)
Please see Exhibit D for the expected changes to the balance sheet and Exhibit E for a draft of the footnote to describe the revision to the S-1.
2
Doms Holdings (Realogy Corp)
Exhibit A
Example of a real estate transaction, comparing a company owned brokerage to a third party franchisee
Company owned broker example,excluding intercompany royalty payment | Third party franchisee broker | |||||
| Transaction | $200,000 home with 6% ($12,000) | $200,000 home with 6% ($12,000) | ||||
| Assumption | brokers fee | brokers fee | ||||
| Realogy revenue = $12,000 GrossCommission Income | Brokerage revenue = $12,000 Grosscommission income | |||||
| Less: $7,800 agent commission (65%) | Third party broker pays $7,800 agent commission (65%) | |||||
| Less: $3200 overhead and marketing | Third party broker pays overhead and marketing
| |||||
Amount retained by Realogy | $1,000 profit retained by |
$720 royalty fee paid to franchisor by third party broker (6% of $12,000)
| ||||
| In 2011, company owned brokerage revenue = $2.9 billion, less 65% to agents, less $792 million for offices, marketing, G&A | In 2011, third party franchisee royalties to Realogy = $232 m | |||||
| (723 offices and 41,500 real estate agents) | (3,150 US franchisees, 6,100 offices and 166,000 real estate agents) | |||||
3
Domus Holdings (Realogy Corp)
Exhibit B
As Reported
| Open Balance 4/10/07 | Impairment/ Tax Impact | 12/31/07 | Impairment/ Tax Impact | 12/31/08 | ||||||||||||||||
Selected Balance Sheet Items DR/(CR): | ||||||||||||||||||||
RFG Goodwill | 2,265 | 2,265 | (709 | ) | 1,556 | |||||||||||||||
RFG Tradenames | 817 | (93 | ) | 724 | (138 | ) | 586 | |||||||||||||
RFG Franchise Agreement with NRT | 1,671 | (420 | ) | 1,251 | (106 | ) | 1,145 | |||||||||||||
|
|
|
|
|
|
|
|
|
| |||||||||||
RFG Tradenames and Franchise Agreement with NRT | 2,488 | (513 | ) | 1,975 | (244 | ) | 1,731 | |||||||||||||
Deferred Tax Liability Associated with Intangibles | (1,001 | ) | 205 | (796 | ) | 86 | (710 | ) | ||||||||||||
Net Impact to Retained (Earnings) / Deficit | — | 308 | 308 | 867 | 1,175 | |||||||||||||||
Selected Statement of Operations Items: | ||||||||||||||||||||
Impairment Associated with RFG Assets | 513 | 953 | ||||||||||||||||||
Income Tax Expense / (Benefit) | (205 | ) | (86 | ) | ||||||||||||||||
|
|
|
| |||||||||||||||||
Impact to Net Loss / (Income) | 308 | 867 | ||||||||||||||||||
|
|
|
| |||||||||||||||||
As Adjusted
|
| |||||||||||||||||||
| Open Balance 4/10/07 | Impairment/ Tax Impact | 12/31/07 | Impairment/ Tax Impact | 12/31/08 | ||||||||||||||||
Selected Balance Sheet Items DR/(CR): | ||||||||||||||||||||
RFG Goodwill | 2,270 | — | 2,270 | (728 | ) | 1,542 | ||||||||||||||
RFG Tradenames | 2,479 | (560 | ) | 1,919 | (164 | ) | 1,755 | |||||||||||||
RFG Franchise Agreement with NRT | — | — | — | |||||||||||||||||
|
|
|
|
|
|
|
|
|
| |||||||||||
RFG Tradenames and Franchise Agreement with NRT | 2,479 | (560 | ) | 1,919 | (164 | ) | 1,755 | |||||||||||||
Deferred Tax Liability Associated with Intangibles | (997 | ) | 223 | (774 | ) | 54 | (720 | ) | ||||||||||||
Net Impact to Retained Earnings / (Deficit) | — | 337 | 337 | 838 | 1,175 | |||||||||||||||
Selected Statement of Operations Items: | ||||||||||||||||||||
Impairment Associated with RFG Assets | 560 | 892 | ||||||||||||||||||
Income Tax Expense / (Benefit) | (223 | ) | (54 | ) | ||||||||||||||||
|
|
|
| |||||||||||||||||
Impact to Net Loss / (Income) | 337 | 838 | ||||||||||||||||||
|
|
|
| |||||||||||||||||
Impact of Adjustments to Balance Sheet and Income Statement
|
| |||||||||||||||||||
Open Balance 4/10/07 | Impairment/ Tax Impact | 12/31/07 | Impairment/ Tax Impact | 12/31/08 | ||||||||||||||||
Selected Balance Sheet Increase / (Decrease): | ||||||||||||||||||||
RFG Goodwill | 5 | — | 5 | (19 | ) | (14 | ) | |||||||||||||
RFG Tradenames | 1,662 | (467 | ) | 1,195 | (26 | ) | 1,169 | |||||||||||||
RFG Franchise Agreement with NRT | (1,671 | ) | 420 | (1,251 | ) | 106 | (1,145 | ) | ||||||||||||
RFG Tradenames and Franchise Agreement with NRT | (9 | ) | (47 | ) | (56 | ) | 80 | 24 | ||||||||||||
Impact on Assets | (4 | ) | (47 | ) | (51 | ) | 61 | 10 | ||||||||||||
|
|
|
|
|
|
|
|
|
| |||||||||||
Deferred Tax Liability Associated with Intangibles | 4 | 18 | 22 | (32 | ) | (10 | ) | |||||||||||||
Net Impact to Retained Earnings / (Deficit) | — | 29 | 29 | (29 | ) | |||||||||||||||
|
|
|
|
|
|
|
|
|
| |||||||||||
Impact on Liabilities and Equity | 4 | 47 | 51 | (61 | ) | (10 | ) | |||||||||||||
|
|
|
|
|
|
|
|
|
| |||||||||||
Selected Statement of Operations Items: | ||||||||||||||||||||
Impairment Associated with RFG Assets | 47 | (61 | ) | |||||||||||||||||
Income Tax Expense / (Benefit) | (18 | ) | 32 | |||||||||||||||||
|
|
|
| |||||||||||||||||
Impact to Net Loss / (Income) | 29 | (29 | ) | |||||||||||||||||
|
|
|
| |||||||||||||||||
4
Domus Holdings (Realogy Corp)
Exhibit C
CALCULATIONS RELATED TO THE ASC 350 REVIEW FOR REALOGY CORPORATION
SUMMARY OF STEP 1 CONCLUSION
(Amounts in millions)
As of October 1, 2011
| Fair Value | Carrying Value | Excess Fair Value | Implied Impairment (Y/N) | |||||||||||
RFG Trademarks | $ | 2,235 | $ | 1,755 | $ | 480 | NO | |||||||
Reporting Unit Value: | ||||||||||||||
RFG | $ | 4,498 | $ | 3,041 | $ | 1,457 | NO | |||||||
NRT | 2,050 | 958 | 1,092 | NO | ||||||||||
Cartus | 1,098 | 529 | 569 | NO | ||||||||||
TRG | 328 | 177 | 151 | NO | ||||||||||
Total Reporting Units | $ | 7,974 | $ | 4,705 | ||||||||||
As of October 1, 2010
| Fair Value | Carrying Value | Excess Fair Value | Implied Impairment (Y/N) | |||||||||||
RFG Trademarks | $ | 2,717 | $ | 1,755 | $ | 962 | NO | |||||||
Reporting Unit Value: | ||||||||||||||
RFG | $ | 4,941 | $ | 3,192 | $ | 1,749 | NO | |||||||
NRT | 2,310 | 929 | 1,381 | NO | ||||||||||
Cartus | 1,288 | 540 | 748 | NO | ||||||||||
TRG | 408 | 189 | 219 | NO | ||||||||||
Total Reporting Units | $ | 8,947 | $ | 4,850 | ||||||||||
As of October 1, 2009
| Fair Value | Carrying Value | Excess Fair Value | Implied Impairment (Y/N) | |||||||||||
RFG Trademarks | $ | 2,327 | $ | 1.755 | $ | 572 | NO | |||||||
Reporting Unit Value: | ||||||||||||||
RFG | $ | 4,498 | $ | 3,347 | $ | 1,151 | NO | |||||||
NRT | 1,956 | 882 | 1,074 | NO | ||||||||||
Cartus | 806 | 445 | 361 | NO | ||||||||||
TRG | 418 | 167 | 250 | NO | ||||||||||
Total Reporting Units | $ | 7,678 | $ | 4,842 | ||||||||||
5
Exhibit D
REALOGY HOLDINGS CORP.
CONSOLIDATED BALANCE SHEETS
(In millions)
| December 31, | ||||||||
| 2011 | 2010 | |||||||
ASSETS | ||||||||
Current assets: | ||||||||
Cash and cash equivalents | $ | 143 | $ | 192 | ||||
Trade receivables (net of allowance for doubtful accounts of $64 and $67) | 120 | 114 | ||||||
Relocation receivables | 378 | 386 | ||||||
Relocation properties held for sale | 11 | 21 | ||||||
Deferred income taxes | 66 | 76 | ||||||
Other current assets | 88 | 109 | ||||||
|
|
|
| |||||
Total current assets | 806 | 898 | ||||||
Property and equipment, net | 165 | 186 | ||||||
Goodwill | 2,600 | 2,597 | ||||||
Trademarks | 1,901 | 1,901 | ||||||
Franchise agreements, net | 1,697 | 1,764 | ||||||
Other intangibles, net | 439 | 478 | ||||||
Other non-current assets | 212 | 215 | ||||||
|
|
|
| |||||
Total assets | $ | 7,820 | $ | 8,039 | ||||
|
|
|
| |||||
LIABILITIES AND EQUITY (DEFICIT) | ||||||||
Current liabilities: | ||||||||
Accounts payable | $ | 184 | $ | 203 | ||||
Securitization obligations | 327 | 331 | ||||||
Due to former parent | 80 | 104 | ||||||
Revolving credit facility and current portion of long-term debt | 325 | 194 | ||||||
Accrued expenses and other current liabilities | 520 | 525 | ||||||
|
|
|
| |||||
Total current liabilities | 1,436 | 1,357 | ||||||
Long-term debt | 6,825 | 6,698 | ||||||
Deferred income taxes | 900 | 893 | ||||||
Other non-current liabilities | 167 | 163 | ||||||
|
|
|
| |||||
Total liabilities | 9.328 | 9,111 | ||||||
|
|
|
| |||||
Commitments and contingencies (Notes 13 and 14) | ||||||||
Equity (deficit): | ||||||||
Realogy Holdings common stock: $.01 par value; 178,000,000 shares authorized, 4,200 Class A shares outstanding, 8,017,080 Class B shares outstanding at December 31, 2011 and 8,017,240 Class B shares outstanding at December 31, 2010 | — | — | ||||||
Additional paid-in capital | 2,033 | 2,026 | ||||||
Accumulated deficit | (3,511 | ) | (3,070 | ) | ||||
Accumulated other comprehensive loss | (32 | ) | (30 | ) | ||||
|
|
|
| |||||
Total Realogy Holdings stockholders’ deficit | (1,510 | ) | (1,074 | ) | ||||
|
|
|
| |||||
Noncontrolling interests | 2 | 2 | ||||||
|
|
|
| |||||
Total equity (deficit) | (1,508 | ) | (1,072 | ) | ||||
|
|
|
| |||||
Total liabilities and equity (deficit) | $ | 7,820 | $ | 8,039 | ||||
|
|
|
| |||||
6
Domus Holdings (Realogy Corp)
Exhibit E
Revision of Prior Period Financial Statements
In connection with the preparation of our Registration Statement, we identified and corrected an error in the manner in which we had allocated the purchase price paid by Apollo subsequent to their 2007 acquisition. Specifically, we inappropriately identified the discounted cash flows generated from the Real Estate Franchise Services franchise agreement with NRT as a separately identifiable indefinite lived intangible asset. We concluded that the value ascribed to this agreement should have been attributed to the value of the indefinite lived tradenames owned by the Real Estate Franchise Services business unit. Accordingly, we corrected our error through the elimination of the Real Estate Franchise Services franchise agreement with NRT intangible asset and increased the value associated with our tradenames. In accordance with accounting guidance found in ASC 250-10 (SEC Staff Accounting Bulletin No. 99, Materiality), we assessed the materiality of the errors and concluded that the errors were not material to any of our previously issued financial statements. In accordance with the accounting guidance in ASC 250-10 (SEC Staff Accounting Bulletin No. 108, Considering the Effects of Prior Year Misstatements when Quantifying Misstatements in Current Year Financial Statements), we have revised all affected periods. These non-cash errors had no impact to our consolidated statement of operations or cash flows for any of the periods presented.
The following table presents the effect the revision had on the Consolidated Balance Sheet at December 31, 2011 and 2010:
| December 31, 2011 | ||||||||||||
| (in millions) | ||||||||||||
| As Previously Reported | Adjustment | As Revised | ||||||||||
Goodwill | $ | 2,614 | $ | (14 | ) | $ | 2,600 | |||||
Trademarks | 732 | 1,169 | 1,901 | |||||||||
Franchise agreements, net | 2,842 | (1,145 | ) | 1,697 | ||||||||
Total Assets | 7,810 | 10 | 7,820 | |||||||||
Deferred income taxes | 890 | 10 | 900 | |||||||||
Total Liabilities | 9,318 | 10 | 9,328 | |||||||||
| December 31, 2010 | ||||||||||||
| (in millions) | ||||||||||||
| As Previously Reported | Adjustment | As Revised | ||||||||||
Goodwill | $ | 2,611 | $ | (14 | ) | $ | 2,597 | |||||
Trademarks | 732 | 1,169 | 1,901 | |||||||||
Franchise agreements, net | 2,909 | (1,145 | ) | 1,764 | ||||||||
Total Assets | 8,029 | 10 | 8,039 | |||||||||
Deferred income taxes | 883 | 10 | 893 | |||||||||
Total Liabilities | 9,101 | 10 | 9,111 | |||||||||
7
In determining the intangible asset value for trademarks associated with its owned brokerage operation, the Company first considered the relief from royalties method. The relief from royalties method uses a cost avoidance methodology to determine what costs to a third party are avoided because the Company owns the trademark. This method works very well for a stand-alone trademark holder. For example, Realogy pays Better Homes & Gardens (“BH&G”) and Sotheby’s a fee that ranges from 8.5% to 9.5% for the use of their trademarks. In both of these cases, BH&G and Sotheby’s provide no incremental brand support to the Company beyond the use of its trademark. However, in situations where a trademark holder is a franchisor that also owns and operates franchises, the incremental brand services provided to its company owned operations to support the long term growth of the brand also enhances the value of the trademark. In such a situation, the relief from royalties method does not fully capture this incremental value (i.e. brand support and service to the franchisee), but rather only reflects the costs avoided for a straight-forward licensing arrangement.
In Realogy’s circumstance, Realogy as the trademark holder does not simply license its trademarks but provides incremental services to all of its brokers, including its owned operations, such as technology (e.g., brand websites and electronic access to listings), tools for business lead generation and business growth, programs for sales associate retention and recruiting, training, and national advertising. These incremental services create additional value to the trademarks by enabling brokerages to grow their presence in the market place, which, in turn, enhances brand recognition. For third party franchisees, this latter form of value is captured as part of the value of the contractual rights associated with the third party agreements. For the owned brokerages, this incremental trademark value would not be captured by the relief from royalties method which assumes only cost avoidance and does not consider trademark enhancements derived from incremental services such as those noted above.
Accordingly, with respect to the tradename used by the Company owned brokerages, to determine the value of the tradename, the Company considered an alternate valuation methodology, the excess earnings method, to capture the economic value derived when a company both owns a trademark and owns brokerage operations which utilize that trademark. In this circumstance, the excess earnings method is more appropriate because it incorporates all of the revenue streams and costs associated with supporting a trademark and the related franchise operations to derive the value of the underlying asset on an enterprise wide basis. To determine the stream of cash flows in the excess earnings method, we applied a third party overall franchise royalty rate of 4.85% (which is equal to the average royalty rate charged to Realogy’s independent third party franchisees at the date the Company was acquired) to NRT’s gross revenue. From this number we deducted the operating costs that the trademark holder incurs to support the royalty stream. In addition, we deducted an asset contributory charge relating to the trademark holders use of working capital, assembled workforce and fixed assets.
The intent of GAAP is to recognize the appropriate value of intangible assets prior to the allocation of goodwill. We believe the use of the excess earnings method described above most comprehensively captures the entire value of the trademark to a third party market participant in a purchase transaction. Simply charging a trademark royalty rate (e.g. the BH&G/Sotheby’s third party trademark royalty rate referenced above) against the overall franchise fee of 4.85% for NRT would not accurately reflect the full value of the trademark to the consolidated Realogy entity.
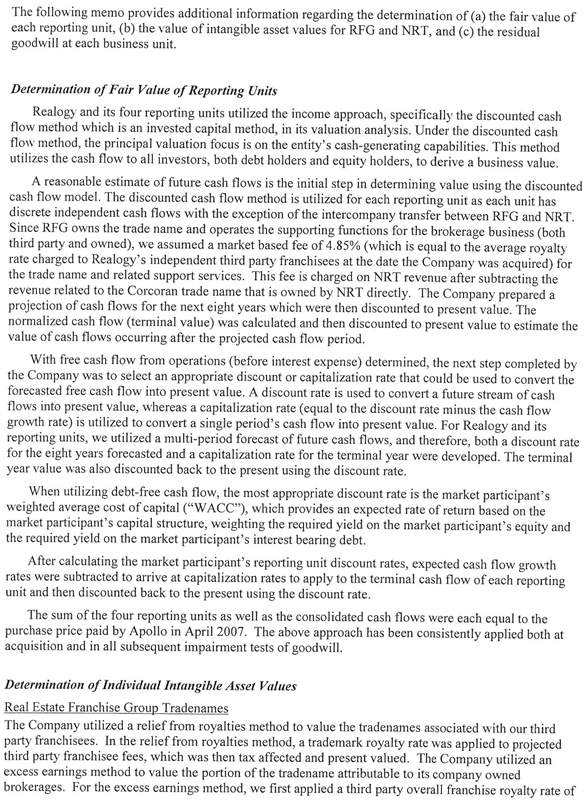
The following memo provides additional information regarding the determination of (a) the fair value of each reporting unit, (b) the value of intangible asset values for RFG and NRT, and (c) the residual goodwill at each business unit. Determination of Fair Value of Reporting Units Realogy and its four reporting units utilized the income approach, specifically the discounted cash flow method which is an invested capital method, in its valuation analysis. Under the discounted cash flow method, the principal valuation focus is on the entity’s cash-generating capabilities. This method utilizes the cash flow to all investors, both debt holders and equity holders, to derive a business value. A reasonable estimate of future cash flows is the initial step in determining value using the discounted cash flow model. The discounted cash flow method is utilized for each reporting unit as each unit has discrete independent cash flows with the exception of the intercompany transfer between RFG and NRT. Since RFG owns the trade name and operates the supporting functions for the brokerage business (both third party and owned), we assumed a market based fee of 4.85% (which is equal to the average royalty rate charged to Realogy’s independent third party franchisees at the date the Company was acquired) for the trade name and related support services. This fee is charged on NRT revenue after subtracting the revenue related to the Corcoran trade name that is owned by NRT directly. The Company prepared a projection of cash flows for the next eight years which were then discounted to present value. The normalized cash flow (terminal value) was calculated and then discounted to present value to estimate the value of cash flows occurring after the projected cash flow period. With free cash flow from operations (before interest expense) determined, the next step completed by the Company was to select an appropriate discount or capitalization rate that could be used to convert the forecasted free cash flow into present value. A discount rate is used to convert a future stream of cash flows into present value, whereas a capitalization rate (equal to the discount rate minus the cash flow growth rate) is utilized to convert a single period’s cash flow into present value. For Realogy and its reporting units, we utilized a multi-period forecast of future cash flows, and therefore, both a discount rate for the eight years forecasted and a capitalization rate for the terminal year were developed. The terminal year value was also discounted back to the present using the discount rate. When utilizing debt-free cash flow, the most appropriate discount rate is the market participant’s weighted average cost of capital (“WACC”), which provides an expected rate of return based on the inarket participant’s capital structure, weighting the required yield on the market participant’s equity and the required yield on the inarket participant’s interest bearing debt. After calculating the inarket participant’s reporting unit discount rates, expected cash flow growth rates were subtracted to arrive at capitalization rates to apply to the terminal cash flow of each reporting unit and then discounted back to the present using the discount rate. The sum of the four reporting units as well as the consolidated cash flows were each equal to the purchase price paid by Apollo in April 2007. The above approach has been consistently applied both at acquisition and in all subsequent impairment tests of goodwill. Determination of Individual Intangible Asset Values Real Estate Franchise Group Tradenames The Company utilized a relief from royalties method to value the tradenames associated with our third party franchisees. In the relief from royalties method, a trademark royalty rate was applied to projected third party franchisee fees, which was then tax affected and present valued. The Company utilized an excess earnings method to value the portion of the tradename attributable to its company owned brokerages. For the excess earnings method, we first applied a third party overall franchise royalty rate of
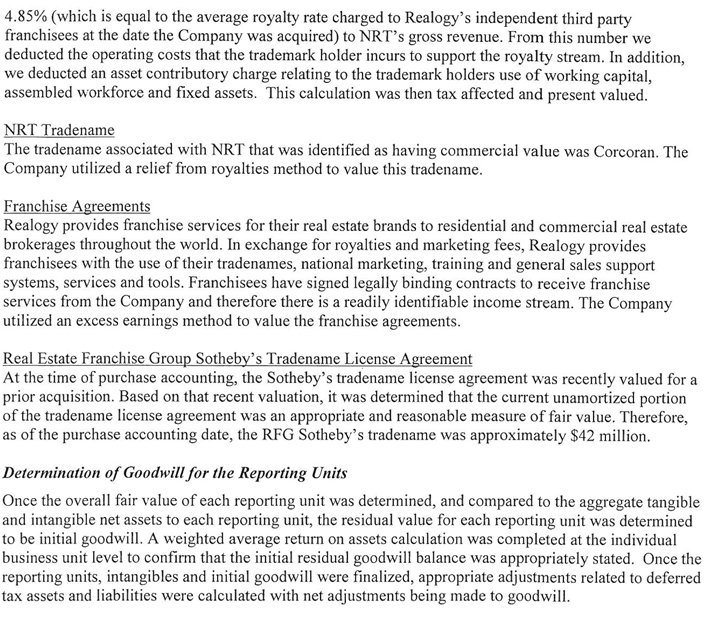
4.85% (which is equal to the average royalty rate charged to Realogy’s independent third party franchisees at the date the Company was acquired) to NRT’s gross revenue. From this number we deducted the operating costs that the trademark holder incurs to support the royalty stream. In addition, we deducted an asset contributory charge relating to the trademark holders use of working capital, assembled workforce and fixed assets. This calculation was then tax affected and present valued. NRT Tradename The tradename associated with NRT that was identified as having commercial value was Corcoran. The Company utilized a relief from royalties method to value this tradename. Franchise Agreements Realogy provides franchise services for their real estate brands to residential and commercial real estate brokerages throughout the world. In exchange for royalties and marketing fees, Realogy provides franchisees with the use of their tradenames, national marketing, training and general sales support systems, services and tools. Franchisees have signed legally binding contracts to receive franchise services from the Company and therefore there is a readily identifiable income stream. The Company utilized an excess earnings method to value the franchise agreements. Real Estate Franchise Group Sothebv’s Tradename License Agreement At the time of purchase accounting, the Sotheby’s tradename license agreement was recently valued for a prior acquisition. Based on that recent valuation, it was determined that the current unamortized portion of the tradename license agreement was an appropriate and reasonable measure of fair value. Therefore, as of the purchase accounting date, the RFG Sotheby’s tradename was approximately $42 million. Determination of Goodwill for tlze Reporting Units Once the overall fair value of each reporting unit was determined, and compared to the aggregate tangible and intangible net assets to each reporting unit, the residual value for each reporting unit was determined to be initial goodwill. A weighted average return on assets calculation was completed at the individual business unit level to confirm that the initial residual goodwill balance was appropriately stated. Once the reporting units, intangibles and initial goodwill were finalized, appropriate adjustments related to deferred tax assets and liabilities were calculated with net adjustments being made to goodwill.

Domus Holdings (Realogy Corp) Annual Impairment Test of Reporting Units October 1,2011 (Amounts in millions) Total Reporting RFGNRTCartusTUGUnits Carrying Value: Goodwill Intangible Assets: Tradenames Franchise Agreements License Agreements Customer Relationships Title Plant Shares Other Intangibles Fixed Assets All Other Assets Current Liabilities (excluding Intercompany)(777)129(721)(42) Other LT Liabilities (excluding Debt)(1,403)(35)(198)(63) Carrying Value of Reporting Unit per Step 1$3,041$957$529$177 Total Fair Value of Reporting Unit4,4982,0501.098328 Excess Fair Value Over Carrying Value Implied Impairment (Y/N)—If yes, proceed t o Step 2NONONONO Indefinite Lived Intangible lmpairment Test: Carrying Value of Tradenames$1,755 Fair Value of Tradenames2,235 Excess Fair Value Over Carrying Value$480
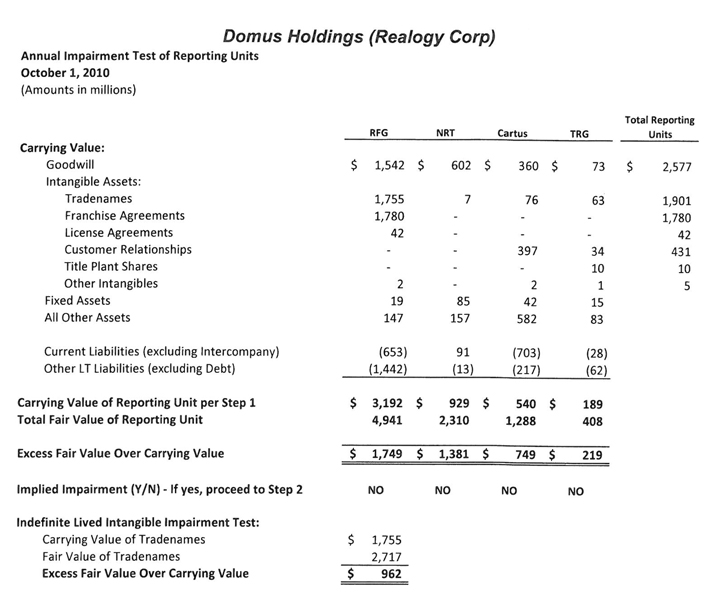
Domus Holdings (Realogy Corp) Annual lmpairment Test of Reporting Units October 1,2010 (Amounts in millions) Total Reporting RFGNRTCartusTRGUnits Carrying Value: Goodwill Intangible Assets: Tradenames Franchise Agreements License Agreements Customer Relationships Title Plant Shares Other Intangibles Fixed Assets All Other Assets Current Liabilities (excluding Intercompany)(653)9 1(703)(28) Other LT Liabilities (excluding Debt)(1,442)(13)(217)(62) Carrying Value of Reporting Unit per Step 1 Total Fair Value of Reporting Unit Excess Fair Value Over Carrying Value Implied Impairment (Y/N)—If yes, proceed t o Step 2NONONONO Indefinite Lived Intangible lmpairment Test: Carrying Value of Tradenames$1,755 Fair Value of Tradenames2,717 Excess Fair Value Over Carrying Value$962
Domus Holdings (Realogy Corp) Annual lmpairment Test of Reporting Units October 1,2009 (Amounts in millions) Total Reporting RFGNRTCartusTRGUnits Carrying Value: Goodwill Intangible Assets: Tradenames Franchise Agreements License Agreements Customer Relationships Title Plant Shares Other Intangibles Fixed Assets All Other Assets Current Liabilities (excluding Intercompany)(410)(12)(570)(30) Other LT Liabilities (excluding Debt)(1,596)24(313)(74) Carrying Value of Reporting Unit per Step 1 Total Fair Value of Reporting Unit Excess Fair Value Over Carrying Value Implied Impairment (YIN)—If yes, proceed t o Step 2NONONONO Indefinite Lived Intangible lmpairment Test: Carrying Value of Tradenames$1,755 Fair Value of Tradenames2,327 Excess Fair Value Over Carrying Value$572
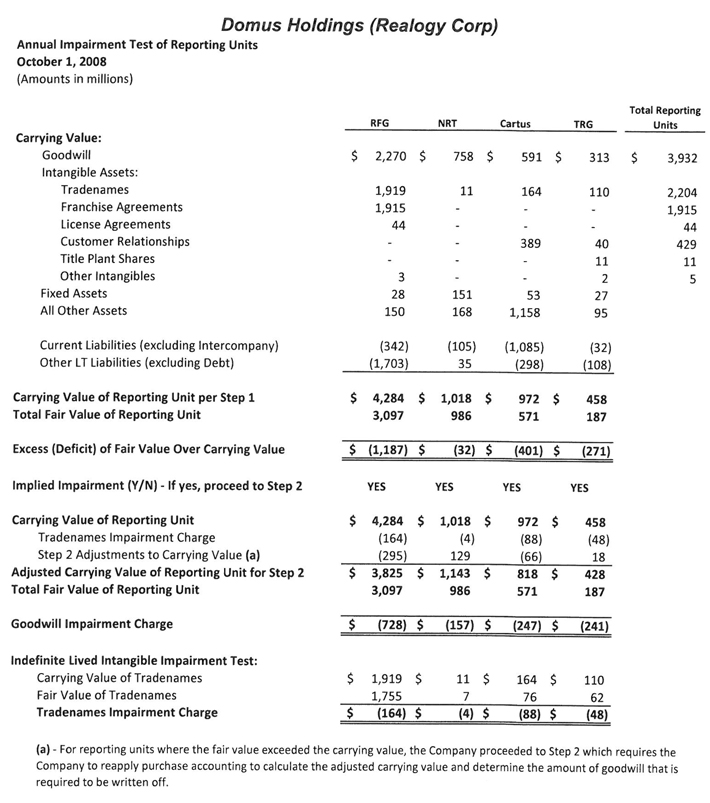
Domus Holdings (Realogy Corp) Annual lmpairment Test of Reporting Units October 1,2008 (Amounts in millions) Total Reporting RFGNRTCartusTRGUnits Carrying Value: Goodwill lntangible Assets: Tradenames Franchise Agreements License Agreements Customer Relationships Title Plant Shares Other Intangibles Fixed Assets All Other Assets Current Liabilities (excluding Intercompany)(342)(105)(1,085)(32) Other LT Liabilities (excluding Debt)(1,703)35(298)(108) Carrying Value of Reporting Unit per Step 1$4,284$1,018$972$458 Total Fair Value of Reporting Unit3,097986571187 Excess (Deficit) of Fair Value Over Carrying Value$(1.187)$(32)$(401)$(271) Implied Impairment (Y/N)—If yes, proceed to Step 2YESYESYESYES Carrying Value of Reporting Unit Tradenames lmpairment Charge Step 2 Adjustments to Carrying Value (a)(295)129(66)18 Adjusted Carrying Value of Reporting Unit for Step 2$3,825$1,143$818$428 Total Fair Value of Reporting Unit3,097986571187 Goodwill lmpairment Charge Indefinite Lived Intangible lmpairment Test: Carrying Value of Tradenames$1,919$115164$110 Fair Value of Tradenames Tradenames lmpairment Charge (a)—For reporting units where the fair value exceeded the carryingvalue, the Company proceeded to Step 2 which requires the Company to reapply purchase accountingto calculate the adjusted carryingvalue and determine the amount of goodwill that is rewired to be written off.
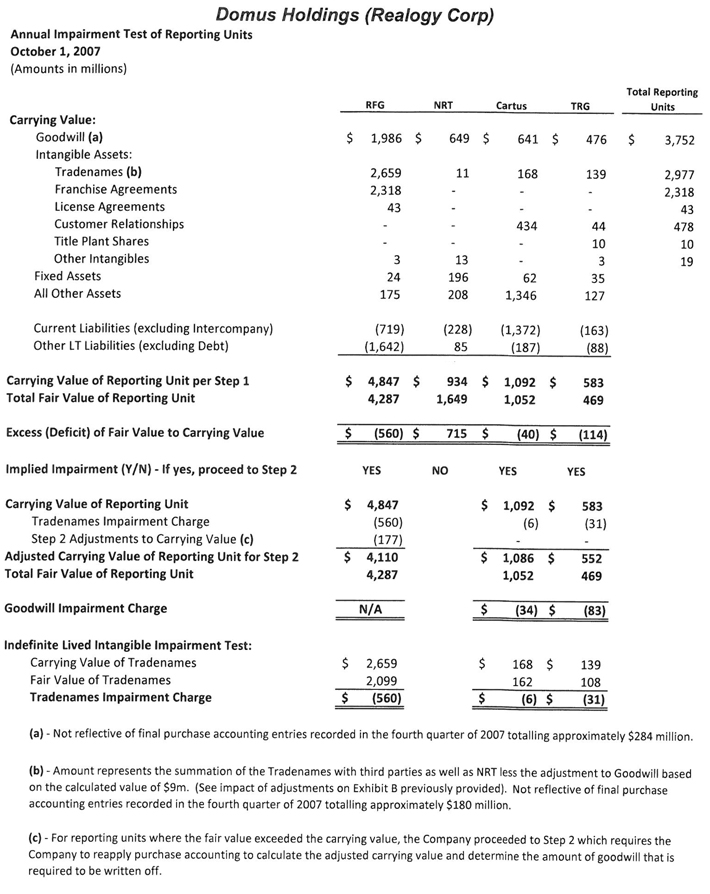
Domus Holdings (Realogy Corp) Annual lmpairment Test of Reporting Units October 1,2007 (Amounts in millions) Total Reporting RFGNRTCartusTRGUnits Carrying Value: Goodwill (a) Intangible Assets: Tradenames (b) Franchise Agreements License Agreements Customer Relationships Title Plant Shares Other Intangibles Fixed Assets All Other Assets Current Liabilities (excluding Intercompany)(719)(228)(1,372)(163) Other LT Liabilities (excluding Debt)(1,642)85(187)(88) Carrying Value of Reporting Unit per Step 1 Total Fair Value of Reporting Unit Excess (Deficit) of Fair Value to Carrying Value Implied Impairment (Y/N)—If yes, proceed to Step 2YESNOYESYES Carrying Value of Reporting Unit Tradenames lmpairment Charge Step 2 Adjustments to Carrying Value (c)(177) Adjusted Carrying Value of Reporting Unit for Step 2$4,110 Total Fair Value of Reporting Unit4,2871,052469 Goodwill Impairment ChargeN/A$(34)$(83) Indefinite Lived Intangible lmpairment Test: Carrying Value of Tradenames$2,659$168$139 Fair Value of Tradenames2,099162108 Tradenames Impairment Charge$(560)$(6)$(31) (a)—Not reflective of final purchase accounting entries recorded in the fourth quarter of 2007 totalling approximately $284 million. (b)—Amount represents the summation of the Tradenames with third parties as well as NRT less the adjustment to Goodwill based on the calculated value of $9m. (See impact of adjustments on Exhibit B previously provided). Not reflective of final purchase accounting entries recorded in the fourth quarter of 2007 totalling approximately $180 million. (c)—For reporting units where the fair value exceeded the carrying value, the Company proceeded to Step 2 which requires the Company to reapply purchase accountingto calculate the adjusted carrying value and determine the amount of goodwill that is required to be written off.
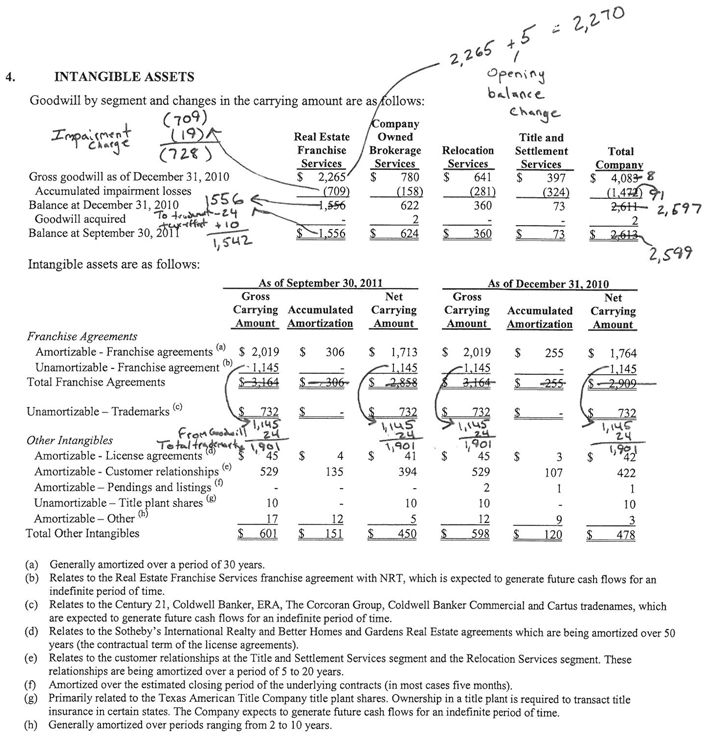
4.INTANGIBLE ASSETS Goodwill by segment Title and Total ServicesServices Gross goodwill as ofDecember 31,2010 Accumulated impairment losses Balance at62236073 2A2 2,599 Intangible assets are as follows: As of Se~tember30.2011As ofDecember 31.2010 GrossNetGrossNet CarryingAccumulatedCarryingCarryingAccumulatedCarrying AmountAmortizationAmountAmountAmortizationAmount Franchise Agreements Amortizable-~ranchiseagreement^’^’$ 2,019$ 306$1,713$ 2,019$255$1,764 Unamortizable—Franchise agreement Total Franchise Agreements Unamortizable—Trademarks Other Intangibles Amortizable—License Amortizable—Customer relationships (‘)529135394529107422 Amortizable- Pendings and listings (a211 Unamortizable—Title plant shares10101010 Amortizable—Other (hl—17 125-1293 Total Other Intangibles—$ 601$ 151$I2598478 (a) Generally amortized over a period of30 years. (b) Relates to the Real Estate Franchise Services franchise agreement with NRT, which is expected to generate future cash flows for an indefinite period of time. (c) Relates to the Century 21, Coldwell Banker, ERA, The Corcoran Group, Coldwell Banker Commercial and Cartus tradenames, which are expected to generate future cash flows for an indefinite period of time. (d) Relates to the Sotheby’s International Realty and Better Homes and Gardens Real Estate agreements which are being amortized over 50 years (the contractual term of the license agreements). (e) Relates to the customer relationships at the Title and Settlement Services segment and the Relocation Servlces segment. These relationships are being amortized over a peiod of 5 to 20 years. (f) Amortized over the estimated closing period of the underlying contracts (in most cases five months). (g) Primady related to the Texas American Title Company title plant shares. Ownership in a title plant is required to transact title insurance in certain states. The Company expects to generate future cash flows for an indefinite period of time. (h) Generally amortized over periods ranging from 2 to 10 years.
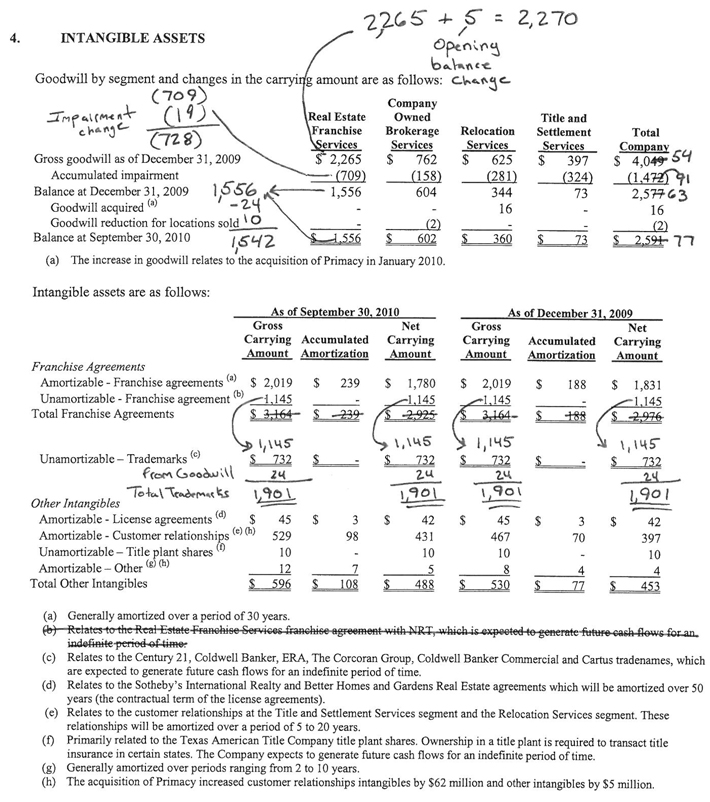
4.INTANGIBLE ASSETS Goodwill by segment and c h ~g e ins the canyi Company ~~ ~ d ( n < *~Title and c~**sCTotal ComDan Gross goodwill as of December 31,2009 Accumulated impairment Balance at December31,20091,5K61,556604344732,579L3 Goodwill acauired (“-2.121616 Goodwill reduction for locations so Balance at September 30,2010l,5-L/2 (a)?he increase in goodwill relates to the acquisition of Primacy in l a n u a ~2010j Intangible assets are as follows: As of September 30.2010As of December 31,2009 GrossNetCrossNet Carrying AccumulatedCarryingCarryingAccumulatedCarrying Amount AmortizationAmountAmountAmortizationAmount Franchise Agreements ~mortizahle-~ranchiseaereements(~)- $ 2.019$239$1.780$2.019$188$1.831 h o r t i z a h l e—Franchise a g r e e m e n t (— l . l 4 5—,—f—il~145 Total Franchise AgreementsLea-h L = = = % & = l,\us\ , \ L \ 5l , l q 5\,IW Unamonizable—Trademarks (“$L$__U L$ -B Goo&;\\Z q-2U2’4A ~ t ‘ . \ T ~ ~ . I=~-k1.96L-m Other Intangibles77 Amortizable—License agreements (d)$45$3$42$45$3$42 Amortizable—Customer relationships (“(‘)5299843146770397 Unamortizable—Title plant shares (‘10101010 Amortizable—Other (p)(h)—12 758-44 Total Other Intangibles$5 96—-$ +$—(a)Generally amortized over aperiod of 30 years.— i A c M & e w (c)Relates to the Century 21, Coldwell Banker, ERA, The Corcoran Group, Coldwell Banker Commercial and Cams tradenames, which are expected to generate future cash flows for an indefinite period of time. (d)Relates to the Sothehy’s International Realty and Better Homes and Gardens Real Estate agreements which will be amortized over 50 years (the contractual term of the license agreements). (e)Relates to the customer relationships at the Title and Settlement Services segment and the Relocation Services segment. These relationshios will be amortized over a oeriod of 5 to 20 years. (0Primarily related to the Texas American Title Company title plant shares. Ownership in a title plant is required to transact title insurance in certain states. The Company expects- to . eenerate future cash flows for an indefinite period of time. (g)Generally amortized over periods ranging fmm 2 to 10 years. (h)The acquisition of Primacy increased customer relationships intangibles by $62 million and other intangibles by $5 million.
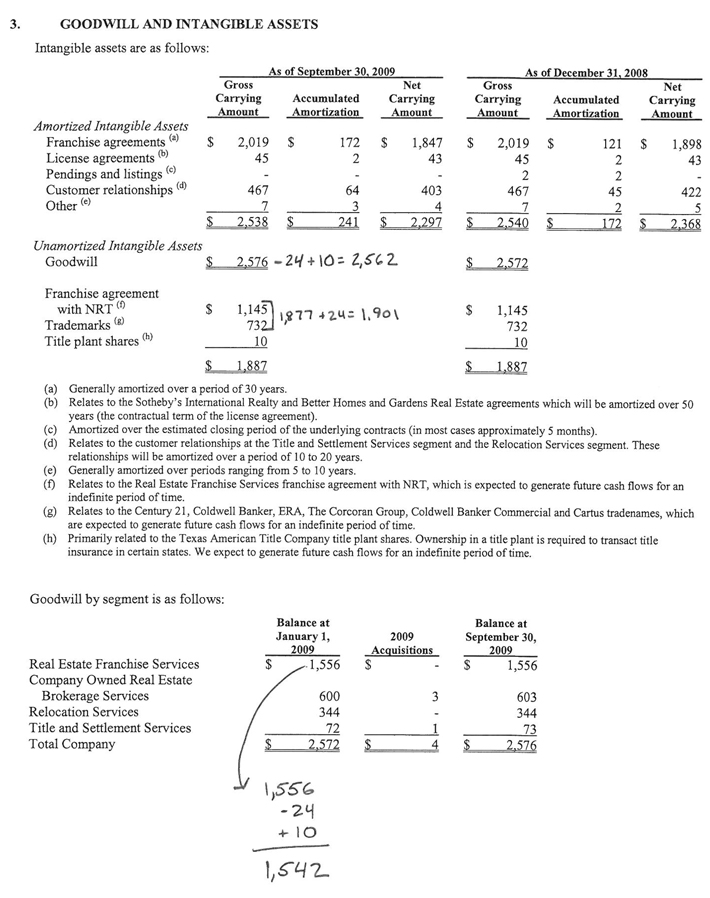
3.GOODWILL AND INTANGIBLE ASSETS Intangible assets are as follows: As of September 30.2009As of December 31,ZOOS GrossNetGrossNet CarryingAccumulatedCarryingCarryingAccumulatedCarrying AmountAmortizationAmountAmountAmortizationAmount Amortized Intangible Assets Franchise agreements (“$2,019 $172$1,847 License agreements (b’45243 Pendings and listings Customer “‘ relationships (“46764403 Other734 $2.538 $241$2.297 Unamortized Intangible Assets Goodwill$2 , 5 7 6—2 ~ + 1 0 = z , 5 6 2 Franchise agreement with NRT ‘“$l.l.3 ip77 414; \,PO\$1,145 Trademarks73732 Title plant shares (“1010 $1.887$1.887 (a)Generally amortized over aperiod of 30 years. (b)Relates to the Sotheby’s International Realty and Better Homes and Gardens Real Estate agreements which will be amortized over 50 years (the contractual term of the license agreement). (c)Amoxtized over the estimated closing period of the underlying contracts (in most cases approximately 5 months). (d)Relates to the customer relationships at the Title and Settlement Servlces segment and the Relocation Services segment. These relationships will be amortized over aperiod of10 to 20 years. (e)Generally amortized over periods ranging from 5 to10 years. (0Relates to the Real Estate Franchise Services franchise agreement with NRT, which is expected to generate future cash flows for an indefinite period of time. (g)Relates to the Century 21, Coldwell Banker, ERA, The Corcoran Group, Coldwell Banker Commercial and Cartus tradenames, which are expected to generate future cash flows for an indefinite period of time. (h)Primarily related to the Texas American Title Company title plant shares. Ownership in a title plant is required to transact title insurance in certain states. We expect to generate future cash flows for an indefinite period of time. Goodwill by segment is as follows: Balance atBalance at January 1,2009September 30, 2009Acquisitions2009 Real Estate Franchise Services-1,556$-$1,556 Company Owned Real Estate Brokerage Services6003603 Relocation Services344344 Title and Settlement Services72173 Total Company2.5724$2576
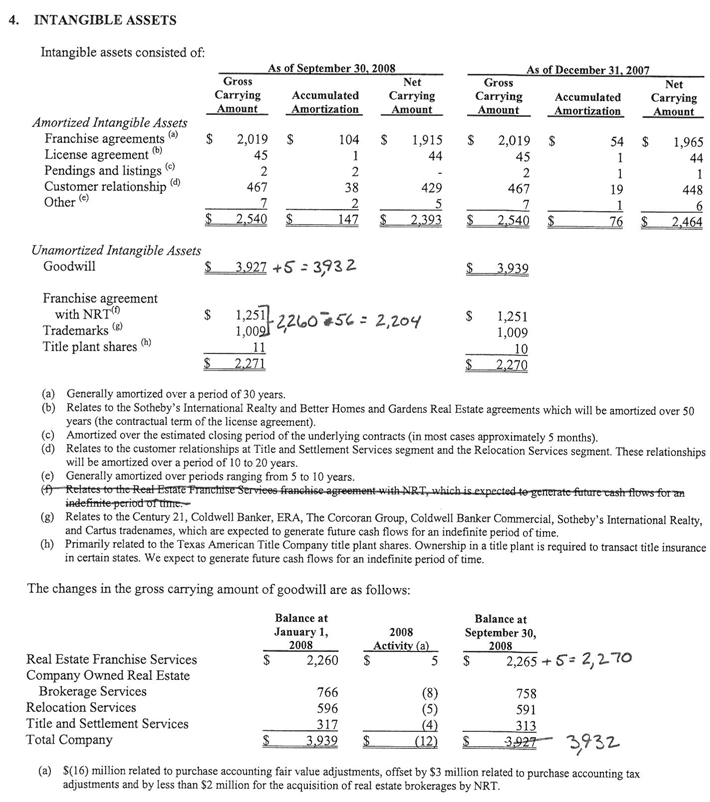
4.INTANGIBLE ASSETS Intaneihle- assets consisted of: As of Se~tember30,2008As of December 31.2007 GrossNetGrossNet CarryingAccumulatedCarryingCarryingAccumulatedCarrying AmountAmortizationAmountAmountAmortizationAmount Amortized Intangible Assets Franchise agreements (‘I$2,019 License agreement @)4 5 Pendings and listings (“2 Customer relationship467 Other (“7 $2.540 Unamortized Intangible Assets Goodwill$3 . 9 2 7 + 5 : 3 7 3 2 Franchise agreement with NRT(O Trademarks$11,OO’ 2 $ U ~ 2~Z,ZOY> ~ ~ Title plant shares11 $2.271 (a)Generally amortized over aperiod of 30 years. fb)Relates to the Sothebv’s International Realty and Better Homes and Gardens Real Estate aneements-which will be amortized over 50 years (the contractualterm of the license agreement). (c)Amortized over the estimated closing period of the underlying contracts (in most cases approximately 5 months). (d)Relates to the customer relationships at Title and Settlement Servlces segment and the Relocation Services segment. These relationships will be amortized over aperiod of 10 to 20 years. (e)Generally amortized overpenods ranging from 5 to 10 years. (g)Relates to the Century 21, Coldwell Banker, ERA, The Corcoran Group, Coldwell Banker Commercial, Sotheby’s International Realty, and Carhls tradenames, which are expected to generate future cash flows for an indefinite period of time. (h)Primarily related to the Texas American Title Company title plant shares. Ownership in a title plant is required to bansact title insurance in certain states. We expect to generate future cash flows for an indefinite period of time. The changes in the gross canying amount of goodwill are as follows: Balance atBalance a t January 1,2008September 30, ZOOSActivitv (a)2008 Real Estate Franchise Services$2.260$5$2.265 + 5’ 2,L7O Company Owned Real Estate Brokerage Services Relocation Services~, Title and Settlement Services317(4)3 1 3 ~ o t a Companyl$3.939$(121$- 3 % ~—3,932 (a)$(16) million related to purchase accounting fair value adjustments, offset by $3 million related to purchase accounting tax adjustments and by less than $2 million for the acquisition of real estate brokerages by NRT.
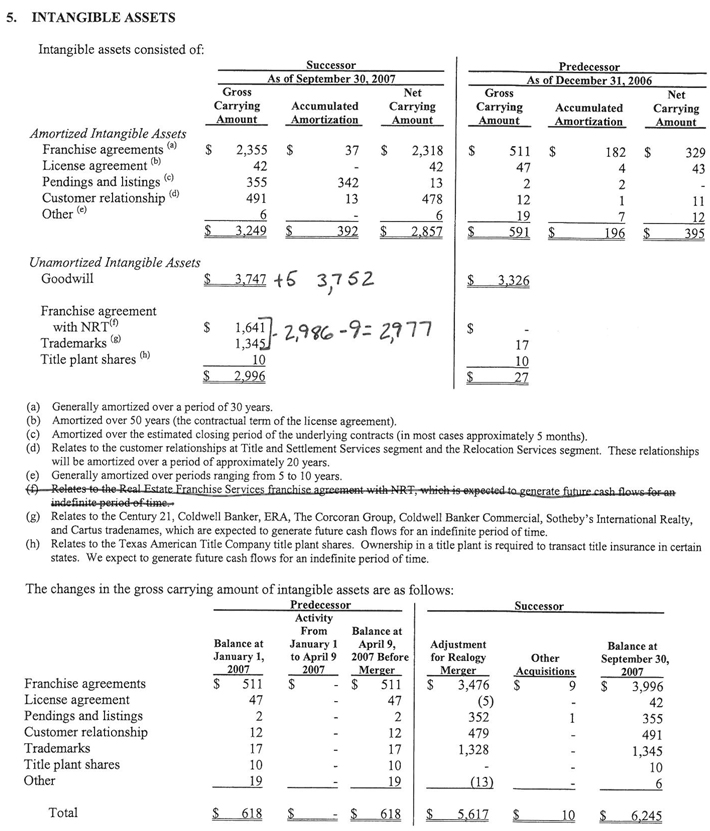
5.INTANGIBLE ASSETS Intangible assets consisted of: SuccessorPredecessor As of Sentember 30.2007As of December 31,2006 GrossNetGrossNet CarryingAccumulatedCarryingCarryingAccumulatedCarrying AmountAmortizationAmountAmountAmortizationAmount Amortized Intangible Assets Franchise agreements (“$2,355$37$2,318$5 1 1$182$329 License agreement @)424247443 Pendings and listings (“3553421322 Customer relationship (“4911 347812111 Other (“ Unamortized Intangible Assets Goodwill~t 37525 Franchise agreement with NRT(“$1,641- 2,986-912,’?77$ Trademarks (g)1,34J17 Title plant shares @)101 0 $2.996u (a)Generally amortized over a period of 30 years. (b)Amortized over 50 years (the contractual term of the license ameement). (c)Amonl2cd 0)cr rhc cst~maredclosing pcriud of :he undcrlylng cuntracrc (In most cases appro~~rcarcly5 monrlw). (d,Kulatcs to rhc 2usromrr re!atlons!up~at I ltlr and Sctrlemcnt Sewlces sepmcnt and the Kclvcnt~unSewlccs scmnenr.- Thcsc rrlat~onshtn; r- will be amortized over aperiod of approximately 20 years. ~~~.(e) Generally amortized over periods ranging from 5 to 10 years. .ate (g)Relates to;he Century 21, Coldwell Banker, ERA, The Corcoran Group, Coldwell Banker Commercial, Sotheby’s International Realty, and Cartus tradenames, which are expected to generate fuhlre cash flows for an indefiniteperiod of time. (h)Relates to the Texas American Title Company title plant shares.Ownership in a title plant is required to transact title insurance in certain states. We expect to generate future cash flows for an indefiniteperiod of time. The changes in the gross carrying amount of intangible assets are as follows: PredecessorSuccessor ActivityI ~ r o mBalance at Balance atJanuary 1April 9,AdjustmentBalance at January 1,to April 92007 Beforefar RealogyOtherSedember 30. 20072007MereerMereerAcauisitians Franchise agreements$511$-$511$3,476$9 License agreement4747(5) Pendings and listings223521 Customer relationship1212479 Trademarks17171,328 Title plant shares1010 Other1919(13) Total$618 $ $6181 $5.617$10$6.245
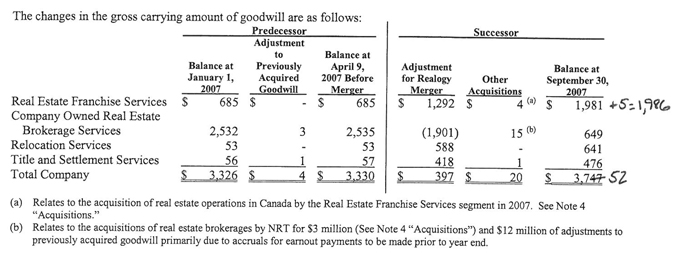
The changes in the gross carrying amount of goodwill are as follows: PredecessorSuceessor Adjustment toBalance at Balance atPreviouslyApril 9,AdjustmentBalance at Januarv 1.Acquired2007 Beforefar Realow-.OtherSeoternber30. 200; ‘~o;dwillMereer1MereerAcquisitions2007 Real Estate Franchise Services$685 %-%685$1.292%4 @ ) %1.981 +s:l?’?L,—Company Owned Real Estate Brokerage Services2,53232,535(1,901)15 @)649 Relocation Services535358864 1 Title and Settlement Services561574181476 Total Company$3.326$4$3.330$397$2$3.743-52 (a)Relates to the acquisition of real estate operations in Canada by the Real Estate Franchise Services segment in 2007. See Note 4 “Acquisitions.” (b)Relates to the acquisitions of real estate brokerages by NRT for $3 million (See Note 4 “Acquisitions”)and $12 million of adjustments to previously acquired goodwill primarily due to accruals for earnout payments to be made prior to year end.
Domus Holdings (Realogy Corp)
Exhibit E
Revision of Prior Period Financial Statements
NRT Franchise Agreement - Revision of Prior Period Financial Statements
In connection with the preparation of our Registration Statement, we identified and corrected an error in the manner in which we had allocated the purchase price paid by Apollo subsequent to their 2007 acquisition. Specifically, we inappropriately identified the discounted cash flows generated from the Real Estate Franchise Services franchise agreement with NRT as a separately identifiable indefinite lived intangible asset. We concluded that the value ascribed to this agreement should have been attributed to the Real Estate Franchise Services business unit as goodwill. Accordingly, we corrected our error through the elimination of the Real Estate Franchise Services franchise agreement with NRT intangible asset and increased the value associated with our goodwill, which resulted in a concurrent decrease in our deferred income tax liability. In accordance with accounting guidance found in ASC 250-10 (SEC Staff Accounting Bulletin No. 99, Materiality), we assessed the materiality of the errors and concluded that the errors were not material to any of our previously issued financial statements. These non-cash errors had no impact to our condensed consolidated statement of operations or cash flows for any of the periods presented in these financial statements.
The following table presents the effect the revision had on the Consolidated Balance Sheet at December 31, 2011 and 2010:
| December 31, 2011 | ||||||||||||
| (in millions) | ||||||||||||
| As Previously Reported | Adjustment | As Revised | ||||||||||
Goodwill | $ | 2,614 | $ | 685 | $ | 3,299 | ||||||
Franchise agreements, net | 2,842 | (1,145 | ) | 1,697 | ||||||||
Total Assets | 7,810 | (460 | ) | 7,350 | ||||||||
Deferred income taxes | 890 | (469 | ) | 421 | ||||||||
Total Liabilities | 9,318 | (469 | ) | 8,849 | ||||||||
Accumulated deficit | (3,511 | ) | 9 | (3,502 | ) | |||||||
| December 31, 2010 | ||||||||||||
| (in millions) | ||||||||||||
| As Previously Reported | Adjustment | As Revised | ||||||||||
Goodwill | $ | 2,611 | $ | 685 | $ | 3,296 | ||||||
Franchise agreements, net | 2,909 | (1,145 | ) | 1,764 | ||||||||
Total Assets | 8,029 | (460 | ) | 7,569 | ||||||||
Deferred income taxes | 883 | (469 | ) | 414 | ||||||||
Total Liabilities | 9,101 | (469 | ) | 8,632 | ||||||||
Accumulated deficit | (3,070 | ) | 9 | (3,061 | ) | |||||||
Change in Total Assets
As a result of the reclassification of the Company’s intangible asset for the NRT franchise agreement to goodwill, the total assets reflected on the 12/31/2011 balance sheet decline $460 million. This is primarily due to the reversal of a previously established deferred tax liability.
ASC 740 mandates that deferred taxes be provided for temporary differences that arise from a business combination. The differences between the book basis and the tax basis of the assets acquired and liabilities assumed will be temporary differences that result in deferred tax assets (“DTAs”) and deferred tax liabilities (“DTLs”). The offset to the establishment of the DTAs and DTLs is goodwill.
In contrast to this general business combination guidance relating to deferred taxes, ASC 805-740-25-3 prohibits the recognition of a DTL for goodwill that is not deductible for tax purposes.
Originally, when the Company recorded an intangible asset for the NRT franchise agreement, a DTL associated with the intangible asset was also recorded (the offset to which was goodwill).
The net impact of the reclassification of the NRT franchise agreement to goodwill is to reverse the DTL originally established: $1,145 million (NRT franchise agreement, net) × 41% (blended tax rate) = $469 million (the offset to which is goodwill).
Domus Holdings (Realogy Corp)
Annual Impairment Test of Reporting Units
October 1, 2007
(Amounts in millions)
| RFG | NRT | Cartus | TRG | Total Reporting Units | ||||||||||||||||
Carrying Value: | ||||||||||||||||||||
Goodwill(a) | $ | 2,965 | $ | 649 | $ | 641 | $ | 476 | $ | 4,731 | ||||||||||
Intangible Assets: | ||||||||||||||||||||
Tradenames(b) | 1,027 | 11 | 168 | 139 | 1,345 | |||||||||||||||
Franchise Agreements | 2,318 | — | — | — | 2,318 | |||||||||||||||
License Agreements | 43 | — | — | — | 43 | |||||||||||||||
Customer Relationships | — | — | 434 | 44 | 478 | |||||||||||||||
Title Plant Shares | — | — | — | 10 | 10 | |||||||||||||||
Other Intangibles | 3 | 13 | — | 3 | 19 | |||||||||||||||
Fixed Assets | 24 | 196 | 62 | 35 | ||||||||||||||||
All Other Assets | 174 | 209 | 1,346 | 127 | ||||||||||||||||
Current Liabilities (excluding Intercompany) | (719 | ) | (228 | ) | (1,372 | ) | (163 | ) | ||||||||||||
Other LT Liabilities (excluding Debt) | (996 | ) | 85 | (187 | ) | (88 | ) | |||||||||||||
|
|
|
|
|
|
|
| |||||||||||||
Carrying Value of Reporting Unit per Step 1 | $ | 4,839 | $ | 935 | $ | 1,092 | $ | 583 | ||||||||||||
Total Fair Value of Reporting Unit | 4,287 | 1,649 | 1,052 | 469 | ||||||||||||||||
|
|
|
|
|
|
|
| |||||||||||||
Excess (Deficit) of Fair Value to Carrying Value | $ | (552 | ) | $ | 714 | $ | (40 | ) | $ | (114 | ) | |||||||||
|
|
|
|
|
|
|
| |||||||||||||
Implied Impairment (Y/N) - If yes, proceed to Step 2 | YES | NO | YES | YES | ||||||||||||||||
Carrying Value of Reporting Unit | $ | 4,839 | $ | 1,092 | $ | 583 | ||||||||||||||
Indefinite Lived Intangibles Impairment Charge | (93 | ) | (6 | ) | (31 | ) | ||||||||||||||
Step 2 Adjustments to Carrying Value(c) | (69 | ) | — | — | ||||||||||||||||
|
|
|
|
|
| |||||||||||||||
Adjusted Carrying Value of Reporting Unit for Step 2 | $ | 4,677 | $ | 1,086 | $ | 552 | ||||||||||||||
Total Fair Value of Reporting Unit | 4,287 | 1,052 | 469 | |||||||||||||||||
|
|
|
|
|
| |||||||||||||||
Goodwill Impairment Charge | $ | (390 | ) | $ | (34 | ) | $ | (83 | ) | |||||||||||
|
|
|
|
|
| |||||||||||||||
Indefinite Lived Intangible Impairment Test: | ||||||||||||||||||||
Carrying Value of Indefinite Lived Intangibles | $ | 1,027 | $ | 168 | $ | 139 | ||||||||||||||
4Q Purchase Accounting Adjustment | (210 | ) | — | — | ||||||||||||||||
Fair Value of Indefinite Lived Intangibles | 724 | 162 | 108 | |||||||||||||||||
|
|
|
|
|
| |||||||||||||||
Indefinite Lived Intangibles Impairment Charge | $ | (93 | ) | $ | (6 | ) | $ | (31 | ) | |||||||||||
|
|
|
|
|
| |||||||||||||||
| (a) | Not reflective of final purchase accounting entries recorded in the fourth quarter of 2007 totalling approximately $309 million. |
| (b) | Amount represents the summation of the Tradenames with third parties as well as NRT less the adjustment to Goodwill based on the calculated value of $9m. (See impact of adjustments on Exhibit B previously provided). Not reflective of final purchase accounting entries recorded in the fourth quarter of 2007 totalling approximately $210 million. |
| (c) | For reporting units where the fair value exceeded the carrying value, the Company proceeded to Step 2 which requires the Company to reapply purchase accounting to calculate the adjusted carrying value and determine the amount of goodwill that is required to be written off. |
Domus Holdings (Realogy Corp)
Annual Impairment Test of Reporting Units
October 1, 2008
(Amounts in millions)
| RFG | NRT | Cartus | TRG | Total Reporting Units | ||||||||||||||||
Carrying Value: | ||||||||||||||||||||
Goodwill | $ | 2,874 | $ | 758 | $ | 591 | $ | 313 | $ | 4,536 | ||||||||||
Intangible Assets: | ||||||||||||||||||||
Tradenames | 724 | 11 | 164 | 110 | 1,009 | |||||||||||||||
Franchise Agreements | 1,915 | — | — | — | 1,915 | |||||||||||||||
License Agreements | 44 | — | — | — | 44 | |||||||||||||||
Customer Relationships | — | — | 389 | 40 | 429 | |||||||||||||||
Title Plant Shares | — | — | — | 11 | 11 | |||||||||||||||
Other Intangibles | 3 | — | — | 2 | 5 | |||||||||||||||
Fixed Assets | 28 | 151 | 53 | 27 | ||||||||||||||||
All Other Assets | 147 | 168 | 1,158 | 95 | ||||||||||||||||
Current Liabilities (excluding Intercompany) | (342 | ) | (105 | ) | (1,085 | ) | (32 | ) | ||||||||||||
Other LT Liabilities (excluding Debt) | (1,221 | ) | 35 | (298 | ) | (108 | ) | |||||||||||||
|
|
|
|
|
|
|
| |||||||||||||
Carrying Value of Reporting Unit per Step 1 | $ | 4,172 | $ | 1,018 | $ | 972 | $ | 458 | ||||||||||||
Total Fair Value of Reporting Unit | 3,097 | 986 | 571 | 187 | ||||||||||||||||
|
|
|
|
|
|
|
| |||||||||||||
Excess (Deficit) of Fair Value Over Carrying Value | $ | (1,075 | ) | $ | (32 | ) | $ | (401 | ) | $ | (271 | ) | ||||||||
|
|
|
|
|
|
|
| |||||||||||||
Implied Impairment (Y/N) - If yes, proceed to Step 2 | YES | YES | YES | YES | ||||||||||||||||
Carrying Value of Reporting Unit | $ | 4,172 | $ | 1,018 | $ | 972 | $ | 458 | ||||||||||||
Indefinite Lived Intangibles Impairment Charge | (138 | ) | (4 | ) | (88 | ) | (48 | ) | ||||||||||||
Step 2 Adjustments to Carrying Value(a) | (304 | ) | 129 | (66 | ) | 18 | ||||||||||||||
|
|
|
|
|
|
|
| |||||||||||||
Adjusted Carrying Value of Reporting Unit for Step 2 | $ | 3,730 | $ | 1,143 | $ | 818 | $ | 428 | ||||||||||||
Total Fair Value of Reporting Unit | 3,097 | 986 | 571 | 187 | ||||||||||||||||
|
|
|
|
|
|
|
| |||||||||||||
Goodwill Impairment Charge | $ | (633 | ) | $ | (157 | ) | $ | (247 | ) | $ | (241 | ) | ||||||||
|
|
|
|
|
|
|
| |||||||||||||
Indefinite Lived Intangible Impairment Test: | ||||||||||||||||||||
Carrying Value of Indefinite Lived Intangibles | $ | 724 | $ | 11 | $ | 164 | $ | 110 | ||||||||||||
Fair Value of Indefinite Lived Intangibles | 586 | 7 | 76 | 62 | ||||||||||||||||
|
|
|
|
|
|
|
| |||||||||||||
Indefinite Lived Intangibles Impairment Charge | $ | (138 | ) | $ | (4 | ) | $ | (88 | ) | $ | (48 | ) | ||||||||
|
|
|
|
|
|
|
| |||||||||||||
| (a) | For reporting units where the fair value exceeded the carrying value, the Company proceeded to Step 2 which requires the Company to reapply purchase accounting to calculate the adjusted carrying value and determine the amount of goodwill that is required to be written off. |
Domus Holdings (Realogy Corp)
Annual Impairment Test of Reporting Units
October 1, 2009
(Amounts in millions)
| RFG | NRT | Cartus | TRG | Total Reporting Units | ||||||||||||||||
Carrying Value: | ||||||||||||||||||||
Goodwill | $ | 2,241 | $ | 603 | $ | 344 | $ | 73 | $ | 3,261 | ||||||||||
Intangible Assets: | ||||||||||||||||||||
Tradenames | 586 | 7 | 76 | 63 | 732 | |||||||||||||||
Franchise Agreements | 1,847 | — | — | — | 1,847 | |||||||||||||||
License Agreements | 43 | — | — | — | 43 | |||||||||||||||
Customer Relationships | — | — | 368 | 35 | 403 | |||||||||||||||
Title Plant Shares | — | — | — | 10 | 10 | |||||||||||||||
Other Intangibles | 3 | — | — | 1 | 4 | |||||||||||||||
Fixed Assets | 22 | 103 | 42 | 20 | ||||||||||||||||
All Other Assets | 141 | 157 | 497 | 70 | ||||||||||||||||
Current Liabilities (excluding Intercompany) | (410 | ) | (12 | ) | (570 | ) | (30 | ) | ||||||||||||
Other LT Liabilities (excluding Debt) | (1,117 | ) | 24 | (313 | ) | (74 | ) | |||||||||||||
|
|
|
|
|
|
|
| |||||||||||||
Carrying Value of Reporting Unit per Step 1 | $ | 3,356 | $ | 882 | $ | 445 | $ | 168 | ||||||||||||
Total Fair Value of Reporting Unit | 4,498 | 1,956 | 806 | 418 | ||||||||||||||||
|
|
|
|
|
|
|
| |||||||||||||
Excess Fair Value Over Carrying Value | $ | 1,142 | $ | 1,074 | $ | 361 | $ | 250 | ||||||||||||
|
|
|
|
|
|
|
| |||||||||||||
Implied Impairment (Y/N) - If yes, proceed to Step 2 | NO | NO | NO | NO | ||||||||||||||||
Domus Holdings (Realogy Corp)
Annual Impairment Test of Reporting Units
October 1, 2010
(Amounts in millions)
| RFG | NRT | Cartus | TRG | Total Reporting Units | ||||||||||||||||
Carrying Value: | ||||||||||||||||||||
Goodwill | $ | 2,241 | $ | 602 | $ | 360 | $ | 73 | $ | 3,276 | ||||||||||
Intangible Assets: | ||||||||||||||||||||
Tradenames | 586 | 7 | 76 | 63 | 732 | |||||||||||||||
Franchise Agreements | 1,780 | — | — | — | 1,780 | |||||||||||||||
License Agreements | 42 | — | — | — | 42 | |||||||||||||||
Customer Relationships | — | — | 397 | 34 | 431 | |||||||||||||||
Title Plant Shares | — | — | — | 10 | 10 | |||||||||||||||
Other Intangibles | 2 | — | 2 | 1 | 5 | |||||||||||||||
Fixed Assets | 19 | 85 | 42 | 15 | ||||||||||||||||
All Other Assets | 147 | 157 | 582 | 83 | ||||||||||||||||
Current Liabilities (excluding Intercompany) | (653 | ) | 91 | (703 | ) | (28 | ) | |||||||||||||
Other LT Liabilities (excluding Debt) | (963 | ) | (13 | ) | (217 | ) | (62 | ) | ||||||||||||
|
|
|
|
|
|
|
| |||||||||||||
Carrying Value of Reporting Unit per Step 1 | $ | 3,201 | $ | 929 | $ | 540 | $ | 189 | ||||||||||||
Total Fair Value of Reporting Unit | 4,941 | 2,310 | 1,288 | 408 | ||||||||||||||||
|
|
|
|
|
|
|
| |||||||||||||
Excess Fair Value Over Carrying Value | $ | 1,740 | $ | 1,381 | $ | 749 | $ | 219 | ||||||||||||
|
|
|
|
|
|
|
| |||||||||||||
Implied Impairment (Y/N) - If yes, proceed to Step 2 | NO | NO | NO | NO | ||||||||||||||||
Domus Holdings (Realogy Corp)
Annual Impairment Test of Reporting Units
October 1, 2011
(Amounts in millions)
| RFG | NRT | Cartus | TRG | Total Reporting Units | ||||||||||||||||
Carrying Value: | ||||||||||||||||||||
Goodwill | $ | 2,241 | $ | 624 | $ | 360 | $ | 73 | $ | 3,298 | ||||||||||
Intangible Assets: | ||||||||||||||||||||
Tradenames | 586 | 7 | 76 | 63 | 732 | |||||||||||||||
Franchise Agreements | 1,713 | — | — | — | 1,713 | |||||||||||||||
License Agreements | 41 | — | — | — | 41 | |||||||||||||||
Customer Relationships | — | — | 365 | 29 | 394 | |||||||||||||||
Title Plant Shares | — | — | — | 10 | 10 | |||||||||||||||
Other Intangibles | 2 | 3 | — | — | 5 | |||||||||||||||
Fixed Assets | 18 | 79 | 38 | 14 | ||||||||||||||||
All Other Assets | 150 | 152 | 609 | 93 | ||||||||||||||||
Current Liabilities (excluding Intercompany) | (777 | ) | 129 | (721 | ) | (42 | ) | |||||||||||||
Other LT Liabilities (excluding Debt) | (924 | ) | (36 | ) | (198 | ) | (63 | ) | ||||||||||||
|
|
|
|
|
|
|
| |||||||||||||
Carrying Value of Reporting Unit per Step 1 | $ | 3,050 | $ | 958 | $ | 529 | $ | 177 | ||||||||||||
Total Fair Value of Reporting Unit | 4,498 | 2,050 | 1,098 | 328 | ||||||||||||||||
|
|
|
|
|
|
|
| |||||||||||||
Excess Fair Value Over Carrying Value | $ | 1,448 | $ | 1,092 | $ | 569 | $ | 151 | ||||||||||||
|
|
|
|
|
|
|
| |||||||||||||
Implied Impairment (Y/N) - If yes, proceed to Step 2 | NO | NO | NO | NO | ||||||||||||||||
Domus Holdings (Realogy Corp)
Exhibit B
| As Reported | Open Balance 4/10/07 | Impairment / Tax Impact | 12/31/07 | Impairment Impact | 12/31/08 | |||||||||||||||
Selected Balance Sheet Items DR/(CR): | ||||||||||||||||||||
RFG Goodwill | 2,265 | — | 2,265 | (709 | ) | 1,556 | ||||||||||||||
RFG Tradenames | 817 | (93 | ) | 724 | (138 | ) | 586 | |||||||||||||
RFG Franchise Agreement with NRT | 1,671 | (420 | ) | 1,251 | (106 | ) | 1,145 | |||||||||||||
Deferred Tax Liability Associated with Intangibles | (1,001 | ) | 206 | (795 | ) | 86 | (709 | ) | ||||||||||||
Net Impact to Retained (Earnings) / Deficit | — | 307 | 307 | 867 | 1,174 | |||||||||||||||
Selected Statement of Operations Items: | ||||||||||||||||||||
Impairment Associated with RFG Assets | 513 | 953 | ||||||||||||||||||
Income Tax Expense / (Benefit) | (206 | ) | (86 | ) | ||||||||||||||||
|
|
|
| |||||||||||||||||
Impact to Net Loss / (Income) | 307 | 867 | ||||||||||||||||||
|
|
|
| |||||||||||||||||
| As Revised | Open Balance 4/10/07 | Impairment / Tax Impact | 12/31/07 | Impairment / Tax Impact | 12/31/08 | |||||||||||||||
Selected Balance Sheet Items DR/(CR): | ||||||||||||||||||||
RFG Goodwill | 3,264 | (390 | ) | 2,874 | (633 | ) | 2,241 | |||||||||||||
RFG Tradenames | 817 | (93 | ) | 724 | (138 | ) | 586 | |||||||||||||
RFG Franchise Agreement with NRT | — | — | — | — | — | |||||||||||||||
Deferred Tax Liability Associated with Intangibles | (329 | ) | 38 | (291 | ) | 51 | (240 | ) | ||||||||||||
Net Impact to Retained Earnings / (Deficit) | — | 445 | 445 | 720 | 1,165 | |||||||||||||||
Selected Statement of Operations Items: | ||||||||||||||||||||
Impairment Associated with RFG Assets | 483 | 771 | ||||||||||||||||||
Income Tax Expense / (Benefit) | (38 | ) | (51 | ) | ||||||||||||||||
|
|
|
| |||||||||||||||||
Impact to Net Loss / (Income) | 445 | 720 | ||||||||||||||||||
|
|
|
| |||||||||||||||||
| Impact of Adjustments to Balance Sheet and Income Statement | Open Balance 4/10/07 | Impairment / Tax Impact | 12/31/07 | Impairment / Tax Impact | 12/31/08 | |||||||||||||||
Selected Balance Sheet Increase / (Decrease): | ||||||||||||||||||||
RFG Goodwill | 999 | (390 | ) | 609 | 76 | 685 | ||||||||||||||
RFG Tradenames | — | — | — | — | — | |||||||||||||||
RFG Franchise Agreement with NRT | (1,671 | ) | 420 | (1,251 | ) | 106 | (1,145 | ) | ||||||||||||
|
|
|
|
|
|
|
|
|
| |||||||||||
Impact on Assets | (672 | ) | 30 | (642 | ) | 182 | (460 | ) | ||||||||||||
|
|
|
|
|
|
|
|
|
| |||||||||||
Deferred Tax Liability Associated with Intangibles | 672 | (168 | ) | 504 | (35 | ) | 469 | |||||||||||||
Net Impact to Retained Earnings / (Deficit) | — | 138 | 138 | (147 | ) | (9 | ) | |||||||||||||
|
|
|
|
|
|
|
|
|
| |||||||||||
Impact on Liabilities and Equity | 672 | (30 | ) | 642 | (182 | ) | 460 | |||||||||||||
|
|
|
|
|
|
|
|
|
| |||||||||||
Selected Statement of Operations Items: | ||||||||||||||||||||
Impairment Associated with RFG Assets | (30 | ) | (182 | ) | ||||||||||||||||
Income Tax Expense / (Benefit) | 168 | 35 | ||||||||||||||||||
|
|
|
| |||||||||||||||||
Impact to Net Loss / (Income) | 138 | (147 | ) | |||||||||||||||||
|
|
|
| |||||||||||||||||