 Patheon Fiscal 2012 First Quarter Earnings Friday, March 9, 2012 Exhibit 99.2 |
 1 Forward-Looking Statements This presentation contains forward-looking statements or information which reflect our expectations regarding possible events, conditions, our future growth, results of operations, performance, and business prospects and opportunities. All statements, other than statements of historical fact, are forward-looking statements. Forward-looking statements necessarily involve significant known and unknown risks, assumptions and uncertainties that may cause our actual results in future periods to differ materially from those expressed or implied by such forward-looking statements. These risks are described in Item 1A “Risk Factors” in our Annual Report on Form 10-K for the fiscal year ended October 31, 2011 filed with the U.S. Securities and Exchange Commission and with the Canadian Securities Administrators. Accordingly, you are cautioned not to place undue reliance on forward-looking statements. These forward-looking statements are made as of the date hereof, and except as required by law, we assume no obligation to update or revise them to reflect new events or circumstances. Use of Non-GAAP Financial Measures References “Adjusted EBITDA” are to income (loss) before discontinued operations before repositioning expenses, interest expense, foreign exchange losses reclassified from other comprehensive income, refinancing expenses, gains and losses on sale of fixed asset gain on extinguishment of debt, income taxes, asset impairment charge, depreciation and amortization and other income and expenses. Since Adjusted EBITDA is a non-GAAP measure that does not have a standardized meaning, it may not be comparable to similar measures presented by other issuers. You are cautioned that these non-GAAP measures should not be construed as alternatives to net income (loss) determined in accordance with GAAP as indicators of performance. Adjusted EBITDA is used by management as an internal measure of profitability. We have included these measures because we believe that this information is used by certain investors to assess our financial performance, before non-cash charges and certain costs that we do not believe are reflective of its underlying business. An Adjusted EBITDA reconciliation of these amounts to the closest U.S. GAAP measure is included in the appendix. |
 • Financial results • Transformation update • Q&A Agenda 2 |
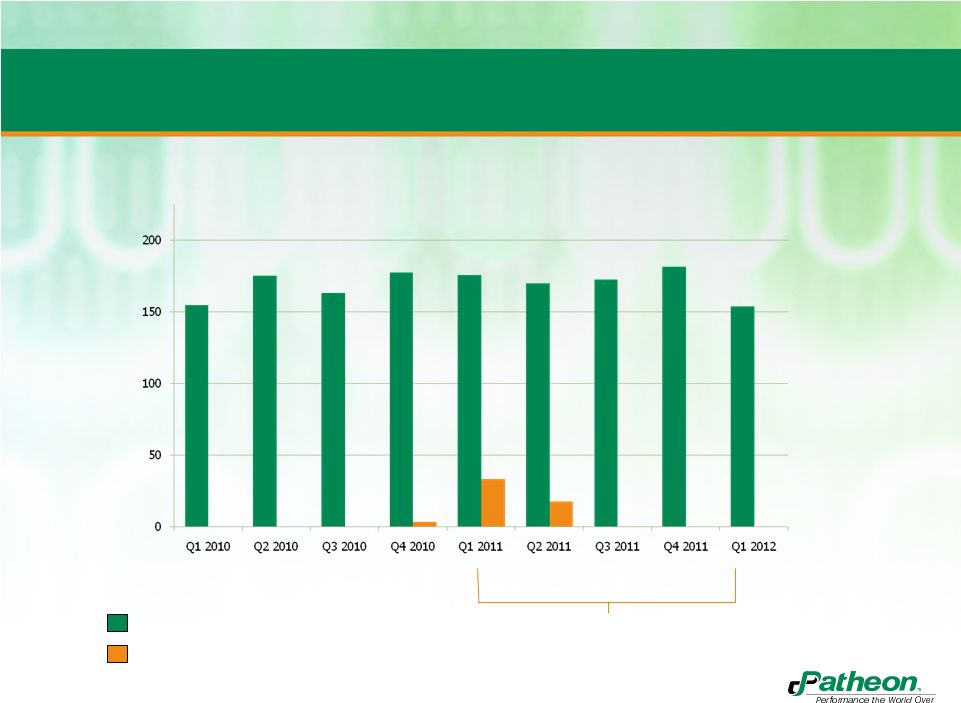 Associated with cancellation of a manufacturing agreement Financial Overview (U.S. GAAP) 7.8% revenue growth excluding the benefit from contract cancellation REVENUE (U.S. $ in millions) Reported revenue including the benefit from the contract cancellation 3 |
 Financial Overview (U.S. GAAP) (U.S.$ in millions) Reported Adjusted EBITDA includes the benefit from the contract cancellation and the additional expense from consulting fees 4 |
 5 Summary Balance Sheet and Cash Flow (U.S. GAAP) (U.S.$ in millions) 2012 - Q1 2011 - Q4 Cash and cash equivalents 32.5 33.4 A/R 125.0 158.0 Inventory 83.0 81.8 Capital assets 458.6 474.2 Total assets 784.1 824.6 AP and accrued liabilities 176.8 181.5 Total debt 284.0 287.3 Total deferred revenue 38.1 36.5 Other long-term liabilities 51.4 53.7 Total liabilities 577.1 586.9 Shareholders' equity 207.0 237.7 Cash flow from operations 9.9 11.2 Cash used from investing (6.5) (16.6) Period ended liquidity* 126.3 128.3 *Comprised of cash and cash equivalents and undrawn lines of credit. |
 6 Our Situation Today #2 market share in CMO #1 market share in PDS Below average financial performance Good reputation with customers but uneven operational performance 6 |
 7 Our Goal #1 market share in PDS #1 market share in CMO, with above market growth Top quartile financial performance and improved profitability Best reputation in quality, delivery and cost competitiveness 7 |
 8 Five Commitments Provide the industry’s leading customer experience. Operate our business in a disciplined, responsible, and ethical fashion such that our shareholders will appreciate superior returns over time. Provide the best technical and scientific solutions to solve difficult development problems and enhance product value. Create a culture of engagement, ownership and a shared commitment to excellence in all that we do. Be the highest quality, most flexible, and lowest cost producer in the world. 8 |
 9 Strategy Our strategy boils down to improving what we do, how we sell, then grow our business into adjacencies inorganically Strengthen core operations Sell business differently Enter logical adjacencies Drive industry consolidation |
 10 Operational excellence roll-out across the organization Increasing efficiency, productivity in our sites - Underway in the U.S. and Canada - Beginning in Europe and Puerto Rico - Centers of Excellence roll-out by site - Expanded the program into SG&A and procurement Strategy – Strengthen the Core Strengthen core operations |
 11 Solution and “targeted” selling build on our strengths Recent successes - SoluPath ™ - Sterile back-up supply - End-to-end solutions provider from PDS to CMO - Strategic partnerships Strategy – Sell the Business Differently Sell business differently |
 Four core dimensions - Value Chain • Early development • Supply chain integration - New capabilities – P-Gels™ and SoluPath™ - Technology – proprietary drug delivery - Geography – emerging markets Enter logical adjacencies Strategy – Enter Local Adjacencies 12 |
 P-Gels™ • Prescription soft gels for North America, Europe and Asia – mutually exclusive for Rx soft gels in the territory – Development services – Cincinnati or Barranquilla – Commercial manufacturing – Barranquilla • Joint selling and execution by Patheon and for our joint opportunities – will be branded as a unique solution -- P-Gels™ • Combines Patheon’s depth and breadth of development services, and customer access, with Softigel’s world-class softgel expertise 13 Softigel |
 Outcomes Provide the industry’s leading customer experience. Operate our business in a disciplined, responsible, and ethical fashion such that our shareholders will appreciate superior returns over time. Provide the best technical and scientific solutions to solve difficult development problems and enhance product value. Create a culture of engagement, ownership and a shared commitment to excellence in all that we do. Outcome equals long-term broad strategic relationships Outcome equals top quartile performance on shareholder returns, and other financial metrics 1 2 3 4 5 Be the highest quality, most flexible, and lowest cost producer in the world. Outcome equals deepening our #1 position in PDS Outcome equals high- performance, high-quality industry leadership 14 |
 Summary • Underlying revenues are growing • Transformation activities are on track • Balance sheet and liquidity are good 15 |
 Q&A 16 |
 Appendix Adjusted EBITDA Bridge (US GAAP) (unaudited) Q1 2010 Q2 2010 Q3 2010 Q4 2010 Q1 2011 Q2 2011 Q3 2011 Q4 2011 Q1 2012 (in millions of U.S. dollars) $ $ $ $ $ $ $ $ $ Adjusted EBITDA 8.3 26.0 20.4 26.2 28.7 12.9 10.3 14.5 (9.2) Depreciation and amortization (14.9) (13.5) (12.6) (14.6) (14.9) (13.5) (12.6) (12.2) (10.6) Repositioning expenses (2.4) (1.0) (2.4) (1.0) (0.9) (0.7) (1.9) (3.5) (0.8) Interest expense, net (3.6) (3.3) (6.3) (6.4) (6.3) (6.4) (6.3) (6.6) (6.5) Impairment charge (1.3) - (2.1) (0.2) - - - - - Refinancing expenses - (11.7) (0.3) (0.2) - - - - - (Loss) gain on sale of fixed assets - (0.1) - (0.1) - (0.2) 0.1 (0.1) - Provision for (benefit from) income taxes 11.8 8.1 (2.5) (3.6) (2.7) (2.1) 4.7 (1.0) 7.7 Other income (expense), net 0.4 0.1 0.3 (0.5) (0.2) (0.3) 6.3 (0.9) 0.1 (Loss) income before discontinued operations (1.7) 4.6 (5.5) (0.4) 3.7 (10.3) 0.6 (9.8) (19.3) 17 |