 Patheon Fiscal 2012 Third Quarter Results September 13, 2012 Exhibit 99.2 |
 1 Forward-Looking Statements This presentation contains forward-looking statements or information which reflect our expectations regarding possible events, conditions, our future growth, results of operations, performance, and business prospects and opportunities. All statements, other than statements of historical fact, are forward-looking statements. Forward-looking statements necessarily involve significant known and unknown risks, assumptions and uncertainties that may cause our actual results in future periods to differ materially from those expressed or implied by such forward-looking statements. These risks are described in our 2011 Form 10-K, and our other filings with the U.S. Securities and Exchange Commission and with the Canadian Securities Administrators. Accordingly, you are cautioned not to place undue reliance on forward-looking statements. These forward-looking statements are made as of the date hereof, and except as required by law, we assume no obligation to update or revise them to reflect new events or circumstances. Use of Non-GAAP Financial Measures These slides contain references to the following non-GAAP measures: (1) “Adjusted EBITDA” which is income (loss) before discontinued operations before repositioning expenses, interest expense, foreign exchange losses reclassified from other comprehensive income, refinancing expenses, gains and losses on sale of fixed assets, gain on extinguishment of debt, income taxes, asset impairment charge, depreciation and amortization and other income and expenses; and (2) “Adjusted EBITDA Excluding Certain Items,” which is “Adjusted EBITDA” excluding the consulting fees associated with the strategic initiatives. Since Adjusted EBITDA and Adjusted EBITDA before certain items are non-GAAP measures that do not have a standardized meaning, they may not be comparable to similar measures presented by other issuers. You are cautioned that these non-GAAP measures should not be substituted for income (loss) before discontinued operations as indicators of performance. We have included these measures because we believe that this information is used by certain investors to assess our financial performance, before non-cash charges and certain costs that we do not believe are reflective of our underlying business. In addition, Adjusted EBITDA is used by management as an internal measure of profitability. Reconciliations of these non-GAAP measures to the closest U.S. GAAP measures are included in the Appendix to this presentation. |
 • Highlights • Financial results • Transformation update • Conclusion Agenda 2 |
 Third Quarter Highlights 18 percent revenue growth 115 percent gross profit – 236 percent Adjusted EBITDA increases Increasing revenue guidance – exceeding $735 million Transformation continues to yield benefits 3 |
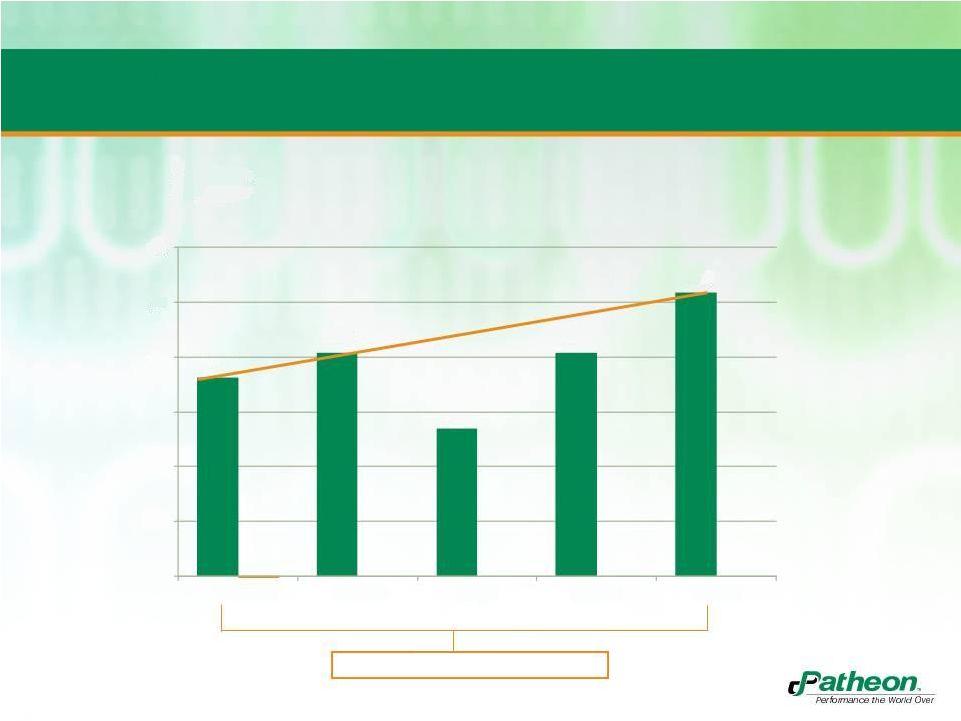 Continued Quarterly Growth Revenue (U.S. $ in millions) 4 172.7 181.6 153.9 181.5 203.7 100 120 140 160 180 200 220 Q3 2011 Q4 2011 Q1 2012 Q2 2012 Q3 2012 18% yr-yr revenue growth |
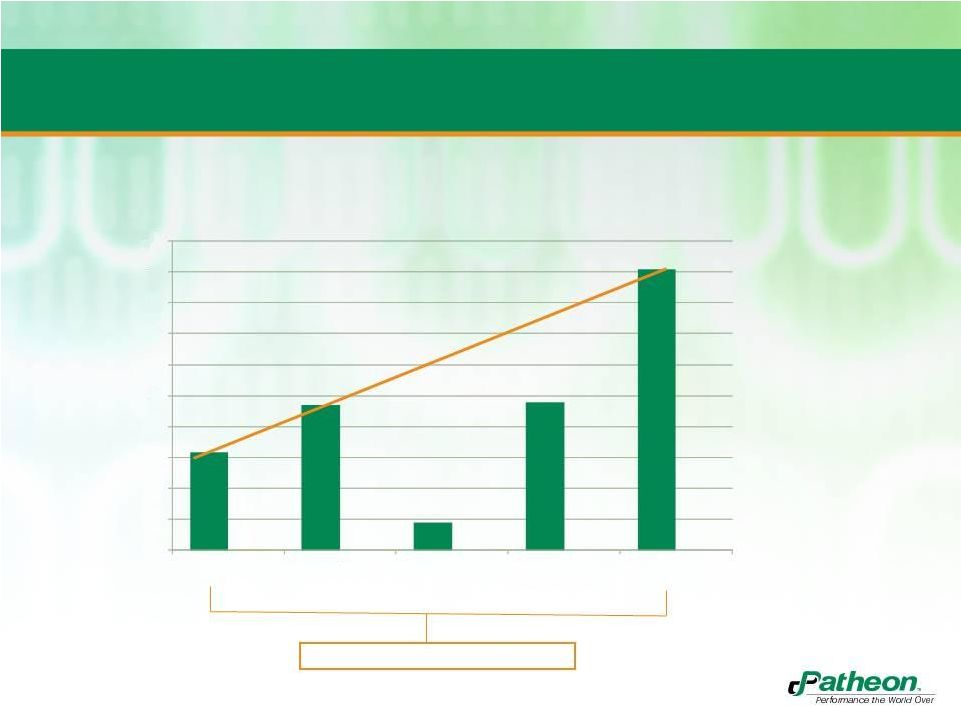 Strong Conversion To Gross Profit Gross Profit (U.S. $ in millions) 115% yr-yr gross profit growth 5 25.8 33.5 14.4 34.0 55.5 10 15 20 25 30 35 40 45 50 55 60 Q3 2011 Q4 2011 Q1 2012 Q2 2012 Q3 2012 |
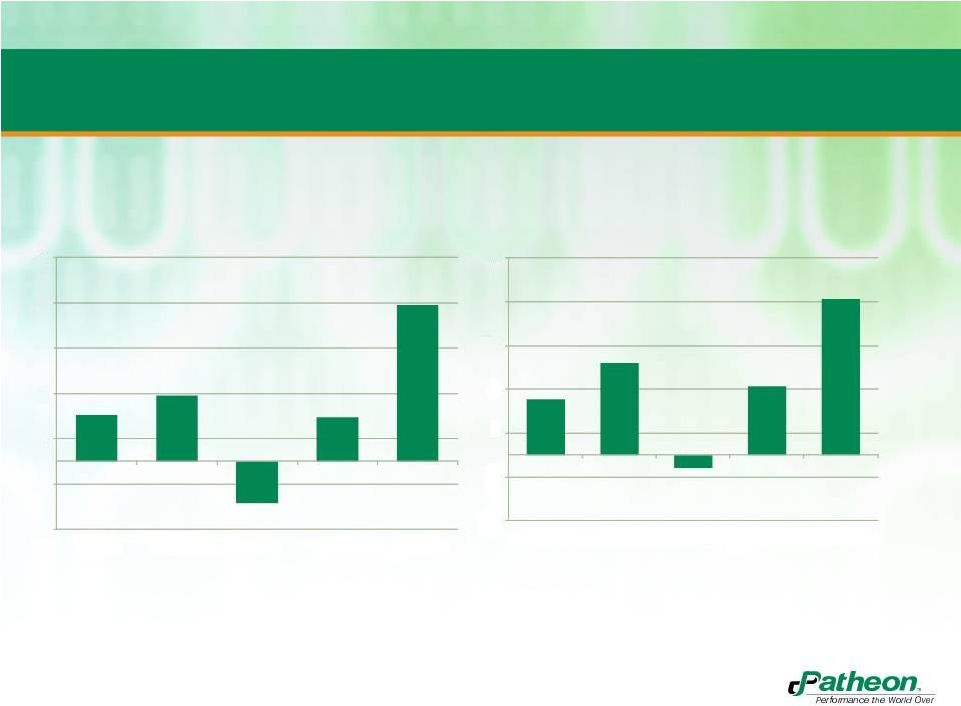 Solid Progress With Adjusted EBITDA Adjusted EBITDA (U.S. $ in millions) Adjusted EBITDA Excluding Certain Items (U.S. $ in millions) 6 -15 -5 5 15 25 35 45 Q3 2011 Q4 2011 Q1 2012 Q2 2012 Q3 2012 -15 -5 5 15 25 35 45 Q3 2011 Q4 2011 Q1 2012 Q2 2012 Q3 2012 10.3 14.5 (9.2) 9.7 34.6 12.8 21.0 (2.9) 15.7 35.6 |
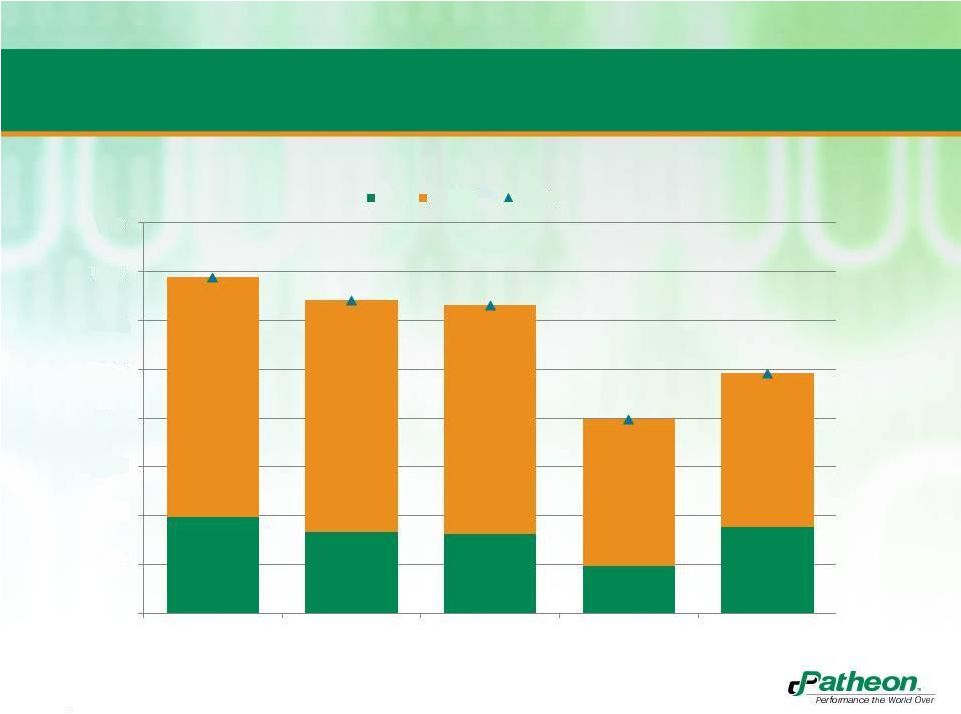 Sufficient Liquidity to Manage Business $ in Millions 7 39.5 33.4 32.5 19.6 35.4 98.2 94.9 93.8 60.1 63.0 137.7 128.3 126.3 79.7 98.4 - 20.0 40.0 60.0 80.0 100.0 120.0 140.0 160.0 3Q11 4Q11 1Q12 2Q12 3Q12 Cash Availability Liquidity |
 8 Summary Financial Results Three months ended July 31, Statement of Operations 2012 2011 (in millions of U.S. dollars) $ $ Revenues 203.7 172.7 Gross Profit 55.5 25.8 Selling, general and administrative expenses 29.9 31.7 Operating income (loss) 25.5 (7.7) Income before discontinued operations 15.5 0.6 Adjusted EBITDA 34.6 10.3 Balance Sheets Q3 2012 Q4 2011 Cash 35.4 33.4 Total Debt (LT & ST) 317.0 287.3 Undrawn lines of credit 63.0 94.9 |
 9 Strategic Roll Out is Advancing • OE programs have de-bottlenecked revenue capacity • Drove gross profit and adjusted EBITDA increased in Q3 • Clinical packaging business sale • Rolled-out Solupath and Sterile Back-up Supply programs • Patheon Certified Consultants STRENGTHEN CORE OPERATIONS • Early development lab • P-Gels brand softgel offering launched in Q2 ENTER LOGICAL ADJACENCIES • The CMO market will consolidate – but progress has been slow DRIVE INDUSTRY CONSOLIDATION SELL BUSINESS DIFFERENTLY |
 10 Summary • Growing revenues and improving margins • Transformation activities continue to benefit our financial results and are on track • Balance sheet and liquidity are good • Raising top-line guidance |
 11 Thank You |
 12 Appendix Adjusted EBITDA and Adjusted EBITDA Excluding Certain Items (unaudited) Q3 2011 Q4 2011 Q1 2012 Q2 2012 Q3 2012 (in millions of U.S. dollars) $ $ $ $ $ Income (loss) before discontinued operations 0.6 (9.8) (19.3) (79.6) 15.5 Depreciation and amortization 12.6 12.2 10.6 10.8 9.3 Repositioning expenses 1.9 3.5 0.8 6.0 0.1 Interest expense, net 6.3 6.6 6.5 6.5 6.8 Impairment charge - - - 57.9 - (Gain) loss on sale of capital assets (0.1) 0.1 - - - (Benefit from) provision for income taxes (4.7) 1.0 (7.7) 8.0 3.3 Other (6.3) 0.9 (0.1) 0.1 (0.4) Adjusted EBITDA 10.3 14.5 (9.2) 9.7 34.6 Consulting 2.5 6.5 6.3 6.0 1.0 Adjusted EBITDA excluding certain items 12.8 21.0 (2.9) 15.7 35.6 |