QuickLinks -- Click here to rapidly navigate through this document
Exhibit 99.1
Excerpts from Preliminary Offering Memorandum, dated November 18, 2019
Our Company
Audio is hot, and we are the number one audio media company in the U.S. based on consumer reach.
Within audio, there are two segments:
- •
- The 'music collection' segment, which essentially replaced downloads and CDs, and
- •
- The radio—'companionship'—segment, in which people look to audio, starting with broadcast radio and the personalities there, as their friends and companions.
We serve this second segment and have used our large scale and national reach in broadcast radio to build additional complementary platforms. We are now the only major multi-platform audio media company, with each platform building on and extending our companionship relationship with the consumer.
Our product strategy is 'be where our listeners are with the products and services they expect from us'. Our reach now extends across more than 250 platforms and over 2,000 different connected devices—and that reach continues to grow.
The platforms we lead in are:
- •
- Broadcast radio: We have never been stronger with consumers, and our broadcast radio assets reach more consumers today than ever. Our broadcast radio audience is almost twice as large as that of the next largest commercial broadcast radio company, as measured by Nielsen.
- •
- Digital: Our iHeartRadio digital platform is the number one streaming broadcast radio platform—with more than six times the digital listening hours of the next largest commercial broadcast radio company, as measured by Triton.
- •
- Podcasts: We are the number one commercial podcast publisher—and we are more than twice the size of the next largest commercial podcaster as measured by downloads, according to Podtrac.
- •
- Social media: Our personalities, stations and brands have a social footprint that includes 211 million fans and followers as measured by Shareablee, which is almost nine times the size of the next largest commercial broadcast audio media company. This social footprint was at the heart of delivering 310 billion social media impressions for our recent iHeartRadio Music Awards and its associated activities.
- •
- Events: We have over 20,000 local live events per year and eight major nationally-recognized tentpole events, which provide significant opportunities for consumer promotion, advertising and social amplification.
We have been able to unify all of our local brands under a master brand—iHeartRadio. Using that umbrella has allowed us to build our other platforms as well as extend into third-party platforms like Snapchat, YouTube and cable and broadcast television.
Our business model has been to build strong consumer relationships at scale and monetize them by renting those relationships to unaffiliated third parties. We are transforming our sales process to be more competitive with the major digital players that have brought data, targeting and technology into the media buying process. Additionally, we have built out a strong marketing sales function to support the marketing needs of advertisers and agencies in addition to the more traditional media buying transactional relationships.
1
iHeart is the leader in audio media built upon the strength of our broadcast assets
Broadcast radio holds a unique place in American culture. Consumers listen to the radio because the voice on the other side sounds like a friend. It is this companionship relationship that has withstood the test of time. As a result, radio has been characterized by Deloitte as having Revenue, Reach, and Resilience. Broadcast radio continues to reach more Americans each week than any other medium. While live and time-shifted television's weekly reach has dropped to 86% among U.S. adults—and is now only 74% for the Millennial audience in the U.S.—radio's weekly reach has remained steady (since the 1970s) at over 90% for persons aged 18+, and today reaches over 90% of Millennials and 86% of Generation Z weekly in the U.S., according to Nielsen's Q1 2019 Total Audience Report. Additionally, the mean age of broadcast radio's heaviest users tends to be almost 11 years lower than the mean age of television's heaviest users, according to Scarborough, and radio offers the unique influence of a friend and word-of-mouth, giving it a distinct creative advantage over television, print and digital. Technology has expanded the opportunities to listen to the radio in the car, at work and at home, with new devices such as smart speakers, smart phones, gaming consoles and smart televisions.
iHeartMedia is the leader in the audio media sector in the U.S. We have a greater reach than any other media company in the U.S. with our broadcast radio assets alone, with our monthly reach of 276 million listeners aged 6+ (derived from a Nielsen measurement to enable like-to-like comparisons with digital media companies) representing an audience greater than the digital audience of Google (258 million, including YouTube) and Facebook (220 million, including Instagram and Messenger) in the U.S. as measured by Comscore in September 2019. We believe our advantage is driven by our unique ability to build relationships and engage a broad spectrum of audiences and demographics as we fulfill listeners' need for companionship and to be connected with the world. We believe we have proven that we are the companion of choice through our strong engagement, with listeners spending on average 30 minutes a day with our programming, content and personalities (derived from Nielsen measurements) relative to Google's engagement time of 26 minutes (excluding YouTube) and Facebook's engagement time of 18 minutes per visitor per day on average (excluding Instagram and Messenger) (derived from Comscore's monthly minutes per visitor measurement in September 2019). Additionally, the Company is able to serve key audiences through individual radio formats targeted to desirable lifestyle and taste segments.
The backbone of the Company is our portfolio of 856 live broadcast radio stations and a local sales force servicing approximately 160 U.S. markets, including 48 of the top 50 markets (with three markets embedded in larger markets), and 86 of the top 100 markets (with four markets embedded in larger markets). According to Nielsen's Spring 2019 book, we have the most number one ranked stations across the top 160 markets, and across the largest 50 markets, with 74 and 28 number one ranked stations in these markets, respectively. With our broadcast radio platform alone, we have almost twice the broadcast radio audience of our next closest broadcast competitor. We also have more than six times the digital listening hours of our next closest commercial radio broadcast competitor. Our scale, diverse audience platforms and unique value proposition for advertisers result in our higher ratio of share of radio revenue to share of audience of 1.5x for the 2018 fiscal year, relative to Cumulus (1.2x) and Entercom (1.2x) as derived from measurements by Miller Kaplan, Media Monitors, and Nielsen.
We believe that, unlike other broadcast radio companies, iHeartMedia has a national reach platform as opposed to only a portfolio of local markets. To monetize that, we have built a sizable national sales force that further enables us to compete for advertising dollars that have not traditionally been allocated to broadcast radio. We believe that this dedicated sales team, which works directly with clients and agencies, enables us to create unique marketing partnerships that allow advertisers to coordinate national-scale campaigns while also leveraging our local footprint, consumer relationships and other consumer platforms, including podcasting, events, social and digital. Additionally, we own
2
Katz Media ("Katz"), a leading media representation firm which services other radio companies, television companies and digital players for national advertising.
A critical element of the unique and powerful consumer bond with radio is our radio personalities. These personalities have a strong connection with their listeners, as evidenced by the fact that 73% of respondents to iHeartMedia's Power of Personalities Survey perceive a deep connection with their favorite personality; in addition, 66% of respondents have considered purchasing a product recommended by their favorite personality. Our relationship with the consumer is further enhanced by the production and distribution of syndicated media content (for iHeartMedia stations and for affiliated stations) through our Premiere Networks business. Premiere Networks is a leading audio content syndicator, covering talk, politics, sports, entertainment, etc. and includes nationally-recognized talent such asRyan Seacrest, Rush Limbaugh, Sean Hannity, Elvis Duran, Steve Harvey, Bobby Bones, Delilah, The Breakfast Club, Nancy Grace, Big Boy, Enrique Santos, Ellen K andColin Cowherd. In addition, we are the number one source of real-time traffic and weather content on broadcast radio through ourTotal Traffic & Weather Network, providing advertisers with yet another national reach platform which, according to Nielsen, provides access to almost every commuter in America.
Our strategy is to be everywhere our listeners want us to be—making us the number one multi-platform audio media company
Our strategy is to be everywhere our listeners want to find us by having a presence on all major and emerging platforms. We are the leader across various audiences and platforms, and we believe our differentiated reach, national footprint with local execution, best-in-class engagement and shared infrastructure provide us with a strong foundation and operating efficiencies as we expand onto new platforms.
iHeartMedia Is America's #1 Audio Media Company By Reach
And the Only Major Multi-Platform Audio Company
Multi-Platform Audience/Usage (Millions)
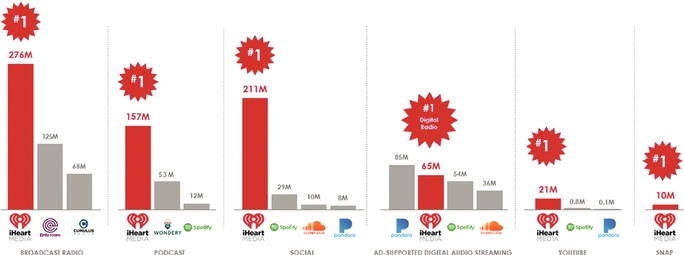
Sources:
Broadcast Radio: Spring 2019 Nielsen Audio Nationwide—Monthly Reach People 6+.
Commercial Podcasts: Podtrac Ranker October 2019, Global download & streams; Spotify podcast downloads based on gimletmedia.com
3
Social: Shareablee September 2019. Includes fans and followers of iHeartMedia's stations, brands and personalities. May include some duplication.
Digital Audio Streaming: comScore media-metrix; total audience September 2019; ad-enabled audience estimates based on Pandora and Spotify SEC Filings. Reflects iHeartMedia's position with respect to digital streaming of our radio stations (and not with respect to general digital audio streaming).
Youtube: YouTube Analytics dashboard September 2019. Pandora: Comscore Video Metric September 2019. Spotify: Shareablee September 2019.
Snap: Snapchat CMS Dashboard September 2019 (global).
In addition, we have developed an iconic master brand that resonates across our diverse geographical markets and unifies our multiple platforms and local brands. The creation of the "iHeartRadio" master brand has allowed us to consolidate all our consumer products under the iHeartRadio banner and create a highly recognizable brand with strong consumer awareness, according to an IPSOS study commissioned by us. Today, iHeart brand aided awareness is 85%, in line with other widely recognized consumer brands such as Spotify at 90% and Pandora at 92%. We have evidence that both advertisers and consumers have grown to value the "iHeartRadio" brand, which is associated with consistent quality and improved satisfaction. Today, the "iHeartRadio" brand is an iconic powerhouse in the audio industry that underpins our multi-platform strategy as evidenced by:
- •
- Our Leadership in Digital Radio Streaming: We deliver broadcast radio and custom radio (with a small on-demand component) to 135 million registered users on the iHeartRadio service and app on over 250 platforms and over 2,000 different connected devices—including smart speakers, digital auto dashes, tablets, wearables, smartphones, virtual assistants, televisions and gaming consoles. This digital audience is more than six times larger than the digital listening hours of the next largest commercial broadcaster. In addition to the iHeart streaming product, the Company also has more than 800 station and personality websites reaching tens of millions of consumers monthly, and we license the iHeartRadio service and brand to international partners in Mexico, Canada, Australia and New Zealand.
- •
- Our Prominence in Live Events: We have over 20,000 local live events per year and eight major nationally-recognized tentpole events: theiHeartRadio Music Festival, theiHeartRadio Music Awards, theiHeartCountry Festival, theiHeartRadio Fiesta Latina, theiHeartRadio Podcast Awards, iHeartRadio ALTer Ego, iHeartRadio Wango Tango and theiHeartRadio Jingle Ball Tour. Our iHeartRadio Music Festival has high brand awareness (61%) among live music events, compared to Coachella (67%) and Lollapalooza (61%) music festivals according to a Q3 2019 IPSOS study commissioned by us. Additionally, we believe our festivals are the most coveted. According to the Q3 2019 IPSOS study, 35% of persons aged 13-49 would most like to attend an iHeartRadio event, greater than Coachella, Lollapalooza, Burning Man Project and SXSW.

- •
- Our Differentiated Social Reach: iHeartMedia's personalities, stations and brands have garnered 211 million social fans and followers as compared to Spotify's 29.4 million and Pandora's 8.3 million, as measured by Shareablee. Our radio personalities engage with their listeners and fans across every major social platform, using technology to extend their deep listener connection and relationships. Furthermore, our "iHeart" branded events provide opportunities for significant social amplification, as evidenced in 2019 when our iHeartRadio Music Awards and associated activities generated 310 billion social media impressions. By building deep
4
engagement on the major social platforms, we believe we have positioned ourselves around the important conversations, making social media today's even more powerful equivalent of the radio call-in phone lines of the past.
Additionally, as of September 2019, the Company had 10 million monthly unique visitors on Snapchat and 21 million monthly unique visitors on YouTube, which we believe are larger than the audiences of the other major audio players on these platforms.
- •
- Our Leadership in Podcasting: Our multi-platform strategy has also enabled us to extend our leadership into the rapidly growing podcasting sector. The 2018 acquisition of Stuff Media, LLC solidified our position as the number one commercial podcast publisher, as measured by monthly downloads and monthly unique listeners according to Podtrac, the industry standard for third-party podcast measurement. We also have the most downloaded podcast of all time as measured by Podtrac, with How Stuff Works at over 1 billion downloads. Overall podcasting industry revenue is expected to increase to $0.7 billion by 2020, according to the IAB, from an estimated $0.4 billion in 2018, a 28% CAGR. We believe iHeartMedia has key capabilities to continue to lead in podcasting driven by the power of our multiple platforms to promote our podcasts to our entire consumer audience as well as to create and grow new podcasts. iHeart is distinguished among podcast publishers by our unique ability to both promote and air our podcasts on broadcast radio, and combine podcast advertising with broadcast advertising to give additional power to advertising messages. We also publish our broadcasts as podcasts, which increases our podcast inventory. We have a 24/7 live channel on the iHeartRadio App carrying the full podcast lineup. The result is low-cost, high-quality programming for stations that builds awareness and demand for featured podcasts. We believe this offering drives consumers to the iHeartRadio service as a podcast destination.
Additionally, we believe we are well-positioned to leverage our iconic brand and enormous reach to benefit from incremental listening growth. As smart speakers are creating an in-home audio hub that enhances radio's reach, developing a leadership position in this category has become a key element of our growth strategy. Smart speaker adoption has seen rapid acceleration, with a 35% penetration rate among U.S. adults in 2019, representing a 180% increase since 2017, as measured by Loup Ventures. This new technology creates a significant opportunity for iHeartMedia, as the 2019 NuVoodoo Ratings Prospect Study indicates that radio listening is one of the top activities on smart speakers, with 39% of respondents using a smart speaker to listen to FM radio, 14% listening to AM radio and 14% listening to podcasts. As of January 2019, smart speaker listening had grown as a share of iHeartRadio's total AM/FM streaming by over 165% as measured by Triton, versus growth of 111% for the overall broadcast radio industry, including iHeartMedia. iHeart's strength with Alexa and other smart speaker listening demonstrates our ability to lead with new technologies and substantially adds to radio listening opportunities in the home.
We also have two radio stations on SiriusXM, which we view primarily as a promotional vehicle since the Sirius subscription-driven revenue model is non-competitive with the Company's strategic direction.
We are developing advanced and efficient monetization platforms with the goal of providing many of the same benefits as the leading digital advertisers
With our continued technology investments and market-leading position, we believe iHeartMedia is poised to transform the broadcast radio industry by bringing digital-like solutions to broadcast radio. In so doing, we believe we can not only differentiate our platforms relative to other radio broadcasters, but also drive revenue growth by gaining share of advertising spend currently that is allocated to other sectors such as television and digital. This potential market capture has the potential to expand the scope of our addressable market beyond U.S. radio advertising budgets.
5
The benefits of audience targeting and programmatic transaction efficiencies hold as true for audio as they do for other media formats. These include superior measurement, increased control and reduced overhead. Using technology to harness and analyze the consumer data we have at our disposal creates a more efficient value proposition for advertisers. iHeartMedia's programmatic advertising capability is derived from our SmartAudio, SoundPoint, and iHeartMedia Analytics data and technology platforms. We continue to invest in these platforms, as evidenced by our 2018 acquisition of Jelli Inc. ("Jelli"), the technology company that powers our SoundPoint programmatic platform. Our broadcast industry-leading digital-like advertising capability has allowed us to provide advanced advertising solutions that can deliver specific audience cohorts to advertisers, as well as attribution and measurement analytics. We believe that our capabilities will transform the way advertisers plan, buy and measure their audio campaigns, making us the preferred tech-enabled broadcast audio advertising platform. Our proprietary solutions include:
- •
- SoundPoint: Our digital-like ad-buying solution that allows clients to view the available broadcast inventory across various cohorts to address their specific needs
- •
- SmartAudio: Our application of data science to aggregate business data from broadcasts and the user insights that come from listeners using our digital platform
- •
- iHeartMedia Analytics: Our tools to present the effectiveness of clients' broadcast radio advertising campaigns by providing detailed digital dashboards on the results of the advertising spend
In addition, we offer local digital services for advertisers under our SLATE banner. Some of these are reseller relationships of key services, including local website maintenance, audience extension products and third-party app advertising inventory. By offering both an at-scale national platform and analytics, as well as local services, we believe we are the best positioned provider to serve advertiser needs among audio companies.
We believe our leadership position provides tangible financial benefits
Our leadership position across multiple platforms and our advancements in our digital-like broadcast advertising capabilities are starting to yield a positive financial impact. For the twelve months ended September 30, 2019, on a pro forma basis, iHeartMedia generated $3.7 billion of Revenue, $122.8 million of Consolidated net income, $474.7 million of Operating income (13% margin) and $1.0 billion of Adjusted EBITDA (27% margin), the highest Adjusted EBITDA margin of any major advertising-supported audio media company. Since 2010, we have outperformed the broadcast radio market on an average annual revenue growth basis by more than 200 basis points relative to the industry average, and in the third quarter ended September 30, 2019, we outperformed the market by approximately 260 basis points relative to the industry average, as measured by Miller Kaplan. As a result of the consummation of the Reorganization, iHeartMedia carries substantially less debt than it has historically, providing the Company with significantly enhanced financial flexibility. With our inherently low maintenance capital expenditures and working capital profile, iHeartMedia expects to generate significant free cash flow and de-lever over time.
Market Opportunity
Audio plays a fundamental role in the daily lives of millions of consumers, connecting them to the world like no other medium. In the multi-tasking reality of modern-day life, audio has become more important than ever. The broader audio advertising sector in the U.S. represents an approximately $19 billion market opportunity including radio, podcasts, and digital, according to an aggregation of market estimates from independent firms including Kagan, Zenith, Magna, Equirus and the IAB. iHeart is uniquely positioned in the audio advertising ecosystem as we touch each of these markets. We also compete in the larger $248 billion U.S. advertising market—inclusive of the $19 billion radio,
6
podcast and digital opportunity—by developing and offering competitive advertising products intended to attract advertising and marketing dollars that might otherwise go to companies in the cable and broadcast television, digital, search, Internet, audio, print, newspaper, sponsorship and other advertising spaces.
Additionally, we believe there are a number of trends in advertising that favor iHeart, including vendor consolidation and the need for solutions-based marketing, data-driven insights and reliability—all of which favor scaled platforms with mass distribution, first party data and a trusted brand, such as iHeart.
We believe there are two segments within the audio media space—music collection, which replaces downloads and CDs, and radio, which provides companionship. While these two segments have co-existed for over half a century, they are different businesses. Music collection is about the individual experience, allowing listeners to escape the world by creating and listening to their own playlists and music selections. Historic examples of the music collection experience include cassette tapes, mixtapes, CDs, LPs and 45 rpm records. Today, examples of music collections include Spotify and Pandora, which have evolved from previous forms of distribution including retail stores, downloads and physical copies. Radio, on the other hand, is a two-way social experience. The radio audience wants to be connected to the outside world, they look for companionship throughout the day, even a friend to share the ride to and from work. Radio is also a source of information that keeps them connected to the world 24/7 and allows them to discover everything from a new trending artist and song to traffic and weather information, celebrity news, new restaurants and social hotspots and trends. According to our Power of Personalities Survey, 80% of listeners in the 18-44 age group discover new music primarily through broadcast radio. While approximately 54% of the radio audience also has a music collection (according to Scarborough), they understand the difference between the two and consumption of both typically moves in parallel. According to our Audio Universe Survey, consistent with our prior Power of Personalities Survey, approximately nine out of ten people surveyed say that they listen to both radio and music collections, but at different times, and for different reasons—acknowledging the difference between these two segments. Therefore, we believe digital audio consumption is "in addition to" and not "instead of" radio, as further evidenced by the fact that despite significant growth in digital audio from 2009 to 2019—from 42 million weekly listeners to 169 million weekly listeners—broadcast radio has also grown in the same period from 239 million weekly broadcast radio listeners to 250 million weekly broadcast radio listeners aged 12+, as measured by Nielsen.
We believe broadcast radio continues to profoundly enrich the lives of listeners and create value for advertisers. Broadcast radio is the most prevalent audio medium, owing to its nearly universal and free access, far reaching penetration, ubiquity across platforms and role as a provider of both nationally and locally relevant programming. Compared with music collection platforms, we believe that when Americans choose radio, they do so primarily because it provides them with a companionship relationship. In a 2017 survey by Bridge Ratings, 75% of listeners said they use broadcast radio explicitly for companionship. The younger demographic also prefers radio. Broadcast radio is the number one mass reach vehicle for teens, with a 93% reach every month. In fact, based on data from Nielsen and MRI, far more teens are reached by radio than by streaming devices or digital players, which supports the view that radio is here to stay with the emerging generation. Furthermore, new platforms and devices have increased radio's momentum and there are several reasons why we believe radio will continue to thrive in the U.S.:
Reach across demographics
Broadcast radio is a mass appeal platform and continues to reach more Americans each week than any other platform across all demographics (teens, Millennials and adults). For example, for Millennials, according to Nielsen, radio has significantly outperformed television's reach with a weekly reach of 90% of the U.S. population versus television's live and time-shifted reach of 74%.
7
Broadcast radio not only reaches more Americans; it also has the largest share of listening. Based on data from Nielsen and Triton, 81% of time spent listening (excluding satellite radio and podcasts) is over broadcast radio. An important element of broadcast radio's reach and share is in-car consumption. Broadcast radio dominates in-car listening, with 84% of car-using respondents indicating radio usage in 2018, the same rate as in 2011, and radio also representing 67% of listening hours in the car in 2018, according to an Edison survey conducted in September 2018. Streaming has replaced CDs and other collection devices in the car, rather than reducing the reach and share of broadcast radio. We believe this dynamic is unlikely to change materially, as a 2017 IPSOS In-Car survey indicates that eight in ten consumers in the U.S. agree that regular AM/FM radios will remain prevalent in cars and only 1% of respondents did not want an AM/FM radio with their next car.
Deep cultural connection with audience
Radio plays a special role in our culture. Nielsen data shows that radio still reaches essentially the same percentage of adults in the U.S. as in the early 1970s, demonstrating the enduring appeal of radio as a unique companionship medium. In contrast, television's weekly reach of adults 18+ has declined from 94% in 2004 to 86% in 2019, and live and time-shifted television's weekly reach among Millennials has also declined, from 91% to 74%, over the same period. In our increasingly multi-tasking lives, we believe that there will be more incremental opportunities for consumers to listen than to watch, and radio will be the major beneficiary of this opportunity. Indeed, according to Nielsen, more than 80% of TV viewers report using other digital devices while watching TV.
Radio continues to offer consumers something different in the form of curated, personality-led audio. The medium is able to offer influencers a word-of-mouth style conversation, which propels audience engagement and connection in a very effective way. According to our Power of Personalities Survey, radio personalities have a unique connection with their listeners. In particular, 79% of survey respondents value the personalities' opinions and perspectives and 66% considered or purchased a product recommended by their favorite personality. This engagement and personal relationship developed between radio personalities and the audience is also evidenced by data from a survey of 294 respondents that we conducted in December 2018 that indicates that broadcast radio is the most trusted medium in America. According to these survey respondents, broadcast radio is 81% more trustworthy than cable television, and two times more trustworthy than online websites and social media.
Additionally, radio has deep and ongoing relationships with recording artists and has a long history of also breaking new artists and music. Radio is the preferred medium for exposure as it leads to mass recognition, ultimately driving an artist's music and concert sales. The 2019 Nielsen Music 360 Study (which is a study of the interaction with music by consumers in the U.S.) and other surveys show that radio remains the number one source for discovering new music, and artists recognize the importance of broadcast radio in their success. We work closely with them on an ongoing basis to build out their marketing and career plans.
Superior value proposition for advertisers
According to Nielsen, radio offers an 10:1 return on advertising spend. Radio typically has lower cost per thousand impressions ("CPMs") on average than other mass reach platforms, which we believe provides another upside opportunity for revenue.
Technology enables adoption and presents significant opportunity
In addition to the virtually universal penetration of radios in cars and strong penetration of homes and offices with traditional radios, technology has enabled radio to now be distributed across an even broader platform base, including smart phones, tablets, wearables, digital dashboards, gaming consoles
8
and smart speakers, ultimately resulting in increased reach and return on investment. Select categories where radio benefits from recent technological advances and innovation include:
- •
- Streaming: There are two types of streaming services—streaming music and streaming radio—and both continue to grow. iHeartRadio offers consumers the ability to stream live radio broadcasts, digital-only radio stations, custom artist stations, and podcasts across a multitude of platforms and has a streaming user base of 135 million registered users.
- •
- Smart Speakers: With current market penetration levels of 35%, a 180% increase since 2017, smart speakers present significant opportunity for radio's growth in the home. Radio is one of the top activities on smart speakers, with 39% of owners using their smart speakers to listen to FM broadcast radio streams, 14% using it for AM radio stations and 14% using it for podcasts, according to NuVoodoo. In addition to existing radios, smart speakers are new devices and create incremental opportunities for additional listening in the home, expanding radio's listening potential.
- •
- Podcasting: Podcasts continue to expand the audio landscape, and the number of users has surged to 90 million in the U.S. in 2019, with 32% of the U.S. population aged 12 and above having listened to a podcast in the last month (compared to 9% in 2008), according to Edison in January 2019. By focusing on this trend, iHeartMedia has become the number one commercial podcast publisher as measured by Podtrac, with 157 million monthly downloads globally and streams and more than 23 million U.S. unique monthly users, in October 2019.
- •
- Big Data and Technology Enabled Advertising Platforms: The next level of efficiency in radio advertising will be supported by the increasing adoption of technology-enabled advertising solutions, including data analytics and targeting and programmatic advertising. New technology solutions will enable agencies to more accurately monitor the success of campaigns and target time slots and stations that are most appropriate for their advertising material. We believe our acquisition of Jelli and our investments in SmartAudio have positioned us to be a leader in this area.
9
Our Competitive Strengths
Reach leader among major U.S. media companies with a diversified, multi-platform strategy
Radio talks to everyone about everything at all times. As a result of its ubiquitous presence (made all the more possible through technology and the emergence of new platforms and devices), ease of use and diversity of audio content, radio has replaced television as the number one reach medium and iHeartMedia's broadcast radio platform has greater reach in the U.S. than either Google or Facebook. We believe iHeartMedia is uniquely positioned within this landscape given the breadth of our portfolio—reaching 91% of Americans monthly through our broadcast radio assets alone. Our connectivity spans all demographics, including 91% of Generation Z and 92% of Millennials each month, highlighting the enduring appeal of radio. Moreover, iHeartMedia's multi-platform approach extends this relationship and national footprint beyond broadcast radio through our 135 million registered digital users, 20,000 annual local live events, 8 million newsletter recipients, 65 million monthly unique visitors in September 2019 to all our digital properties (including station and on-air personality websites) according to Comscore and 211 million social fans and followers across our personalities, stations and brands according to Shareablee. In so doing, we seek to distance ourselves from companies that focus on only one platform in the audio ecosystem by working to be everywhere our consumers are with the products and services they expect from us.
Companionship with our audience creates a deep and engaged relationship in an increasingly fragmented world—and is a different business than 'music collection' or playlist experiences
A listener's music collection or playlist experience often serves to narrowly define an individual, allowing the person a momentary escape from his or her surroundings—however, this is a different business than radio. From our first experience with radio it has always been a social experience we grow up with using together with our family and those closest to us. Audio is woven into the journey of our daily lives, and radio serves as a constant companion that we return to with increasing frequency. Indeed, Nielsen data shows that the average radio listener tunes in seven times daily to just broadcast radio. Radio is also a place for discovery and remains the number one source for discovering new music. The complementary nature of radio is supported by the fact that this statement holds true even for listeners who also use an on-demand digital service—the modern equivalent to a 'music collection'. According to our Power of Personalities Survey, 84% of individuals ages 18 to 44 who regularly use on-demand digital services agreed that radio is the main way they discover new music.
iHeartMedia provides a platform for our listeners to start a conversation in a way that other mediums cannot. Prior generations' experience using telephones to call in to their favorite on-air personality has been supplemented by the exponential growth of social media. Today, listeners can simultaneously interact and contribute their voices to the ongoing on-air dialogue in real time. iHeartMedia's personalities, stations and brands have approximately 211 million social media fans and followers and many of our on-air personalities and stations have hundreds of thousands or millions of independent followers. Our presence on social platforms creates a dual path of connectivity with our audience and source of continuous feedback—we listen, we engage, and we respond.
This two-way relationship helps to create a trusted bond and strong relationship between the listener and our on-air talent. Our Power of Personalities Survey suggests that 73% of our listeners perceive a deep connection with a favorite radio personality and 79% value their opinion and perspectives. We believe this relationship is important to our listeners—and a powerful tool for our advertising partners.
We believe the cumulative impact of these deep relationships yields higher daily consumer engagement for iHeartMedia than premier digital brands, including Google and Facebook. Moreover, our tentpole live events highlight how this passionate engagement translates to massive social moments, with, for example, the 2019 iHeartRadio Music Awards and associated activities generating 310 billion
10
social media impressions. We believe this depth of connectivity not only enriches our listeners' experience—it also delivers insight on our audience and creates unique opportunities for our advertising partners and builds the iHeartRadio brand.
The only major audio media company with a master brand strategy
The iHeartRadio master brand ties together our radio stations, digital platforms, social, podcasts and live events in a unified manner that reflects the quality and compelling nature of our listener experiences. Consumers of both our local station brands and our national platforms trust in the uncompromising commitment to excellence that is associated with our national iHeartRadio brand, and which is expressed through each of our local broadcast stations, which refer to themselves as "an iHeartRadio station". This dynamic creates the powerful combination of broad scope and local focus to not only attract national advertisers, but also to maintain an engrained consumer presence in the most important markets in the country. Our master brand strategy also promotes positive consumer sentiment and brand awareness, when consumers know that the station or event is associated with iHeartRadio. According to the Q3 2019 IPSOS study, our iHeartRadio Music Festival has high brand awareness (61%) among live music events, compared to Coachella (67%) and Lollapalooza (61%) music festivals. Similarly, according to the Q3 IPSOS study, iHeartRadio has 85% aided brand awareness, multiples higher than any broadcast radio company and even higher than Apple Music and SiriusXM. We continue to build and strengthen the iHeartRadio master brand and in so doing enhance the value of all of our assets.
Well-positioned to benefit from incremental listening growth
Audio is hot, with multiple growth drivers. The consumer trend towards increased audio consumption has only been magnified by the proliferation of smart speakers, streaming services and podcasts as a content category. We have the scale and products to benefit from this incremental listening growth and the addition of new audio platforms that can be built as adjuncts to our existing and diversified audio platforms. We are now available on over 250 online and mobile platforms and over 2,000 different types of connected devices, including a leading position on Alexa where iHeartRadio stations were built into the platform and do not need a downloaded skill to access. In fact, according to NuVoodoo, listening to AM/FM radio is one of the top reported activities on smart speakers. This extended access allows our listeners to truly enjoy audio content wherever they are and during all of the experiences that might populate their day. Indeed, we are well-positioned to benefit from the pressures on consumers' time, as listening is more efficient and available than watching or looking in this time-constrained, multi-tasking world. This dynamic not only increases addressable listening hours, but also drives increasing advertising impressions. In the higher at-home listening months of December 2018 and January 2019, Alexa was the largest single source of unique users for iHeartRadio according to our internal Adobe Analytics reporting—larger than iOS, Android or Web.
iHeartMedia also has the ability to add new audio platforms and to expand and promote those platforms through existing iHeart assets. In particular, according to Podtrac, iHeart has become the number one commercial podcast publisher, with 157 million global monthly downloads and streams and more than 23 million U.S. unique monthly users in October 2019. We are also able to leverage the power and scale of radio to advance these new content categories, as exemplified through our recent launches ofThe Ron Burgundy Podcast andDisgraceland Season 3 podcasts (whereby excerpts of the audio series were distributed across our broadcast radio stations and via our social media channels).
11
Networks and industry-leading media representation business extend impact on ecosystem
iHeartMedia maintains both a leading national audio content syndicator (Premiere Networks) and the largest audio network provider of traffic, weather, news and sports reports in the U.S. (Total Traffic & Weather Network), according to Nielsen. Premiere Networks' roster of nationally-recognized on-air talent (includingRyan Seacrest, Rush Limbaugh, Sean Hannity, Elvis Duran, Steve Harvey, Bobby Bones, Delilah, The Breakfast Club, Nancy Grace, Big Boy, Enrique Santos, Ellen K andColin Cowherd) facilitates the type of daily dialogue and content discovery that engenders connectivity with our listeners. Moreover, the Total Traffic & Weather Network reaches more than 2,100 radio stations in over 220 markets and is available to almost every commuter in America. Through Katz, we also serve as an industry-leading media representation firm working with more than 3,200 non-iHeartMedia radio stations, more than 800 television stations and their respective digital platforms, as well as digital-only players such as Spotify. We estimate that in 2018 Katz represented more than 80% of non-iHeartMedia national radio advertising, and nearly 40% of the independent TV industry, excluding owned-and-operated TV and cable TV. We believe our understanding of, and involvement with, all of the components of the audio ecosystem allows iHeartMedia to serve as the informed thought leader in shaping the direction of the industry.
Proprietary audio technology platform drives advertiser return on investment
Through organic investment and strategic acquisitions, iHeartMedia has developed analytic products for our broadcast programmatic advertising platform that enable media buyers to evaluate and purchase radio inventory based on impressions and psychographic cohorts, with associated attribution to prove iHeartMedia's impact. In so doing, we are able to deliver data-driven insights, targeting and analytics for advertisers that mirror the standards established by the major digital players. Our advancements in developing data services and programmatic buying platforms for our broadcast inventory will provide capabilities similar to digital players while increasing efficiency for advertising partners.
Unique music research platform is powerful and proprietary programming asset
We believe we have unique data and research that not only ascertains the popularity of songs by markets—it lets us compare and contrast markets to each other to help us better predict the future success of songs and artists and understand the segments of their appeal. Having this as a tool for our programmers gives them a competitive advantage. Additionally, we are able to use this knowledge and feedback to better help develop artists, working closely with music companies, managers, and directly with the artists themselves. We believe that no other company can provide this combination of services, information and relationships that we provide across all of iHeart's platforms.
Unique combination of reach, engagement and data-driven insight creates bespoke ad inventory
We are able to utilize our multi-platform portfolio of assets, deep engagement with listeners and digital-like analytics and targeting to deliver customized and impactful advertising solutions. The unique combination of reach, engagement, data-driven insights and marketing expertise creates bespoke opportunities for advertisers. This combination improves both our media advertising relationships and our marketing-driven advertising solutions.
Positioned to capture ad spend from other mediums
While audio has been historically disrupted by the digital advertising giants, we believe that our suite of digital data advertising products, coupled with our scale and platform, now provide the assets that enable us to respond to the new advertising world that Facebook and Google pioneered. We believe our proprietary technology and data-enhanced audience insights will enable the Company to
12
access broader marketing budgets, including television and digital advertising budgets, for our existing advertisers, new advertisers and agencies that were previously not accessible. This potential share capture would meaningfully extend our addressable ad market beyond the $19 billion existing pool (as estimated by our aggregation of independent third party sources) of dedicated U.S. audio advertising spend. We believe that radio is under-utilized as an ad medium relative to the time spent on the platform, and that this dynamic is another indication of our potential for growth.
Superior unit economics
Compared to streaming audio services, radio broadcasters have distinct unit economics advantages because unlike radio stations, streaming audio services are required to pay royalties with respect to the public performance of sound recordings. For non-subscription, non-interactive streaming (like radio from simulcasts or iHeartRadio's custom radio feature), the statutory rate set by the Copyright Royalty Board for the period from 2016 to 2020 is currently $0.0018 per performance and the rate for subscription non-interactive streaming is $0.0023 per performance (these rates are subject to annual adjustment based on the Consumer Price Index). Also, interactive streaming services must license the right to use sound recordings in their services privately from sound recording copyright owners. We understand that these royalties plus the royalties paid to copyright owners in the underlying musical compositions in total average approximately 60% to 70% of revenue related to these services. Our understanding is based primarily on our own experience licensing such rights for the iHeartRadio All Access and iHeartRadio Plus audio services, as well as an analysis of Pandora's and Spotify's public filings, which indicate that the rates we pay for such services are in line with the general market rates. However, in the case of the iHeartRadio All Access and iHeartRadio Plus audio services, since revenue from these streaming services represents a small portion of our overall revenue, the rates we pay for these streaming services do not materially affect the overall average licensing rates we pay. While radio stations do pay performance royalties to songwriters, these royalties generally represent only about 3% of annual revenue. As a result of these economics, we believe that we have a superior overall cost structure, which is reflected in our higher operating margins, versus that of major music streaming services such as Pandora and Spotify which have reported negative operating margins.
Resilient financial model
We believe the aggregate impact of our differentiated multi-platform strategy results in durable topline growth and increasing profitability due to the inherent operating leverage in the business. Low capital intensity should result in strong free cash flow conversion and growth and allow us to further reduce our indebtedness. We further hope to improve our Adjusted EBITDA margins through cost savings resulting from the Separation, expense discipline and cost management, and continued automation of back office and sales support. Our financial profile should provide a strong foundation for iHeartMedia to continue to drive transformation within the audio industry.
Our Growth Strategy
Our strategy is centered on building strong consumer relationships with national reach. Providing this kind of at-scale companionship creates high-value advertising inventory for current audio advertisers as well as new advertisers and delivers superior returns to both. Moreover, we believe that we can leverage our investments in technology and data-informed decision making to capture increasing market share of the long tail of national and local revenue. The key elements of this growth strategy are:
Continued capture of advertising spend from all mediums
We intend to take advantage of our national scale, the brand power of "iHeartRadio," and product innovation to capture additional share of the overall radio advertising pool. We also believe our
13
enhanced audience data and related analytics tools should drive capture of additional revenue from other advertising sectors, including digital and television, as advertisers are able to target audiences and measure the efficacy of their ad spend in a manner that mirrors the capabilities of these other mediums. We believe our advertising partners value the unique reach, engagement and return potential of audio, as well as iHeartMedia's differentiated platforms and marketing expertise, positioning the Company to capitalize on this trend.
We have made, and continue to make, significant investments so we can provide an ad-buying experience similar to that which was once only available from digital-only companies. Our programmatic solution for broadcast radio, SoundPoint, provides improved planning and automated ad-buying by relying on sophisticated planning algorithms and a cloud-based network across all of iHeartMedia's broadcast radio inventory to deliver highly optimized plans to our advertising customers. SmartAudio is our audio data analytics advertising platform for broadcast radio which can be executed through the SoundPoint product. With SmartAudio, advertisers can do impression-based audience planning and dynamic radio advertising that utilizes real-time triggers such as weather, pollen counts, sports scores, mortgage rates and more to deploy different campaign messages based on what is happening in a specific market at a specific moment. SmartAudio has allowed brands to use broadcast radio advertisements to dynamically serve the most relevant message in each market, at each moment, just as they do with digital campaigns, to ensure increased relevance and impact. In 2018, we launched iHeartMedia Analytics, the first fully-digital measurement and attribution service for broadcast radio that we believe can transform the way advertisers plan, buy and measure much of their audio campaigns to better optimize the extensive reach of radio. We continue to look for ways to further develop our advertising capabilities in order to expand our share of advertising partners' budgets.
Increasing share of national advertising market
Broadcast radio is the number one consumer reach medium, and advertisers have a renewed appreciation for its scale, diverse demographic access and impact. We intend to complement our current local advertising presence in approximately 160 U.S. markets by further growing our stake in national advertising campaigns through our multi-platform portfolio of audio assets, roster of on-air talent, and the amplifying effect of our listeners' social engagement. As a result of our ongoing technology investments, national advertisers can now look to our audio offerings with their extensive reach, efficient pricing and digital-like analytics as powerful alternatives to other national ad mediums.
Broadening the scope of audio engagement
We continue to expand the spectrum of choices for our listeners—both in terms of compelling content and the array of ways in which it can be consumed. The proliferation of smart speakers and other connected devices greatly increases the range of options for accessing and interacting with our content. We are also very focused on rapidly growing content categories, such as our leadership position in podcasting. These initiatives not only improve the listener experience—they facilitate further engagement and heightened frequency of advertising impressions.
Notably, iHeartRadio, our all-in-one digital music, podcast and live streaming digital radio service, is available on an expansive range of platforms and devices including smart speakers, digital auto dashes, tablets, wearables, smartphones, virtual assistants, televisions and gaming consoles.
With the acquisition of Stuff Media, LLC in October 2018, we significantly extended our position as the largest commercial podcast publisher. We believe that podcasting is to talk what streaming is to music and is the next strategic audio platform. Our podcasting platform will allow us to capture incremental revenue as well as extend station brands, personalities and events onto a new platform—ultimately extending and deepening our consumer relationships and our opportunities for additional advertising revenue.
14
Employing technology to gain greater penetration of the long tail of advertising markets
In addition to having sellers in approximately 160 local markets across the U.S., which few media companies can claim, we intend to extend our technology platform to address the smaller clients that we do not currently reach through direct sales operations. As indication of the size of the potential opportunity, the Company currently has roughly 60,000 total clients compared to millions of clients for some of our largest social and search competitors which utilize technology solutions for smaller advertisers.
Utilizing our unique bundle of advertising inventory to drive CPM uplift
By adding other high CPM platforms into our mix, as well as providing unique and differentiated solutions for advertisers, we believe that we have the potential to see a CPM uplift. Although our primary focus is revenue, we also aim to maximize the value of our inventory. Moreover, we are continuing to develop platforms (including podcasts) that independently garner superior CPMs.
Leveraging the iHeartRadio master brand to expand our high-profile live events platform
Audio is a social experience and an important extension of the medium is live events. For our listeners, live events are an opportunity to interact with fellow fans and engage with their favorite artists. For our advertising partners, they are a chance to reach a captivated and highly targeted audience directly tied to our high reach and strong engagement broadcast radio platform. They also provide an opportunity to extend into platforms like cable and broadcast television, create ancillary licensing revenue streams and serve as an opportunity for ticket revenue. As with all of our platforms, the data collection from these sources is valuable to both our product creation process and our advertisers. Through our portfolio of major award shows, festivals and 20,000 local live events, we intend to continue to find innovative ways to integrate sponsorships and deliver unique advertising moments. In so doing, we will seek to create additional revenue opportunities through this platform.
15
UNAUDITED PRO FORMA CONDENSED CONSOLIDATED FINANCIAL DATA
The following unaudited pro forma condensed consolidated financial statements have been developed by applying pro forma adjustments to the historical consolidated financial statements incorporated by reference in this offering memorandum. Because the historical consolidated financial statements of operations of iHeartMedia for the nine months ended September 30, 2019 and 2018 present the historical results of the Outdoor Group as discontinued operations for the Predecessor period and exclude its results for the Successor period, the unaudited pro forma condensed consolidated statements of operations for the nine months ended September 30, 2019 and 2018 do not include pro forma adjustments for the Separation. The unaudited pro forma condensed consolidated statements of operations (i) for the nine months ended September 30, 2019 and 2018 give effect to the Reorganization and the application of fresh start accounting as well as the issuance of the 5.25% Existing Secured Notes and the application of the net proceeds therefrom as if they had occurred on January 1, 2018; (ii) for the year ended December 31, 2018, give effect to the Separation, the Reorganization and the application of fresh start accounting as well as the issuance of the 5.25% Existing Secured Notes and the application of the net proceeds therefrom as if they had occurred on January 1, 2018; and (iii) for the years ended December 31, 2017 and 2016 give effect to the Separation as if it had occurred on January 1, 2016. All pro forma adjustments and underlying assumptions are described more fully in the notes to the unaudited pro forma condensed consolidated financial statements.
The unaudited pro forma condensed consolidated financial data presented in this offering memorandum is for illustrative purposes only and is not necessarily indicative of the financial position or results of operations that would have been realized if the Separation, the Reorganization, the application of fresh start accounting, the issuance of the 5.25% Existing Secured Notes and the application of the net proceeds therefrom were completed on the dates indicated, nor is it indicative of future operating results or financial position. The pro forma adjustments are based upon available information and certain assumptions that management believes to be reasonable. Because the application of fresh start accounting has not been completed as of the date of this offering memorandum, the estimates and assumptions regarding the impact are preliminary. The ability of iHeartMedia to realize the benefits of the Separation and the Reorganization remains subject to a number of risks and uncertainties. See "Risk Factors."
The unaudited pro forma condensed consolidated statements of operations do not include the effects of nonrecurring items arising directly as a result of the transactions described above. The unaudited pro forma condensed consolidated statements of operations for the nine months ended September 30, 2019 and 2018 and for the years ended December 31, 2018, 2017 and 2016 have been derived from the historical consolidated financial statements incorporated by reference in this offering memorandum. The amounts in the tables may not add due to rounding.
You should read these unaudited pro forma condensed consolidated financial statements in conjunction with:
- •
- the accompanying notes to the unaudited pro forma condensed consolidated financial statements;
- •
- the audited historical consolidated financial statements of iHeartMedia as of and for the three years ended December 31, 2018, which are incorporated by reference in this offering memorandum;
- •
- the unaudited historical consolidated financial statements of iHeartMedia as of September 30, 2019 and for the three and nine months ended September 30, 2019 and 2018, which are incorporated by reference in this offering memorandum; and
16
- •
- the Management's Discussion and Analysis of Financial Condition and Results of Operations incorporated by reference in this offering memorandum.
The unaudited pro forma condensed consolidated statements of operations for the nine months ended September 30, 2019 and 2018 and for the year ended December 31, 2018 give effect to the application of fresh start accounting and reporting in accordance withASC 852—Reorganizations ("ASC 852"), which requires the Company to reflect the financial statements of iHeartMedia on a fair value basis as of the Effective Date. The pro forma adjustments are based on an assumed enterprise value of approximately $8.75 billion, which is the midpoint of a range of estimated enterprise values of $8.0 billion to $9.5 billion as of January 22, 2019, as confirmed by the Bankruptcy Court. Refer to the notes to the unaudited pro forma condensed consolidated financial statements for a reconciliation of the midpoint of enterprise value to reorganization value.
In addition, the historical consolidated financial statements of the Company will not be comparable to these unaudited pro forma condensed consolidated financial statements or to the financial statements following the Effective Date of the Reorganization due to the Separation, the effects of the Reorganization and the impact of applying fresh start accounting.
As more fully discussed elsewhere in this offering memorandum, the following occurred as part of the Reorganization:
- •
- the existing indebtedness of iHeartCommunications of approximately $16 billion was discharged, the Company entered into the Term Loan Facility and the ABL Facility and issued the 6.375% Existing Secured Notes and the Existing Unsecured Notes, which resulted in approximately $5.8 billion in the aggregate of outstanding indebtedness;
- •
- all balances included within Liabilities subject to compromise were settled or reinstated; and
- •
- Class A common stock and Class B common stock of iHeartMedia, along with Special Warrants to purchase shares of Class A common stock or Class B common stock of iHeartMedia, were issued to holders of claims pursuant to the plan of reorganization filed with the Bankruptcy Court (the "Plan of Reorganization").
In addition, as part of the separation and settlement agreement entered into in connection with the Separation, iHeartCommunications and CCOH consummated the following transactions:
- •
- the cash sweep agreement under a corporate services agreement and any agreements or licenses requiring royalty payments to iHeartMedia by CCOH for trademarks or other intellectual property ("Trademark License Fees") were terminated;
- •
- iHeartCommunications, iHeartMedia, iHeartMedia Management Services, Inc. and CCOH entered into a transition services agreement (the "Transition Services Agreement") to provide administrative services currently and historically provided to CCOH by iHeartCommunications;
- •
- the Trademark License Fees charged to CCOH during the post-petition period were waived by iHeartMedia;
- •
- the post-petition intercompany balance due to iHeartCommunications was repaid, after being adjusted for the post-petition Trademark License Fees charged to CCOH during the post-petition period;
- •
- iHeartMedia contributed the rights, title and interest in and to all tradenames, trademarks, service marks, common law marks and other rights related to the Clear Channel tradename (the "CC Intellectual Property") to CCOH;
- •
- iHeartMedia paid $115.8 million to CCOH, which consisted of the $149.0 million payment by iHeartCommunications to CCOH as CCOH's recovery of its claims under the Due from iHeartCommunications Note, partially offset by the $33.2 million net amount payable to iHeartCommunications under the post-petition intercompany balance between iHeartCommunications and CCOH, after adjusting for the post-petition Trademark License Fees which were waived as part of the settlement agreement; and
- •
- iHeart Operations, Inc. issued preferred stock to a third party for cash.
17
IHEARTMEDIA, INC.
UNAUDITED PRO FORMA CONDENSED CONSOLIDATED STATEMENT OF OPERATIONS
For the Nine Months Ended September 30, 2019
(in thousands)
| | | | | | | | | | | | | | | | | | | | | | |
| | Historical | |
| |
| |
| |
| |
|---|
| | Successor Company | | Predecessor Company | | Combined | | Adjustments | |
| |
|---|
| | Period from
May 2, 2019
through
September 30, | | Period from
January 1,
2019 through
May 1, | |
| |
| |
| | Issuance
of 5.25%
Existing
Secured
Notes
(D) | |
| |
|---|
| | Nine Months
Ended
September 30, | |
| |
| |
| |
|---|
| | Reorganization
(B) | | Fresh Start
(C) | |
| |
|---|
| | 2019 | | 2019 | | 2019 | | Pro Forma | |
|---|
Revenue | | $ | 1,583,984 | | $ | 1,073,471 | | $ | 2,657,455 | | $ | — | | $ | 43 | (2)(3) | $ | — | | $ | 2,657,498 | |
Operating expenses: | | | | | | | | | | | | | | | | | | | | | | |
Direct operating expenses (excludes depreciation and amortization) | | | 475,262 | | | 359,696 | | | 834,958 | | | — | | | 2,419 | (3)(4) | | — | | | 837,377 | |
Selling, general and administrative expenses (excludes depreciation and amortization) | | | 568,493 | | | 436,345 | | | 1,004,838 | | | — | | | (2,663) | (3) | | — | | | 1,002,175 | |
Corporate expenses (excludes depreciation and amortization) | | | 104,434 | | | 66,020 | | | 170,454 | | | (7,885) | (5) | | (1,185) | (5) | | — | | | 161,384 | |
Depreciation and amortization | | | 154,651 | | | 52,834 | | | 207,485 | | | (2,997) | (1) | | 75,190 | (1) | | — | | | 279,678 | |
Impairment charges | | | — | | | 91,382 | | | 91,382 | | | — | | | — | | | — | | | 91,382 | |
Other operating expense, net | | | (6,634 | ) | | (154 | ) | | (6,788 | ) | | — | | | — | | | — | | | (6,788 | ) |
| | | | | | | | | | | | | | | | | | | | | | | |
Operating income | | | 274,510 | | | 67,040 | | | 341,550 | | | 10,882 | | | (73,718 | ) | | — | | | 278,714 | |
Interest (income) expense, net | | | 170,678 | | | (499 | ) | | 170,179 | | | 123,909 | (2)(3) | | — | | | (2,855) | (1) | | 291,233 | |
Equity in loss of nonconsolidated affiliates | | | (25 | ) | | (66 | ) | | (91 | ) | | — | | | — | | | — | | | (91 | ) |
Gain (loss) on investments, net | | | 1,735 | | | (10,237 | ) | | (8,502 | ) | | — | | | — | | | — | | | (8,502 | ) |
Other income (expense), net | | | (21,614 | ) | | 23 | | | (21,591 | ) | | — | | | — | | | — | | | (21,591 | ) |
Reorganization items, net | | | — | | | 9,461,826 | | | 9,461,826 | | | (9,461,826) | (4) | | — | | | — | | | — | |
| | | | | | | | | | | | | | | | | | | | | | | |
Income (loss) from continuing operations before income taxes | | | 83,928 | | | 9,519,085 | | | 9,603,013 | | | (9,574,853 | ) | | (73,718 | ) | | 2,855 | | | (42,703 | ) |
Income tax benefit (expense) | | | (32,761 | ) | | (39,095 | ) | | (71,856 | ) | | 110,763 | | | 18,429 | | | (714 | ) | | 56,622 | |
| | | | | | | | | | | | | | | | | | | | | | | |
Income from continuing operations | | $ | 51,167 | | $ | 9,479,990 | | | 9,531,157 | | $ | (9,464,090 | ) | $ | (55,289 | ) | $ | 2,141 | | $ | 13,919 | |
| | | | | | | | | | | | | | | | | | | | | | | |
| | | | | | | | | | | | | | | | | | | | | | | |
| | | | | | | | | | | | | | | | | | | | | | | |
18
IHEARTMEDIA, INC.
UNAUDITED PRO FORMA CONDENSED CONSOLIDATED STATEMENT OF OPERATIONS
For the Nine Months Ended September 30, 2018
(in thousands)
| | | | | | | | | | | | | | | | |
| |
| | Adjustments | |
| |
|---|
| | Historical | | Reorganization
(B) | | Fresh Start
(C) | | Issuance of
5.25% Existing
Secured Notes
(D) | | Pro Forma | |
|---|
Revenue | | $ | 2,585,028 | | $ | — | | $ | (219) | (2)(3) | $ | — | | $ | 2,584,809 | |
Operating expenses: | | | | | | | | | | | | | | | | |
Direct operating expenses (excludes depreciation and amortization) | | | 773,424 | | | — | | | 13,927 | (3)(4) | | — | | | 787,351 | |
Selling, general and administrative expenses (excludes depreciation and amortization) | | | 1,003,728 | | | — | | | (6,202) | (3) | | — | | | 997,526 | |
Corporate expenses (excludes depreciation and amortization) | | | 162,075 | | | 26,426 | (5) | | — | | | — | | | 188,501 | |
Depreciation and amortization | | | 175,546 | | | (4,495) | (1) | | 108,627 | (1) | | — | | | 279,678 | |
Impairment charges | | | 33,150 | | | — | | | — | | | — | | | 33,150 | |
Other operating expense, net | | | (6,912 | ) | | — | | | — | | | — | | | (6,912 | ) |
| | | | | | | | | | | | | | | | | |
Operating income | | | 430,193 | | | (21,931 | ) | | (116,571 | ) | | — | | | 291,691 | |
Interest expense, net | | | 333,843 | | | (36,423) | (2)(3) | | — | | | (2,855) | (1) | | 294,565 | |
Equity in loss of nonconsolidated affiliates | | | (93 | ) | | — | | | — | | | — | | | (93 | ) |
Gain on extinguishment of debt | | | 100 | | | — | | | — | | | — | | | 100 | |
Gain (loss) on investments, net | | | 9,361 | | | — | | | — | | | — | | | 9,361 | |
Other expense, net | | | (22,855 | ) | | — | | | — | | | — | | | (22,855 | ) |
Reorganization items, net | | | (313,270 | ) | | 313,270 | (4) | | — | | | — | | | — | |
| | | | | | | | | | | | | | | | | |
Loss from continuing operations before income taxes | | | (230,407 | ) | | 327,762 | | | (116,571 | ) | | 2,855 | | | (16,361 | ) |
Income tax benefit (expense) | | | 9,828 | | | (3,623 | ) | | 29,143 | | | (714 | ) | | 34,634 | |
| | | | | | | | | | | | | | | | | |
Income (Loss) from continuing operations | | $ | (220,579 | ) | $ | 324,139 | | $ | (87,428 | ) | $ | 2,141 | | $ | 18,273 | |
| | | | | | | | | | | | | | | | | |
| | | | | | | | | | | | | | | | | |
| | | | | | | | | | | | | | | | | |
19
IHEARTMEDIA, INC.
UNAUDITED PRO FORMA CONDENSED CONSOLIDATED STATEMENT OF OPERATIONS
For the Year Ended December 31, 2018
(in thousands)
| | | | | | | | | | | | | | | | | | | | | | |
| | Historical | | Separation of
the Outdoor
Group(A) | | Adjusted for
Separation of
the Outdoor
Group | | Reorganization
(B) | | Fresh Start
(C) | | Issuance
of 5.25%
Existing
Secured
Notes
(D) | | Pro Forma | |
|---|
Revenue | | $ | 6,325,780 | | $ | (2,714,457 | ) | $ | 3,611,323 | | $ | — | | $ | (292) | (2)(3) | $ | — | | $ | 3,611,031 | |
Operating expenses: | | | | | | | | | | | | | | | | | | | | | | |
Direct operating expenses (excludes depreciation and amortization) | | | 2,532,948 | | | (1,470,575 | ) | | 1,062,373 | | | — | | | 18,569 | (3)(4) | | — | | | 1,080,942 | |
Selling, general and administrative expenses (excludes depreciation and amortization) | | | 1,896,503 | | | (519,572 | ) | | 1,376,931 | | | — | | | (8,269) | (3) | | — | | | 1,368,662 | |
Corporate expenses (excludes depreciation and amortization) | | | 337,218 | | | (109,710 | ) | | 227,508 | | | 30,944 | (5) | | — | | | — | | | 258,452 | |
Depreciation and amortization | | | 530,903 | | | (318,952 | ) | | 211,951 | | | (8,990) | (1) | | 169,943 | (1) | | — | | | 372,904 | |
Impairment charges | | | 40,922 | | | (7,772 | ) | | 33,150 | | | — | | | — | | | — | | | 33,150 | |
Other operating expense, net | | | (6,768 | ) | | (2,498 | ) | | (9,266 | ) | | — | | | — | | | — | | | (9,266 | ) |
| | | | | | | | | | | | | | | | | | | | | | | |
Operating income | | | 980,518 | | | (290,374 | ) | | 690,144 | | | (21,954 | ) | | (180,535 | ) | | — | | | 487,655 | |
Interest expense, net | | | 722,931 | | | (388,133 | ) | | 334,798 | | | 55,915 | (2)(3) | | — | | | (3,806) | (1) | | 386,907 | |
Equity in earnings of nonconsolidated affiliates | | | 1,020 | | | (904 | ) | | 116 | | | — | | | — | | | — | | | 116 | |
Gain on extinguishment of debt | | | 100 | | | — | | | 100 | | | — | | | — | | | — | | | 100 | |
Loss on investments, net | | | (1,276 | ) | | 804 | | | (472 | ) | | — | | | — | | | — | | | (472 | ) |
Other expense, net | | | (57,600 | ) | | 34,493 | | | (23,107 | ) | | — | | | — | | | — | | | (23,107 | ) |
Reorganization items, net | | | (356,119 | ) | | — | | | (356,119 | ) | | 356,119 | (4) | | — | | | — | | | — | |
| | | | | | | | | | | | | | | | | | | | | | | |
Income (loss) before income taxes | | | (156,288 | ) | | 132,152 | | | (24,136 | ) | | 278,250 | | | (180,535 | ) | | 3,806 | | | 77,385 | |
Income tax benefit (expense) | | | (46,351 | ) | | 32,515 | | | (13,836 | ) | | 19,467 | | | 45,134 | | | (952 | ) | | 49,813 | |
| | | | | | | | | | | | | | | | | | | | | | | |
Consolidated net income (loss) | | $ | (202,639 | ) | $ | 164,667 | | $ | (37,972 | ) | $ | 297,717 | | $ | (135,401 | ) | $ | 2,854 | | $ | 127,198 | |
| | | | | | | | | | | | | | | | | | | | | | | |
| | | | | | | | | | | | | | | | | | | | | | | |
| | | | | | | | | | | | | | | | | | | | | | | |
20
IHEARTMEDIA, INC.
UNAUDITED PRO FORMA CONDENSED CONSOLIDATED STATEMENT OF OPERATIONS
For the Year Ended December 31, 2017
(in thousands)
| | | | | | | | | | |
| | Historical | | Separation of
the Outdoor
Group (A) | | Pro Forma
for the
Separation of
the Outdoor
Group | |
|---|
Revenue | | $ | 6,168,431 | | $ | (2,581,784 | ) | $ | 3,586,647 | |
Operating expenses: | | | | | | | | | | |
Direct operating expenses (excludes depreciation and amortization) | | | 2,468,724 | | | (1,409,601 | ) | | 1,059,123 | |
Selling, general and administrative expenses (excludes depreciation and amortization) | | | 1,842,222 | | | (496,159 | ) | | 1,346,063 | |
Corporate expenses (excludes depreciation and amortization) | | | 311,898 | | | (103,250 | ) | | 208,648 | |
Depreciation and amortization | | | 601,295 | | | (325,991 | ) | | 275,304 | |
Impairment charges | | | 10,199 | | | (4,159 | ) | | 6,040 | |
Other operating income, net | | | 35,704 | | | (26,391 | ) | | 9,313 | |
| | | | | | | | | | | |
Operating income | | | 969,797 | | | (269,015 | ) | | 700,782 | |
Interest expense, net | | | 1,864,136 | | | (379,701 | ) | | 1,484,435 | |
Equity in loss of nonconsolidated affiliates | | | (2,855 | ) | | 990 | | | (1,865 | ) |
Gain on extinguishment of debt | | | 1,271 | | | — | | | 1,271 | |
Loss on investments, net | | | (4,872 | ) | | 1,045 | | | (3,827 | ) |
Other expense, net | | | (15,322 | ) | | (29,800 | ) | | (45,122 | ) |
| | | | | | | | | | | |
Loss before income taxes | | | (916,117 | ) | | 82,921 | | | (833,196 | ) |
Income tax benefit (expense) | | | 457,406 | | | (280,218 | ) | | 177,188 | |
| | | | | | | | | | | |
Consolidated net loss | | $ | (458,711 | ) | $ | (197,297 | ) | $ | (656,008 | ) |
| | | | | | | | | | | |
| | | | | | | | | | | |
| | | | | | | | | | | |
21
IHEARTMEDIA, INC.
UNAUDITED PRO FORMA CONDENSED CONSOLIDATED STATEMENT OF OPERATIONS
For the Year Ended December 31, 2016
(in thousands)
| | | | | | | | | | |
| | Historical | | Separation of
the Outdoor
Group (A) | | Pro Forma
for the
Separation of
the Outdoor
Group | |
|---|
Revenue | | $ | 6,251,000 | | $ | (2,676,367 | ) | $ | 3,574,633 | |
Operating expenses: | | | | | | | | | | |
Direct operating expenses (excludes depreciation and amortization) | | | 2,395,037 | | | (1,418,319 | ) | | 976,718 | |
Selling, general and administrative expenses (excludes depreciation and amortization) | | | 1,726,118 | | | (513,497 | ) | | 1,212,621 | |
Corporate expenses (excludes depreciation and amortization) | | | 341,072 | | | (115,905 | ) | | 225,167 | |
Depreciation and amortization | | | 635,227 | | | (344,124 | ) | | 291,103 | |
Impairment charges | | | 8,000 | | | (7,274 | ) | | 726 | |
Other operating expense, net | | | 353,556 | | | (354,688 | ) | | (1,132 | ) |
| | | | | | | | | | | |
Operating income | | | 1,499,102 | | | (631,936 | ) | | 867,166 | |
Interest expense, net | | | 1,850,119 | | | (375,029 | ) | | 1,475,090 | |
Equity in loss of nonconsolidated affiliates | | | (16,733 | ) | | 1,689 | | | (15,044 | ) |
Gain on extinguishment of debt | | | 157,556 | | | — | | | 157,556 | |
Loss on investments, net | | | (12,907 | ) | | (531 | ) | | (13,438 | ) |
Other expense, net | | | (73,102 | ) | | 70,682 | | | (2,420 | ) |
| | | | | | | | | | | |
Loss before income taxes | | | (296,203 | ) | | (185,067 | ) | | (481,270 | ) |
Income tax benefit (expense) | | | 49,631 | | | 77,499 | | | 127,130 | |
| | | | | | | | | | | |
Consolidated net loss | | $ | (246,572 | ) | $ | (107,568 | ) | $ | (354,140 | ) |
| | | | | | | | | | | |
| | | | | | | | | | | |
| | | | | | | | ��� | | | |
22
Notes to the Unaudited Pro Forma Condensed Consolidated Financial Statements
For a discussion of the impact of the Separation, the Reorganization and the application of the fresh start accounting on the Company's balance sheet as of September 30, 2019, see Note 2—Emergence From Voluntary Reorganization Under Chapter 11 Proceedings and Note 3—Fresh Start Accounting in the Historical Consolidated Financial Statements of iHeartMedia in our 2019 Q3 Quarterly Report.
NOTE 1—PRO FORMA STATEMENT OF OPERATIONS ADJUSTMENTS
A. The Separation
The Company's historical consolidated financial statements of operations for the nine months ended September 30, 2019 and 2018 present the historical results of the Outdoor Group as discontinued operations for the Predecessor period and exclude its results for the Successor period and therefore the unaudited pro forma condensed consolidated statements of operations for the nine months ended September 30, 2019 and 2018 do not include pro forma adjustments related to the Separation. The unaudited pro forma condensed consolidated statements of operations for the years ended December 31, 2018, 2017 and 2016 include the following adjustments related to the Separation:
The adjustments reflect the revenue and expenses of CCOH, which are derived from the consolidated statements of operations of CCOH. CCOH's statements of operations are adjusted to:
- (1)
- eliminate interest income on the Due from iHeartCommunications Note of $68.9 million and $50.3 million recognized by CCOH for the years ended December 31, 2017 and 2016, respectively, which was an intercompany expense of iHeartCommunications that was eliminated in consolidation (no interest income was recognized on the Due from iHeartCommunications Note after December 31, 2017);
- (2)
- eliminate interest income (expense) on the post-petition intercompany balance with iHeartCommunications of $0.4 million for the year ended December 31, 2018, which was eliminated in consolidation;
- (3)
- eliminate the $855.6 million loss on the Due from iHeartCommunications Note recognized by CCOH in 2017, which was an intercompany amount that was eliminated in consolidation; and
- (4)
- eliminate the Trademark License Fees charged by iHeartMedia to CCOH of $38.6 million and $36.7 million for the years ended December 31, 2018 and 2017, respectively, which were intercompany amounts that were eliminated in consolidation. The Trademark License Fees were not charged to CCOH in 2016.
The unaudited pro forma statements of operations assume that the amounts to be charged and being charged, as applicable, to CCOH under the Transition Services Agreement after emergence are equivalent to the amounts charged for the services historically provided under the Corporate Services Agreement. Accordingly, for purposes of the pro forma statements of operations, pro forma Corporate expenses are presented net of intercompany management charges to CCOH.
The unaudited pro forma condensed consolidated statements of operations for the nine months ended September 30, 2019 and 2018 and for the year ended December 31, 2018 include the following adjustments related to the Reorganization, the application of fresh start accounting and the issuance of the 5.25% Existing Secured Notes and the application of the net proceeds therefrom:
B. Reorganization Adjustments
- (1)
- Elimination of historical amortization expense of $3.0 million, $4.5 million and $9.0 million for the nine months ended September 30, 2019 and 2018 and for the year ended December 31,
23
C. Fresh Start Accounting Adjustments
- (1)
- Reversal of historical depreciation and amortization (after adjusting for the contribution of the CC Intellectual Property discussed above) of $204.5 million, $171.1 million and $203.0 million for the nine months ended September 30, 2019 and 2018 and for the year ended December 31, 2018, respectively, and recognition of $279.7 million, $279.7 million and $372.9 million for the nine months ended September 30, 2019 and 2018 and for the year ended December 31, 2018, respectively, in depreciation and amortization related to tangible and intangible assets identified and adjusted to estimated fair values.
24
- (2)
- Reduction of historical revenue of $0.6 million, $1.3 million and $1.7 million for the nine months ended September 30, 2019 and 2018 and for the year ended December 31, 2018, respectively, related to the adjustment to deferred revenue to its estimated fair value.
- (3)
- Reversal of historical expenses related to implementation costs and other upfront fees that were determined to have no future economic benefits. The remaining unamortized balances related to prepaid implementation costs for cloud-based software and for signing bonuses related to talent contracts without substantive claw-back provisions were determined to not provide any enforceable rights to future economic benefits and were adjusted to zero. Accordingly, historical Selling, general and administrative expenses arising from the amortization of prepaid implementation fees of $2.7 million, $6.2 million and $8.3 million for the nine months ended September 30, 2019 and 2018 and the year ended December 31, 2018, respectively, were reversed. In addition, historical Direct operating expenses arising from the amortization of signing bonuses of $3.2 million, $2.3 million and $3.1 million for the nine months ended September 30, 2019 and 2018 and the year ended December 31, 2018, respectively, were reversed. Revenue was also adjusted in relation to an arrangement with a customer, resulting in an adjustment of $0.6 million, $1.1 million and $1.4 million for the nine months ended September 30, 2019 and 2018 and the year ended December 31, 2018, respectively.
- (4)
- The Company eliminated the impact of the amortization of deferred gains on sale-leaseback transactions, which resulted in an increase in Direct operating expense of $3.6 million and $4.8 million for the nine months ended September 30, 2018 and the year ended December 31, 2018, respectively. Unamortized deferred gains on sale-leaseback transactions were written-off on January 1, 2019 upon adoption of the new leasing standard. In addition, the Company eliminated the impact of the amortization of straight-line lease adjustments related to operating leases with escalating payments and reset its straight-line lease amortization for purposes of the unaudited pro forma condensed consolidated statements of operations. Resetting the Company's straight-line lease amortization resulted in an increase to Direct operating expenses of $4.7 million, $10.7 million and $14.2 million for the nine months ended September 30, 2019 and 2018 and the year ended December 31, 2018, respectively. The Company also recognized additional rent expense of $0.9 million and $2.0 million for the nine months ended September 30, 2019 and 2018, respectively, and $2.6 million for the year ended December 31, 2018 in relation to favorable lease contracts.
- (5)
- Reversal of historical Corporate expenses primarily related to unamortized prepaid benefit expense that were determined to have no future economic benefits.
D. 5.25% Existing Secured Notes Offering Adjustments
- (1)
- On August 7, 2019, iHeartCommunications completed the sale of $750.0 million in aggregate principal amount of the 5.25% Existing Secured Notes in a private placement. The Company used the net proceeds from the 5.25% Senior Secured Notes, together with cash on hand, to prepay at par $740.0 million of borrowings outstanding under the Term Loan Facility. The adjustment reflects the reversal of interest expense of $33.5 million, $33.5 million and $44.6 million for the nine months ended September 30, 2019 and 2018 and for the year ended December 31, 2018, respectively, on the portion of the Term Loan Facility that was prepaid and on the 5.25% Existing Secured Notes from the date of issuance through September 30, 2019, and the recognition of interest expense, including amortization of related debt issuance costs, related to the 5.25% Existing Secured Notes of $30.6 million, $30.6 million and $40.8 million for the nine months ended September 30, 2019 and 2018 and for the year ended December 31, 2018, respectively, as if the 5.25% Existing Secured Notes had been issued on January 1, 2018.
25
The pro forma adjustments to income tax benefit (expense) have been calculated assuming a 25% statutory tax rate, which is comprised of the U.S. federal tax rate of 21% and a blended 4% rate to account for the various state and local tax jurisdictions in which the Company operates for the nine months ended September 30, 2019 and 2018 and the year ended December 31, 2018, with the exception of the tax impact related to the reversal of Reorganization items in the nine months ended September 30, 2019. The pro forma adjustment to income tax expense reflects a reversal of the historical net income tax impact of the Reorganization items of $82.5 million in the nine months ended September 30, 2019. The effects on income tax benefit (expense) from the pro forma adjustments to deferred income tax assets and liabilities are not included in the unaudited condensed consolidated pro forma statements of operations because the items are non-recurring in nature.
Pro Forma Discussion and Analysis of Financial Condition and Results of Operations
Our Sources of Revenue
We generate advertising revenue through three primary channels. The first—and still the most prevalent—is a transactional media relationship with national agencies where the Company is selling defined advertising units and impressions, primarily of inventory on our broadcast radio stations. The second is through a direct marketing relationship with both local and national clients and agencies where we use our diverse portfolio of assets to help develop a specific marketing solution tailored to the defined needs of the advertising partner. The third channel is the newest and smallest, but fastest growing, channel—a digital interface using data to develop specific targets and executed most often over a technology platform. These three channels can all be used in varying degrees of efficiency over our multiple platforms including broadcast radio, digital streaming and display, podcast, social amplification and events. Our national scale and structure allow us to offer these solutions at a national, regional or local level, or any combination thereof.
We have the following revenue streams:
- •
- Broadcast Radio: We generated revenue of $1,621.5 million and $1,635.6 million for the nine months ended September 30, 2019 and 2018, respectively by selling local and national advertising time on our domestic radio stations, generating revenue through local and national channels. Advertising rates are principally based on the length of the spot and how many people in a targeted audience listen to our stations, as measured by independent ratings services.
Increasingly, across both national and local markets, our advertisers are demanding data rich, analytics-driven advertising solutions. iHeartMedia offers a comprehensive suite of tech-enabled advertising solutions (SoundPoint, SmartAudio and iHeartAnalytics) that provide advanced attribution and analytics capability. We expect programmatic to account for an increasing proportion of ad buying in the future.
- •
- Digital: Our company's reach now extends across more than 250 platforms and 2,000 different connected devices. We generate digital revenue comprised of streaming, subscription, display advertisements, podcasting and other content that is disseminated over digital platforms. Our leading streaming product, iHeartRadio, is a free downloadable mobile app and web-based service that allows users to listen to their favorite radio stations, as well as digital-only stations, custom artist stations, and podcasts. Monetization on the free streaming application occurs through national and local advertising. We also have two subscription based offerings—iHeartRadio Plus and iHeartRadio All Access. Digital generated revenue of $263.7 million and $200.4 million for the nine months ended September 30, 2019 and 2018, respectively.
- •
- Networks: We enable advertisers to engage with consumers through our Premiere Networks and Total Traffic & Weather Network services. We generate broadcast advertising revenue from selling local and national advertising on our programs featuring top personalities, and also
26
generate revenue through the syndication of our programming to other media companies. Networks generated revenue of $454.6 million and $425.6 million for the nine months ended September 30, 2019 and 2018, respectively.
- •
- Premiere Networks is a national radio network that produces, distributes or represents more than 120 syndicated radio programs and services for more than 6,200 radio station affiliates. Our broad distribution capabilities enable us to attract and retain top programming talent. Some of our more popular syndicated programs feature top talent including Ryan Seacrest, Big Boy, Rush Limbaugh, Sean Hannity, Glenn Beck, Steve Harvey, Elvis Duran, Bobby Bones, Breakfast Club and Delilah. We believe recruiting and retaining top talent is an important component of the success of our radio networks.
- •
- Total Traffic & Weather Network delivers real-time local traffic flow and incident information along with weather updates, sports and news to more than 2,100 radio stations and approximately 110 television affiliates, as well as through Internet and mobile partnerships, reaching over 210 million consumers each month. Total Traffic & Weather Network services more than 220 markets in the U.S. and Canada. It operates the largest broadcast traffic navigation network in North America.
- •
- Sponsorship & Events: We generate revenue through our 20,000 local live events per year and eight major nationally-recognized tent pole events, as well as appearance fees generated by on-air talent from sponsorship, endorsement and other advertising revenue, as well as ticket sales and licensing. Sponsorship and events generated revenue of $137.7 million and $132.3 million for the nine months ended September 30, 2019 and 2018, respectively.
- •
- Other: Other revenue streams connected to our core broadcast and digital radio operations include fees earned for miscellaneous services such as on-site promotions, activations, LMA fees and tower rental provided to advertisers and other media companies. These services generated revenue of $15.8 million and $15.4 million for the nine months ended September 30, 2019 and 2018, respectively.
- •
- Audio & Media Services: We also provide services to radio and television broadcast industry participants through our Katz and RCS businesses which generated revenue of $169.8 million and $180.6 million for the nine months ended September 30, 2019 and 2018, respectively.
- •
- Katz is a leading media representation firm in the U.S., Katz represents more than 3,200 non-iHeartMedia radio stations and more than 800 television stations and their respective digital platforms. Katz generates revenue via commissions on media sold.
- •
- RCS is a leading provider of broadcast and webcast software. Our software (radio station automation, music scheduling, HD2 solutions, newsroom software, audio logging and archiving, single station automation and contest tracking software) and technology (real-time audio recognition technology) is used by more than 9,000 radio stations, television music channels, cable companies, satellite music networks and Internet stations worldwide.
Ultimately, our superior local, national, and online sales force combined with our leading digital, events, content, and representation business position us to cover a wide range of advertiser categories, including consumer services, retailers, entertainment, health and beauty products, telecommunications, automotive, media and political. Our contracts with our advertisers range from less than one-year to multi-year terms.
Nine Months ended September 30, 2019 compared to Nine Months ended September 30, 2018
The unaudited condensed consolidated pro forma statements of operations for the nine months ended September 30, 2019 and 2018 reflect the Reorganization, the application of fresh start
27
accounting and the issuance of the 5.25% Existing Secured Notes as if they occurred on January 1, 2018. The comparison of our unaudited pro forma results of operations for the nine months ended September 30, 2019 to our unaudited pro forma results of operations for the nine months ended September 30, 2018 is as follows:
Consolidated Revenue
Revenue increased $72.7 million during the nine months ended September 30, 2019 compared to the same period of 2018. The increase in revenue is primarily due to higher digital revenue of $63.3 million driven by growth in podcasting, primarily as a result of our acquisition of Stuff Media in October 2018, as well as other digital revenue, including live radio and other on-demand services and revenue from our Network businesses, which increased $29.0 million. Broadcast spot revenue decreased $14.l million, due to a $16.7 million decrease in political revenue as a result of 2018 being a mid-term congressional election year. Audio and Media Services revenue decreased $10.8 million, primarily due to a $15.2 million decrease in political revenue. Excluding political, revenue increased $104.8 million.
Consolidated Direct Operating Expenses
Consolidated direct operating expenses increased $50.0 million during the nine months ended September 30, 2019 compared to the same period of 2018. Higher direct operating expenses were driven primarily by higher digital royalties, content costs and compensation-related expenses, primarily resulting from the acquisitions of Stuff Media and Jelli in the fourth quarter of 2018, and from higher podcasting and digital subscription revenue, as well as higher net production costs related to our events, including the iHeartRadio Music Awards.
Consolidated Selling, General and Administrative Expenses
Consolidated SG&A expenses increased $4.7 million during the nine months ended September 30, 2019 compared to the same period of 2018. The increase in our SG&A expenses was due primarily to higher digital fees, driven by the increase in digital revenue, along with higher employee costs, primarily resulting from the acquisitions of Stuff Media and Jelli in the fourth quarter of 2018. The increase in SG&A expenses was partially offset by lower trade and barter expenses, primarily resulting from timing, and lower commissions as a result of our revenue mix.
Corporate Expenses
Corporate expenses decreased $27.1 million during the nine months ended September 30, 2019 compared to the same period of 2018. The decrease was primarily as a result of lower non-cash stock compensation expense due to the fact that 20% of the equity awards to be granted in connection with emergence vest 180 days after the grant date, thus not impacting pro forma corporate expenses in 2019 because, for purposes of the pro forma financial statements, the equity awards are assumed to be granted on January 1, 2018. In addition, sponsor management fees decreased because such fees have not been charged since the March 14, 2018 bankruptcy petition date, and compensation expense was lower related to retention awards granted in prior periods.
Depreciation and Amortization
Depreciation and amortization was flat in the nine months ended September 30, 2019 compared to the nine months ended September 30, 2018, on a pro forma basis.
Impairment Charges
We perform our annual impairment test on our goodwill, FCC licenses and other intangible assets as of July 1 of each year. No impairment charges were recorded in the third quarter of 2019 in
28
connection with our annual impairment test. We recognized non-cash impairment charges of $33.2 million in the third quarter of 2018 related to several of our radio markets. In addition, we test for impairment of intangible assets whenever events and circumstances indicate that such assets might be impaired. We recognized non-cash impairment charges of $91.4 million in the first quarter of 2019 on our indefinite-lived FCC licenses as a result of an increase in the weighted average cost of capital.
Other Operating Expense, Net
Other operating expense, net of $6.8 million and $6.9 million in the nine months ended September 30, 2019 and 2018, respectively, related primarily to net losses recognized on asset disposals.
Interest Expense
Interest expense decreased $3.4 million during the nine months ended September 30, 2019 compared to the nine months ended September 30, 2018.
Gain (Loss) on Investments, net
During the nine months ended September 30, 2019, we recognized a loss of $8.5 million, primarily in connection with other-than-temporary declines in the value of our investments. Gain on investments, net was $9.4 million for the nine months ended September 30, 2018.
Other Expense, Net
Other expense, net was $21.6 million for the nine months ended September 30, 2019 and related primarily to professional fees incurred in connection with the Chapter 11 Cases in the successor period. Other expense, net was $22.9 million for the nine months ended September 30, 2018 related primarily to expenses incurred in connection with negotiations with lenders and other activities related to our capital structure which were incurred prior to the filing of the Chapter 11 Cases.
Income Tax Benefit (Expense)
The income tax benefit for the nine months ended September 30, 2019 and September 30, 2018 was primarily attributed to the tax benefits recorded in connection with the Reorganization and fresh start adjustments during the period.
Year ended December 31, 2018 compared to Year Ended December 31, 2017
The unaudited condensed consolidated pro forma statement of operations for the years ended December 31, 2018, 2017 and 2016 reflect the Separation as if it occurred on January 1, 2016. In addition, the unaudited condensed consolidated pro forma statement of operations for the year ended December 31, 2018 reflects the Reorganization, the application of fresh start accounting and the application of proceeds from this offering as if they occurred on January 1, 2018. As a result of the application of fresh start accounting as required by ASC 852, the pro forma results of operations for the year ended December 31, 2018 are not comparable to the pro forma results of operations for the years ended December 31, 2017 and 2016. As presented in the unaudited condensed consolidated pro forma statement of operations for the year ended December 31, 2018, fresh start accounting adjustments have impacted certain financial statement line items as follows:
- •
- Direct operating expenses—$18.6 million increase as a result of adjustments to lease expense due to fair value adjustments applied to accruals for operating leases with escalating payments and deferred gains on sale-leaseback transactions, partially offset by a decrease resulting from adjusting prepayments on talent contracts to fair value.
29
- •
- Selling, general and administrative expenses—$8.3 million decrease as a result of adjusting prepaid implementation fees and other prepaid balances to fair value.
- •
- Depreciation and amortization—$169.9 million increase as a result of adjusting the balances of existing fixed assets and intangible assets to fair value, recording new intangible assets at fair value and recording the associated depreciation and amortization.
The net impact of the fresh start accounting adjustments is a $180.5 million decrease in operating income.
The comparison of our unaudited pro forma results of operations for the year ended December 31, 2018 reflecting the impacts of the Separation, the Reorganization, the application of fresh start accounting and the application of the net proceeds of this offering to our unaudited pro forma results of operations for the year ended December 31, 2017 reflecting the impacts of the Separation is as follows:
Consolidated Revenue
Consolidated revenue increased $24.4 million, primarily driven by political revenue, which increased $75.4 million in connection with the 2018 mid-term election cycle. Of the increase in political revenue, $39.6 million was generated by our iHM Business and $35.8 million was generated by our media representation business. Digital revenue, including subscription revenue from our iHeartRadio on-demand service, increased $36.2 million. These increases were partially offset by lower broadcast revenues, which decreased $65.1 million, primarily from local spot revenue, driven by lower local agency revenue. We believe disruption to our business resulting from the Chapter 11 Cases negatively impacted our revenue in the first half of the year.
Consolidated Direct Operating Expenses
Consolidated direct operating expenses increased $21.8 million during 2018 compared to 2017. Excluding the impact of fresh start accounting adjustments indicated above, the increase is due primarily to higher digital fees resulting from revenue growth by our iHeartRadio on-demand service and higher compensation and profit sharing expenses related to acquisitions and higher podcast revenues. These increases were partially offset by lower music license fees.
Consolidated Selling, General and Administrative Expenses
Consolidated SG&A expenses increased $22.6 million during 2018 compared to 2017. Excluding the impact of fresh start accounting adjustments indicated above, the increase resulted primarily due to increased expenses for our iHM Business including higher third-party sales activation fees and trade and barter expenses, partially offset by lower bad debt. SG&A expenses also increased for our media representation business as a result of higher variable compensation expense as a result of higher revenue.
Corporate Expenses
Corporate expenses increased $49.9 million during 2018 compared to 2017. Excluding the impact of fresh start accounting adjustments indicated above, the increase was primarily as a result of higher employee-related expenses, including non-cash stock compensation resulting from the equity awards expected to be granted in connection with the Reorganization, 20% of which vest 180 days after the grant date, and the cancellation of the previous stock compensation plan, as well as variable incentive compensation resulting from higher profitability, as well as employee benefits expense. These increases were partially offset by lower management fees and lower spending on efficiency initiatives.
30
Depreciation and Amortization
Depreciation and amortization increased $97.6 million during 2018 compared to 2017. Excluding the impact of fresh start accounting adjustments indicated above, and the $9.0 million decrease as a result of eliminating amortization of the Clear Channel trade name due to the CCOH Settlement Agreement, depreciation and amortization decreased primarily due to historical assets becoming fully depreciated or fully amortized, including intangible assets that were recorded as part of the merger of iHeartCommunications with iHeartMedia in 2008.
Impairment Charges
During 2018 we recorded impairment charges of $33.2 million related primarily to FCC licenses in several of our markets, and during 2017 we recorded an impairment charge of $6.0 million related to FCC licenses in one of our markets in connection with our annual impairment testing.
Other Operating Income (Expense), Net
Other operating expense, net of $9.3 million in 2018, primarily related to asset acquisition costs and net losses recognized on the disposal of assets. Other operating income, net of $9.3 million in 2017, primarily related to the gain on the exchange of four radio stations in Chattanooga, TN and six radio stations in Richmond, VA for four radio stations in Boston, MA and three radio stations in Seattle, WA.
Interest Expense
Interest expense decreased $1,097.5 million during 2018 compared to 2017 as a result of the significant decrease in long-term debt in connection with the Reorganization as if the Reorganization had occurred on January 1, 2018.
Other Expense, Net
Other expense, net was $23.1 million for the year 2018 related primarily to expenses incurred in connection with negotiations with lenders and other activities related to our capital structure which were incurred prior to the filing of the Chapter 11 Cases. Other expense, net was $45.1 million for the year 2017 related primarily to expenses incurred in connection with negotiations with lenders and other activities related to our capital structure, including $41.8 million related to the notes exchange offers and term loan offers that were launched in early 2017.
Income Tax Benefit (Expense)
Income tax benefit of $49.8 million on income before income taxes of $77.4 million was a decrease of $127.4 million during 2018 compared to 2017, which reflected an income tax benefit of $177.2 million on loss before income taxes of $833.2 million. The Reorganization, which is assumed to have occurred on January 1, 2018 for purposes of the 2018 unaudited pro forma condensed consolidated statement of operations, resulted in a significant increase in income before income taxes, primarily due to a decrease in interest expense compared to 2017 as discussed above.
31
Year ended December 31, 2017 compared to Year Ended December 31, 2016
The comparison of our unaudited pro forma results of operations for the year ended December 31, 2017 reflecting the impacts of the Separation to our unaudited pro forma results of operations for the year ended December 31, 2016 reflecting the impacts of the Separation is as follows:
Consolidated Revenue
Consolidated revenue increased $12.0 million during the year ended December 31, 2017 compared to 2016, due to our iHM Business revenues, which increased $39.0 million driven by growth in national trade and barter and digital revenue. Digital revenue grew $41.6 million as a result of digital subscription revenue from our iHeartRadio on-demand service, which was launched in 2017. These increases were partially offset by lower political revenue compared to the prior year as a result of 2016 being a presidential election year. iHM political revenue decreased $35.9 million and political revenue generated by our media representation business decreased $29.0 million.
Consolidated Direct Operating Expenses
Consolidated direct operating expenses increased $82.4 million during 2017 compared to 2016, which included a $33.8 million prior year benefit resulting from the renegotiation of certain contracts. Direct operating expenses also increased as a result of higher content and programming costs, including compensation for on-air talent, and digital performance license fees which increased due to the launch of iHeartRadio subscription services, as well as higher music royalty fees.
SG&A Expenses
Consolidated SG&A expenses increased $133.5 million during 2017 compared to 2016, including a $142.7 million increase due to higher trade and barter expenses, investments in national and digital sales capabilities, and higher variable expenses, including sales activation costs and commissions. SG&A expenses in our media representation business decreased $9.3 million primarily as a result of expense savings initiatives executed early in 2017.
Corporate Expenses
Corporate expenses decreased $16.6 million during the year ended December 31, 2017 compared to 2016. In 2017, we incurred professional fees directly related to negotiations with lenders and other activities related to our capital structure, including the notes exchange offers and term loan offers, and, accordingly, such fees are reflected in Other Income (Expense), net as further discussed below. In 2016, professional fees incurred in connection with our capital structure activities were reflected as part of corporate expenses. Employee benefit expense was also lower due to lower claims.
Depreciation and Amortization
Depreciation and amortization decreased $15.8 million during 2017 compared to 2016, primarily due to assets becoming fully depreciated or fully amortized.
Impairment Charges
During 2017 we recorded an impairment charge of $6.0 million related to FCC licenses in one of our markets, and during 2016 we recorded an impairment charge of $0.7 million related to FCC licenses in one of our markets in connection with our annual impairment testing.
32
Other Operating Income, Net
Other operating income, net of $9.3 million in 2017 primarily related to a gain recognized in connection with an exchange of four radio stations in Chattanooga, TN and six radio stations in Richmond, VA for four radio stations in Boston, MA and three radio stations in Seattle, WA. In 2016, we incurred net other operating losses of $1.1 million, primarily related to the disposal of assets.
Interest Expense
Interest expense increased $9.3 million during 2017 compared to 2016 due to higher interest rates on floating rate loans and new debt issuances.
Equity in Loss of Nonconsolidated Affiliates
During the years ended December 31, 2017 and 2016, we recognized losses of $1.9 million and $15.0 million, respectively, related to equity-method investments. The loss in 2016 related primarily to a $15.0 million non-cash impairment recorded in connection with an other-than-temporary decline in the value of one of our equity investments.
Gain on Extinguishment of Debt
During the fourth quarter of 2017, Broader Media, LLC, an indirect wholly-owned subsidiary of the Company, repurchased approximately $4.0 million aggregate principal amount of iHeartCommunications' 10.0% Senior Notes due 2018 for an aggregate purchase price of approximately $2.7 million. In connection with this repurchase, we recognized a gain of $1.3 million.
During the third quarter of 2016, Broader Media, LLC, an indirect wholly-owned subsidiary of the Company, repurchased approximately $383.0 million aggregate principal amount of iHeartCommunications' 10.0% Senior Notes due 2018 for an aggregate purchase price of approximately $222.2 million. In connection with this repurchase, we recognized a gain of $157.6 million.
Loss on Investments, Net
During the years ended December 31, 2017 and 2016, we recognized losses of $3.8 million and $13.4 million, respectively, related to our investments. The loss in 2016 related primarily to a $14.5 million non-cash impairment recorded in connection with an other-than-temporary decline in the value of one of our investments.
Other Expense, Net
Other expense, net was $45.1 million for the year 2017, which relates primarily to expenses incurred in connection with negotiations with lenders and other activities related to our capital structure, including the notes exchange offers and term loan offers of $41.8 million. Other expense, net was $2.4 million for the year 2016.
Income Tax Benefit (Expense)
Income tax benefit of $177.2 million on loss before income taxes of $833.2 million was an increase of $50.1 million during 2017 compared to 2016, which reflected an income tax benefit of $127.1 million on loss before income taxes of $481.3 million.
33
QuickLinks
Excerpts from Preliminary Offering Memorandum, dated November 18, 2019Our CompanyiHeartMedia Is America's #1 Audio Media Company By Reach And the Only Major Multi-Platform Audio Company Multi-Platform Audience/Usage (Millions)Market OpportunityOur Competitive StrengthsOur Growth StrategyUNAUDITED PRO FORMA CONDENSED CONSOLIDATED FINANCIAL DATAIHEARTMEDIA, INC. UNAUDITED PRO FORMA CONDENSED CONSOLIDATED STATEMENT OF OPERATIONS For the Nine Months Ended September 30, 2019 (in thousands)IHEARTMEDIA, INC. UNAUDITED PRO FORMA CONDENSED CONSOLIDATED STATEMENT OF OPERATIONS For the Nine Months Ended September 30, 2018 (in thousands)IHEARTMEDIA, INC. UNAUDITED PRO FORMA CONDENSED CONSOLIDATED STATEMENT OF OPERATIONS For the Year Ended December 31, 2018 (in thousands)IHEARTMEDIA, INC. UNAUDITED PRO FORMA CONDENSED CONSOLIDATED STATEMENT OF OPERATIONS For the Year Ended December 31, 2017 (in thousands)IHEARTMEDIA, INC. UNAUDITED PRO FORMA CONDENSED CONSOLIDATED STATEMENT OF OPERATIONS For the Year Ended December 31, 2016 (in thousands)Notes to the Unaudited Pro Forma Condensed Consolidated Financial StatementsNOTE 1—PRO FORMA STATEMENT OF OPERATIONS ADJUSTMENTSPro Forma Discussion and Analysis of Financial Condition and Results of Operations