Fidelity® International Credit Central Fund
Semi-Annual Report June 30, 2019 |
 |
Beginning on January 1, 2021, as permitted by regulations adopted by the Securities and Exchange Commission, paper copies of a fund’s shareholder reports will no longer be sent by mail, unless you specifically request paper copies of the reports from the fund or from your financial intermediary, such as a financial advisor, broker-dealer or bank. Instead, the reports will be made available on a website, and you will be notified by mail each time a report is posted and provided with a website link to access the report.
If you already elected to receive shareholder reports electronically, you will not be affected by this change and you need not take any action. You may elect to receive shareholder reports and other communications from a fund electronically, by contacting your financial intermediary. For Fidelity customers, visit Fidelity's web site or call Fidelity using the contact information listed below.
You may elect to receive all future reports in paper free of charge. If you wish to continue receiving paper copies of your shareholder reports, you may contact your financial intermediary or, if you are a Fidelity customer, visit Fidelity’s website, or call Fidelity at the applicable toll-free number listed below. Your election to receive reports in paper will apply to all funds held with the fund complex/your financial intermediary.
| Account Type | Website | Phone Number |
| Brokerage, Mutual Fund, or Annuity Contracts: | fidelity.com/mailpreferences | 1-800-343-3548 |
| Employer Provided Retirement Accounts: | netbenefits.fidelity.com/preferences (choose 'no' under Required Disclosures to continue to print) | 1-800-343-0860 |
| Advisor Sold Accounts Serviced Through Your Financial Intermediary: | Contact Your Financial Intermediary | Your Financial Intermediary's phone number |
| Advisor Sold Accounts Serviced by Fidelity: | institutional.fidelity.com | 1-877-208-0098 |
Contents
To view a fund's proxy voting guidelines and proxy voting record for the 12-month period ended June 30, visit http://www.fidelity.com/proxyvotingresults or visit the Securities and Exchange Commission's (SEC) web site at http://www.sec.gov.
You may also call 1-800-544-8544 to request a free copy of the proxy voting guidelines.
Standard & Poor's, S&P and S&P 500 are registered service marks of The McGraw-Hill Companies, Inc. and have been licensed for use by Fidelity Distributors Corporation.
Other third-party marks appearing herein are the property of their respective owners.
All other marks appearing herein are registered or unregistered trademarks or service marks of FMR LLC or an affiliated company. © 2019 FMR LLC. All rights reserved.
A fund files its complete schedule of portfolio holdings with the SEC for the first and third quarters of each fiscal year on Form N-PORT. Forms N-PORT are available on the SEC’s web site at http://www.sec.gov. A fund's Forms N-PORT may be reviewed and copied at the SEC’s Public Reference Room in Washington, DC. Information regarding the operation of the SEC's Public Reference Room may be obtained by calling 1-800-SEC-0330.
Investment Summary (Unaudited)
Geographic Diversification (% of fund's net assets)
| As of June 30, 2019 |
| | United States of America | 18.3% |
| | United Kingdom | 14.6% |
| | Netherlands | 10.0% |
| | Luxembourg | 8.1% |
| | Switzerland | 7.8% |
| | Italy | 6.1% |
| | Germany | 6.0% |
| | Denmark | 5.5% |
| | France | 4.9% |
| | Other | 18.7% |
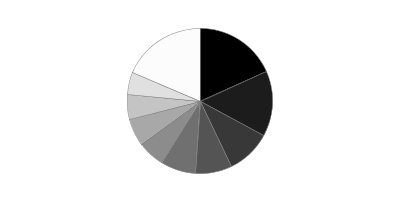
Percentages are based on country or territory of incorporation and are adjusted for the effect of futures contracts, options and swaps, as applicable. Foreign currency contracts and other assets and liabilities are included within the United States of America, as applicable.
Quality Diversification (% of fund's net assets)
| As of June 30, 2019 |
| | U.S. Government and U.S. Government Agency Obligations | 3.2% |
| | AA | 2.0% |
| | A | 2.7% |
| | BBB | 63.1% |
| | BB and Below | 19.1% |
| | Not Rated | 6.0% |
| | Equities | 0.3% |
| | Short-Term Investments and Net Other Assets | 3.6% |
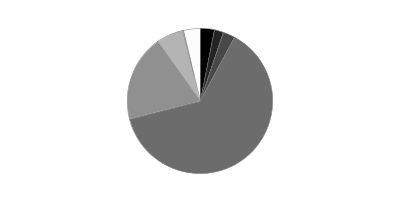
We have used ratings from Moody's Investors Service, Inc. Where Moody's® ratings are not available, we have used S&P® ratings. All ratings are as of the date indicated and do not reflect subsequent changes.
Asset Allocation (% of fund's net assets)
| As of June 30, 2019*,** |
| | Corporate Bonds | 67.5% |
| | U.S. Government and Government Agency Obligations | 3.2% |
| | Foreign Government and Government Agency Obligations | 6.5% |
| | Nonconvertible Preferred Stocks | 0.3% |
| | Preferred Securities | 18.9% |
| | Short-Term Investments and Net Other Assets (Liabilities) | 3.6% |
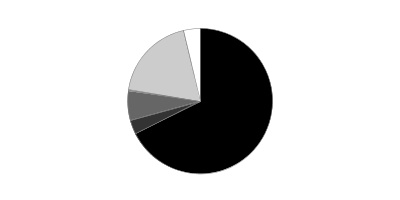
* Futures and Swaps - 24.0%
** Foreign Currency Contracts - (76.4)%
Schedule of Investments June 30, 2019 (Unaudited)
Showing Percentage of Net Assets
| Nonconvertible Bonds - 67.5% | | | |
| | | Principal Amount(a) | Value |
| Argentina - 0.9% | | | |
| YPF SA 8.5% 3/23/21 (Reg. S) | | $1,630,000 | $1,657,506 |
| Bailiwick of Jersey - 1.0% | | | |
| Heathrow Funding Ltd. 7.125% 2/14/24 | GBP | 1,150,000 | 1,768,102 |
| Denmark - 5.3% | | | |
| Danske Bank A/S: | | | |
| 1.375% 5/24/22 (Reg. S) | EUR | 750,000 | 872,336 |
| 5% 1/12/22 (b) | | 1,720,000 | 1,798,679 |
| 5.375% 1/12/24 (Reg. S) | | 1,930,000 | 2,085,171 |
| DONG Energy A/S 2.125% 5/17/27 (Reg. S) | GBP | 900,000 | 1,176,288 |
| Nykredit Realkredit A/S 4% 6/3/36 (Reg. S) (c) | EUR | 2,445,000 | 2,931,798 |
| Vestas Wind Systems A/S 2.75% 3/11/22 (Reg. S) | EUR | 697,000 | 838,828 |
|
| TOTAL DENMARK | | | 9,703,100 |
|
| Estonia - 0.3% | | | |
| Luminor Bank A/S Estonia 1.375% 10/21/22 (Reg. S) | EUR | 440,000 | 504,992 |
| France - 3.8% | | | |
| Casino Guichard Perrachon SA 5.244% 3/9/20 (c) | EUR | 500,000 | 557,890 |
| Iliad SA 0.625% 11/25/21 (Reg. S) | EUR | 2,800,000 | 3,172,418 |
| Lagardere S.C.A.: | | | |
| 1.625% 6/21/24 (Reg. S) | EUR | 900,000 | 1,026,231 |
| 2.75% 4/13/23 (Reg. S) | EUR | 1,900,000 | 2,269,487 |
|
| TOTAL FRANCE | | | 7,026,026 |
|
| Germany - 5.6% | | | |
| alstria office REIT-AG 1.5% 11/15/27 (Reg. S) | EUR | 900,000 | 1,041,052 |
| Bayer AG: | | | |
| 2.375% 4/2/75 (Reg. S) (c) | EUR | 1,200,000 | 1,362,637 |
| 3% 7/1/75 (Reg S.) (c) | EUR | 750,000 | 866,540 |
| Deutsche Bank AG: | | | |
| 1.625% 2/12/21 (Reg. S) | EUR | 4,800,000 | 5,500,939 |
| 5% 6/24/20 | EUR | 1,250,000 | 1,469,008 |
|
| TOTAL GERMANY | | | 10,240,176 |
|
| Ireland - 1.4% | | | |
| Allied Irish Banks PLC 4.125% 11/26/25 (Reg. S) (c) | EUR | 1,765,000 | 2,101,695 |
| Bank Ireland Group PLC 3.125% 9/19/27 (Reg. S) (c) | GBP | 350,000 | 436,437 |
|
| TOTAL IRELAND | | | 2,538,132 |
|
| Italy - 2.4% | | | |
| Banca Monte dei Paschi di Siena SpA 5.375% 1/18/28 (c) | EUR | 550,000 | 379,152 |
| Telecom Italia SpA 4% 4/11/24 (Reg. S) | EUR | 800,000 | 981,992 |
| UniCredit SpA: | | | |
| 4.375% 1/3/27 (Reg. S) (c) | EUR | 700,000 | 830,833 |
| 6.572% 1/14/22 (b) | | 2,150,000 | 2,284,921 |
|
| TOTAL ITALY | | | 4,476,898 |
|
| Luxembourg - 5.6% | | | |
| Alpha Trains Finance SA 2.064% 6/30/25 | EUR | 1,399,000 | 1,673,700 |
| Blackstone Property Partners Europe LP: | | | |
| 1.4% 7/6/22 (Reg. S) | EUR | 610,000 | 709,605 |
| 2% 2/15/24 (Reg. S) | EUR | 700,000 | 834,645 |
| 2.2% 7/24/25 (Reg. S) | EUR | 2,209,000 | 2,651,830 |
| CPI Property Group SA 1.45% 4/14/22 (Reg. S) | EUR | 2,675,000 | 3,081,665 |
| Millicom International Cellular SA 6.625% 10/15/26 (b) | | 295,000 | 321,423 |
| SELP Finance SARL 1.5% 12/20/26 (Reg. S) | EUR | 890,000 | 1,029,116 |
|
| TOTAL LUXEMBOURG | | | 10,301,984 |
|
| Mexico - 3.5% | | | |
| CEMEX S.A.B. de CV 3.125% 3/19/26 (Reg. S) | EUR | 950,000 | 1,105,365 |
| Gruma S.A.B. de CV 4.875% 12/1/24 (Reg. S) | | 470,000 | 499,375 |
| Petroleos Mexicanos: | | | |
| 2.5% 11/24/22 (Reg. S) | EUR | 159,000 | 175,149 |
| 3.625% 11/24/25 (Reg. S) | EUR | 670,000 | 727,097 |
| 3.75% 2/21/24 (Reg. S) | EUR | 3,555,000 | 4,023,442 |
|
| TOTAL MEXICO | | | 6,530,428 |
|
| Netherlands - 5.9% | | | |
| ABN AMRO Bank NV 4.4% 3/27/28 (Reg. S) (c) | | 400,000 | 412,283 |
| Demeter Investments BV: | | | |
| 5.625% 8/15/52 (Reg. S) (c) | | 355,000 | 379,406 |
| 5.75% 8/15/50 (Reg. S) (c) | | 850,000 | 915,875 |
| Deutsche Annington Finance BV 5% 10/2/23 (b) | | 950,000 | 1,000,691 |
| Koninklijke Ahold Delhaize NV 0.25% 6/26/25 (Reg. S) | EUR | 1,200,000 | 1,358,557 |
| Mylan NV 2.25% 11/22/24 (Reg. S) | EUR | 695,000 | 804,035 |
| Petrobras Global Finance BV 8.75% 5/23/26 | | 1,200,000 | 1,482,120 |
| Samvardhana Motherson Automotive Systems Group BV 1.8% 7/6/24 (Reg. S) | EUR | 1,800,000 | 1,872,558 |
| Teva Pharmaceutical Finance Netherlands III BV: | | | |
| 0.375% 7/25/20 (Reg. S) | EUR | 520,000 | 579,466 |
| 4.5% 3/1/25 | EUR | 750,000 | 816,553 |
| WPC Eurobond BV 2.25% 4/9/26 | EUR | 970,000 | 1,175,621 |
|
| TOTAL NETHERLANDS | | | 10,797,165 |
|
| Spain - 1.7% | | | |
| CaixaBank SA 1.75% 10/24/23 (Reg. S) | EUR | 2,100,000 | 2,491,545 |
| Indra Sistemas SA 3% 4/19/24 (Reg. S) | EUR | 600,000 | 699,180 |
|
| TOTAL SPAIN | | | 3,190,725 |
|
| Sweden - 3.3% | | | |
| Heimstaden Bostad AB 1.75% 12/7/21 (Reg. S) | EUR | 2,710,000 | 3,176,311 |
| Samhallsbyggnadsbolaget I Norden AB 1.75% 1/14/25 (Reg. S) | EUR | 1,840,000 | 2,127,577 |
| Vattenfall AB 0.5% 6/24/26 (Reg. S) | EUR | 690,000 | 793,383 |
|
| TOTAL SWEDEN | | | 6,097,271 |
|
| Switzerland - 7.8% | | | |
| Credit Suisse Group AG: | | | |
| 5.75% 9/18/25 (Reg. S) (c) | EUR | 3,900,000 | 4,717,401 |
| 6.5% 8/8/23 (Reg. S) | | 3,565,000 | 3,921,500 |
| UBS AG 4.75% 2/12/26 (Reg. S) (c) | EUR | 4,814,000 | 5,836,521 |
|
| TOTAL SWITZERLAND | | | 14,475,422 |
|
| Turkey - 1.0% | | | |
| Turkiye Garanti Bankasi A/S: | | | |
| 3.375% 7/8/19 (Reg. S) | EUR | 854,000 | 968,656 |
| 6.25% 4/20/21 (Reg. S) | | 920,000 | 933,800 |
|
| TOTAL TURKEY | | | 1,902,456 |
|
| United Kingdom - 6.3% | | | |
| Barclays PLC: | | | |
| 2% 2/7/28 (Reg. S) (c) | EUR | 850,000 | 948,758 |
| 2.625% 11/11/25 (Reg. S) (c) | EUR | 1,550,000 | 1,785,009 |
| 3.932% 5/7/25 (c) | | 242,000 | 246,176 |
| BAT International Finance PLC 1.25% 3/13/27 (Reg. S) | EUR | 1,040,000 | 1,169,434 |
| CYBG PLC 3.125% 6/22/25 (Reg. S) (c) | GBP | 535,000 | 661,991 |
| Imperial Tobacco Finance PLC: | | | |
| 1.125% 8/14/23 (Reg. S) | EUR | 1,700,000 | 1,971,318 |
| 3.375% 2/26/26 (Reg. S) | EUR | 650,000 | 835,397 |
| 8.125% 3/15/24 | GBP | 975,000 | 1,572,478 |
| John Lewis PLC 6.125% 1/21/25 | GBP | 386,000 | 549,810 |
| Nationwide Building Society 3.622% 4/26/23 (b)(c) | | 614,000 | 625,167 |
| Travis Perkins PLC: | | | |
| 4.375% 9/15/21 (Reg. S) | GBP | 325,000 | 425,941 |
| 4.5% 9/7/23 (Reg. S) | GBP | 600,000 | 781,720 |
|
| TOTAL UNITED KINGDOM | | | 11,573,199 |
|
| United States of America - 11.7% | | | |
| Bayer U.S. Finance II LLC 4.25% 12/15/25 (b) | | 2,900,000 | 3,066,606 |
| CEMEX Finance LLC 4.625% 6/15/24 | EUR | 1,475,000 | 1,761,197 |
| Citigroup, Inc. 4.3% 11/20/26 | | 1,715,000 | 1,820,558 |
| DCP Midstream LLC 4.75% 9/30/21 (b) | | 100,000 | 102,500 |
| Ford Motor Credit Co. LLC 1.514% 2/17/23 | EUR | 2,200,000 | 2,517,480 |
| Goldman Sachs Group, Inc. 4.25% 10/21/25 | | 2,612,000 | 2,769,813 |
| International Flavors & Fragrances, Inc. 1.8% 9/25/26 | EUR | 1,550,000 | 1,878,238 |
| Marsh & McLennan Companies, Inc. 1.349% 9/21/26 | EUR | 950,000 | 1,123,977 |
| Morgan Stanley: | | | |
| 3.95% 4/23/27 | | 1,343,000 | 1,404,135 |
| 4.35% 9/8/26 | | 625,000 | 669,937 |
| Reynolds American, Inc. 4.45% 6/12/25 | | 3,576,000 | 3,789,939 |
| Time Warner Cable, Inc. 4.5% 9/15/42 | | 825,000 | 775,162 |
|
| TOTAL UNITED STATES OF AMERICA | | | 21,679,542 |
|
| TOTAL NONCONVERTIBLE BONDS | | | |
| (Cost $123,535,379) | | | 124,463,124 |
|
| U.S. Government and Government Agency Obligations - 3.2% | | | |
| U.S. Treasury Obligations - 3.2% | | | |
| U.S. Treasury Bonds: | | | |
| 2.5% 2/15/45 (d) | | $59,000 | $58,710 |
| 3% 5/15/47 (d) | | 297,000 | 324,925 |
| U.S. Treasury Notes: | | | |
| 2% 5/31/24 | | 225,000 | 227,531 |
| 2.125% 11/30/24 | | 2,600,000 | 2,643,266 |
| 2.125% 5/15/25 (d)(e)(f) | | 695,000 | 706,348 |
| 2.625% 2/15/29 | | 220,000 | 231,868 |
| 2.75% 11/30/20 (f) | | 1,642,000 | 1,662,268 |
| | | | 5,854,916 |
| TOTAL U.S. GOVERNMENT AND GOVERNMENT AGENCY OBLIGATIONS | | | |
| (Cost $5,650,686) | | | 5,854,916 |
|
| Foreign Government and Government Agency Obligations - 6.5% | | | |
| Indonesia - 1.3% | | | |
| Indonesian Republic 2.625% 6/14/23 | EUR | $2,000,000 | $2,453,293 |
| Italy - 3.0% | | | |
| Italian Republic 3.75% 5/1/21 (b) | EUR | 4,539,000 | 5,491,672 |
| United Kingdom - 2.2% | | | |
| United Kingdom, Great Britain and Northern Ireland: | | | |
| 1.625% 10/22/28 | GBP | 200,000 | 271,875 |
| 1.75% 9/7/37 (d)(e) | GBP | 1,777,000 | 2,401,807 |
| 4.25% 3/7/36 (e) | GBP | 310,000 | 570,535 |
| 4.25% 12/7/49 (d) | GBP | 353,000 | 754,745 |
|
| TOTAL UNITED KINGDOM | | | 3,998,962 |
|
| TOTAL FOREIGN GOVERNMENT AND GOVERNMENT AGENCY OBLIGATIONS | | | |
| (Cost $11,611,463) | | | 11,943,927 |
| | | Shares | Value |
|
| Nonconvertible Preferred Stocks - 0.3% | | | |
| United Kingdom - 0.3% | | | |
| Nationwide Building Society 10.25% | | | |
| (Cost $667,935) | | 3,207 | 614,473 |
| | | Principal Amount(a) | Value |
|
| Preferred Securities - 18.9% | | | |
| Australia - 0.8% | | | |
| QBE Insurance Group Ltd. 5.25% (Reg. S) (c)(g) | | 1,495,000 | 1,472,080 |
| Canada - 0.7% | | | |
| Bank of Nova Scotia 4.65% (c)(g) | | 1,415,000 | 1,368,127 |
| Denmark - 0.2% | | | |
| Danske Bank A/S 5.875% (Reg. S) (c)(g) | EUR | 380,000 | 461,845 |
| France - 1.1% | | | |
| Credit Agricole Assurances SA 4.25% (Reg. S) (c)(g) | EUR | 1,000,000 | 1,259,882 |
| Danone SA 1.75% (Reg. S) (c)(g) | EUR | 700,000 | 810,205 |
|
| TOTAL FRANCE | | | 2,070,087 |
|
| Germany - 0.4% | | | |
| Deutsche Bank AG 6% (Reg. S) (c)(g) | EUR | 700,000 | 715,317 |
| Ireland - 0.5% | | | |
| Allied Irish Banks PLC 7.375% (Reg. S) (c)(g) | EUR | 700,000 | 863,156 |
| Italy - 0.7% | | | |
| Assicurazioni Generali SpA 6.416% (c)(g) | GBP | 900,000 | 1,225,975 |
| Luxembourg - 2.5% | | | |
| CPI Property Group SA 4.375% (Reg. S) (c)(g) | EUR | 1,250,000 | 1,441,169 |
| Grand City Properties SA 3.75% (c)(g) | EUR | 2,600,000 | 3,164,212 |
|
| TOTAL LUXEMBOURG | | | 4,605,381 |
|
| Netherlands - 4.1% | | | |
| Deutsche Annington Finance BV 4% (Reg. S) (c)(g) | EUR | 500,000 | 619,850 |
| Stichting AK Rabobank Certificaten 6.5% (Reg. S) (g) | EUR | 865,000 | 1,201,824 |
| Volkswagen International Finance NV: | | | |
| 2.5%(Reg. S) (c)(g) | EUR | 2,745,000 | 3,189,207 |
| 2.7%(Reg. S) (c)(g) | EUR | 500,000 | 584,598 |
| 3.75% (c)(g) | EUR | 1,650,000 | 1,970,647 |
|
| TOTAL NETHERLANDS | | | 7,566,126 |
|
| Spain - 1.6% | | | |
| Banco Bilbao Vizcaya Argentaria SA: | | | |
| 5.875% (Reg. S) (c)(g) | EUR | 1,200,000 | 1,412,234 |
| 6.75% (Reg. S) (c)(g) | EUR | 1,400,000 | 1,648,525 |
|
| TOTAL SPAIN | | | 3,060,759 |
|
| Sweden - 0.7% | | | |
| Samhallsbyggnadsbolaget I Norden AB 4.625% (Reg. S) (c)(g) | EUR | 1,080,000 | 1,259,830 |
| United Kingdom - 5.6% | | | |
| Aviva PLC: | | | |
| 5.9021% (c)(g) | GBP | 650,000 | 895,481 |
| 6.125% (c)(g) | GBP | 2,930,000 | 4,190,342 |
| Barclays Bank PLC 7.625% 11/21/22 | | 1,605,000 | 1,766,102 |
| Barclays PLC 7.125% (c)(g) | GBP | 690,000 | 917,681 |
| CYBG PLC 9.25% (Reg. S) (c)(g) | GBP | 500,000 | 667,885 |
| HSBC Holdings PLC 5.25% (c)(g) | EUR | 897,000 | 1,114,725 |
| Pennon Group PLC 2.875% (Reg. S) (c)(g) | GBP | 575,000 | 734,942 |
|
| TOTAL UNITED KINGDOM | | | 10,287,158 |
|
| TOTAL PREFERRED SECURITIES | | | |
| (Cost $35,054,751) | | | 34,955,841 |
| | | Shares | Value |
|
| Money Market Funds - 0.2% | | | |
| Fidelity Cash Central Fund 2.42% (h) | | | |
| (Cost $442,330) | | 442,246 | 442,334 |
| Purchased Swaptions - 0.1%(i) | | | | |
| | | Expiration Date | Notional Amount | Value |
| Put Options - 0.1% | | | | |
| Option with an exercise rate of 2.75% on a credit default swap with Citibank, N.A. to buy protection on the 5-Year iTraxx Europe Crossover Series 31 Index expiring June 2024, paying 5% quarterly. | | 8/21/19 | EUR 13,850,000 | $76,139 |
| Option with an exercise rate of 3.00% on a credit default swap with Goldman Sachs Bank USA to buy protection on the 5-Year iTraxx Europe Crossover Series 31 Index expiring June 2024, paying 5% quarterly. | | 7/17/19 | EUR 32,200,000 | 22,738 |
|
| TOTAL PUT OPTIONS | | | | 98,877 |
|
| TOTAL PURCHASED SWAPTIONS | | | | |
| (Cost $466,666) | | | | 98,877 |
| TOTAL INVESTMENT IN SECURITIES - 96.7% | | | | |
| (Cost $177,429,210) | | | | 178,373,492 |
| NET OTHER ASSETS (LIABILITIES) - 3.3% | | | | 6,157,957 |
| NET ASSETS - 100% | | | | $184,531,449 |
| Futures Contracts | | | | | |
| | Number of contracts | Expiration Date | Notional Amount | Value | Unrealized Appreciation/(Depreciation) |
| Purchased | | | | | |
| Bond Index Contracts | | | | | |
| ASX 10 Year Treasury Bond Index Contracts (Australia) | 15 | Sept. 2019 | $1,512,744 | $17,177 | $17,177 |
| Eurex Euro-Bund Contracts (Germany) | 2 | Sept. 2019 | 392,845 | (206) | (206) |
| ICE Long Gilt Contracts (United Kingdom) | 5 | Sept. 2019 | 827,372 | 8,279 | 8,279 |
| TME 10 Year Canadian Note Contracts (Canada) | 57 | Sept. 2019 | 6,221,229 | 46,157 | 46,157 |
| TOTAL BOND INDEX CONTRACTS | | | | | 71,407 |
| Treasury Contracts | | | | | |
| CBOT 2-Year U.S. Treasury Note Contracts (United States) | 21 | Sept. 2019 | 4,518,773 | 24,732 | 24,732 |
| CBOT 5-Year U.S. Treasury Note Contracts (United States) | 64 | Sept. 2019 | 7,562,000 | 86,732 | 86,732 |
| CBOT Long Term U.S. Treasury Bond Contracts (United States) | 31 | Sept. 2019 | 4,823,406 | 129,503 | 129,503 |
| CBOT Ultra 10-Year U.S. Treasury Note Contracts (United States) | 50 | Sept. 2019 | 6,906,250 | 139,797 | 139,797 |
| CBOT Ultra Long Term U.S. Treasury Bond Contracts (United States) | 25 | Sept. 2019 | 4,439,063 | 133,445 | 133,445 |
| TOTAL TREASURY CONTRACTS | | | | | 514,209 |
|
| TOTAL PURCHASED | | | | | 585,616 |
|
| Sold | | | | | |
| Bond Index Contracts | | | | | |
| Eurex Euro-Bobl Contracts (Germany) | 15 | Sept. 2019 | 2,293,076 | (4,028) | (4,028) |
| TOTAL FUTURES CONTRACTS | | | | | $581,588 |
The notional amount of futures purchased as a percentage of Net Assets is 20.2%
The notional amount of futures sold as a percentage of Net Assets is 1.2%
For the period, the average monthly notional amount at value for futures contracts in the aggregate was $49,305,269.
| Forward Foreign Currency Contracts | | | | | | |
| Currency Purchased | Currency Sold | Counterparty | Settlement Date | Unrealized Appreciation/(Depreciation) |
| EUR | 150,000 | USD | 169,705 | Bank Of America, N.A. | 8/27/19 | $1,654 |
| EUR | 671,000 | USD | 764,688 | Bank Of America, N.A. | 8/27/19 | 1,856 |
| EUR | 121,000 | USD | 136,691 | Goldman Sachs Bank USA | 8/27/19 | 1,538 |
| EUR | 124,000 | USD | 141,086 | JPMorgan Chase Bank, N.A. | 8/27/19 | 571 |
| EUR | 177,000 | USD | 202,554 | JPMorgan Chase Bank, N.A. | 8/27/19 | (351) |
| EUR | 274,000 | USD | 309,346 | State Street Bank And Trust Co | 8/27/19 | 3,669 |
| USD | 50,004 | CAD | 67,000 | Goldman Sachs Bank USA | 8/27/19 | (1,216) |
| USD | 200,248 | EUR | 178,000 | BNP Paribas SA | 8/27/19 | (3,097) |
| USD | 207,933 | EUR | 183,000 | BNP Paribas SA | 8/27/19 | (1,125) |
| USD | 456,240 | EUR | 401,000 | BNP Paribas SA | 8/27/19 | (1,859) |
| USD | 709,400 | EUR | 629,000 | Bank Of America, N.A. | 8/27/19 | (9,163) |
| USD | 1,125,981 | EUR | 985,000 | Bank Of America, N.A. | 8/27/19 | 727 |
| USD | 102,692 | EUR | 90,000 | Goldman Sachs Bank USA | 8/27/19 | (123) |
| USD | 215,373 | EUR | 191,000 | Goldman Sachs Bank USA | 8/27/19 | (2,823) |
| USD | 170,440 | EUR | 151,000 | JPMorgan Chase Bank, N.A. | 8/27/19 | (2,061) |
| USD | 55,799,753 | EUR | 49,240,000 | State Street Bank And Trust Co | 8/27/19 | (451,547) |
| USD | 970,175 | EUR | 865,000 | State Street Bank And Trust Co | 8/27/19 | (17,992) |
| USD | 20,222,568 | GBP | 15,533,000 | Goldman Sachs Bank USA | 8/27/19 | 443,276 |
| USD | 952,529 | GBP | 747,000 | Goldman Sachs Bank USA | 8/27/19 | 1,320 |
| USD | 136,229 | GBP | 107,000 | Goldman Sachs Bank USA | 8/27/19 | (22) |
| USD | 173,227 | GBP | 136,000 | State Street Bank And Trust Co | 8/27/19 | 49 |
| USD | 60,618,000 | EUR | 53,489,885 | JPMorgan Chase Bank, N.A. | 8/30/19 | (502,956) |
| TOTAL FORWARD FOREIGN CURRENCY CONTRACTS | | | | | | $(539,675) |
| | | | | | Unrealized Appreciation | 454,660 |
| | | | | | Unrealized Depreciation | (994,335) |
For the period, the average contract value for forward foreign currency contracts was $140,304,787. Contract value represents contract amount in United States dollars plus or minus unrealized appreciation or depreciation, respectively
Swaps
| Underlying Reference | Maturity Date | Clearinghouse / Counterparty | Fixed Payment Received/(Paid) | Payment Frequency | Notional Amount | Value | Upfront Premium Received/(Paid) | Unrealized Appreciation/(Depreciation) |
| Credit Default Swaps | | | | | | | | |
| Buy Protection | | | | | | | | |
| Accor SA | Jun. 2022 | BNP Paribas SA | (1%) | Quarterly | EUR 890,000 | $(19,769) | $9,321 | $(10,448) |
| Gas Natural Capital Markets SA | Jun. 2022 | Goldman Sachs Bank USA | (1%) | Quarterly | EUR 1,800,000 | (49,244) | 22,916 | (26,328) |
| Standard Chartered Bank | Jun. 2022 | Goldman Sachs Bank USA | (1%) | Quarterly | EUR 920,000 | (21,438) | (9,218) | (30,656) |
|
| TOTAL CREDIT DEFAULT SWAPS | | | | | | $(90,451) | $23,019 | $(67,432) |
|
Swaps
| Payment Received | Payment Frequency | Payment Paid | Payment Frequency | Clearinghouse / Counterparty(1) | Maturity Date | Notional Amount | Value | Upfront Premium Received/(Paid)(2) | Unrealized Appreciation/(Depreciation) |
| Interest Rate Swaps | | | | | | | | | |
| 0.75% | Annual | 6-month EURIBOR(3) | Semi - annual | LCH | Dec. 2029 | EUR 3,750,000 | $127,405 | $0 | $127,405 |
| 1.25% | Annual | 6-month EURIBOR(3) | Semi - annual | LCH | Dec. 2034 | EUR 5,990,000 | 236,270 | 0 | 236,270 |
| 1.25% | Semi - annual | 6-month EURIBOR(3) | Semi - annual | LCH | Dec. 2039 | EUR 1,170,000 | 45,229 | 0 | 45,229 |
|
| TOTAL INTEREST RATE SWAPS | | | | | | | $408,904 | $0 | $408,904 |
|
(1) Swaps with LCH Clearnet Group (LCH) are centrally cleared over-the-counter (OTC) swaps.
(2) Any premiums for centrally cleared over-the-counter (OTC) swaps are recorded periodically throughout the term of the swap to variation margin and included in unrealized appreciation (depreciation).
(3) Represents floating rate.
Currency Abbreviations
CAD – Canadian dollar
EUR – European Monetary Unit
GBP – British pound
USD – U.S. dollar
Categorizations in the Schedule of Investments are based on country or territory of incorporation.
Legend
(a) Amount is stated in United States dollars unless otherwise noted.
(b) Security exempt from registration under Rule 144A of the Securities Act of 1933. These securities may be resold in transactions exempt from registration, normally to qualified institutional buyers. At the end of the period, the value of these securities amounted to $14,691,659 or 8.0% of net assets.
(c) Coupon rates for floating and adjustable rate securities reflect the rates in effect at period end.
(d) Security or a portion of the security was pledged to cover margin requirements for centrally cleared OTC swaps. At period end, the value of securities pledged amounted to $623,528.
(e) Security or a portion of the security was pledged to cover margin requirements for futures contracts. At period end, the value of securities pledged amounted to $490,235.
(f) Security or a portion of the security has been segregated as collateral for open forward foreign currency contracts. At period end, the value of securities pledged amounted to $970,355.
(g) Security is perpetual in nature with no stated maturity date.
(h) Affiliated fund that is generally available only to investment companies and other accounts managed by Fidelity Investments. The rate quoted is the annualized seven-day yield of the fund at period end. A complete unaudited listing of the fund's holdings as of its most recent quarter end is available upon request. In addition, each Fidelity Central Fund's financial statements are available on the SEC's website or upon request.
(i) For the period, the average monthly notional amount for purchased swaptions was $36,002,085.
Affiliated Central Funds
Information regarding fiscal year to date income earned by the Fund from investments in Fidelity Central Funds is as follows:
| Fund | Income earned |
| Fidelity Cash Central Fund | $18,999 |
| Total | $18,999 |
Amounts in the income column in the above table include any capital gain distributions from underlying funds, which are presented in the corresponding line-item in the Statement of Operations, if applicable.
Investment Valuation
The following is a summary of the inputs used, as of June 30, 2019, involving the Fund's assets and liabilities carried at fair value. The inputs or methodology used for valuing securities may not be an indication of the risk associated with investing in those securities. For more information on valuation inputs, and their aggregation into the levels used below, please refer to the Investment Valuation section in the accompanying Notes to Financial Statements.
| | Valuation Inputs at Reporting Date: |
| Description | Total | Level 1 | Level 2 | Level 3 |
| Investments in Securities: | | | | |
| Equities: | | | | |
| Financials | $614,473 | $-- | $614,473 | $-- |
| Corporate Bonds | 124,463,124 | -- | 124,463,124 | -- |
| U.S. Government and Government Agency Obligations | 5,854,916 | -- | 5,854,916 | -- |
| Foreign Government and Government Agency Obligations | 11,943,927 | -- | 11,943,927 | -- |
| Preferred Securities | 34,955,841 | -- | 34,955,841 | -- |
| Money Market Funds | 442,334 | 442,334 | -- | -- |
| Purchased Swaptions | 98,877 | -- | 98,877 | -- |
| Total Investments in Securities: | $178,373,492 | $442,334 | $177,931,158 | $-- |
| Derivative Instruments: | | | | |
| Assets | | | | |
| Futures Contracts | $585,822 | $585,822 | $-- | $-- |
| Forward Foreign Currency Contracts | 454,660 | -- | 454,660 | -- |
| Swaps | 408,904 | -- | 408,904 | -- |
| Total Assets | $1,449,386 | $585,822 | $863,564 | $-- |
| Liabilities | | | | |
| Futures Contracts | $(4,234) | $(4,234) | $-- | $-- |
| Forward Foreign Currency Contracts | (994,335) | -- | (994,335) | -- |
| Swaps | (90,451) | -- | (90,451) | -- |
| Total Liabilities | $(1,089,020) | $(4,234) | $(1,084,786) | $-- |
| Total Derivative Instruments: | $360,366 | $581,588 | $(221,222) | $-- |
Value of Derivative Instruments
The following table is a summary of the Fund's value of derivative instruments by primary risk exposure as of June 30, 2019. For additional information on derivative instruments, please refer to the Derivative Instruments section in the accompanying Notes to Financial Statements.
| Primary Risk Exposure / Derivative Type | Value |
| | Asset | Liability |
| Credit Risk | | |
| Purchased Swaptions(a) | $98,877 | $0 |
| Swaps(b) | 0 | (90,451) |
| Total Credit Risk | 98,877 | (90,451) |
| Foreign Exchange Risk | | |
| Forward Foreign Currency Contracts(c) | 454,660 | (994,335) |
| Total Foreign Exchange Risk | 454,660 | (994,335) |
| Interest Rate Risk | | |
| Futures Contracts(d) | 585,822 | (4,234) |
| Swaps(e) | 408,904 | 0 |
| Total Interest Rate Risk | 994,726 | (4,234) |
| Total Value of Derivatives | $1,548,263 | $(1,089,020) |
(a) Gross value is included in the Statement of Assets and Liabilities in the investments, at value line-item.
(b) For bi-lateral over-the-counter (OTC) swaps, reflects gross value which is presented in the Statement of Assets and Liabilities in the bi-lateral OTC swaps, at value line-items.
(c) Gross value is presented in the Statement of Assets and Liabilities in the unrealized appreciation/depreciation on forward foreign currency contracts line-items.
(d) Reflects gross cumulative appreciation (depreciation) on futures contracts as presented in the Schedule of Investments. In the Statement of Assets and Liabilities, the period end daily variation margin is included in receivable or payable for daily variation margin on futures contracts, and the net cumulative appreciation (depreciation) is included in distributable earnings.
(e) For centrally cleared over-the-counter (OTC) swaps, reflects gross cumulative appreciation (depreciation) as presented in the Schedule of Investments. In the Statement of Assets and Liabilities, the period end daily variation margin for centrally cleared OTC swaps is included in receivable or payable for daily variation margin on centrally cleared OTC swaps, and the net cumulative appreciation (depreciation) for centrally cleared OTC swaps is included in distributable earnings.
The following table is a summary of the Fund's derivatives inclusive of potential netting arrangements.
| Counterparty | Value of Derivative Assets | Value of Derivative Liabilities | Collateral Received(a) | Collateral Pledged(a) | Net(b) |
| Goldman Sachs Bank USA | $468,872 | $(74,866) | $-- | $-- | $394,006 |
| Centrally Cleared OTC Swaps | 408,904 | -- | -- | -- | 408,904 |
| Citibank, N.A. | 76,139 | -- | -- | -- | 76,139 |
| Bank Of America, N.A. | 4,237 | (9,163) | -- | -- | (4,926) |
| State Street Bank and Trust Co | 3,718 | (469,539) | -- | 458,654 | (7,167) |
| JPMorgan Chase Bank, N.A. | 571 | (505,368) | -- | 504,797 | -- |
| BNP Paribas SA | -- | (25,850) | -- | -- | (25,850) |
| Exchange Traded Futures | 585,822 | (4,234) | -- | -- | 581,588 |
| Total | $1,548,263 | $(1,089,020) | | | |
(a) Reflects collateral received from or pledged to an individual counterparty, excluding any excess or initial collateral amounts.
(b) Net represents the receivable / (payable) that would be due from / (to) the counterparty in an event of default. Netting may be allowed across transactions traded under the same legal agreement with the same legal entity. Please refer to Derivative Instruments - Risk Exposures and the Use of Derivative Instruments section in the accompanying Notes to Financial Statements.
See accompanying notes which are an integral part of the financial statements.
Financial Statements
Statement of Assets and Liabilities
| | | June 30, 2019 (Unaudited) |
| Assets | | |
Investment in securities, at value — See accompanying schedule:
Unaffiliated issuers (cost $176,986,880) | $177,931,158 | |
| Fidelity Central Funds (cost $442,330) | 442,334 | |
| Total Investment in Securities (cost $177,429,210) | | $178,373,492 |
| Foreign currency held at value (cost $4,022,380) | | 4,047,659 |
| Receivable for investments sold | | 1,088,533 |
| Unrealized appreciation on forward foreign currency contracts | | 454,660 |
| Receivable for fund shares sold | | 27,391 |
| Dividends receivable | | 1,254 |
| Interest receivable | | 1,719,441 |
| Distributions receivable from Fidelity Central Funds | | 990 |
| Receivable for daily variation margin on centrally cleared OTC swaps | | 43,818 |
| Total assets | | 185,757,238 |
| Liabilities | | |
| Unrealized depreciation on forward foreign currency contracts | $994,335 | |
| Payable for fund shares redeemed | 114,031 | |
| Bi-lateral OTC swaps, at value | 90,451 | |
| Payable for daily variation margin on futures contracts | 20,491 | |
| Other payables and accrued expenses | 6,481 | |
| Total liabilities | | 1,225,789 |
| Net Assets | | $184,531,449 |
| Net Assets consist of: | | |
| Paid in capital | | $178,401,570 |
| Total distributable earnings (loss) | | 6,129,879 |
| Net Assets, for 1,812,197 shares outstanding | | $184,531,449 |
| Net Asset Value, offering price and redemption price per share ($184,531,449 ÷ 1,812,197 shares) | | $101.83 |
See accompanying notes which are an integral part of the financial statements.
Statement of Operations
| | | Six months ended June 30, 2019 (Unaudited) |
| Investment Income | | |
| Dividends | | $731,941 |
| Interest | | 1,769,054 |
| Income from Fidelity Central Funds | | 18,999 |
| Income before foreign taxes withheld | | 2,519,994 |
| Less foreign taxes withheld | | (35,129) |
| Total income | | 2,484,865 |
| Expenses | | |
| Custodian fees and expenses | $6,431 | |
| Independent directors' fees and expenses | 323 | |
| Miscellaneous | 3 | |
| Total expenses | | 6,757 |
| Net investment income (loss) | | 2,478,108 |
| Realized and Unrealized Gain (Loss) | | |
| Net realized gain (loss) on: | | |
| Investment securities: | | |
| Unaffiliated issuers | (1,585,075) | |
| Fidelity Central Funds | 26 | |
| Forward foreign currency contracts | 2,711,593 | |
| Foreign currency transactions | (93,003) | |
| Futures contracts | 1,743,994 | |
| Swaps | 705,301 | |
| Total net realized gain (loss) | | 3,482,836 |
| Change in net unrealized appreciation (depreciation) on: | | |
| Investment securities: | | |
| Unaffiliated issuers | 9,374,340 | |
| Fidelity Central Funds | (27) | |
| Forward foreign currency contracts | 99,318 | |
| Assets and liabilities in foreign currencies | 14,133 | |
| Futures contracts | (274,732) | |
| Swaps | 334,234 | |
| Total change in net unrealized appreciation (depreciation) | | 9,547,266 |
| Net gain (loss) | | 13,030,102 |
| Net increase (decrease) in net assets resulting from operations | | $15,508,210 |
See accompanying notes which are an integral part of the financial statements.
Statement of Changes in Net Assets
| | Six months ended June 30, 2019 (Unaudited) | Year ended December 31, 2018 |
| Increase (Decrease) in Net Assets | | |
| Operations | | |
| Net investment income (loss) | $2,478,108 | $3,952,732 |
| Net realized gain (loss) | 3,482,836 | 5,141,219 |
| Change in net unrealized appreciation (depreciation) | 9,547,266 | (10,046,154) |
| Net increase (decrease) in net assets resulting from operations | 15,508,210 | (952,203) |
| Distributions to shareholders | (2,781,951) | (6,414,800) |
| Affiliated share transactions | | |
| Proceeds from sales of shares | 2,945,724 | 77,031,802 |
| Reinvestment of distributions | 2,781,951 | 6,414,799 |
| Cost of shares redeemed | (6,118,899) | (10,182,969) |
| Net increase (decrease) in net assets resulting from share transactions | (391,224) | 73,263,632 |
| Total increase (decrease) in net assets | 12,335,035 | 65,896,629 |
| Net Assets | | |
| Beginning of period | 172,196,414 | 106,299,785 |
| End of period | $184,531,449 | $172,196,414 |
| Other Information | | |
| Shares | | |
| Sold | 30,134 | 787,881 |
| Issued in reinvestment of distributions | 28,639 | 66,969 |
| Redeemed | (62,349) | (104,208) |
| Net increase (decrease) | (3,576) | 750,642 |
See accompanying notes which are an integral part of the financial statements.
Financial Highlights
Fidelity International Credit Central Fund
| | Six months ended (Unaudited) June 30, | Years endedDecember 31, | |
| | 2019 | 2018 | 2017 A |
| Selected Per–Share Data | | | |
| Net asset value, beginning of period | $94.83 | $99.80 | $100.00 |
| Income from Investment Operations | | | |
| Net investment income (loss)B | 1.362 | 2.597 | 1.214 |
| Net realized and unrealized gain (loss) | 7.173 | (3.725) | .970 |
| Total from investment operations | 8.535 | (1.128) | 2.184 |
| Distributions from net investment income | (.654) | (2.398) | (.922) |
| Distributions from net realized gain | (.881) | (1.444) | (.415) |
| Tax return of capital | – | – | (1.047) |
| Total distributions | (1.535) | (3.842) | (2.384) |
| Net asset value, end of period | $101.83 | $94.83 | $99.80 |
| Total ReturnC,D | 9.09% | (1.13)% | 2.20% |
| Ratios to Average Net AssetsE,F | | | |
| Expenses before reductions | .01%G | .01% | .01%G |
| Expenses net of fee waivers, if any | .01%G | .01% | .01%G |
| Expenses net of all reductions | .01%G | .01% | .01%G |
| Net investment income (loss) | 2.80%G | 2.66% | 2.17%G |
| Supplemental Data | | | |
| Net assets, end of period (000 omitted) | $184,531 | $172,196 | $106,300 |
| Portfolio turnover rateH | 104%G | 85% | 85%G |
A For the period June 13, 2017 (commencement of operations) to December 31, 2017.
B Calculated based on average shares outstanding during the period.
C Total returns for periods of less than one year are not annualized.
D Total returns would have been lower if certain expenses had not been reduced during the applicable periods shown.
E Fees and expenses of any underlying Fidelity Central Funds are not included in the Fund's expense ratio. The Fund indirectly bears its proportionate share of the expenses of any underlying Fidelity Central Funds.
F Expense ratios reflect operating expenses of the Fund. Expenses before reductions do not reflect amounts reimbursed by the investment adviser or reductions from expense offset arrangements and do not represent the amount paid by the Fund during periods when reimbursements or reductions occur. Expense ratios before reductions for start-up periods may not be representative of longer term operating periods. Expenses net of fee waivers reflect expenses after reimbursement by the investment adviser but prior to reductions from expense offset arrangements. Expenses net of all reductions represent the net expenses paid by the Fund.
G Annualized
H Amount does not include the portfolio activity of any underlying Fidelity Central Funds.
See accompanying notes which are an integral part of the financial statements.
Notes to Financial Statements (Unaudited)
For the period ended June 30, 2019
1. Organization.
Fidelity International Credit Central Fund (the Fund) is a fund of Fidelity Central Investment Portfolios II LLC (the LLC) and is authorized to issue an unlimited number of shares. Shares of the Fund are only offered to other investment companies and accounts managed by Fidelity Management & Research Company (FMR), or its affiliates (the Investing Funds). The LLC is registered under the Investment Company Act of 1940, as amended (the 1940 Act), as an open-end management investment company organized as a Delaware Limited Liability Company.
2. Investments in Fidelity Central Funds.
The Fund invests in Fidelity Central Funds, which are open-end investment companies generally available only to other investment companies and accounts managed by the investment adviser and its affiliates. The Fund's Schedule of Investments lists each of the Fidelity Central Funds held as of period end, if any, as an investment of the Fund, but does not include the underlying holdings of each Fidelity Central Fund. As an Investing Fund, the Fund indirectly bears its proportionate share of the expenses of the underlying Fidelity Central Funds.
The Money Market Central Funds seek preservation of capital and current income and are managed by Fidelity Investments Money Management, Inc. (FIMM), an affiliate of the investment adviser. Annualized expenses of the Money Market Central Funds as of their most recent shareholder report date ranged from .005% to .01%.
A complete unaudited list of holdings for each Fidelity Central Fund is available upon request or at the Securities and Exchange Commission (the SEC) website at www.sec.gov. In addition, the financial statements of the Fidelity Central Funds are available on the SEC website or upon request.
3. Significant Accounting Policies.
The Fund is an investment company and applies the accounting and reporting guidance of the Financial Accounting Standards Board (FASB) Accounting Standards Codification Topic 946 Financial Services – Investments Companies. The financial statements have been prepared in conformity with accounting principles generally accepted in the United States of America (GAAP), which require management to make certain estimates and assumptions at the date of the financial statements. Actual results could differ from those estimates. Subsequent events, if any, through the date that the financial statements were issued have been evaluated in the preparation of the financial statements. The following summarizes the significant accounting policies of the Fund:
Investment Valuation. Investments are valued as of 4:00 p.m. Eastern time on the last calendar day of the period. The Board of Directors (the Board) has delegated the day to day responsibility for the valuation of the Fund's investments to the Fair Value Committee (the Committee) established by the Fund's investment adviser. In accordance with valuation policies and procedures approved by the Board, the Fund attempts to obtain prices from one or more third party pricing vendors or brokers to value its investments. When current market prices, quotations or currency exchange rates are not readily available or reliable, investments will be fair valued in good faith by the Committee, in accordance with procedures adopted by the Board. Factors used in determining fair value vary by investment type and may include market or investment specific events, changes in interest rates and credit quality. The frequency with which these procedures are used cannot be predicted and they may be utilized to a significant extent. The Committee oversees the Fund's valuation policies and procedures and reports to the Board on the Committee's activities and fair value determinations. The Board monitors the appropriateness of the procedures used in valuing the Fund's investments and ratifies the fair value determinations of the Committee.
The Fund categorizes the inputs to valuation techniques used to value its investments into a disclosure hierarchy consisting of three levels as shown below:
- Level 1 – quoted prices in active markets for identical investments
- Level 2 – other significant observable inputs (including quoted prices for similar investments, interest rates, prepayment speeds, etc.)
- Level 3 – unobservable inputs (including the Fund's own assumptions based on the best information available)
Valuation techniques used to value the Fund's investments by major category are as follows:
Debt securities, including restricted securities, are valued based on evaluated prices received from third party pricing vendors or from brokers who make markets in such securities. Corporate bonds, foreign government and government agency obligations, preferred securities and U.S. government and government agency obligations are valued by pricing vendors who utilize matrix pricing which considers yield or price of bonds of comparable quality, coupon, maturity and type or by broker-supplied prices. Swaps are marked-to-market daily based on valuations from third party pricing vendors, registered derivatives clearing organizations (clearinghouses) or broker-supplied valuations. These pricing sources may utilize inputs such as interest rate curves, credit spread curves, default possibilities and recovery rates. When independent prices are unavailable or unreliable, debt securities and swaps may be valued utilizing pricing methodologies which consider similar factors that would be used by third party pricing vendors. For foreign debt securities, when significant market or security specific events arise, valuations may be determined in good faith in accordance with procedures adopted by the Board. Debt securities and swaps are generally categorized as Level 2 in the hierarchy but may be Level 3 depending on the circumstances.
Equity securities, including restricted securities, for which market quotations are readily available, are valued at the last reported sale price or official closing price as reported by a third party pricing vendor on the primary market or exchange on which they are traded and are categorized as Level 1 in the hierarchy. In the event there were no sales during the day or closing prices are not available, securities are valued at the last quoted bid price or may be valued using the last available price and are generally categorized as Level 2 in the hierarchy. For foreign equity securities, when market or security specific events arise, comparisons to the valuation of American Depositary Receipts (ADRs), futures contracts, Exchange-Traded Funds (ETFs) and certain indexes as well as quoted prices for similar securities may be used and would be categorized as Level 2 in the hierarchy. For equity securities, including restricted securities, where observable inputs are limited, assumptions about market activity and risk are used and these securities may be categorized as Level 3 in the hierarchy.
The U.S. dollar value of foreign currency contracts is determined using currency exchange rates supplied by a pricing service and are categorized as Level 2 in the hierarchy. Futures contracts are valued at the settlement price established each day by the board of trade or exchange on which they are traded and are categorized as Level 1 in the hierarchy. Options traded over-the-counter are valued using vendor or broker-supplied valuations and are categorized as Level 2 in the hierarchy. Investments in open-end mutual funds, including the Fidelity Central Funds, are valued at their closing net asset value (NAV) each business day and are categorized as Level 1 in the hierarchy.
Changes in valuation techniques may result in transfers in or out of an assigned level within the disclosure hierarchy. The aggregate value of investments by input level as of June 30, 2019 is included at the end of the Fund's Schedule of Investments.
Foreign Currency. Foreign-denominated assets, including investment securities, and liabilities are translated into U.S. dollars at the exchange rates at period end. Purchases and sales of investment securities, income and dividends received and expenses denominated in foreign currencies are translated into U.S. dollars at the exchange rate in effect on the transaction date.
The effects of exchange rate fluctuations on investments are included with the net realized and unrealized gain (loss) on investment securities. Other foreign currency transactions resulting in realized and unrealized gain (loss) are disclosed separately.
Realized gains and losses on foreign currency transactions arise from the disposition of foreign currency, realized changes in the value of foreign currency between the trade and settlement dates on security transactions, and the difference between the amounts of dividends, interest and foreign withholding taxes recorded on transaction date and the U.S. dollar equivalent of the amounts actually received or paid. Unrealized gains and losses on assets and liabilities in foreign currencies arise from changes in the value of foreign currency, and from assets and liabilities denominated in foreign currencies, other than investments, which are held at period end.
Investment Transactions and Income. For financial reporting purposes, the Fund's investment holdings and NAV include trades executed through the end of the last business day of the period. The NAV per share for processing shareholder transactions is calculated as of the close of business of the New York Stock Exchange (NYSE), normally 4:00 p.m. Eastern time and includes trades executed through the end of the prior business day. Gains and losses on securities sold are determined on the basis of identified cost. Dividend income is recorded on the ex-dividend date, except for certain dividends from foreign securities where the ex-dividend date may have passed, which are recorded as soon as the Fund is informed of the ex-dividend date. Non-cash dividends included in dividend income, if any, are recorded at the fair market value of the securities received. Income and capital gain distributions from Fidelity Central Funds, if any, are recorded on the ex-dividend date. Interest income is accrued as earned and includes coupon interest and amortization of premium and accretion of discount on debt securities as applicable. Investment income is recorded net of foreign taxes withheld where recovery of such taxes is uncertain. Debt obligations may be placed on non-accrual status and related interest income may be reduced by ceasing current accruals and writing off interest receivables when the collection of all or a portion of interest has become doubtful based on consistently applied procedures. A debt obligation is removed from non-accrual status when the issuer resumes interest payments or when collectability of interest is reasonably assured.
Expenses. Expenses directly attributable to a fund are charged to that fund. Expenses attributable to more than one fund are allocated among the respective funds on the basis of relative net assets or other appropriate methods. Expense estimates are accrued in the period to which they relate and adjustments are made when actual amounts are known.
Income Tax Information and Distributions to Shareholders. Each year, the Fund intends to qualify as a regulated investment company under Subchapter M of the Internal Revenue Code, including distributing substantially all of its taxable income and realized gains. As a result, no provision for U.S. Federal income taxes is required. The Fund files a U.S. federal tax return, in addition to state and local tax returns as required. The Fund's federal income tax returns are subject to examination by the Internal Revenue Service (IRS) for a period of three fiscal years after they are filed. State and local tax returns may be subject to examination for an additional fiscal year depending on the jurisdiction. Foreign taxes are provided for based on the Fund's understanding of the tax rules and rates that exist in the foreign markets in which it invests.
Distributions are declared and recorded on the ex-dividend date. Income and capital gain distributions are determined in accordance with income tax regulations, which may differ from GAAP.
Capital accounts within the financial statements are adjusted for permanent book-tax differences. These adjustments have no impact on net assets or the results of operations. Capital accounts are not adjusted for temporary book-tax differences which will reverse in a subsequent period.
Book-tax differences are primarily due to futures contracts, swaps, foreign currency transactions, market discount, capital loss carryforwards and losses deferred due to wash sales and excise tax regulations.
As of period end, the cost and unrealized appreciation (depreciation) in securities, and derivatives if applicable, for federal income tax purposes were as follows:
| Gross unrealized appreciation | $5,397,301 |
| Gross unrealized depreciation | (3,939,152) |
| Net unrealized appreciation (depreciation) | $1,458,149 |
| Tax cost | $177,298,728 |
Capital loss carryforwards are only available to offset future capital gains of the Fund to the extent provided by regulations and may be limited. Under the Regulated Investment Company Modernization Act of 2010 (the Act), the Fund is permitted to carry forward capital losses incurred in taxable years beginning after December 22, 2010 for an unlimited period and such capital losses are required to be used prior to any losses that expire. The capital loss carryforward information presented below, including any applicable limitation, is estimated as of prior fiscal period end and is subject to adjustment.
| No expiration | |
| Short-term | $(1,115,327) |
| Long-term | (320,676) |
| Total no expiration | $(1,436,003) |
Restricted Securities. The Fund may invest in securities that are subject to legal or contractual restrictions on resale. These securities generally may be resold in transactions exempt from registration or to the public if the securities are registered. Disposal of these securities may involve time-consuming negotiations and expense, and prompt sale at an acceptable price may be difficult. Information regarding restricted securities is included at the end of the Fund's Schedule of Investments.
4. Derivative Instruments.
Risk Exposures and the Use of Derivative Instruments. The Fund's investment objective allows the Fund to enter into various types of derivative contracts, including futures contracts, forward foreign currency contracts, options and swaps. Derivatives are investments whose value is primarily derived from underlying assets, indices or reference rates and may be transacted on an exchange or over-the-counter (OTC). Derivatives may involve a future commitment to buy or sell a specified asset based on specified terms, to exchange future cash flows at periodic intervals based on a notional principal amount, or for one party to make one or more payments upon the occurrence of specified events in exchange for periodic payments from the other party.
The Fund used derivatives to increase returns, to gain exposure to certain types of assets, to facilitate transactions in foreign-denominated securities and to manage exposure to certain risks as defined below. The success of any strategy involving derivatives depends on analysis of numerous economic factors, and if the strategies for investment do not work as intended, the Fund may not achieve its objectives.
The Fund's use of derivatives increased or decreased its exposure to the following risks:
| Credit Risk | Credit risk relates to the ability of the issuer of a financial instrument to make further principal or interest payments on an obligation or commitment that it has to the Fund.
|
| Foreign Exchange Risk | Foreign exchange rate risk relates to fluctuations in the value of an asset or liability due to changes in currency exchange rates.
|
| Interest Rate Risk | Interest rate risk relates to the fluctuations in the value of interest-bearing securities due to changes in the prevailing levels of market interest rates. |
The Fund is also exposed to additional risks from investing in derivatives, such as liquidity risk and counterparty credit risk. Liquidity risk is the risk that the Fund will be unable to close out the derivative in the open market in a timely manner. Counterparty credit risk is the risk that the counterparty will not be able to fulfill its obligation to the Fund. Derivative counterparty credit risk is managed through formal evaluation of the creditworthiness of all potential counterparties. On certain OTC derivatives such as forward foreign currency contracts, options and bi-lateral swaps, the Fund attempts to reduce its exposure to counterparty credit risk by entering into an International Swaps and Derivatives Association, Inc. (ISDA) Master Agreement with each of its counterparties. The ISDA Master Agreement gives the Fund the right to terminate all transactions traded under such agreement upon the deterioration in the credit quality of the counterparty beyond specified levels. The ISDA Master Agreement gives each party the right, upon an event of default by the other party or a termination of the agreement, to close out all transactions traded under such agreement and to net amounts owed under each transaction to one net payable by one party to the other. To mitigate counterparty credit risk on bi-lateral OTC derivatives, the Fund receives collateral in the form of cash or securities once the Fund's net unrealized appreciation on outstanding derivative contracts under an ISDA Master Agreement exceeds certain applicable thresholds, subject to certain minimum transfer provisions. The collateral received is held in segregated accounts with the Fund's custodian bank in accordance with the collateral agreements entered into between the Fund, the counterparty and the Fund's custodian bank. The Fund could experience delays and costs in gaining access to the collateral even though it is held by the Fund's custodian bank. The Fund's maximum risk of loss from counterparty credit risk related to bi-lateral OTC derivatives is generally the aggregate unrealized appreciation and unpaid counterparty payments in excess of any collateral pledged by the counterparty to the Fund. The Fund may be required to pledge collateral for the benefit of the counterparties on bi-lateral OTC derivatives in an amount not less than each counterparty's unrealized appreciation on outstanding derivative contracts, subject to certain minimum transfer provisions, and any such pledged collateral is identified in the Schedule of Investments. Exchange-traded futures contracts are not covered by the ISDA Master Agreement; however counterparty credit risk related to exchange-traded futures contracts may be mitigated by the protection provided by the exchange on which they trade. Counterparty credit risk related to centrally cleared OTC swaps may be mitigated by the protection provided by the clearinghouse. A summary of the Fund's derivatives inclusive of potential netting arrangements is presented at the end of the Schedule of Investments.
Investing in derivatives may involve greater risks than investing in the underlying assets directly and, to varying degrees, may involve risk of loss in excess of any initial investment and collateral received and amounts recognized in the Statement of Assets and Liabilities. In addition, there may be the risk that the change in value of the derivative contract does not correspond to the change in value of the underlying instrument.
Net Realized Gain (Loss) and Change in Net Unrealized Appreciation (Depreciation) on Derivatives. The table below, which reflects the impacts of derivatives on the financial performance of the Fund, summarizes the net realized gain (loss) and change in net unrealized appreciation (depreciation) for derivatives during the period as presented in the Statement of Operations.
| Primary Risk Exposure / Derivative Type | Net Realized Gain (Loss) | Change in Net Unrealized Appreciation (Depreciation) |
| Credit Risk | | |
| Purchased Options | $(351,537) | $(374,083) |
| Swaps | (88,974) | 44,860 |
| Total Credit Risk | (440,511) | (329,223) |
| Foreign Exchange Risk | | |
| Forward Foreign Currency Contracts | 2,711,593 | 99,318 |
| Interest Rate Risk | | |
| Futures Contracts | 1,743,994 | (274,732) |
| Swaps | 794,275 | 289,374 |
| Total Interest Rate Risk | 2,538,269 | 14,642 |
| Totals | $4,809,351 | $(215,263) |
A summary of the value of derivatives by primary risk exposure as of period end is included at the end of the Schedule of Investments.
Forward Foreign Currency Contracts. Forward foreign currency contracts represent obligations to purchase or sell foreign currency on a specified future date at a price fixed at the time the contracts are entered into. The Fund used forward foreign currency contracts to facilitate transactions in foreign-denominated securities and to manage exposure to certain foreign currencies.
Forward foreign currency contracts are valued daily and fluctuations in exchange rates on open contracts are recorded as unrealized appreciation or (depreciation) and reflected in the Statement of Assets and Liabilities. When the contract is closed, the Fund realizes a gain or loss equal to the difference between the closing value and the value at the time it was opened. Non-deliverable forward foreign currency exchange contracts are settled with the counterparty in cash without the delivery of foreign currency. The net realized gain (loss) and change in net unrealized appreciation (depreciation) on forward foreign currency contracts during the period is presented in the Statement of Operations.
Any open forward foreign currency contracts at period end are presented in the Schedule of Investments under the caption "Forward Foreign Currency Contracts." The contract amount and unrealized appreciation (depreciation) reflects each contract's exposure to the underlying currency at period end.
Futures Contracts. A futures contract is an agreement between two parties to buy or sell a specified underlying instrument for a fixed price at a specified future date. The Fund used futures contracts to manage its exposure to the bond market and fluctuations in interest rates.
Upon entering into a futures contract, a fund is required to deposit either cash or securities (initial margin) with a clearing broker in an amount equal to a certain percentage of the face value of the contract. Futures contracts are marked-to-market daily and subsequent daily payments (variation margin) are made or received by a fund depending on the daily fluctuations in the value of the futures contracts and are recorded as unrealized appreciation or (depreciation). This receivable and/or payable, if any, is included in daily variation margin on futures contracts in the Statement of Assets and Liabilities. Realized gain or (loss) is recorded upon the expiration or closing of a futures contract. The net realized gain (loss) and change in net unrealized appreciation (depreciation) on futures contracts during the period is presented in the Statement of Operations.
Any open futures contracts at period end are presented in the Schedule of Investments under the caption "Futures Contracts". The notional amount at value reflects each contract's exposure to the underlying instrument or index at period end. Securities deposited to meet initial margin requirements are identified in the Schedule of Investments.
Options. Options give the purchaser the right, but not the obligation, to buy (call) or sell (put) an underlying security or financial instrument at an agreed exercise or strike price between or on certain dates. Options obligate the seller (writer) to buy (put) or sell (call) an underlying instrument at the exercise or strike price or cash settle an underlying derivative instrument if the holder exercises the option on or before the expiration date. The Fund uses OTC options, such as swaptions, which are options where the underlying instrument is a swap, to manage its exposure to potential credit events.
Upon entering into an options contract, a fund will pay or receive a premium. Premiums paid on purchased options are reflected as cost of investments and premiums received on written options are reflected as a liability on the Statement of Assets and Liabilities. Certain options may be purchased or written with premiums to be paid or received on a future date. Options are valued daily and any unrealized appreciation (depreciation) is reflected on the Statement of Assets and Liabilities. When an option is exercised, the cost or proceeds of the underlying instrument purchased or sold is adjusted by the amount of the premium. When an option is closed the Fund will realize a gain or loss depending on whether the proceeds or amount paid for the closing sale transaction is greater or less than the premium received or paid. When an option expires, gains and losses are realized to the extent of premiums received and paid, respectively. The net realized and unrealized gains (losses) on purchased options are included in the Statement of Operations in net realized gain (loss) and change in net unrealized appreciation (depreciation) on investment securities. The net realized gain (loss) and change in net unrealized appreciation (depreciation) on written options are presented in the Statement of Operations.
Any open options at period end are presented in the Schedule of Investments under the captions "Purchased Options," "Purchased Swaptions," "Written Options" and "Written Swaptions," as applicable.
Writing puts and buying calls tend to increase exposure to the underlying instrument while buying puts and writing calls tend to decrease exposure to the underlying instrument. For purchased options, risk of loss is limited to the premium paid, and for written options, risk of loss is the change in value in excess of the premium received.
Swaps. A swap is a contract between two parties to exchange future cash flows at periodic intervals based on a notional principal amount. A bi-lateral OTC swap is a transaction between a fund and a dealer counterparty where cash flows are exchanged between the two parties for the life of the swap. A centrally cleared OTC swap is a transaction executed between a fund and a dealer counterparty, then cleared by a futures commission merchant (FCM) through a clearinghouse. Once cleared, the clearinghouse serves as a central counterparty, with whom a fund exchanges cash flows for the life of the transaction, similar to transactions in futures contracts.
Bi-lateral OTC swaps are marked-to-market daily and changes in value are reflected in the Statement of Assets and Liabilities in the bi-lateral OTC swaps at value line items. Any upfront premiums paid or received upon entering a bi-lateral OTC swap to compensate for differences between stated terms of the swap and prevailing market conditions (e.g. credit spreads, interest rates or other factors) are recorded in net unrealized appreciation (depreciation) in the Statement of Assets and Liabilities and amortized to realized gain or (loss) ratably over the term of the swap. Any unamortized upfront premiums are presented in the Schedule of Investments.
Centrally cleared OTC swaps require a fund to deposit either cash or securities (initial margin) with the FCM, at the instruction of and for the benefit of the clearinghouse. Securities deposited to meet initial margin requirements are identified in the Schedule of Investments. Centrally cleared OTC swaps are marked-to-market daily and subsequent payments (variation margin) are made or received depending on the daily fluctuations in the value of the swaps and are recorded as unrealized appreciation or (depreciation). These daily payments, if any, are included in receivable or payable for daily variation margin on centrally cleared OTC swaps in the Statement of Assets and Liabilities. Any premiums for centrally cleared OTC swaps are recorded periodically throughout the term of the swap to variation margin and included in unrealized appreciation (depreciation) in the Statement of Assets and Liabilities. Any premiums are recognized as realized gain (loss) upon termination or maturity of the swap.
For both bi-lateral and centrally cleared OTC swaps, payments are exchanged at specified intervals, accrued daily commencing with the effective date of the contract and recorded as realized gain or (loss). Some swaps may be terminated prior to the effective date and realize a gain or loss upon termination. The net realized gain (loss) and change in net unrealized appreciation (depreciation) on swaps during the period is presented in the Statement of Operations.
Any open swaps at period end are included in the Schedule of Investments under the caption "Swaps" and are representative of volume of activity during the period.
Credit Default Swaps. Credit default swaps enable the Fund to buy or sell protection against specified credit events on a single-name issuer or a traded credit index. Under the terms of a credit default swap the buyer of protection (buyer) receives credit protection in exchange for making periodic payments to the seller of protection (seller) based on a fixed percentage applied to a notional principal amount. In return for these payments, the seller will be required to make a payment upon the occurrence of one or more specified credit events. The Fund enters into credit default swaps as a seller to gain credit exposure to an issuer and/or as a buyer to obtain a measure of protection against defaults of an issuer. Periodic payments are made over the life of the contract by the buyer provided that no credit event occurs.
For credit default swaps on most corporate and sovereign issuers, credit events include bankruptcy, failure to pay or repudiation/moratorium. For credit default swaps on corporate or sovereign issuers, the obligation that may be put to the seller is not limited to the specific reference obligation described in the Schedule of Investments. For credit default swaps on asset-backed securities, a credit event may be triggered by events such as failure to pay principal, maturity extension, rating downgrade or write-down. For credit default swaps on asset-backed securities, the reference obligation described represents the security that may be put to the seller. For credit default swaps on a traded credit index, a specified credit event may affect all or individual underlying securities included in the index.
As a seller, if an underlying credit event occurs, the Fund will pay a net settlement amount of cash equal to the notional amount of the swap less the recovery value of the reference obligation or underlying securities comprising an index. Only in the event of the industry's inability to value the underlying asset will the Fund be required to take delivery of the reference obligation or underlying securities comprising an index and pay an amount equal to the notional amount of the swap.
As a buyer, if an underlying credit event occurs, the Fund will receive a net settlement amount of cash equal to the notional amount of the swap less the recovery value of the reference obligation or underlying securities comprising an index. Only in the event of the industry's inability to value the underlying asset will the Fund be required to deliver the reference obligation or underlying securities comprising an index in exchange for payment of an amount equal to the notional amount of the swap.
Typically, the value of each credit default swap and credit rating disclosed for each reference obligation in the Schedule of Investments, where the Fund is the seller, can be used as measures of the current payment/performance risk of the swap. As the value of the swap changes as a positive or negative percentage of the total notional amount, the payment/performance risk may decrease or increase, respectively. In addition to these measures, the investment adviser monitors a variety of factors including cash flow assumptions, market activity and market sentiment as part of its ongoing process of assessing payment/performance risk.
Interest Rate Swaps. Interest rate swaps are agreements between counterparties to exchange cash flows, one based on a fixed rate, and the other on a floating rate. The Fund entered into interest rate swaps to manage its exposure to interest rate changes. Changes in interest rates can have an effect on both the value of bond holdings as well as the amount of interest income earned. In general, the value of bonds can fall when interest rates rise and can rise when interest rates fall.
5. Purchases and Sales of Investments.
Purchases and sales of securities, other than short-term securities and U.S. government securities, aggregated $90,830,298 and $81,829,701, respectively.
6. Fees and Other Transactions with Affiliates.
Management Fee and Expense Contract. Fidelity Investments Money Management, Inc. (the investment adviser), an affiliate of FMR, provides the Fund with investment management services. The Fund does not pay any fees for these services. Pursuant to the Fund's management contract with the investment adviser, FMR pays the investment adviser a portion of the management fees it receives from the Investing Funds. In addition, under an expense contract, FMR also pays all other expenses of the Fund, excluding custody fees, the compensation of the independent Directors, and certain miscellaneous expenses such as proxy and shareholder meeting expenses.
Interfund Trades. The Fund may purchase from or sell securities to other Fidelity Funds under procedures adopted by the Board. The procedures have been designed to ensure these interfund trades are executed in accordance with Rule 17a-7 of the 1940 Act. Interfund trades are included within the respective purchases and sales amounts shown in the Purchases and Sales of Investments note.
7. Other.
The Fund's organizational documents provide former and current directors and officers with a limited indemnification against liabilities arising in connection with the performance of their duties to the Fund. In the normal course of business, the Fund may also enter into contracts that provide general indemnifications. The Fund's maximum exposure under these arrangements is unknown as this would be dependent on future claims that may be made against the Fund. The risk of material loss from such claims is considered remote.
At the end of the period, mutual funds managed by FMR or its affiliates were the owners of record of all of the outstanding shares of the Fund.
8. Risks of Investing in European Countries.
The recent global financial crisis has created uncertainty surrounding the sovereign debt of many European countries. If there is a default or debt restructuring by any European country, or if one or more countries leave the European Monetary Union or the European Monetary Union dissolves, there may be wide-ranging effects on global markets. Such events could significantly affect the value or liquidity of the Fund's investments in the region or with exposure to the region.
Shareholder Expense Example
As a shareholder of the Fund, you incur two types of costs: (1) transaction costs and (2) ongoing costs, including other Fund expenses. This Example is intended to help you understand your ongoing costs (in dollars) of investing in the Fund and to compare these costs with the ongoing costs of investing in other mutual funds.
The Example is based on an investment of $1,000 invested at the beginning of the period and held for the entire period (January 1, 2019 to June 30, 2019).
Actual Expenses
The first line of the accompanying table provides information about actual account values and actual expenses. You may use the information in this line, together with the amount you invested, to estimate the expenses that you paid over the period. Simply divide your account value by $1,000.00 (for example, an $8,600 account value divided by $1,000.00 = 8.6), then multiply the result by the number in the first line under the heading entitled "Expenses Paid During Period" to estimate the expenses you paid on your account during this period. In addition, the Fund, as a shareholder in the underlying Fidelity Central Funds, will indirectly bear its pro-rata share of the fees and expenses incurred by the underlying Fidelity Central Funds. These fees and expenses are not included in the Fund's annualized expense ratio used to calculate the expense estimate in the table below.
Hypothetical Example for Comparison Purposes
The second line of the accompanying table provides information about hypothetical account values and hypothetical expenses based on the Fund's actual expense ratio and an assumed rate of return of 5% per year before expenses, which is not the Fund's actual return. The hypothetical account values and expenses may not be used to estimate the actual ending account balance or expenses you paid for the period. You may use this information to compare the ongoing costs of investing in the Fund and other funds. To do so, compare this 5% hypothetical example with the 5% hypothetical examples that appear in the shareholder reports of the other funds. In addition, the Fund, as a shareholder in the underlying Fidelity Central Funds, will indirectly bear its pro-rata share of the fees and expenses incurred by the underlying Fidelity Central Funds. These fees and expenses are not included in the Fund's annualized expense ratio used to calculate the expense estimate in the table below.
Please note that the expenses shown in the table are meant to highlight your ongoing costs only and do not reflect any transaction costs. Therefore, the second line of the table is useful in comparing ongoing costs only, and will not help you determine the relative total costs of owning different funds.
| | Annualized Expense Ratio-A | Beginning
Account Value
January 1, 2019 | Ending
Account Value
June 30, 2019 | Expenses Paid
During Period-B
January 1, 2019
to June 30, 2019 |
| Actual | .0076% | $1,000.00 | $1,090.90 | $.04 |
| Hypothetical-C | | $1,000.00 | $1,024.76 | $.04 |
A Annualized expense ratio reflects expenses net of applicable fee waivers.
B Expenses are equal to the Fund's annualized expense ratio, multiplied by the average account value over the period, multiplied by 181/365 (to reflect the one-half year period).
C 5% return per year before expenses

ICF-SANN-0819
1.9882754.102