UNITED STATES
SECURITIES AND EXCHANGE COMMISSION
Washington, D.C. 20549
FORM 20-F
(Mark One)
| ¨ | REGISTRATION STATEMENT PURSUANT TO SECTION 12(b) OR (g) OF THE SECURITIES EXCHANGE ACT OF 1934 |
OR
| ¨ | ANNUAL REPORT PURSUANT TO SECTION 13 OR 15(d) OF THE SECURITIES EXCHANGE ACT OF 1934 |
FOR THE FISCAL YEAR ENDED JANUARY 31, 2010
OR
| ¨ | TRANSITION REPORT PURSUANT TO SECTION 13 OR 15(d) OF THE SECURITIES EXCHANGE ACT OF 1934 |
FOR THE TRANSITION PERIOD FROM TO
OR
| ¨ | SHELL COMPANY REPORT PURSUANT TO SECTION 13 OR 15(d) OF THE SECURITIES EXCHANGE ACT OF 1934 |
Date of event requiring this shell company report
For the transaction period from to
COMMISSION FILE NUMBER: 333-143444
DOLLARAMA GROUP HOLDINGS L.P.
(Exact name of Registrant as specified in its charter)
Quebec, Canada
(Jurisdiction of incorporation or organization)
5805 Royalmount Avenue
Montreal, Quebec H4P 0A1
(Address of principal executive offices)
Securities registered or to be registered pursuant to Section 12(b) of the Act:
Not Applicable
(Title of Class)
Securities registered or to be registered pursuant to Section 12(g) of the Act:
Not Applicable
(Title of Class)
Securities for which there is a reporting obligation pursuant to Section 15(d) of the Act:
Not Applicable
(Title of Class)
Indicate the number of outstanding shares of each of the issuer’s classes of capital or common stock as of the close of the period covered by the annual report.
Not Applicable
Indicate by check mark if the registrant is a well-known seasoned issuer, as defined in Rule 405 of the Securities Act. Yes ¨ No x
If this report is an annual or transition report, indicate by check mark if the registrant is not required to file reports pursuant to Section 13 or 15(d) of the Securities Exchange Act of 1934. Yes x No ¨
Indicate by check mark whether the registrant (1) has filed all reports required to be filed by Section 13 or 15(d) of the Securities Exchange Act of 1934 during the preceding 12 months (or for such shorter period that the registrant was required to file such reports), and (2) has been subject to such filing requirements for the past 90 days. Yes ¨ No ¨
Indicate by check mark whether the registrant has submitted electronically and posted on its corporate Web site, if any, every Interactive Data File required to be submitted and posted pursuant to Rule 405 of Regulation S-T (§232.405 of this chapter) during the preceding 12 months (or for such shorter period that the registrant was required to submit and post such files). Yes ¨ No ¨
Indicate by check mark whether the registrant is a large accelerated filer, an accelerated filer, or a non-accelerated filer. See definition of “accelerated filer and large accelerated filer” in Rule 12b-2 of the Exchange Act. (Check one):
| | | | |
| Large accelerated filer ¨ | | Accelerated filer ¨ | | Non-accelerated filer x |
Indicate by check mark which basis of accounting the registrant has used to prepare the financial statements included in this filing:
| | | | |
| U.S. GAAP ¨ | | International Financial Reporting Standards as issued by the International Accounting Standards Board ¨ | | Other x |
If “Other” has been checked in response to the previous question, indicate by check mark which financial statement item the registrant has elected to follow. Item 17 ¨ Item 18 x
If this is an annual report, indicate by check mark whether the registrant is a shell company (as defined in Rule 12b-2 of the Exchange Act). Yes ¨ No x
ii
TABLE OF CONTENTS
iii
FORWARD-LOOKING STATEMENTS
This annual report filed on Form 20-F contains certain forward-looking statements within the meaning of the Private Securities Litigation Reform Act of 1995 with respect to financial condition, results of operations, cash flows, dividends, financing plans, business strategies, capital and other expenditure, competitive positions, availability of capital, growth opportunities for new and existing products, availability and deployment of new technologies, plans and objectives of management, mergers and acquisitions, and other matters.
Statements in this Form 20-F that are not historical facts are hereby identified as “forward-looking statements” for the purpose of the safe harbor provided by Section 27A of the Securities Act of 1933, as amended, or the Securities Act, and Section 21E of the Securities Exchange Act of 1934, as amended, or the Exchange Act. The words “estimate,” “project,” “intend,” “expect,” “believe,” “plan” and similar expressions are intended to identify forward-looking statements. Readers are cautioned not to place undue reliance on these forward-looking statements, which speak only as of the date of this document. In addition, other written or oral statements which constitute forward-looking statements have been made and may in the future be made by us or on our behalf, including with respect to the matters referred to above. These forward-looking statements are necessarily estimates reflecting the best judgment of senior management that rely on a number of assumptions concerning future events, many of which are outside of our control, and involve a number of risks and uncertainties that could cause actual results to differ materially from those suggested by the forward-looking statements. These forward-looking statements should, therefore, be considered in light of various important factors, including those set forth in this annual report. Except for historical information contained herein, the statements in this document are forward-looking. Forward-looking statements involve known and unknown risks and uncertainties, including those that are described elsewhere in this report. Such risks and uncertainties may cause actual results in future periods to differ materially from forecasted results. Those risks include, among others, changes in consumer buying trends, consumer debt level, inflation, unemployment, currency fluctuations, market volatility, refinancing conditions, changes in inventory and equipment costs and availability, seasonal changes in customer demand, pricing actions by competitors and general changes in economic conditions, and the risks set forth in Part I of this report under Item 3D.
This annual report is that of Dollarama Group Holdings L.P. (“Holdings”). Holdings is together with its consolidated subsidiaries referred to as the “Partnership”, “we”, “us” or “our”.
GAAP AND NON-GAAP MEASURES
Unless otherwise indicated and as hereinafter provided, all financial statement data in this report has been prepared using Canadian generally accepted accounting principles (“GAAP”). Holdings’ consolidated financial statements have been prepared in accordance with Canadian GAAP. The consolidated financial statements have also been reconciled to GAAP in the United States as set out in Note 17 to the consolidated financial statements. This report makes reference to certain non-GAAP measures. These non-GAAP measures are not recognized measures under Canadian GAAP, do not have a standardized meaning prescribed by Canadian GAAP and are therefore unlikely to be comparable to similar measures presented by other companies. Rather, these measures are provided as additional information to complement those Canadian GAAP measures by providing further understanding of Holdings’ results of operations from management’s perspective. Accordingly, they should not be considered in isolation nor as a substitute for analysis of our financial information reported under Canadian GAAP. We use non-GAAP measures including EBITDA to provide investors with a supplemental measure of our operating performance and thus highlight trends in our core business that may not otherwise be apparent when relying solely on Canadian GAAP financial measures. We also believe that securities analysts, investors and other interested parties frequently use non-GAAP measures in the evaluation of issuers. Our management also uses non-GAAP measures in order to facilitate operating performance comparisons from period to period, prepare annual operating budgets and assess our ability to meet our future debt service, capital expenditure and working capital requirements. Non-GAAP measures are not presentations made in accordance with Canadian GAAP. For example, certain or all of the non-GAAP measures do not reflect: (a) our cash expenditures, or future requirements for capital expenditures or contractual commitments; (b) changes in, or cash requirements for, our working capital needs; (c) the significant interest expense, or the cash requirements necessary to service interest or principal payments on our debt, and; (d) income tax payments that represent a reduction in cash available to us. Although we consider the items excluded in the calculation of non-GAAP measures to be unusual and less relevant to evaluate our performance, some of these items may continue to take place and accordingly may reduce the cash available to us. We refer the reader to “Selected Financial Data” for the definition and reconciliation of non-GAAP measures used and presented by Holdings to the most directly comparable GAAP measures.
We believe that the presentation of the non-GAAP measures described above is appropriate. However, these non-GAAP measures have important limitations as analytical tools, and you should not consider them in isolation, or as substitutes for analysis of our results as reported under Canadian GAAP. Because of these limitations, we primarily rely on our results as reported in accordance with Canadian GAAP and use the non-GAAP measures only as a supplement. In addition, because other companies may calculate non-GAAP measures differently than we do, they may not be comparable to similarly-titled measures reported by other companies.
1
PART I
| Item 1. | IDENTITY OF DIRECTORS, SENIOR MANAGEMENT AND ADVISERS |
Not applicable.
| Item 2. | OFFER STATISTICS AND EXPECTED TIMETABLE |
Not applicable.
A. Selected Financial Data.
The following section presents selected historical consolidated financial data and should be read in conjunction with “Item 5. Operating and Financial Review and Prospects” and the Consolidated Financial Statements and the related notes thereto appearing elsewhere in this report. The historical consolidated financial data as at January 31, 2010 and February 1, 2009 and for the fiscal years ended February 3, 2008 (“Fiscal 2008”), February 1, 2009 (“Fiscal 2009”) and January 31, 2010 (“Fiscal 2010”) are derived from our audited consolidated financial statements, which are included elsewhere in this report. The historical consolidated financial data as of February 3, 2008 and February 4, 2007 and for the fiscal year ended February 4, 2007 (“Fiscal 2007”) are derived from our audited consolidated financial statements, which are not included in this report.
Exchange Rate Data
The following table sets forth, for each period indicated, the low and high exchange rates for $1.00 expressed in U.S. dollars, the exchange rate at the end of each period and the average of these exchange rates on the last day of each month within each period, in each case, based upon the noon buying rate in New York City for cable transfers in foreign currencies for customs purposes by the U.S. Federal Reserve Bank of New York. These rates are presented for informational purposes and are not the same as the rates that are used for purposes of translating U.S. dollars into Canadian dollars in the financial statements included herein.
| | | | | | | | | | |
| | | Year Ended
January 31,
2010 | | Year Ended
February 1,
2009 | | Year Ended
February 3,
2008 | | Year Ended
February 4,
2007 | | Year Ended
January 31,
2006 |
Low | | 0.76953 | | 0.77095 | | 0.84374 | | 0.84474 | | 0.78722 |
High | | 0.97466 | | 1.02912 | | 1.09075 | | 0.91000 | | 0.87443 |
Period end | | 0.93879 | | 0.80873 | | 1.00614 | | 0.84474 | | 0.87443 |
Average rate | | 0.88722 | | 0.92985 | | 0.94803 | | 0.88023 | | 0.82975 |
Selected Historical Consolidated Financial Data (1)
| | | | | | | | | | | | | | | | | | | | |
(Canadian dollars in thousands) | | Year Ended
January 31,
2010 | | | Year Ended
February 1,
2009 | | | Year Ended
February 3,
2008 | | | Year Ended
February 4,
2007 | | | Year Ended
January 31,
2006 | |
Statements of Earnings Data: | | | | | | | | | | | | | | | | | | | | |
| | | | | |
Sales | | $ | 1,253,706 | | | $ | 1,089,011 | | | $ | 972,352 | | | $ | 887,786 | | | $ | 743,278 | |
| | | | | |
Cost of sales(2)(3) | | | 810,624 | | | | 724,150 | | | | 643,579 | | | | 591,043 | | | | 512,423 | |
| | | | | | | | | | | | | | | | | | | | |
Gross profit | | | 443,082 | | | | 364,861 | | | | 328,773 | | | | 296,743 | | | | 230,855 | |
Expenses: | | | | | | | | | | | | | | | | | | | | |
| | | | | |
General, administrative and store operating expenses(2) | | | 262,530 | | | | 212,814 | | | | 183,571 | | | | 151,888 | | | | 123,202 | |
Amortization(4) | | | 24,919 | | | | 21,818 | | | | 18,389 | | | | 13,528 | | | | 9,782 | |
| | | | | | | | | | | | | | | | | | | | |
Total expenses | | | 287,449 | | | | 234,632 | | | | 201,960 | | | | 165,416 | | | | 132,984 | |
| | | | | | | | | | | | | | | | | | | | |
Operating income | | | 155,633 | | | | 130,229 | | | | 126,813 | | | | 131,327 | | | | 97,871 | |
Other expenses: | | | | | | | | | | | | | | | | | | | | |
| | | | | |
Interest expense | | | 62,343 | | | | 61,192 | | | | 72,053 | | | | 54,852 | | | | 59,680 | |
Foreign exchange loss (gain) on derivative financial instruments and long-term debt | | | (31,108 | ) | | | 44,793 | | | | (34,411 | ) | | | 4,275 | | | | 1,508 | |
| | | | | | | | | | | | | | | | | | | | |
Earnings before income taxes | | | 124,398 | | | | 24,244 | | | | 89,171 | | | | 72,200 | | | | 36,683 | |
Income taxes | | | 293 | | | | 241 | | | | 302 | | | | 365 | | | | 1,677 | |
| | | | | | | | | | | | | | | | | | | | |
Net earnings | | $ | 124,105 | | | $ | 24,003 | | | $ | 88,869 | | | $ | 71,835 | | | $ | 35,006 | |
| | | | | | | | | | | | | | | | | | | | |
Statements of Cash Flows Data: | | | | | | | | | | | | | | | | | | | | |
| | | | | |
Cash flows provided by (used in): | | | | | | | | | | | | | | | | | | | | |
Operating activities | | $ | 126,184 | | | $ | 117,087 | | | $ | 56,175 | | | $ | 94,387 | | | $ | 46,408 | |
Investing activities | | | (40,091 | ) | | | (49,728 | ) | | | (45,562 | ) | | | (42,517 | ) | | | (36,006 | ) |
Financing activities | | | (59,440 | ) | | | (27,472 | ) | | | (32,102 | ) | | | (35,050 | ) | | | (24,104 | ) |
Other Financial and Non-Financial Data: | | | | | | | | | | | | | | | | | | | | |
| | | | | |
Adjusted EBITDA(5) | | $ | 197,279 | | | $ | 158,395 | | | $ | 152,073 | | | $ | 151,904 | | | $ | 126,254 | |
Capital expenditures | | $ | 33,772 | | | $ | 40,502 | | | $ | 45,994 | | | $ | 42,695 | | | $ | 23,946 | |
Rent expense(6) | | $ | 76,277 | | | $ | 68,981 | | | $ | 58,765 | | | $ | 50,701 | | | $ | 41,146 | |
Gross margin(7) | | | 35.3 | % | | | 33.5 | % | | | 33.8 | % | | | 33.4 | % | | | 31.1 | % |
Number of stores (at end of period) | | | 603 | | | | 564 | | | | 521 | | | | 463 | | | | 398 | |
Growth of comparable store sales(7) | | | 7.9 | % | | | 3.4 | % | | | (1.5 | %) | | | 2.8 | % | | | 6.1 | % |
Ratio of earnings to fixed charges(8) | | | 2.4 | x | | | 1.3 | x | | | 2.0 | x | | | 2.0 | x | | | 1.5 | x |
2
| | | | | | | | | | | | | | | |
(Canadian dollars in thousands) | | As of
January 31,
2010 | | As of
February 1,
2009 | | As of
February 3,
2008 | | As of
February 4,
2007 | | As of
January 31,
2006 |
Balance Sheet Data: | | | | | | | | | | | | | | | |
| | | | | |
Cash and cash equivalents | | $ | 92,794 | | $ | 66,141 | | $ | 26,214 | | $ | 47,703 | | $ | 30,883 |
Merchandise inventories | | | 234,684 | | | 249,644 | | | 198,500 | | | 166,017 | | | 154,047 |
Property and equipment | | | 138,214 | | | 129,878 | | | 111,936 | | | 84,665 | | | 54,571 |
Total assets | | | 1,324,743 | | | 1,363,041 | | | 1,197,983 | | | 1,169,187 | | | 1,098,854 |
Long-term debt | | | 468,591 | | | 806,384 | | | 653,006 | | | 806,921 | | | 581,637 |
Partners’ capital | | | 691,320 | | | 436,470 | | | 331,161 | | | 259,231 | | | 401,820 |
| (1) | Holdings was created on December 8, 2006 pursuant to various agreements (the “Agreements”). The consolidated financial data as of February 4, 2007 and January 31, 2006 and for the each of the years then ended have been prepared using the continuity of interest method of accounting. The consolidated financial statements of Holdings on the date of the Agreements were in all material respects the same as those of Dollarama Group L.P. (“Group L.P.”) immediately prior to the Agreements becoming effective. Accordingly, the consolidated financial data for the year ended February 4, 2007 reflect the results of operations of Holdings for the period from December 8, 2006, the date of creation of Holdings to February 4, 2007. The consolidated financial data as of January 31, 2006 and for the period from February 1, 2006 to December 8, 2006 reflect the financial position of Group L.P. and its subsidiaries and their results of operations and cash flows. |
| (2) | Certain expenses have been reclassified between cost of sales and general, administrative and store operating expenses. All comparable figures and historical results have been recalculated accordingly. |
| (3) | See Note 17 to the Consolidated Financial Statements for a reconciliation of GAAP in Canada and the United States. |
| (4) | Amortization represents amortization of tangible and intangible assets, including amortization of favorable and unfavorable lease rights. |
| (5) | EBITDA represents net earnings (loss) before net interest expense, income taxes and amortization expense. Adjusted EBITDA represents EBITDA as further adjusted to reflect items set forth in the table below, all of which are required in determining our compliance with financial covenants under our senior secured credit facility (the “Credit Facility”). We have included EBITDA and Adjusted EBITDA to provide investors with a supplemental measure of our operating performance and information about the calculation of some of the financial covenants that are contained in the Credit Facility. |
We believe EBITDA is an important supplemental measure of operating performance because it eliminates items that have less bearing on our operating performance and thus highlights trends in our core business that may not otherwise be apparent when relying solely on Canadian GAAP financial measures. We also believe that securities analysts, investors and other interested parties frequently use EBITDA in the evaluation of issuers, many of which present EBITDA when reporting their results. Adjusted EBITDA is a material component of the covenants imposed on us by the Credit Facility. Under the Credit Facility, we are subject to financial covenant ratios that are calculated by reference to Adjusted EBITDA.
Non-compliance with the financial covenants contained in our Credit Facility could result in a default, acceleration in the repayment of amounts outstanding under the Credit Facility, and a termination of the lending commitments under the Credit Facility. Generally, any default under the Credit Facility that results in the acceleration in the repayment of amounts outstanding under the Credit Facility would result in a default under the indenture governing the senior floating rate deferred interest notes (the “Deferred Interest Notes”). While an event of default under the Credit Facility or the indenture is continuing, we would be precluded from, among other things, paying dividends on our capital stock or borrowing under the revolving credit facility. Our management also uses EBITDA and Adjusted EBITDA in order to facilitate operating performance comparisons from period to period, prepare annual operating budgets and assess our ability to meet our future debt service, capital expenditure and working capital requirements and our ability to pay dividends on our capital stock.
3
EBITDA and Adjusted EBITDA are not presentations made in accordance with Canadian GAAP. EBITDA and Adjusted EBITDA have important limitations as analytical tools, and you should not consider them in isolation, or as substitutes for analysis of our results as reported under Canadian GAAP. For example, neither EBITDA nor Adjusted EBITDA reflect (a) our cash expenditures, or future requirements for capital expenditures or contractual commitments; (b) changes in, or cash requirements for, our working capital needs; (c) the significant interest expense, or the cash requirements necessary to service interest or principal payments, on our debt; and (d) tax payments or distributions to our parent to make payments with respect to taxes attributable to us that represent a reduction in cash available to us. Because of these limitations, we primarily rely on our results as reported in accordance with Canadian GAAP and use EBITDA and Adjusted EBITDA only supplementally. In addition, because other companies may calculate EBITDA and Adjusted EBITDA differently than we do, EBITDA may not be, and Adjusted EBITDA as presented in this report is not, comparable to similarly titled measures reported by other companies.
A reconciliation of net earnings (loss) to EBITDA and to Adjusted EBITDA is included below:
| | | | | | | | | | | | | | | | |
(Canadian dollars in thousands) | | Year Ended
January 31,
2010 | | | Year Ended
February 1,
2009 | | Year Ended
February 3,
2008 | | | Year Ended
February 4,
2007 | | Year Ended
January 31,
2006 |
Net earnings | | $ | 124,105 | | | $ | 24,003 | | $ | 88,869 | | | $ | 71,835 | | 35,006 |
Income taxes | | | 293 | | | | 241 | | | 302 | | | | 365 | | 1,677 |
Interest expense | | | 62,343 | | | | 61,192 | | | 72,053 | | | | 54,852 | | 59,680 |
Amortization | | | 24,919 | | | | 21,818 | | | 18,389 | | | | 13,528 | | 9,782 |
| | | | | | | | | | | | | | | | |
EBITDA | | | 211,660 | | | | 107,254 | | | 179,613 | | | | 140,580 | | 106,145 |
Foreign exchange loss (gain) on derivative financial instruments and long-term debt | | | (31,108 | ) | | | 44,793 | | | (34,411 | ) | | | 4,275 | | 1,508 |
Deferred lease inducements(a) | | | 2,139 | | | | 2,276 | | | 2,312 | | | | 3,318 | | 2,427 |
Non-cash stock compensation expense(b) | | | 748 | | | | 741 | | | 1,312 | | | | 537 | | 598 |
Management fees and out-of-pocket expenses(c) | | | 2,505 | | | | 3,331 | | | 3,247 | | | | 3,194 | | 3,554 |
Fee paid in connection with the termination of the management agreement (d) | | | 5,000 | | | | — | | | — | | | | — | | — |
Performance related stock compensation expense (e) | | | 4,852 | | | | — | | | — | | | | — | | — |
Severance (f) | | | 1,483 | | | | — | | | — | | | | — | | — |
Transition reserve expenses(g) | | | — | | | | — | | | — | | | | — | | 2,285 |
Amortization of inventory step-up(h) | | | — | | | | — | | | — | | | | — | | 9,737 |
| | | | | | | | | | | | | | | | |
Adjusted EBITDA | | $ | 197,279 | | | $ | 158,395 | | $ | 152,073 | | | $ | 151,904 | | 126,254 |
| | | | | | | | | | | | | | | | |
| (a) | Represents an adjustment for non-cash straight-line rent expense. |
| (b) | Represents an adjustment of non-cash stock-based compensation expense. |
| (c) | Reflects the management fees incurred and paid or payable to Bain Capital Partners, LLC, including out of pocket expenses. |
| (d) | The management agreement was terminated concurrent with the IPO (as defined below). |
| (e) | Reflects the stock compensation expense related to performance vesting clauses that were triggered by the IPO. |
| (f) | Represents an adjustment relating to one-time severance costs. |
| (g) | Represents the elimination of certain transition-related expenses incurred in connection with the purchase, on November 18, 2004, by Dollarama L.P. (sponsored by an entity formed by Bain Capital Partners, LLC) of substantially all of the assets of S. Rossy Inc. and Dollar A.M.A. Inc. relating to the Dollarama business (the “Acquisition”) which have not been capitalized in purchase accounting or as debt issuance costs, primarily relating to non-recurring legal and accounting fees. |
| (h) | Represents the elimination of incremental cost of sales from November 18, 2004 to October 31, 2005 resulting from amortization of the step-up in fair value of the merchandise inventory balance following the application of purchase accounting to the Acquisition. |
4
A reconciliation of Adjusted EBITDA to cash flows from operating activities is included:
| | | | | | | | | | | | | | | | | | | |
(Canadian dollars in thousands) | | Year Ended
January 31,
2010 | | | Year Ended
February 1,
2009 | | | Year Ended
February 3,
2008 | | | Year Ended
February 4,
2007 | | Year Ended
January 31,
2006 | |
Adjusted EBITDA | | $ | 197,279 | | | $ | 158,395 | | | $ | 152,073 | | | $ | 151,904 | | $ | 126.254 | |
Interest expense(c) | | | (44,156 | ) | | | (34,630 | ) | | | (65,7133 | ) | | | (50,498 | | | (45,547 | ) |
Cash foreign exchange gain (loss) on derivative financial instruments and long-term debt(a) | | | (25,976 | ) | | | 14,282 | | | | (9,618 | ) | | | 6,089 | | | (443 | ) |
Cash income taxes | | | (293 | ) | | | (241 | ) | | | (302 | ) | | | (365 | | | (1,677 | ) |
Deemed interest repaid | | | (8,288 | ) | | | (1,129 | ) | | | (1,083 | ) | | | — | | | — | |
Deferred tenant allowances and leasing costs | | | 3,437 | | | | 2,068 | | | | 3,356 | | | | 3,574 | | | 2,685 | |
Amortization of deferred tenant allowances and leasing costs | | | (1,370 | ) | | | (1,098 | ) | | | (863 | ) | | | (429 | | | (220 | ) |
Management fees and out-of-pocket expenses(b) | | | (2,505 | ) | | | (3,331 | ) | | | (3,247 | ) | | | (3,194 | | | (3,554 | ) |
Fee paid in connection with the termination of the management agreement(b) | | | (5,000 | ) | | | — | | | | — | | | | — | | | — | |
Severance (b) | | | (1,483 | ) | | | — | | | | — | | | | — | | | — | |
Other | | | (1 | ) | | | 61 | | | | 197 | | | | 45 | | | (4 | ) |
Transition reserve expenses(d) | | | — | | | | — | | | | — | | | | — | | | (2,285 | ) |
Amortization of inventory step-up(e) | | | — | | | | — | | | | — | | | | — | | | (9,737 | ) |
| | | | | | | | | | | | | | | | | | | |
| | | 111,644 | | | | 134,377 | | | | 74,800 | | | | 107,126 | | | 65,472 | |
Changes in non-cash operating elements of working capital | | | 14,540 | | | | (17,290 | ) | | | (18,625 | ) | | | (12,739 | | | (19,064 | ) |
| | | | | | | | | | | | | | | | | | | |
Net cash provided by operating activities | | $ | 126,184 | | | $ | 117,087 | | | $ | 56,175 | | | $ | 94,387 | | $ | 46,408 | |
| | | | | | | | | | | | | | | | | | | |
| (a) | Represents the cash gain (loss) portion of the foreign exchange loss on long-term debt and change in fair value of derivative financial instruments. |
| (b) | Represents adjustments made in order to calculate Adjusted EBITDA. See footnotes to the prior reconciliation table in this note 4. |
| (c) | Represents interest expense net of amortization of debt issue costs and capitalized interest. |
| (d) | Represents the elimination of certain transition-related expenses incurred in connection with the Acquisition which have not been capitalized in purchase accounting or as debt issuance costs, primarily relating to non-recurring legal and accounting fees. |
| (e) | Represents the elimination of incremental cost of sales from November 18, 2004 to October 31, 2005 resulting from amortization of the step-up in fair value of the merchandise inventory balance following the application of purchase accounting to the Acquisition. |
| (6) | Rent expense represents (i) basic rent expense on a straight-line basis and (ii) contingent rent expense, net of amortization of inducements received from landlords. |
| (7) | Gross margin represents gross profit as a percentage of sales. Comparable store sales is a measure of the percentage increase or decrease of the sales of stores open for at least 13 complete months relative to the same period in the prior year. To provide more meaningful results, we measure comparable store sales over periods containing an integral number of weeks beginning on a Monday and ending on a Sunday that best approximate the fiscal period to be analyzed. |
| (8) | For purposes of calculating the ratio of earnings to fixed charges, earnings represent the sum of earnings before income taxes, fixed charges and amortization of capitalized interest, less capitalized interest. Fixed charges consist of interest expense, capitalized interest, and the portion of operating rental expense which management believes is representative of the interest component of rent expense. |
B. Capitalization and Indebtedness
Not applicable.
C. Reasons for the Offer and Use of Proceeds
Not applicable.
5
D. Risk Factors
Risks Related to Our Business
As a dollar store, we are particularly vulnerable to future increases in operating and merchandise costs.
Our ability to provide quality merchandise at low price points is subject to a number of factors that are beyond our control, including merchandise costs, foreign exchange rate fluctuations, increases in rent and occupancy costs, inflation and increases in labor (including any increases in the minimum wage) and fuel costs, all of which may reduce our profitability and have an adverse impact on our cash flows. In the past as a single fixed price retailer, we were unable to pass cost increases to our customers by increasing the price of our merchandise. As such, we have attempted to offset cost increases in one area of our operations by finding cost savings or operating efficiencies in another.
We believe that our additional fixed price points of $1.25, $1.50 and $2.00 will give us some flexibility to address cost increases by adjusting our selling price on certain items. There is, however, no guarantee that our customers will be willing to purchase products at increased prices or that we will be successful in offsetting costs in a meaningful way given the limited range of prices which we offer. Furthermore, there has historically been a time lag before any cost increases could be passed on to our customers. There can be no assurance that we will be able to pass on any cost increases to our customers.
Foreign exchange rate fluctuations, in particular, have a material impact on our operating and merchandise costs. This is because while our sales are in Canadian dollars, we have been increasing our purchases of merchandise from low-cost overseas suppliers, principally in China. In Fiscal 2010, direct sourcing from overseas suppliers accounted for more than 53% of our purchases. Our results of operations are particularly sensitive to the fluctuation of the Chinese renminbi against the U.S. dollar and the fluctuation of the U.S. dollar against the Canadian dollar because we purchase a majority of our imported merchandise from suppliers in China using U.S. dollars. For example, if the Chinese renminbi were to appreciate against the U.S. dollar, our cost of merchandise purchased in China would increase, which would have a negative impact on our margins, profitability and cash flows. If the U.S. dollar appreciates against the Canadian dollar at the same time, the negative impact would be further exacerbated. We enter into U.S. dollar currency hedging to reduce the risk associated with currency fluctuations. Currency hedging entails a risk of illiquidity and, to the extent that the U.S. dollar depreciates against the Canadian dollar, the risk of using hedges could result in losses greater than if the hedging had not been used. Hedging arrangements may have the effect of limiting or reducing the total returns to the Partnership if management’s expectations concerning future events or market conditions prove to be incorrect. In addition, the costs associated with a hedging program may outweigh the benefits of the arrangements in such circumstances. Labor shortages may reduce our ability to have a competitive labor cost. Fuel cost increases or surcharges could also increase our transportation costs and therefore impact our profitability. In addition, inflation and adverse economic developments in Canada, where we both buy and sell merchandise, and in China and other parts of Asia, where we buy a large portion of our imported merchandise, can have a negative impact on our margins, profitability and cash flows. If we are unable to predict and respond promptly to these or other similar events that may increase our operating and merchandise costs, our results of operations and cash flows will be adversely affected.
We may not be able to refresh our merchandise as often as we have done so in the past.
We adjust our merchandise mix periodically based on the results of internal analysis as slow-selling items are discontinued and replaced as warranted. Our success, therefore, depends in large part on our ability to continually find, select and purchase quality merchandise at attractive prices in order to replace underperforming goods. We typically do not enter into long-term contracts for the purchase or development of merchandise and must continually seek out buying opportunities from both our existing suppliers and new sources, for which we compete with other multi-price dollar stores, variety and discount stores and mass merchants. Although we believe that we have strong and long-standing relationships with our suppliers, we may not be successful in maintaining a continuing and increasing supply of quality merchandise at attractive prices. If we cannot find or purchase the necessary amount of competitively priced merchandise to replace goods that are outdated or unprofitable, our results of operations and cash flows will be adversely affected.
An increase in the cost or a disruption in the flow of our imported goods may significantly affect our sales and profits and have an adverse impact on our cash flows.
One of our key business strategies is to source quality merchandise directly from the lowest cost supplier. As a result, we rely heavily on imported goods, principally from China. Imported goods are generally less expensive than domestic goods and contribute significantly to our favorable profit margins. Merchandise imported directly from overseas manufacturers and agents accounted for more than 53% of our total purchases during Fiscal 2010. We expect direct imports to continue to account for approximately 45% to 60% of our total purchases. Our imported merchandise could become more expensive or unavailable for a number of reasons, including (a) disruptions in the flow of imported goods due to factors such as raw material shortages or an increase in prices, work stoppages, factory closures, suppliers going out of business, inflation, strikes, and political unrest in foreign countries, (b) problems with oceanic shipping, including shipping container shortages, (c) economic crises and international disputes, such as China’s claims to sovereignty over Taiwan, (d) increases in the cost of purchasing or shipping foreign merchandise resulting from a failure of Canada to maintain normal trade relations with foreign countries we deal with, (e) import duties, import quotas, and other trade sanctions, and (f) increases in shipping rates imposed by foreign countries we deal with. The development of one or more of these factors could
6
adversely affect our operations in a material way. If imported merchandise becomes more expensive or unavailable, we may not be able to transition to alternative sources in time to meet our demands. Products from alternative sources may also be of lesser quality and more expensive than those we currently import. A disruption in the flow of our imported merchandise or an increase in the cost of those goods due to these or other factors would significantly decrease our sales and profits and have an adverse impact on our cash flows.
Political and economic instability in the countries in which foreign suppliers are located, the financial instability of suppliers, suppliers’ failure to meet our supplier standards, issues with labor practices of our suppliers or labor problems they may experience (such as strikes), the availability and cost of raw materials to suppliers, merchandise quality or safety issues, currency exchange rates, transport availability and cost, inflation, and other factors relating to our suppliers and the countries in which they are located or from which they import are beyond our control and could have negative implications for us. In addition, the United States’ foreign trade policies, tariffs and other impositions on imported goods, trade sanctions imposed on certain countries, the limitation on the importation of certain types of goods or of goods containing certain materials from other countries and other factors relating to foreign trade are beyond our control. Disruptions due to labor stoppages, strikes or slowdowns, or other disruptions involving our vendors or the transportation and handling industries also may negatively affect our ability to receive merchandise and thus may negatively affect sales. These and other factors affecting our suppliers and our access to products could adversely affect our business and financial results. As we increase our imports of merchandise from foreign vendors, the risks associated with foreign imports will increase.
All of our vendors and their products must comply with applicable product safety laws. If we do not have adequate insurance or contractual indemnification available, product liability claims relating to products that are recalled, defective or otherwise harmful could have a material adverse effect on our business, reputation and financial results. Our ability to obtain indemnification from foreign suppliers may be hindered by the manufacturers’ lack of understanding of Canadian product liability or other laws, which may make it more likely that we be required to respond to claims or complaints from customers as if we were the manufacturer of the products. This could adversely affect our reputation and our litigation expenses could increase, each of which could have an adverse effect on our business, reputation and financial results.
We are dependent upon the smooth functioning of our distribution network.
We must constantly replenish depleted inventory through deliveries of merchandise to our four warehouses, our distribution center and our stores, and from our warehouses and distribution center to our stores by various means of transportation, including shipments by sea, train and truck on the roads and highways of Canada. Long-term disruptions to our warehouses and distribution center and to the national and international transportation infrastructure that lead to delays or interruptions of service would adversely affect our business. Similarly, extreme weather conditions can affect the planned receipt of inventory and the distribution of merchandise and may have an adverse effect on our business and financial results.
General economic conditions and volatility in the worldwide economy has adversely affected consumer spending, which may negatively affect our business and financial results.
Current economic conditions or a further deterioration in the Canadian economy may adversely affect the spending of our customers, which would likely result in lower sales than expected on a quarterly or annual basis. Future economic conditions affecting disposable consumer income, such as employment levels, consumer debt levels, lack of available credit, business conditions, fuel and energy costs, interest rates, and tax rates, could also adversely affect our business and financial results by reducing consumer spending or causing customers to shift their spending to other products. We may be sensitive to reductions in consumer spending because we generally have limited flexibility to reduce our prices to maintain or attract additional sales in an economic downturn.
In addition, current global economic conditions and uncertainties, the potential impact of the current recession, the potential for additional failures or realignments of financial institutions, and the related impact on available credit may affect us and our suppliers and other business partners, landlords, and customers in an adverse manner including, but not limited to, reducing access to liquid funds or credit (including through the loss of one or more financial institutions that are a part of our revolving credit facility), increasing the cost of credit, limiting our ability to manage interest rate risk, increasing the risk of bankruptcy of our suppliers, landlords or counterparties to or other financial institutions involved in our credit facilities and our derivative and other contracts, increasing the cost of goods to us, and other impacts which we are unable to fully anticipate. One of our key strategies is to source quality merchandise directly from the lowest cost supplier. Thus supplier plant closures or increases in costs of merchandise due to economic conditions may adversely affect our business and financial results.
Our level of indebtedness could adversely affect our ability to raise additional capital to fund our operations, limit our ability to react to changes in the economy or our industry and prevent us from meeting our debt obligations.
We are highly leveraged. As of January 31, 2010, we had long-term debt excluding financing costs of $477.4 million. Our high degree of leverage could have important consequences, including the following:
| | • | | a substantial portion of our cash flows from operations will be dedicated to the payment of principal and interest on our indebtedness and other financial obligations and will not be available for other purposes, including funding our operations and capital expenditures for projects such as a new warehouse or distribution center, new store openings, and future business opportunities; |
7
| | • | | the debt service requirements of our other indebtedness and lease expense could make it more difficult for us to make payments on our debt; |
| | • | | our ability to obtain additional financing for working capital and general corporate or other purposes may be limited; |
| | • | | certain of our borrowings, including the Deferred Interest Notes and borrowings under our Credit Facility, are at variable rates of interest, exposing us to the risk of increased interest rates; |
| | • | | our debt level may limit our flexibility in planning for, or reacting to, changes in our business and in our industry in general, placing us at a competitive disadvantage compared to our competitors that have less debt; and |
| | • | | our leverage may make us vulnerable to a downturn in general economic conditions and adverse industry conditions. |
We may not be able to generate sufficient cash to service all of our indebtedness and may be forced to take other actions to satisfy our obligations under such indebtedness.
Our ability to make scheduled payments on or to refinance our debt obligations and to make distributions to enable us to service our debt obligations depends on our financial and operating performance, which is subject to prevailing economic and competitive conditions and to certain financial, business, and other factors beyond our control, including fluctuations in interest rates, market liquidity conditions, increased operating costs, and trends in our industry. If our cash flows and capital resources are insufficient to fund our debt service obligations, we may be forced to reduce or delay capital expenditures, sell assets, seek additional capital, or restructure or refinance our indebtedness. These alternative measures may not be successful and may not permit us to meet our scheduled debt service obligations. In such circumstances, we could face substantial liquidity problems and might be required to dispose of material assets or operations to meet our debt service and other obligations. The Credit Facility restricts the ability of Group L.P. and its restricted subsidiaries, and the indenture governing the Deferred Interest Notes (the “Deferred Interest Notes Indenture”) restricts the ability of Holdings and its restricted subsidiaries to dispose of assets and restrict the use of the proceeds from asset dispositions. We may not be able to consummate those dispositions or to obtain the proceeds which could be realized from them and these proceeds may not be adequate to meet any debt service obligations then due.
Despite current indebtedness levels, we may still be able to incur substantially more debt, which could further exacerbate the risks described above.
We may be able to incur substantial additional indebtedness in the future. Although the Credit Facility and the Deferred Interest Notes Indenture contain restrictions on the incurrence of additional indebtedness, such restrictions are subject to a number of qualifications and exceptions, and under certain circumstances, indebtedness incurred in compliance with such restrictions could be substantial. In addition, our subsidiaries may, under certain circumstances and subject to receipt of additional commitments from existing lenders or other eligible institutions, request additional term loan tranches or increases to the revolving loan commitments by an aggregate amount of up to $150 million (or the U.S. dollar equivalent thereof). If our current debt levels are increased, the related risks that we now face could intensify.
The terms of the Credit Facility and the Deferred Interest Notes Indenture impose significant operating restrictions, which may prevent us from pursuing certain business opportunities and taking certain actions that may be in our interest.
Our Credit Facility contains various covenants that limit our ability to engage in specified types of transactions. These covenants limit our ability to, among other things:
| | • | | incur, assume, or guarantee additional debt and issue or sell preferred stock; |
| | • | | pay dividends on, redeem or repurchase our capital stock; |
| | • | | make capital expenditures; |
8
| | • | | create or permit certain liens; |
| | • | | use the proceeds from sales of assets and subsidiary stock; |
| | • | | create or permit restrictions on the ability of our restricted subsidiaries to pay dividends or make other distributions to us; |
| | • | | enter into transactions with affiliates; |
| | • | | conduct certain business activities; |
| | • | | consolidate or merge or sell all or substantially all of our assets; and |
| | • | | prepay, redeem or repurchase certain indebtedness. |
In addition, the Credit Facility also requires Group L.P. to comply on a quarterly basis with certain financial covenants, including a maximum lease-adjusted leverage ratio test and a minimum interest coverage ratio test.
The Deferred Interest Notes Indenture also contains various covenants that limit our ability to engage in specified types of transactions. These covenants limit our ability to, among other things:
| | • | | incur, assume, or guarantee additional debt and issue or sell preferred stock; |
| | • | | pay dividends on, redeem or repurchase our capital stock; |
| | • | | create or permit certain liens; |
| | • | | use the proceeds from sales of assets and subsidiary stock; |
| | • | | create or permit restrictions on the ability of our restricted subsidiaries to pay dividends or make other distributions to us; |
| | • | | enter into transactions with affiliates; |
| | • | | conduct certain business activities; |
| | • | | consolidate or merge or sell all or substantially all of our assets; and |
| | • | | prepay, redeem or repurchase certain indebtedness. |
Under the Credit Facility, the occurrence of specified change of control events will cause an event of default. Change of control events include if certain “permitted holders” (being funds advised by Bain Capital Partners, LLC (“Bain Capital”) and certain original management shareholders, unless management shareholders hold more than 30% of the voting stock of Dollarama Holdings L.P. (“Holdings L.P.”) or more voting stock in Holdings L.P. than funds advised by Bain Capital, in which case they are not included as permitted holders for this purpose) cease to hold a majority, directly or indirectly, of Holdings L.P.’s voting stock; unless, following such event, (i) no other person or group of persons (other than “permitted holders”) becomes the beneficial owner of more than 35%, directly or indirectly, (or, if higher, the percentage then held by such permitted holders) of Holdings L.P.’s voting stock, and, (ii) a majority of Holdings L.P.’s board of directors continues to be directors that were recommended for nomination for election by the Holdings L.P.’s board of directors, in which case such event shall not be considered a change of control.
Under the Deferred Interest Notes Indenture, if specified change of control events occur, we will be required to offer to repurchase all outstanding notes under the applicable indenture at a price equal to 101% of their principal amount plus accrued and unpaid interest, if any. Change of control events include a sale of substantially all of our assets (other than to certain “permitted holders” being funds advised by Bain Capital and certain original management shareholders, unless management shareholders hold more voting stock of Holdings L.P. or the Partnership than funds advised by Bain Capital, in which case they are no longer considered permitted holders), the acquisition by a person or group of persons (other than permitted holders) of at least 50%, directly or indirectly, of the voting power of the Partnership or Holdings L.P. or a majority of the Partnership’s directors ceasing to be directors
9
that were nominated for election, or whose nomination for election was previously approved, by the Partnership’s board of directors. Our failure to repurchase these notes upon a change of control would cause an event of default under the indenture governing the Deferred Interest Notes upon a change of control because we may not have sufficient financial resources to purchase all of the notes that are tendered upon a change of control. Further, we will be contractually restricted under the terms of our Credit Facility from repurchasing all of the notes tendered by holders upon a change of control. Accordingly, we may not be able to satisfy such obligations to purchase the notes unless we are able to refinance or obtain waivers under the Credit Facility. Our failure to repurchase these notes upon a change of control would cause an event of default under the indenture governing the Deferred Interest Notes. This may also cause a cross-default under the Credit Facility.
These restrictions may prevent us from taking actions that we believe would be in the best interest of our business, and may make it difficult for us to successfully execute our business strategy or effectively compete with companies that are not similarly restricted.
Our variable rate indebtedness subjects us to interest rate risk, which could cause our debt service obligations to increase significantly.
A portion of our indebtedness, including our Deferred Interest Notes and the borrowings under the Credit Facility, is at variable rates of interest and exposes us to interest rate risk. If interest rates increase, our debt service obligations on the variable rate indebtedness would increase even though the amount borrowed remained the same, and our net income and cash flows would decrease.
There is no guarantee that our strategy to introduce products between the $1.00 and $2.00 dollar price range will continue to be successful.
On February 2, 2009, we introduced additional price points of $1.25, $1.50 and $2.00. We believe that these multiple price points will allow us to offer more value and higher quality goods to our customers. There is, however, no guarantee that our customers will continue to purchase our products priced above the $1.00 price point or that we will be able to continue to offer the same quality and variety of products at the same price-points, which would negatively affect our business and financial results.
Our private brands may not achieve or maintain broad market acceptance.
We carry a substantial number of private brand items. We believe that our success in maintaining broad market acceptance of our private brands depends on many factors, including pricing, quality and customer perception. We may not achieve or maintain our expected sales for our private brands. As a result, our business and financial results could be adversely affected.
We may be unable to obtain additional capacity for our warehouse and distribution centers.
We may need additional warehouse and distribution center capacity in the coming years following future store openings. However, under our current expansion plan, we believe our existing distribution network currently has the capacity to cost-effectively service more than 150 additional stores. If we are unable to locate sites for new warehouses and distribution centers or unable to launch warehouses or distribution centers on a timely basis, we may not be able to successfully execute our growth strategy.
Our sales may be affected by weather conditions or seasonal fluctuations.
Weather conditions can affect the timing of consumer spending and have an impact on our retail sales. Moreover, the different holidays like Christmas, Easter, Valentine’s Day and Halloween have a positive impact on our retail sales. Historically, our highest sales results have occurred during the fourth quarter, which includes the holiday selling season. During Fiscal 2010, approximately 29.0% of our sales were generated in the fourth quarter. Accordingly, weather conditions or a failure to anticipate the impact that holidays may have on our operations could have an adverse effect on our business and financial results.
Competition in the retail industry could limit our growth opportunities and reduce our profitability.
The retail business is highly competitive. We operate in the value retail industry, which is competitive with respect to price, store location, merchandise quality, assortment and presentation, in-stock consistency, and customer service. This competitive environment subjects us to the risk of adverse impact to our financial performance because of the lower prices, and thus the lower margins, required to maintain our competitive position. Also, companies operating in our industry (due to customer demographics and other factors) may have limited ability to increase prices in response to increased costs (including, but not limited to, vendor price increases). This limitation may adversely affect our margins and financial performance. We compete for customers, employees, store sites, products and services and in other important aspects of our business with many other local, regional and national retailers. We compete with multi-price dollar stores, variety and discount stores and mass merchants. These other competitors compete in a variety of ways, including aggressive promotional activities, merchandise selection and availability, services offered to customers, location,
10
store hours, in-store amenities and price. If we fail to respond effectively to competitive pressures and changes in the retail markets, it could adversely affect our business and financial results. Some of our competitors in the retail industry are much larger and have substantially greater resources than we do, and we remain vulnerable to the marketing power and high level of consumer recognition of major mass merchants, and to the risk that these mass merchants or others could venture into our market segment in a significant way. In addition, we expect that our expansion plans, as well as the expansion plans of other dollar stores, will increasingly bring us into direct competition with them. Competition may also increase because there are no significant economic barriers to other companies opening dollar stores.
Our business is dependent on our ability to obtain competitive pricing and other terms from our suppliers and the timely receipt of inventory.
We believe that we have good relations with our suppliers and that we are generally able to obtain competitive pricing and other terms from suppliers. However, we buy products on an order-by-order basis and have very few long-term purchase contracts or other assurances of continued product supply or guaranteed product cost. If we fail to maintain good relations with our suppliers, or if our suppliers’ product costs are increased as a result of prolonged or repeated increases in the prices of certain raw materials, we may not be able to obtain attractive pricing, in which case our profit margins may be reduced and our results of operations may be adversely affected. In addition, if we are unable to receive merchandise from our suppliers on a timely basis because of interruptions in production or other reasons that are beyond our control, our business and financial results may be adversely affected.
We may be unable to renew our store, warehouse and distribution center leases or find other locations or leases on favorable terms.
As of January 31, 2010, we leased all our stores from unaffiliated third parties, except 18 of our stores leased from entities controlled by Larry Rossy. Approximately 11%, 9% and 9% of our store leases with third party lessors will expire in fiscal year 2011, fiscal year 2012, and fiscal year 2013, respectively. As of January 31, 2010, we leased all of our warehouses and our distribution centre from entities controlled by Larry Rossy. Our warehouse leases will expire in fiscal year 2024 and our distribution centre lease will expire in fiscal year 2024. Unless the terms of our leases are extended, the properties, together with any improvements that we have made, will revert to the property owners upon expiration of the lease terms. As the terms of our leases expire, we may not be able to renew these leases or find alternative store locations that meet our needs on favorable terms or at all. If we are unable to renew a significant number of our expiring leases or to promptly find alternative store locations that meet our needs, our profitability and cash flows may be materially adversely affected. Furthermore, many leases provide that the landlord may increase the rent over the term of the lease. Most leases require us to pay a variety of costs such as cost of insurance, taxes, maintenance and utilities. We generally cannot cancel these leases. If an existing or future store is not profitable, and we decide to close it, we may nonetheless be committed to perform our obligations under the applicable lease including, among other things, paying the base rent for the balance of the lease term.
If we experience significant disruptions in our information technology systems, our business and financial results may be adversely affected.
We depend on our information technology systems for the efficient functioning of our business, including accounting, data storage, purchasing and inventory management, and store communications systems. Our enterprise-wide software solution enables management to better and more efficiently conduct our operations and gather, analyze, and assess information across all business segments and geographic locations. However, difficulties with the hardware and software platform could disrupt our operations, including our ability to timely ship and track product orders, project inventory requirements, manage our supply chain, and otherwise adequately service our customers, which would have an adverse effect on our business and financial results. In the event we experience significant disruptions with our information technology system, we may not be able to fix our systems in an efficient and timely manner. Accordingly, such events may disrupt or reduce the efficiency of our entire operation and have a material adverse effect on our results of operations and cash flows. Costs associated with potential interruptions to our information systems could be significant.
We may not be able to successfully execute our growth strategy, particularly outside of our core markets of Ontario and Québec.
We have experienced substantial growth during the past several years, opening an average of 43 net new stores per year since fiscal year 2002, and we plan to continue to open new stores in the near future. Our ability to successfully execute our growth strategy will depend largely on our ability to successfully open and operate new stores, particularly outside of our traditional core markets of Ontario and Québec, which, in turn, will depend on a number of factors, including whether we can:
| | • | | supply an increasing number of stores with the proper mix and volume of merchandise; |
11
| | • | | hire, train, and retain an increasing number of qualified employees at affordable rates of compensation; |
| | • | | locate, lease, build out, and open stores in suitable locations on a timely basis and on favorable economic terms; |
| | • | | expand into new geographic markets, where we have limited or no presence; |
| | • | | expand within our traditional core markets of Ontario and Québec, where new stores may draw sales away from our existing stores; |
| | • | | successfully compete against local competitors; and |
| | • | | build, expand and upgrade warehouses and distribution centers and internal store support systems in an efficient, timely and economical manner. |
Any failure by us to achieve these goals could adversely affect our ability to continue to grow.
We may not be able to achieve the anticipated growth in sales and operating income when we open new stores.
If our planned expansion occurs as anticipated, our store base will include a relatively high proportion of stores with relatively short operating histories. Comparable store sales may be negatively affected when stores are opened or expanded near existing stores. If our new stores on average fail to achieve results comparable to our existing stores, our planned expansion could produce a decrease in our overall sales per square foot and store-level operating margins.
Our profitability may be negatively affected by inventory shrinkage.
We are subject to the risk of inventory loss, administrative or operator errors, including mislabeling, theft and fraud. We have experienced inventory shrinkage in the past, and we cannot assure you that incidences of inventory loss and theft will decrease in the future or that the measures we are taking or the initiatives we implemented will effectively address the problem of inventory shrinkage. Although some level of inventory shrinkage is a necessary and unavoidable cost of doing business, if we were to experience higher rates of inventory shrinkage or incur increased security costs to combat inventory theft, our business and financial results could be affected adversely.
We are subject to environmental regulations, and compliance with such regulations could require us to make expenditures.
Under various federal, provincial, and local environmental laws and regulations, current or previous owners or occupants of property may become liable for the costs of investigating, removing and monitoring any hazardous substances found on the property. These laws and regulations often impose liability without regard to fault.
Certain of the facilities that we occupy have been in operation for many years and, over such time, we and the prior owners or occupants of such properties may have generated and disposed of materials which are or may be considered hazardous. Accordingly, it is possible that additional environmental liabilities may arise in the future as a result of any generation and disposal of such hazardous materials. Although we have not been notified of, and are not aware of, any current environmental liability, claim, or non-compliance, we could incur costs in the future related to our properties in order to comply with, or address any violations under, environmental laws and regulations.
In the ordinary course of our business, we sometimes use, store, handle or dispose of household products and cleaning supplies that are classified as hazardous materials under various environmental laws and regulations. We cannot predict the environmental laws or regulations that may be enacted in the future or how existing or future laws and regulations will be administered or interpreted. Compliance with more stringent laws or regulations, as well as more vigorous enforcement policies of the regulatory agencies or stricter interpretations of existing laws and regulations, may require additional expenditures by us which could vary substantially from those currently anticipated.
Failure to attract and retain qualified employees while controlling labor costs, as well as other labor issues, could adversely affect our business and financial results.
Our future growth and performance depends on our ability to attract, retain and motivate qualified employees, many of whom are in positions with historically high rates of turnover. Our ability to meet our labor needs, while controlling our labor costs, is subject to many external factors, including the competition for and availability of qualified personnel in a given market, unemployment levels within those markets, prevailing wage rates, minimum wage laws, health and other insurance costs and changes in employment and labor legislation (including changes in the process for our employees to join a union) or other workplace
12
regulation (including changes in entitlement programs such as health insurance and paid leave programs). While we believe we pay our employees fair wages, to the extent a significant portion of our employee base unionizes, or attempts to unionize, our business could be disrupted and, to the extent such attempts are successful, our labor costs could increase. Our ability to pass along labor costs is constrained.
Also, our stores are managed through a network of geographically dispersed management personnel. Our inability to effectively and efficiently operate our stores, including the ability to control losses resulting from inventory and cash shrinkage, may negatively affect our sales and/or operating margins.
If we lose the services of our senior executives who possess specialized market knowledge and technical skills, it could reduce our ability to compete, to manage our operations effectively, or to develop new products and services.
Many of our senior executives have extensive experience in our industry and with our business, products, and customers. Since we are managed by a small group of senior executive officers, the loss of the technical knowledge, management expertise and knowledge of our operations of one or more members of our core management team, including Larry Rossy, our CEO and the grandson of our founder, Neil Rossy, our Chief Merchandising Officer and the son of Larry Rossy, Geoffrey Robillard, our Senior Vice President, Import Division, and Stéphane Gonthier, our Chief Operating Officer (“COO”), could result in a diversion of management resources, as the remaining members of management would need to cover the duties of any senior executive who leaves us and would need to spend time usually reserved for managing our business to search for, hire and train new members of management. The loss of some or all of our senior executives could negatively affect our ability to develop and pursue our business strategy, which could adversely affect our business and financial results.
Fluctuations in the value of the Canadian dollar in relation to the U.S. dollar may impact our operating and financial results and may affect the comparability of our results between financial periods.
Exchange rate fluctuations could have an adverse effect on our results of operations and ability to service our U.S. dollar-denominated debt. The majority of our debt and over 50% of our purchases are in U.S. dollars while the majority of our sales and operating expenses are in Canadian dollars. Therefore, a fluctuation in the exchange rate of the Canadian dollar versus the U.S. dollar would affect the cash needed to service our U.S. dollar-denominated debt and the related hedge instruments and, in addition, our gross margins would be impacted. For the purposes of financial reporting, any change in the value of the Canadian dollar against the U.S. dollar during a given financial reporting period would result in a foreign currency loss or gain on the translation of U.S. dollar denominated debt and our related hedge instruments into Canadian dollars under Canadian generally accepted accounting principles. Consequently, our reported earnings could fluctuate materially as a result of foreign exchange translation gains or losses and may not be comparable from period to period.
Litigation may adversely affect our business and financial results.
Our business is subject to the risk of litigation by employees, customers, consumers, suppliers, competitors, shareholders, government agencies, or others through private actions, class actions, administrative proceedings, regulatory actions or other litigation, including, in the case of administrative proceedings, as a result of reviews by taxation authorities. The outcome of litigation, particularly class action lawsuits, regulatory actions and intellectual property claims, is difficult to assess or quantify. Claimants in these types of lawsuits or claims may seek recovery of very large or indeterminate amounts, and the magnitude of the potential loss relating to these lawsuits or claims may remain unknown for substantial periods of time. In addition, certain of these lawsuits or claims, if decided adversely to us or settled by us, may result in liability material to our financial statements as a whole or may negatively affect our operating results if changes to our business operations are required. Also, in connection with the Partnership’s business activities, the Partnership is subject to reviews by taxation authorities. There is no assurance that any such reviews will not result in taxation authorities challenging any of our tax filings. The cost to defend future litigation may be significant. There also may be adverse publicity associated with litigation that could negatively affect customer perception of our business, regardless of whether the allegations are valid or whether we are ultimately found liable. As a result, litigation may adversely affect our business and financial results.
We are subject to the risk of product liability claims and product recalls.
The Partnership sells products produced by third party manufacturers. Some of these products may expose the Partnership to product liability claims relating to personal injury, death or property damage caused by such products, any may require the Partnership to take actions. One or more of our suppliers might not adhere to product safety requirements or our quality control standards, and we might not identify the deficiency before merchandise ships to our stores. If our suppliers are unable or unwilling to recall products failing to meet our quality standards, we may be required to remove merchandise from our shelves or recall those products at a substantial cost to us. Product recalls, withdrawals or replacements may harm the Partnership’s reputation and acceptance of its products by customers, which may adversely affect our business and financial results. Product recalls, withdrawals, or replacements
13
may also increase the amount of competition that the Partnership faces. Some competitors may attempt to differentiate themselves from the Partnership by claiming that their products are produced in a manner or geographic area that is insulated from the issues that preceded the recalls, withdrawals, or replacements of the Partnership’s products. Although the Partnership maintains liability insurance to mitigate potential claims, the Partnership cannot be certain that its coverage will be adequate for liabilities actually incurred or that insurance will continue to be available on economically reasonable terms or at all. Product liability claims and product recalls, withdrawals or replacements could adversely affect the Partnership’s business and financial results.
Our current insurance program may expose us to unexpected costs and negatively affect our financial results.
Our insurance coverage reflects deductibles, self-insured retentions, limits of liability and similar provisions that we believe are prudent based on the dispersion of our operations. However, there are types of losses we may incur but against which we cannot be insured or which we believe are not economically reasonable to insure, such as losses due to acts of war, employee and certain other crime and some natural disasters. If we incur these losses and they are material, our business could suffer. Certain material events may result in sizable losses for the insurance industry and adversely impact the availability of adequate insurance coverage or result in excessive premium increases. To offset negative insurance market trends, we may elect to self insure, accept higher deductibles or reduce the amount of coverage in response to these market changes. In addition, we self insure a significant portion of expected losses under our workers’ compensation, automobile liability, general liability and group health insurance programs. Unanticipated changes in any applicable actuarial assumptions and management estimates underlying our recorded liabilities for these losses, including expected increases in medical and indemnity costs, could result in materially different amounts of expense than expected under these programs, which could have an adverse effect on our financial results. Although we continue to maintain property insurance for catastrophic events, we are effectively self-insured for property losses up to the amount of our deductibles. If we experience a greater number of these losses than we anticipate, our financial results could be adversely affected.
We may not be able to protect our trademarks and other proprietary rights.
We believe that our trademarks and other proprietary rights are important to our success and our competitive position. Accordingly, we protect our trademarks and proprietary rights. However, the actions taken by us may be inadequate to prevent imitation of our products and concepts by others or to prevent others from claiming violations of their trademarks and proprietary rights by us. In addition, our intellectual property rights may not have the value that we believe they have. If we are unsuccessful in protecting our intellectual property rights, or if another party prevails in litigation against us relating to our intellectual property rights, the value and adequacy of our brand recognition could be diminished causing customer confusion and adversely affecting our sales and profitability and we may incur significant costs and may be required to change certain aspects of our operations.
Natural disasters, unusual weather, pandemic outbreaks, boycotts and geo-political events or acts of terrorism could adversely affect our operations and financial results.
The occurrence of one or more natural disasters, such as hurricanes and earthquakes, unusually adverse weather, pandemic outbreaks, boycotts and geo-political events, such as civil unrest in countries in which our suppliers are located and acts of terrorism, or similar disruptions could adversely affect our operations and financial results. These events could result in physical damage to one or more of our properties, increases in fuel or other energy prices, the temporary or permanent closure of one or more of our stores or warehouses or distribution centers, delays in opening new stores, the temporary lack of an adequate workforce in a market, the temporary or long-term disruption in the supply of products from some local and overseas suppliers, the temporary disruption in the transport of goods from overseas, delay in the delivery of goods to our warehouses, distribution centers or stores, the temporary reduction in the availability of products in our stores and disruption to our information systems. These factors could otherwise disrupt and adversely affect our operations and financial results.
We face risks related to protection of customers’ credit card data.
We transmit confidential credit card information in connection with our credit card pilot project. Third parties may have the technology or know-how to breach the security of this customer information, and our security measures and those of our technology vendors may not effectively prevent others from obtaining improper access to this information. Any security breach could expose us to risks of data loss, litigation and liability and could seriously disrupt our operations and any resulting negative publicity could significantly harm our reputation.
Influence by Existing Shareholders of Dollarama Inc.
Based on share ownership as of the date hereof, Bain Capital beneficially owns or controls, directly or indirectly, 22,037,446 common shares of our parent Dollarama Inc. (“Common Shares”), which in the aggregate represents approximately 30.1% of Dollarama Inc.’s issued and outstanding Common Shares, Larry Rossy and The Larry and Cookie Rossy Family Foundation beneficially own or control, in the aggregate, directly or indirectly, 4,407,230 Common Shares, which represent approximately 6.0% of our Common Shares. As a result, if some of these persons or entities act together, they have the ability to control or significantly influence all matters submitted to
14
Dollarama Inc.’s shareholders for approval, including without limitation the election and removal of directors, amendments to its articles of incorporation and by-laws and the approval of any business combination. This may delay or prevent an acquisition of Dollarama Inc. or cause the market price of its shares to decline. The interests of funds advised by Bain Capital may not in all cases be aligned with interests of Dollarama Inc.’s shareholders. In addition, funds advised by Bain Capital may have an interest in pursuing acquisitions, divestitures and other transactions that, in the judgment of its management, could enhance its equity investment, even though such transactions might involve risks to Dollarama Inc.’s shareholders and may ultimately affect the market price of the Common Shares.
Future Sales of Common Shares by Dollarama Inc.’s Existing Shareholders
Based on share ownership as of the date hereof, Bain Capital, Larry Rossy and The Larry and Cookie Rossy Family Foundation, in the aggregate, beneficially own or control, directly or indirectly, 26,444,676 Common Shares of our parent, Dollarama Inc., which in the aggregate represent approximately 36.2% of Dollarama Inc.’s outstanding Common Shares. Subject to compliance with applicable securities laws, our officers, directors, principal shareholders and their affiliates may sell some or all of their Common Shares of Dollarama Inc. in the future. No prediction can be made as to the effect, if any, such future sales of Common Shares of Dollarama Inc. will have on the market price of the Common Shares of Dollarama Inc. prevailing from time to time. However, the future sale of a substantial number of Common Shares by our officers, directors, principal shareholders and their affiliates, or the perception that such sales could occur, could adversely affect prevailing market prices for the Common Shares. Pursuant to the Shareholders Agreement (as defined hereinafter), each party is granted certain registration rights. See “Item 7B. Related Party Transactions.”
| Item 4. | INFORMATION ON THE COMPANY |
Registrant
Holdings’ head and registered office is located at 5805 Royalmount Ave., Montreal, Québec, H4P 0A1, and its phone number at that address is (514) 737-1006. Holdings has appointed Carl P. Marcellino, Esq., with telephone number (212) 596-9000, as our agent for service of processes for actions brought under the U.S. securities laws.
A. History and development of Holdings.
Holdings is a limited partnership that was formed under the laws of Québec, Canada on December 7, 2006 and is a wholly owned subsidiary of Dollarama Inc., a corporation incorporated under the Canada Business Corporations Act by articles of incorporation dated October 20, 2004. Holdings indirectly owns, through its subsidiaries, all of the equity interests in Dollarama L.P. and Dollarama Corporation, which together operate the Dollarama business.
In 1992, the Dollarama business was founded by our chief executive officer, Larry Rossy, a third generation retailer. Mr. Rossy took the helm of the family retail business in 1973 and transitioned the business from a general merchandise retailer to a single price point dollar store chain. Mr. Rossy led the Dollarama management team to introduce a number of initiatives that have defined our current strategic focus. These included (i) adopting a fixed price point dollar store concept, (ii) pursuing our store network expansion strategy in Canada leading to stronger brand awareness and increased sales and (iii) implementing a program to directly source merchandise from overseas suppliers to lower our merchandise costs and diversify and enhance our product offering. In February 2009, Dollarama Inc. launched its multiple price point product offering pursuant to which it now sells multiple or single units at selected fixed price points between $1.00 and $2.00, with the exception of select candy offered at $0.69. On November 18, 2004, funds advised by Bain Capital acquired approximately 80% of Dollarama Inc.’s common equity and Larry Rossy and other members of our current and former management team owned the remaining 20% of Dollarama Inc.’s common equity. On October 16, 2009, Dollarama Inc. completed an initial public offering (the “IPO”) of 17,142,857 Common Shares at a price of $17.50 per share resulting in gross proceeds of $299,999,997.50. As of the date hereof, funds advised by Bain Capital and Larry Rossy and other members of our current management team, as a group, own 30.1% and 8.4% of Common Shares of Dollarama Inc., respectively
B. Business overview.
We are the leading operator of dollar stores in Canada with more than four times the number of stores as our next largest dollar store competitor in Canada. We are the only dollar store chain operator with a significant national presence and are continuing to expand in all Canadian provinces. Over the last four fiscal years, we have opened 205 net new stores. As of January 31, 2010, our stores average approximately 9,806 square feet and offer a targeted mix of merchandise at compelling values, including private label and nationally branded products. We offer a broad range of quality consumer products and general merchandise for everyday use, in
15
addition to seasonal products. Our quality merchandise is sold in individual or multiple units at select fixed price points between $1.00 and $2.00, with the exception of select candy offered at $0.69. All of our stores are corporate-owned, providing a consistent shopping experience, and nearly all are located in high-traffic areas such as strip malls and shopping centers in various locations, including metropolitan areas, mid-sized cities, and small towns.
As of January 31, 2010, we operated 603 corporate-owned stores located across Canada and we generated sales of approximately $1.3 billion and Adjusted EBITDA of $197.3 million, during Fiscal 2010.
We believe that the leadership position we have achieved in the Canadian dollar store industry is attributable to a number of operational advantages, which will reinforce our future growth, including:
| | • | | the number, location and penetration of our stores in our markets, which increase our brand recognition, generate word-of-mouth advertising and drive customer traffic; |
| | • | | our core offering of consistently available everyday products, which offers compelling value and makes our stores a destination shopping experience, in contrast to the “treasure hunt” type offering of certain other dollar stores; |
| | • | | our store size and consistent store format, which allows for an effective display of a broader assortment of merchandise; |
| | • | | our strong and long-standing supplier network, which enables us to update and diversify our product selection and rapidly respond to our customers’ changing needs; |
| | • | | the volume of goods that we directly source from low-cost foreign vendors, which allows us to deliver a strong customer value proposition at attractive margins; |
| | • | | our in-house product development expertise, which enables us to provide high-quality and consistent products; and |
| | • | | the size, scale and efficiencies of our warehouse and distribution operations. |
Merchandise
Merchandise Mix
We offer a well-balanced targeted mix of merchandise at compelling values, including private label and nationally branded products. Our merchandise mix consists of:
| | • | | Consumable products, which represented approximately 35% of our product offering (based on retail value) for Fiscal 2010 and which include household consumables, such as paper, plastics, foils and household products and cleaning supplies, basic health and beauty care, and candy, drinks, snacks and other food products; |
| | • | | General merchandise, which represented approximately 51% of our product offering (based on retail value) for Fiscal 2010 and which include party supplies, greeting cards, gift wrap and craft and stationery supplies, durable housewares and kitchenwares, hardware and electronics, toys, gifts, apparel and other items; and |
| | • | | Seasonal products, which represented approximately 14% of our product offering (based on retail value) for Fiscal 2010 and which include Valentine’s day, St. Patrick’s day, Easter, Halloween and Christmas merchandise, along with seasonal summer and winter merchandise. |
The selection of items offered in our stores at any one time varies.
We are constantly adjusting our merchandise mix to offer the best value and a wide selection of products to our customers, as well as to maintain or improve our gross margins. Our stores carry a broad assortment of actively-managed SKUs, including more than 3,500 active year-round SKUs and more than 600 active seasonal SKUs at any one time. We analyze our products in inventory on a monthly basis for sales and profitability. Based on the results, we are able to quickly adjust our merchandise mix with a goal of optimizing profitability. Slower selling items are discontinued and replaced as warranted.
Our products are sold primarily in individual or multiple units at fixed prices of $0.69 (for select candy), $1.00, $1.25, $1.50 and $2.00. Prior to February 2009, almost all of our merchandise was sold at a single $1.00 price point. On February 2, 2009, we introduced additional price points of $1.25, $1.50, and $2.00 which have created greater merchandise flexibility and have allowed us to further broad on our product offering.
16
Merchandise Sourcing
We purchase most of our merchandise centrally from manufacturers, wholesalers, manufacturers’ representatives and importers. Our strategy is to source merchandise directly from the lowest cost suppliers that meet our high-quality standards. Our sourcing strategy blends directly imported merchandise from overseas and products sourced from North American vendors, which accounted for 53% and 47%, respectively, of our total volume in Fiscal 2010. Typically, products purchased from Canadian manufacturers are consumables including household products and cleaning supplies, groceries, confectionary, and greeting cards. While we still source a majority of our overseas products from China, we have been steadily increasing our purchases from other overseas suppliers in the last two fiscal years, including goods sourced directly from Brazil, India, Indonesia, Taiwan, and Turkey. We began developing relationships with overseas suppliers in 1993. In addition, we also develop the product design, packaging, and labeling concepts for our private-label brand and work in concert with our suppliers selected to produce each item to meet our exacting standards.
Our supplier base is well diversified, with no single supplier accounting for more than 6% of our total purchases in Fiscal 2010. For the same period, our top 10 suppliers represented less than 24% of our total purchases and our top 25 suppliers represented less than 38% of our total purchases. We generally buy products on an order-by-order basis and do not enter into long-term purchase contracts or other assurances of continued product supply or guaranteed product cost. However, we have strong and long-standing relationships with our suppliers, including relationships with eight of our top ten suppliers for more than ten years and each of our top ten suppliers for more than five years. The strength and duration of these relationships as well as our purchasing scale and direct sourcing capabilities contribute to our competitive cost position and ability to offer a wide selection of products at our price points.
Seasonality
Our business has limited sales seasonality. Generally, our highest sales volume occurs in the fourth quarter, which includes the Christmas selling season, and the lowest occurs in the first quarter. In addition, our quarterly results can be affected by the timing of new store openings and store closings, the amount of sales contributed by new and existing stores, as well as the timing of certain holidays. We purchase substantial amounts of inventory in the third quarter and incur higher shipping costs and higher payroll costs in anticipation of the increased sales activity during the fourth quarter. In addition, we carry merchandise during our fourth quarter that we do not carry during the rest of the year, such as gift sets, holiday decorations, certain baking items, and a broader assortment of toys and candy.
The following table reflects the seasonality of sales and gross margin for each of the quarters in Fiscal 2010. All of the quarters reflected below are comprised of 13 weeks.
| | | | | | | | |
| (in % of total) | | 1st Quarter | | 2nd Quarter | | 3rd Quarter | | 4th Quarter |
Fiscal 2010 | | | | | | | | |
Sales | | 21.8% | | 24.2% | | 24.9% | | 29.0% |
Gross Margin | | 20.6% | | 22.8% | | 24.5% | | 32.1% |
Marketing
We have generated rapid growth without significant expenditures on marketing and promotions. We believe that this is primarily due to our strong brand name and success at selecting store locations with high traffic and ease of accessibility. Given our everyday low price points, there are generally no sales or markdowns to advertise.
Advertising is employed almost exclusively for new store openings. We promote new store openings using a selection of media, which may include radio, local newspapers, circulars, and television. A new store advertising campaign may last from two to six weeks, depending on the store location.
Competition
The Canadian dollar store industry is highly fragmented with many privately owned multi-outlet chains as well as independently-operated dollar stores. In addition to Dollarama, the largest multi-outlet dollar stores include Buck or Two, Dollar Giant, dollar store With More, Everything For a Dollar and Great Canadian dollar store. This group, including Dollarama, on a combined basis, operates more than 1,000 stores across Canada. Most of our multi-outlet competitors are franchise operations with significantly lower store counts than Dollarama, and four out of the five have reduced their total store count since January 2004.
17
The following chart illustrates our current store count compared to our competitors’ store count in Canada as of January 31, 2010:

These multi-outlet chain competitors, as a group, (i) have a much less significant market share than ours in our core markets of Ontario and Québec, where we have our highest rates of per capita store penetration, (ii) maintain a strong market share in the Western Provinces, a geographic area in which we seek to continue to increase our presence, and (iii) have a similar market share to ours in the Atlantic Provinces.
We face competition in both the acquisition of inventory and sale of merchandise from multi-price dollar stores, variety and discount stores and mass merchants. See “Risk Factors – Competition in the retail industry”.
Intellectual Property
We rely on trademark laws to protect certain aspects of our business. Our registered trademarks in Canada include the following: Dollarama®, Duramax®, Richard®, Make it Special®, Gryphonware®, Stitch-It®, Medi Care & Globe Design®, Static Matic®, Frameworks & Design®, Dollarama Halfmoon & Design®, Dollarama Banner & Design®, Studio Media & Design®, Terrifik®, Dollarama Polygon Design®, Sparkle N’ Shine®, Dr. Bob®, Dollarama Banner Design (2007)®, E-Z Reach®, Studio & Design®, Flow-Rite®, Snaptite & design®, Hercules®, Dollarama Plus™, Dollarama $1 Plus Halfmoon Design®, Dollarama $1 Plus Banner Design®, Electra & Design®, Rama Design & Logo®, Proauto & Desgin®, and we have a number of applications pending to register other trademarks in Canada including for $1 Plus Polygone Design™ and Dollarama $1 Plus Polygone Design™. We also rely on a combination of unregistered trademark rights to protect our position as a branded company with strong name recognition.
Monitoring the unauthorized use of our intellectual property is difficult, and the steps we have taken, including sending demand letters and taking actions against third parties, may not prevent unauthorized use by others. The failure to adequately build, maintain and enforce our intellectual property portfolio could impair the strength of our brands.
18
C. Organizational structure.
Corporate Structure
The chart below summarizes our ownership and corporate structure:
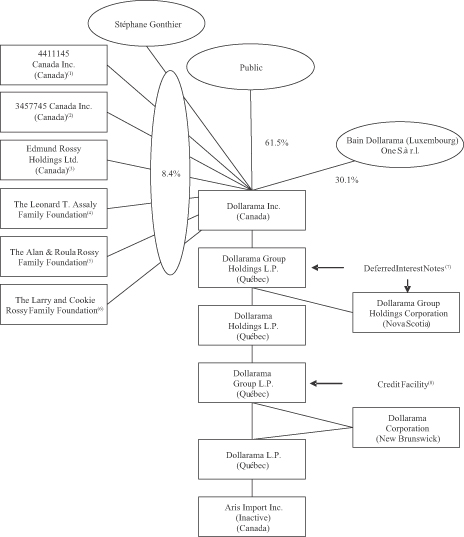
| (1) | An entity controlled by Larry Rossy. |
| (2) | An entity controlled by Leonard Assaly. |
| (3) | An entity controlled by Alan Rossy. |
| (4) | The Leonard T. Assaly Family Foundation is a not-for-profit corporation of which Leonard Assaly is a member and director. |
| (5) | The Alan & Roula Rossy Family Foundation is a not-for-profit corporation of which Alan Rossy is a member and director. |
| (6) | The Larry and Cookie Rossy Family Foundation is a not-for-profit corporation of which Larry Rossy is a member and director. |
| (7) | For a description of the Deferred Interest Notes, see “Item 5. Operating and Financial Review and Prospects –Debt and Commitments – Deferred Interest Notes”. |
| (8) | For a description of the Credit Facility, see “Item 5. Operating and Financial Review and Prospects – Debt and Commitments – Credit Facility”. |
19
D. Property, plant and equipment.
Our capital expenditures for property, plant, and equipment amounted to $33.8 million for Fiscal 2010, compared to $40.5 million and $46.0 for Fiscal 2009 and Fiscal 2008, respectively. The decrease in capital expenditures in Fiscal 2010 was mainly due to fewer store openings, lower capital requirements associated with our newly-constructed and leased head-office and warehouse and lower capital requirements for information systems.
Stores
Store Locations and Site Selection
We carefully manage our real estate portfolio with the goal of maximizing chain-wide store profitability and maintaining a disciplined, cost-sensitive approach to store site selection. We evaluate potential store locations based on a variety of criteria, including (i) the level of retail activity and traffic patterns, (ii) the presence or absence of competitors, (iii) the population and demographics of the area, (iv) the total rent and occupancy cost per square foot, and (v) the location of existing Dollarama stores. Nearly all of our stores are located in high-traffic areas such as strip malls and shopping centers, where our management believes customers are likely to do their household shopping. We open stores in various locations, including metropolitan areas, mid-sized cities and small towns. We believe that our stores attract customers from a relatively small shopping radius, which allows us to profitably operate multiple stores in all markets across Canada. We believe that we can continue to profitably open stores in markets across Canada, including in areas where our store density is the highest, such as in Québec. Our ability to open new stores is dependent upon, among other factors, locating suitable sites and negotiating favorable lease terms.
As of January 31, 2010, we operated 603 stores in all Canadian provinces as detailed below:
| | | | | | | | |
Alberta | | 40 | | | | Nova Scotia | | 24 |
British Columbia | | 19 | | | | Ontario | | 237 |
Manitoba | | 22 | | | | Prince Edward Island | | 3 |
New Brunswick | | 27 | | | | Québec | | 209 |
Newfoundland and Labrador | | 8 | | | | Saskatchewan | | 14 |
With the exception of 18 of our stores that we lease at market rates from entities controlled by Larry Rossy, our remaining store locations are leased from a wide variety of third parties. See “Item 7B. Related Party Transactions.” We expect to continue to lease store locations as we expand. The average length of our leases is 11.3 years, and the average time to their expiration is 5.5 years. As current leases expire, we believe that we will be able either to obtain lease renewals, if desired, for present store locations, or to obtain leases for equivalent or better locations in the same general area. To date, we have not experienced difficulty in either renewing leases for existing locations or securing suitable leases for new stores. We believe that this leasing strategy enhances our flexibility to pursue various expansion and relocation opportunities resulting from changing market conditions.
Store Size and Condition
We offer a well-designed, convenient and consistent store format. Our average store size has increased over the past twelve fiscal years from 5,272 square feet in 1998 to 9,806 square feet as of January 31, 2010 (of which between 80% and 85% is available selling square footage), with new stores opened in Fiscal 2010 averaging approximately 9,800 square feet.
Nearly two-thirds of our store base has been opened, expanded, renovated or relocated within the last six fiscal years. We have spent an average of approximately $3.3 million annually on store renovations (including expansions) in each of the past three fiscal years. We believe that our current store network is in good condition and does not require material maintenance capital expenditures.
New Store Payback
Our expansion model is characterized by low capital investment to open stores, rapid sales increases after opening, consistent sales volumes and low ongoing operating costs (including low maintenance capital expenditure requirements), which together result in an attractive return on investment. A new Dollarama store requires a minimal initial investment, typically $0.6 million, including $0.4 million for capital expenditures and $0.2 million for inventory. Our stores generate on average $1.8 million in sales in the first year of operation, and achieve an average capital payback period of less than two years. Our model has been effective in both rural and small communities as well as in more densely populated and metropolitan areas that typically include a larger number of competitors.
20
Customer Payment Methods
We currently accept cash and PIN-based debit cards in all of our stores. The debit card penetration rate in our stores has continually increased since its implementation, with debit card transactions representing approximately 30% of sales in Fiscal 2010. The average transaction size for debit card sales in our stores is currently approximately 2.5 times greater than the average transaction size for cash sales. In addition, we are currently testing the acceptance of credit cards under a pilot project in a limited number of our stores.
Warehousing and Distribution
Our warehouse and distribution facilities consist of four warehouses and a distribution center, all five of which are owned by entities controlled by Larry Rossy. See “Item 7B. Related Party Transactions”. The five sites are subject to long-term lease agreements. The table below describes our warehouse and distribution facilities.
| | | | | | |
Locations | | Type | | Size | | Lease Expiration |
| Dorval, Québec | | Warehouse | | 269,950 square feet | | November 30, 2024 |
| Lachine, Québec | | Warehouse | | 356,675 square feet | | November 30, 2024 |
| Town of Mount Royal, Québec | | Warehouse | | 128,838 square feet | | November 30, 2024 |
| Town of Mount Royal, Québec | | Distribution Center | | 292,623 square feet | | November 30, 2024 |
| Town of Mount Royal, Québec | | Warehouse | | 325,000 square feet | | November 30, 2024 |
Our four warehouses are primarily used to store goods directly imported from overseas, while most domestic goods sourced from North American vendors are delivered directly to the distribution center (excluding products delivered directly to the stores). We warehouse approximately 62% of our merchandise in our four warehouses and distribute approximately 89% of our merchandise through the distribution center. The merchandise is then transported to our stores by outside contractors. The remaining 11% of our merchandise is shipped by the suppliers directly to the stores. An example of items shipped directly to stores by our suppliers is greeting cards. Of the suppliers that ship directly to our stores, a limited number (such as some soft drink and greeting card suppliers) also work together with the store manager to manage inventory for the store.
We opened a new distribution center in the fiscal year ended February 4, 2007 and a new warehouse/corporate office in the fiscal year ended February 3, 2008, which increased our warehouse capacity by approximately 325,000 square feet, Our current needs are serviced on single shifts at the distribution center and warehouses, allowing for future capacity increase.
Warehouse inventory procurement is managed using standard demand forecasting and inventory planning methods based on historical demand. Products are distributed from our four warehouses through our distribution facility. We continuously strive to enhance our forecasting, inventory planning, safety stock and lead time management processes and tools. Store replenishment requirements are determined based on actual store sales.
Our aggregate warehouse and distribution center staffing needs are principally outsourced to third party agencies.
| Item 4A. | UNRESOLVED STAFF COMMENTS |
Not applicable.
| Item 5. | OPERATING AND FINANCIAL REVIEW AND PROSPECTS |
The following discussion and analysis of our financial condition and results of operations should be read in conjunction with our audited Consolidated Financial Statements and notes thereto appearing in this annual report.
Our functional and reporting currency is the Canadian dollar. Financial data has been prepared in conformity with Canadian GAAP. Certain measures used in this discussion and analysis do not have any standardized meaning under Canadian GAAP. When used, these measures are defined in such terms as to allow the reconciliation to the closest Canadian GAAP measure. It is unlikely that these measures could be compared to similar measures presented by other companies.
Basis of Presentation
Our Consolidated Financial Statements were prepared in accordance with Canadian GAAP, which differs in certain significant respects from U.S. GAAP. There were no material differences between Canadian GAAP and U.S. GAAP in our Consolidated Financial Statements for the year ended January 31, 2010. You may refer to Note 17 of the Consolidated Financial Statements under Item 18 for the reconciliation of the material differences between Canadian GAAP and U.S. GAAP for Fiscal 2010, Fiscal 2009 and Fiscal 2008. Holdings was created in December 2006.
21
Accounting Periods
On February 1, 2007, we changed our fiscal year end from January 31 to February 4, 2007 and to a floating year ending on the Sunday closest to January 31 for all subsequent fiscal years. We decided to change the year end date of our fiscal year 2007 to February 4, 2007 even though it is not the Sunday closest to January 31 because as is traditional with the retail calendar, every 5 to 6 years, a week is added to the retail calendar. The week ended February 4, 2007 is therefore equivalent to our 53rd week in the retail calendar, leaving the 53rd week year behind us and the rest of our fiscal year end dates to fall on the Sunday closest to January 31. There are five less days of transaction included in Fiscal 2008 when compared with fiscal year ended February 4, 2007.
Recent Developments
On January 5, 2010, John J. Swidler was appointed as an independent director and chair of the audit committee of the board of directors of the general partner of Holdings (the “Board of Directors”). Mr. Swidler replaced Felipe Merry del Val Barbavara de Gravellona on the Board of Directors and Gregory David on the audit committee. Stephen Gunn remained on the audit committee.
On January 28, 2010, Dollarama Inc. completed a bought deal secondary offering along with the concurrent closing of the over-allotment option pursuant to which certain shareholders sold an aggregate of 13,150,000 Common Shares to RBC Dominion Securities Inc., CIBC World Markets Inc., Credit Suisse Securities (Canada), Inc., Scotia Capital Inc., Barclays Capital Canada Inc., National Bank Financial Inc., Desjardins Securities Inc., HSBC Securities (Canada) Inc. and Raymond James Ltd., as the underwriters at a price of $21.50 per share resulting in gross proceeds to the selling shareholders of approximately $282,725,000 in the aggregate.
On February 17, 2010, Mr. Donald Gray Reid was appointed as a director and a member of the audit committee of the Board of Directors effective as of such date. Mr. Reid replaced Mr. Todd Cook on the Board of Directors and the audit committee of the Board of Directors.
As at the date hereof, the Board of Directors is composed of Messrs. Larry Rossy (Chair), Joshua Bekenstein, Gregory David, Stephen Gunn, Matthew Levin, Nicholas Nomicos, Donald Gray Reid, Neil Rossy and John J. Swidler and the audit committee is composed of Messrs. Stephen Gunn, Donald Gray Reid and John J. Swidler (Chair).
As announced by the Partnership on March 18, 2010, Mr. Michael Ross, CA, was appointed as the new Chief Financial Officer and Secretary of the Partnership effective as of April 12, 2010. Mr. Ross replaces Mr. Nicholas Nomicos who resigned from his position as Senior Vice President, Interim Chief Financial Officer and Secretary of the Partnership effective as of April 12, 2010. Mr. Nomicos remains a member of the Board of Directors.
On April 28, 2010, Dollarama Inc. completed a bought deal secondary offering along with the concurrent closing of the over-allotment option pursuant to which certain shareholders sold an aggregate of 11,689,750 Common Shares to RBC Dominion Securities Inc., CIBC World Markets Inc., Credit Suisse Securities (Canada), Inc., Scotia Capital Inc., National Bank Financial Inc., Barclays Capital Canada Inc., Desjardins Securities Inc., HSBC Securities (Canada) Inc., and Raymond James Ltd. at a price of $24.60 per share resulting in gross proceeds to the selling shareholders of approximately $287,567,850 in the aggregate.
Key Items in Fiscal 2010
| | • | | Proceeds from Dollarama Inc.’s $300.0 million IPO were used to repay the term loan A outstanding pursuant to the Credit Facility and to redeem the 8.875% Subordinated Notes due 2010 (the “8.875% Subordinated Notes”) on November 17, 2009. |
| | • | | Sales increased 15.1% in Fiscal 2010 over the prior fiscal year driven by the opening of 41 new stores (offset by the temporary closure of two stores) and a 7.9% increase in comparable store sales in the current fiscal year. Comparable store sales growth consisted of a 2.3% increase in the number of transactions and a 5.4% increase in the average transaction size. |
| | • | | Net earnings increased $100.1 million in Fiscal 2010 compared to Fiscal 2009. This growth was driven mainly by sales growth, higher gross margin and a foreign exchange gain on our outstanding Deferred Interest Notes, which were not hedged during these periods. |
Factors Affecting Our Results of Operations
Sales
We recognize sales at the time the customer tenders payment for and takes possession of the merchandise. All sales are final. Our sales consist of comparable store sales and new store sales. Comparable store sales is a measure of the percentage increase or decrease of the sales of stores open for at least 13 complete fiscal months relative to the same period in the prior year. In Fiscal 2008,
22
we revised our method for determining the stores that are included in the comparable store sales calculation. Beginning with the fourth quarter of Fiscal 2008, we provided the comparable store sales calculation for the stores that have been open at least 13 complete fiscal months and remain open at the end of the period. Previously, the comparable store sales calculation included only stores that had been open at least 13 complete fiscal months, that remain open at the end of the period and that were open for the entire previous year comparable period.
We include sales from expanded stores and relocated stores in comparable store sales. The primary drivers of comparable store sales performance are changes in number of transactions and average transaction size. To increase comparable store sales, we focus on offering a wide selection of high-quality merchandise at attractive values in well designed, consistent and convenient store formats.
We have historically experienced limited seasonal fluctuations in sales and expect this trend to continue. We generated 29.0% of our sales of Fiscal 2010 during the fourth quarter due to the Christmas selling season.
Our sales are adversely affected by inflation and other adverse economic developments that affect the level of consumer spending in Canada where we sell our merchandise.
Cost of Sales
Our cost of sales consist mainly of merchandise inventory and transportation costs (which are variable and proportional to our sales volume), store occupancy costs and warehouse and distribution center operating costs. We record vendor rebates consisting of volume purchase rebates, when earned. The rebates are recorded as a reduction of inventory purchases at cost, which has the effect of reducing cost of sales. In the past, as a single fixed-price point dollar store, increases in operating and merchandise costs could negatively impact our operating results because we were not able to pass on cost increases to our customers. Redesigning direct sourced products was the only means to mitigate the impact of increasing unit costs. Although cost increases could still negatively impact our business, with our new multiple price point product offering introduced effective February 2009, we now have greater flexibility to react to cost increases on a timely basis. We have historically reduced our cost of sales by shifting more of our sourcing to low-cost foreign suppliers. For Fiscal 2010, direct overseas sourcing was 53.4% of our purchases compared to 50.4% for the same period in the prior year. While we still source a majority of our overseas products from China, we have been steadily increasing our purchases from other overseas suppliers in the last two fiscal years, including goods sourced directly from Brazil, India, Indonesia, Taiwan, Thailand and Turkey. As a result, our cost of sales is impacted by the fluctuation of foreign currencies against the Canadian dollar. In particular, we purchase a majority of our imported merchandise from suppliers in China using U.S. dollars. Therefore, our cost of sales is impacted by the fluctuation of the Chinese renminbi against the U.S. dollar and the fluctuation of the U.S. dollar against the Canadian dollar.
While we enter into foreign exchange forward contracts to hedge a significant portion of our exposure to fluctuations in the value of the U.S. dollar against the Canadian dollar, we do not hedge our exposure to fluctuations in the value of the Chinese renminbi against the U.S. dollar.
Shipping and transportation costs are also a significant component of our cost of sales. When fuel costs increase, shipping and transportation costs increase because the carriers generally pass on such cost increases to the users. Because of the high volatility of fuel costs, it is difficult to forecast the fuel surcharges we may incur from our contract carriers as compared to past quarters.
Our occupancy costs are driven by our base rent expense. We believe that we are generally able to negotiate leases at attractive market rates due to the increased consumer traffic which our stores usually generate in strip malls and shopping centers. We typically enter into leases with base terms of ten years and options to renew for one or more periods of five years each.
General, Administrative and Store Operating Expenses
Our general, administrative and store operating expenses (“SG&A”) consist of store labor (which is primarily variable and proportional to store sales volume) and store maintenance costs, salaries and related benefits of corporate and field management team members, administrative office expenses, professional fees and other related expenses, all of which are primarily fixed. Although our average hourly wage rate is higher than the minimum wage, an increase in the mandated minimum wage could significantly increase our payroll costs unless we realize offsetting productivity gains and cost reductions. We expect our administrative costs to increase as we build our infrastructure to effectively meet the needs generated by the growth of the Partnership. Since November 2, 2009, SG&A no longer include annual management fees of $3.0 million payable to Bain Capital pursuant to its management agreement. This management agreement was terminated in connection with the consummation of our parent’s IPO during the third quarter of Fiscal 2010. A one-time fee of $5.0 million was paid to Bain Capital in connection with such termination.
Merchandising Strategy
As part of our ongoing effort to offer more value and higher quality goods to our customers, on February 2, 2009, we began offering in all our stores an additional assortment of products priced between $1.00 and $2.00. While the majority of products continue to be priced at $1.00, offering products at fixed price points up to $2.00 has expanded our merchandise selection with new items across most categories.
23
Economic or Industry-wide Factors Affecting the Partnership
We operate in the value retail industry, which is highly competitive with respect to price, store location, merchandise quality, assortment and presentation, in-stock consistency, and customer service. We compete with other dollar stores, variety and discount stores and mass merchants operating in Canada. These other retail companies operate stores in many of the areas where we operate and many of them engage in extensive advertising and marketing efforts. Additionally, we compete with a number of companies for prime retail site locations, as well as in attracting and retaining quality employees. We, along with other retail companies, expect continuing pressure resulting from a number of factors including, but not limited to: merchandise costs, recession and instability in the global economy, consumer debt levels and buying patterns, adverse economic conditions, interest rates, market volatility, customer preferences, unemployment, labor costs, inflation, currency exchange fluctuations, fuel prices, weather patterns, catastrophic events, competitive pressures and insurance costs. Due to current economic conditions, consumer spending could decline because of economic pressures, including unemployment. Reductions in consumer confidence and spending could have an adverse effect on our sales.
Effects of Inflation
The Partnership experienced material increases in vendor prices, labor, energy, transportation and fuel costs during Fiscal 2010, which we believe was mainly due to inflation. Continued increases in such costs could adversely impact the Partnership’s operating results. We believe that inflation also had an impact on its overall operations during Fiscal 2009 and Fiscal 2008.
Critical Accounting Policies and Estimates
In preparing our financial statements, management is required to make estimates and assumptions that affect the reported amounts of assets and liabilities, the disclosure of contingent assets and liabilities at the date of the financial statements and reported amounts of revenues and expenses during the period. We evaluate our estimates on an ongoing basis, based on historical experience and various other assumptions that we believe to be reasonable under the circumstances. Actual results may differ from these estimates.
Valuation of Merchandise Inventories
The valuation of store merchandise inventories is determined by the retail inventory method valued at the lower of cost (weighted-average) or net realizable value. Under the retail inventory method, merchandise inventories are converted to a cost basis by applying an average cost to selling ratio. Merchandise inventories that are at the distribution center or at our warehouses and inventories that are in-transit from suppliers, are stated at the lower of cost and net realizable value, determined on a weighted-average cost basis. Merchandise inventories include items that have been marked down to management’s best estimate of their net realizable value and are included in cost of sales in the period in which the markdown is determined. We estimate our markdown reserve based on the consideration of a variety of factors, including but not limited to quantities of slow-moving or carryover seasonal merchandise on hand, historical markdown statistics and future merchandising plans. The accuracy of our estimates can be affected by many factors, some of which are outside of our control, including changes in economic conditions and consumer buying trends. Historically, we have not experienced significant differences in our estimates of markdowns compared with actual results.
Property and Equipment
Property and equipment are carried at cost. Property and equipment are amortized over the estimated useful lives of the respective assets as follows: (i) on the declining balance method, computer equipment and vehicles at 30%; and (ii) on the straight-line method, store and warehouse equipment at eight to ten years, computer software at five years and leasehold improvements at the terms of the leases. Property and equipment are reviewed for impairment whenever events or changes in circumstances indicate that the carrying value of an asset might not be recoverable.
Goodwill and Trade Name
Goodwill and trade name are not subject to amortization and are tested for impairment annually or more frequently if events or circumstances indicate that the assets might be impaired. Impairment is identified by comparing the fair value of the reporting unit to which it relates to its carrying value. To the extent the reporting unit’s carrying amount exceeds its fair value, we measure the amount of impairment in a manner similar to that of a purchase price allocation, and any excess of carrying amount over the implied fair value of goodwill is charged to earnings in the period in which the impairment is determined. Future events could cause us to conclude that impairment indicators exist and that goodwill associated with our business is impaired. Any resulting impairment would be charged to net earnings.
24
Impairment of Long-Lived Assets
Long-lived assets are reviewed for impairment whenever events or changes in circumstances indicate that the carrying amount of an asset may not be recoverable. Factors that we believe could trigger an impairment review include, but are not limited to, significant negative industry or economic trends and current, historical or projected losses that demonstrate continuing losses. Impairment is assessed by comparing the carrying amount of an asset with the expected future net undiscounted cash flows from its use together with its residual value. If such assets are considered to be impaired, the impairment to be recognized is measured by the amount by which the carrying amount of the assets exceeds their fair value. The estimates regarding their fair value include assumptions about future conditions relating to our business, as well as the industry. If actual cash flows differ from those projected by management, additional write-offs may be required.
Operating Leases
We recognize rental expense and inducements received from landlords on a straight-line basis over the term of the leases. Any difference between the calculated expense and the amounts actually paid is reflected as deferred lease inducements on our balance sheet.
Financial Instruments
Fair market value
We estimate the fair market value of our financial instruments based on current interest rates, foreign currency exchange rate, credit risk, market value and current pricing of financial instruments with similar terms. Unless otherwise disclosed herein, the carrying value of these financial instruments, especially those with current maturities such as cash and cash equivalents, accounts receivable, deposits, accounts payable and accrued expenses, approximates their fair market value.
Hedging
We use derivative financial instruments in the management of our foreign currency and interest rate exposures. When hedge accounting is used, we document relationships between hedging instruments and hedged items, as well as our risk management objective and strategy for undertaking various hedge transactions. This process includes linking derivatives to specific assets and liabilities on the balance sheet or to specific firm commitments or forecasted transactions. We also assess whether the derivatives that are used in hedging transactions are effective in offsetting changes in cash flows of hedged items.
Foreign exchange risks
We have significant cash flows and long-term debt denominated in U.S. dollars. We use foreign exchange forward contracts and foreign currency swap agreements to mitigate risks from fluctuations in exchange rates. Forward contracts and foreign currency swap agreements are used for risk management purposes and are designated as hedges of specific anticipated purchases.
Interest risks
Our interest rate risk is primarily in relation to our floating rate borrowings. We have entered into some swap agreements to exchange U.S. dollar denominated floating rate debt to Canadian dollar denominated floating rate debt.
Others
In the event a derivative financial instrument designated as a cash flow hedge is terminated or ceases to be effective prior to maturity, related realized and unrealized gains or losses are deferred under accumulated other comprehensive income (loss) and recognized in earnings in the period in which the underlying original hedged transaction is recognized. In the event a designated hedged item is sold, extinguished or matures prior to the termination of the related derivative financial instrument, any realized or unrealized gain or loss on such derivative financial instrument is recognized in earnings.
Derivative financial instruments which are not designated as hedges or have ceased to be effective prior to maturity are recorded at their estimated fair values under current assets or liabilities with changes in their estimated fair values recorded in earnings. Estimated fair value is determined using pricing models incorporating current market prices and the contractual prices of the underlying instruments, the time value of money and yield curves.
For a complete description of the financial instruments of the Partnership, please see Note 9 to our Consolidated Financial Statements.
25
Results of Operations
The following table sets forth the major components of Holdings’ consolidated statements of earnings, expressed as a percentage of sales, for the periods indicated:
| | | | | | | | | |
| | | Year Ended
January 31,
2010 | | | Year Ended
February 1,
2009 | | | Year Ended
February 3,
2008 | |
Statements of Earnings Data: | | | | | | | | | |
Sales | | 100.0 | % | | 100.0 | % | | 100.0 | % |
Cost of sales | | 64.7 | % | | 66.5 | % | | 66.2 | % |
General, administrative and store operating expenses | | 20.9 | % | | 19.6 | % | | 18.9 | % |
Amortization | | 2.0 | % | | 2.0 | % | | 1.9 | % |
Interest expense | | 5.0 | % | | 5.6 | % | | 7.4 | % |
Foreign exchange loss (gain) on derivative financial instruments and long-term debt | | (2.5 | )% | | 4.1 | % | | (3.5 | )% |
Income taxes | | 0.0 | % | | 0.0 | % | | 0.0 | % |
| | | | | | | | | |
Net earnings | | 9.9 | % | | 2.2 | % | | 9.1 | % |
| | | | | | | | | |
Fiscal Year Ended January 31, 2010 Compared to Fiscal Year Ended February 1, 2009
Sales
For Fiscal 2010, we recorded sales of $1,253.7 million, a 15.1% increase over the prior year. Comparable store sales rose 7.9%, driven by a 2.3% increase in number of transactions and a 5.4% increase in average transaction size.
On February 2, 2009, we introduced our new selection of items at price points of $1.25, $1.50 and $2.00. This introduction was made progressively in the first quarter and the vast majority of our products is still sold at $1.00. We believe the introduction of new price points has positively impacted our sales and resulted in both an improved number of transactions and higher average transaction size. Our total store square footage increased 7.3% from 5.5 million at February 1, 2009 to 5.9 million at January 31, 2010.
Cost of Sales
Our cost of sales increased $86.5 million, or 11.9%, from $724.2 million for Fiscal 2009, to $810.6 million for Fiscal 2010. Our gross margin increased to 35.3% of sales as compared to 33.5% of sales for the prior fiscal year, driven by improved product margins associated with the introduction of our multiple price-point strategy and net productivity improvements in distribution and logistics costs.
General, Administrative and Store Operating Expenses
SG&A increased $49.7 million, or 23.4%, from $212.8 million for Fiscal 2009, to $262.5 million for Fiscal 2010 due to the opening of 39 net new stores since the end of Fiscal 2009, increases in store wage rates, the full-year impact of central infrastructure costs added during Fiscal 2009 and the incurrence in Fiscal 2010 of approximately $13.6 million of non-recurring expenses. These non-recurring charges include a $5.0 million fee paid in connection with the termination of our management agreement with Bain Capital, $2.2 million management fees paid to Bain Capital pursuant to such management agreement and prior to such termination, stock compensation expense of approximately $4.9 million triggered by Dollarama Inc.’s IPO-related expenses, and severance charges of $1.5 million. Non-recurring charges incurred during Fiscal 2009 consisted of $3.0 million management fees paid to Bain Capital described above.
Amortization
Amortization expense increased $3.1 million, from $21.8 million for Fiscal 2009, to $24.9 million for Fiscal 2010 due to new store openings.
Interest Expense on Long-term Debt
Interest expense increased $1.2 million, from $61.2 million for Fiscal 2009, to $62.3 million for Fiscal 2010 due primarily to $13.8 million of non-recurring interest expense associated with the early redemption of debt, partially offset by lower interest costs resulting from the lower outstanding debt balance and lower interest rates on our variable-rate debt. The non-recurring interest charges incurred during Fiscal 2010 include a $3.8 million write-off of debt issue costs associated with the term loan A of the Credit Facility and the 8.875% Subordinated Notes, and $10.0 million in debt repayment premium and expenses associated with the redemption of the 8.875% Subordinated Notes which occurred on November 17, 2009 (the “Redemption Date”).
26
Foreign Exchange Loss (Gain) on Derivative Financial Instruments and Long-Term Debt
Foreign exchange gain on derivative financial instruments and long-term debt increased $75.9 million, from a $44.8 million loss for Fiscal 2009, to a $31.1 million gain for Fiscal 2010 due mainly to the impact of the strengthening of the Canadian dollar relative to the U.S. dollar on our Deferred Interest Notes, which were not hedged for most of the year. The $44.8 million foreign exchange loss on derivative financial instruments and long-term debt in Fiscal 2009 was due primarily to the impact of the weakening of the Canadian dollar relative to the U.S. dollar on our Deferred Interest Notes which were not hedged during Fiscal 2009.
Provision for Income Taxes
Income tax expense increased $0.1 million from $0.2 million in Fiscal 2009 to $0.3 million in Fiscal 2010. Net earnings for Fiscal 2010 and Fiscal 2009 constitute income of Holdings’ partners and are therefore subject to income tax in their hands.
Net Earnings
Net earnings increased $100.1 million, from $24.0 million for Fiscal 2009 to $124.1 million for Fiscal 2010. The increase in net earnings was driven mainly by sales growth, higher gross margin dollars, and a foreign exchange gain on our outstanding Deferred Interest Notes, which were not hedged during these periods until November 2009.
Fiscal Year Ended February 1, 2009 Compared to Fiscal Year Ended February 3, 2008
Sales
Our sales increased $116.7 million, or 12.0%, from $972.4 million for Fiscal 2008, to $1,089.0 million for Fiscal 2009. Comparable store sales increased 3.4% during Fiscal 2009, representing an increase of approximately $10.5 million. The Comparable store sales increase was driven by a 3.9% increase in the average transaction size, offset by a 0.5% decrease in the number of transactions. The remaining portion of the sales growth, or $106.2 million, was driven primarily by the incremental full period impact of the 61 stores opened (offset by the temporary closure of three stores) during Fiscal 2008 and the opening of 47 new stores (offset by the temporary closure of four stores) in Fiscal 2009. Our total store square footage increased 10.0% from 5.0 million at February 3, 2008 to 5.5 million at February 1, 2009.
Cost of Sales
Cost of sales increased by $80.6 million, or 12.5%, from $643.6 million for Fiscal 2008, to $724.2 million for Fiscal 2009. Our gross margin decreased to 33.5% in Fiscal 2009 from 33.8% in Fiscal 2008 due primarily to higher transportation costs.
General, Administrative and Store Operating Expenses
SG&A increased $29.2 million, or 15.9%, from $183.6 million for Fiscal 2008, to $212.8 million for Fiscal 2009. This increase was primarily due to an increase in store labor costs due to the increased number of stores in operation and from minimum wage increases. SG&A to support our store network expansion also increased. As a percentage of sales our SG&A increased from 18.9% for Fiscal 2008 to 19.5% for Fiscal 2009.
Amortization
Amortization expense increased $3.4 million, from $18.4 million for Fiscal 2008 to $21.8 million for Fiscal 2009. This increase was due to the amortization of property and equipment resulting from the new store openings and the amortization of capitalized software costs associated with our new enterprise-wide software system.
Interest Expense on Long-term Debt
Interest expense decreased $10.9 million from $72.1 million for Fiscal 2008, to $61.2 million for Fiscal 2009, which reflects the reduced debt outstanding and lower interest rates on variable-rate debt, partially offset by the impact of stronger U.S. dollar relative to the Canadian dollar. Average rates for translating U.S. dollars into Canadian dollars were 1.0850 for Fiscal 2009 and 1.0603 for Fiscal 2008.
Foreign Exchange Gain/Loss on Derivative Financial Instruments and Long-Term Debt
Foreign exchange loss on derivative financial instruments and long-term debt increased $79.2 million from a $34.4 million gain for Fiscal 2008, to a $44.8 million loss for Fiscal 2009, due mainly to the impact of the strengthening of the U.S. dollar relative to the Canadian dollar on the Deferred Interest Notes which were unhedged during these periods.
27
Income Taxes
Income tax expense decreased $0.1 million from $0.3 million in Fiscal 2008 to $0.2 million in Fiscal 2009. Net earnings for Fiscal 2008 and Fiscal 2009, constitute income of our partners and are therefore subject to income tax in their hands.
Net Earnings
Net earnings decreased $64.9 million from $88.9 million for Fiscal 2008 to $24.0 million for Fiscal 2009 as operating income growth in Fiscal 2009 as compared to Fiscal 2008 was more than offset by an unfavourable $79.2 million swing in foreign exchange loss on derivative financial instruments and long-term debt from Fiscal 2008 to Fiscal 2009 due to the impact of the strengthening of the U.S. dollar relative to the Canadian dollar on the Deferred Interest Notes which were unhedged during these periods.
Liquidity and Capital Resources
Cash Flows
The following table summarizes the statement of cash flows of Holdings:
| | | | | | | | | | | | |
(dollars in thousands) | | Year Ended
January 31,
2010 | | | Year Ended
February 1,
2009 | | | Year Ended
February 3,
2008 | |
Net cash provided by operating activities | | $ | 126,184 | | | $ | 117,087 | | | $ | 56,175 | |
Net cash used in investing activities | | | (40,091 | ) | | | (49,728 | ) | | | (45,562 | ) |
Net cash used in financing activities | | | (59,440 | ) | | | (27,432 | ) | | | (32,102 | ) |
| | | | | | | | | | | | |
Net increase (decrease) in cash and cash equivalents | | | 26,653 | | | | 39,927 | | | | (21,489 | ) |
Cash and cash equivalents, beginning of period | | | 66,141 | | | | 26,214 | | | | 47,703 | |
| | | | | | | | | | | | |
Cash and cash equivalents, end of period | | $ | 92,794 | | | $ | 66,141 | | | $ | 26,214 | |
| | | | | | | | | | | | |
Cash Flows from Operating Activities
Cash flows provided by operating activities for Fiscal 2010 increased to $126.2 million as compared to $117.1 million in Fiscal 2009 driven by a $14.5 million reduction in working capital in Fiscal 2010 as compared to an increase of $17.3 million in working capital in Fiscal 2009. The change in working capital trend was driven by a reduction in Fiscal 2010 of merchandise inventory accumulated in the prior year in advance of the launch of our multiple price point merchandise offering.
Cash flows provided by operating activities for Fiscal 2009 increased to $117.1 million as compared to $56.2 million in Fiscal 2008 driven mainly by (i) reduced interest expenses combined with the deferral of cash interest payments on our Deferred Interest Notes, (ii) decreased working capital due mainly to increased earnings, and decreased working capital requirements. Cash flow from operating activities decreased $15.4 million during Fiscal 2008 primarily due to increased requirements for working capital and losses on settlements of foreign exchange contracts for which the hedged item was still in the balance sheet ($8.3 million), offset by a decrease in interest expense.
Cash Flows from Investing Activities
During Fiscal 2010, cash used for investing activities decreased to $40.1 million from $49.7 million in Fiscal 2009. Purchases of property and equipment of $33.7 million were lower by $6.7 million in Fiscal 2010 due mainly to fewer new store openings and lower capital requirements for our information systems. There were 41 stores opened (offset by the temporary closure of two stores) in Fiscal 2010 compared to 47 stores opened (offset by the temporary closure of four stores) in Fiscal 2009. In Fiscal 2010 the Partnership incurred a $6.4 million loss on early settlement of a derivative financial instrument associated with the modification of a swap agreement to mitigate better the foreign currency risk associated with the outstanding debt following the redemption of the 8.875% Subordinated Notes on November 17, 2009, as compared to a $9.4 million loss incurred in Fiscal 2009 driven by the settlement of a foreign currency swap agreement used to mitigate the foreign exchange risk associated with our previously outstanding 8.875% Subordinated Notes.
During Fiscal 2009, cash used for investing activities was $49.7 million compared to $45.6 million for Fiscal 2008. Purchases of property and equipment during Fiscal 2009 were lower by $5.5 million compared to Fiscal 2008 primarily due to fewer store openings of 47 stores and (offset by the temporary closure of four stores) as compared with 61 stores (offset by the temporary closure of three stores in Fiscal 2008. There was also a settlement of $9.4 million for foreign currency swap agreements used to mitigate foreign exchange risk associated with the capital and interest payment of our 8.875% Subordinated Notes in Fiscal 2009.
Cash Flows from Financing Activities
During Fiscal 2010, cash used by financing activities was $59.4 million. The net proceeds of $204.7 million due to the issuance of partnership units (in conjunction with parent company’s IPO), together with working capital were used to repay the 8.875% Subordinated Notes, $53.2 million of the principal amount on the term loan A of the Credit Facility, and $2.7 million quarterly scheduled principal repayments of the term loan B of the Credit Facility.
28
During Fiscal 2009 cash used by financing activities was $27.4 million and included mainly $18.0 million of scheduled quarterly principal repayments on the term loan A of the Credit Facility, a $6.2 million mandatory payment due to the annual consolidated excess cash flows required under the terms of the term loan A of the Credit Facility and a $2.1 million scheduled quarterly principal repayment on the term loan B of the Credit Facility, $0.2 million of financing costs and slightly offset by $1.1 million of deemed interest on debt repayment.
Cash used for financing activities during Fiscal 2008 was $32.1 million. The Partnership made a payment of $15.6 million (U.S.$15.0 million) principal repayment on the Deferred Interest Notes, $12.1 million of scheduled quarterly principal repayments of the term loan A and the term loan B of the Credit Facility, $0.5 million of debt issue costs on the Deferred Interest Notes and $3.9 million capital distributions.
Liquidity
The Partnership has historically generated sufficient operating cash flow to fund its planned growth strategy and debt service requirements. Management anticipates this will continue to be the case given that over the previous three fiscal years, our new stores achieved an average capital payback period of less than two years on the total cash outlay (including capital expenditures and inventory) required to launch a new store. Further, as at January 31, 2010, the Partnership had $92.8 million of cash and cash equivalents on hand and an undrawn revolving credit facility of $73.7 million which provides further flexibility to meet any unanticipated cash requirements.
Capital Expenditures
Capital expenditures for Fiscal 2010 were $33.8 million, offset by tenant allowance of $3.6 million as compared to $40.5 million, offset by tenant allowances of $2.6 million for Fiscal 2009. The decreased capital spending in Fiscal 2010 was primarily due to fewer store openings and lower capital requirements for information systems and was slightly offset by increased spending associated with our broadened product offering introduced at the start of Fiscal 2010.
Capital expenditures for Fiscal 2009 were 40.5 million, offset by tenant allowances of $2.6 million as compared with $46.0 million, offset by tenant allowances of $3.8 million for Fiscal 2008. The decreased spending in Fiscal 2009 was primarily due to fewer store openings, less capital requirements associated with our move to newly-constructed and leased head-office and warehouse in the previous year and less capital requirements associated with the initial information systems. Although there was less spending on new stores, we continued to improve, expand, renovate and relocate existing stores and prepared our stores to offer an additional assortment of products that will be priced between $1.00 and $2.00.
Contractual Obligations
The following table summarizes our material contractual obligations (in thousands) as of January 31, 2010, including off-balance sheet arrangements and our commitments:
| | | | | | | | | | | | | | | | | | | | | |
Contractual obligations | | Total | | Year 1 | | Year 2 | | Year 3 | | Year 4 | | Year 5 | | Thereafter |
Lease financing | | | | | | | | | | | | | | | | | | | | | |
Operating lease obligations(1) | | $ | 567,599 | | $ | 75,514 | | $ | 70,567 | | $ | 65,635 | | $ | 61,072 | | $ | 56,227 | | $ | 238,584 |
| | | | | | | |
Long-term borrowings | | | | | | | | | | | | | | | | | | | | | |
Credit Facility | | | 250,564 | | | 1,925 | | | 248,639 | | | — | | | — | | | — | | | — |
Deferred Interest Notes | | | 226,872 | | | — | | | — | | | 226,872 | | | — | | | — | | | — |
Mandatory interest payments(2) | | | 61,515 | | | 21,968 | | | 23,200 | | | 16,347 | | | — | | | — | | | — |
| | | | | | | | | | | | | | | | | | | | | |
Total obligations | | $ | 1,106,550 | | $ | 99,407 | | $ | 342,406 | | $ | 308,854 | | $ | 61,072 | | $ | 56,227 | | $ | 238,584 |
| | | | | | | | | | | | | | | | | | | | | |
| | | | | | | |
Commitments | | Total | | Year 1 | | Year 2 | | Year 3 | | Year 4 | | Year 5 | | Thereafter |
Letters of credit and surety bonds | | $ | 1,312 | | $ | 1,312 | | $ | — | | $ | — | | $ | — | | $ | — | | $ | — |
| | | | | | | | | | | | | | | | | | | | | |
Total commitments | | $ | 1,312 | | $ | 1,312 | | $ | — | | $ | — | | $ | — | | $ | — | | $ | — |
| | | | | | | | | | | | | | | | | | | | | |
Total obligations and commitments | | $ | 1,107,862 | | $ | 100,719 | | $ | 342,406 | | $ | 308,854 | | $ | 61,072 | | $ | 56,227 | | $ | 238,584 |
| | | | | | | | | | | | | | | | | | | | | |
| (1) | Represent the basic annual rent, exclusive of the contingent rentals, common area maintenance, real estate taxes and other charges paid to landlords, all together representing less than 1/3 of our total lease expenses. |
| (2) | Based on the assumed interest rates on the amounts due under the Credit Facility, applying the current foreign exchange rate where required. Where swap agreements are in place, the mandatory interest payments reflect swap payments. For the Deferred Interest Notes, we assumed the current applicable rates. We do not have any obligation to pay interest in cash until maturity. |
29
Debt and Commitments
We are and have historically been significantly leveraged. Our principal sources of liquidity have been cash flows generated from operations and borrowings under the Credit Facility. Our principal cash requirements have been for working capital, capital expenditures and debt service. In connection with the acquisition of the Dollarama business in 2004 by the Partnership, an entity formed by Bain Capital, we entered into the Credit Facility, pursuant to which we incurred $120.0 million of borrowings under the term loan A facility and U.S.$201.3 million of borrowings under a term loan B facility ($240.0 million based on the exchange rate on the closing date of the acquisition), and the senior subordinated bridge loan facility, pursuant to which we borrowed an aggregate of $240.0 million.
On December 20, 2006, we issued U.S.$200.0 million Deferred Interest Notes bearing interest at 6-month LIBOR plus 5.75% (increasing to 6.25% after two years and 6.75% after three years) per annum, payable semi annually and maturing in November 2012. We used the proceeds from the sale of these notes to make a cash distribution to certain of our shareholders and to pay related fees and expenses.
As of January 31, 2010, we had approximately: $250.6 million of senior secured debt outstanding under the Credit Facility; and U.S.$212.2 million ($226.9 million based on the exchange rate on January 31, 2010) of Deferred Interest Notes.
Our ability to make scheduled payments of principal, or to pay the interest on, or to refinance our indebtedness, or to fund planned capital expenditures will depend on our future performance, which to a certain extent, is subject to general economic, financial, competitive, legislative, regulatory, or other factors that are beyond our control. Based upon the current level of our operations, we believe that cash flows from operations, together with borrowings available under the Credit Facility, will be adequate to meet our future liquidity needs. Our assumptions with respect to future liquidity needs may not be correct and funds available to us from the sources described above may not be sufficient to enable us to service our indebtedness, or cover any shortfall in funding for any unanticipated expenses.
We and our parent’s and our affiliates’ significant shareholders may from time to time seek to retire or purchase our outstanding debt (including publicly issued debt) through cash purchases and/or exchanges, in open market purchases, privately negotiated transactions, by tender offer or otherwise. Such repurchases or exchanges, if any, will depend on prevailing market conditions, liquidity requirements, contractual restrictions and other factors. The amounts involved may be material.
Credit Facility
As of January 31, 2010, the Credit Facility consisted of a (i) U.S.$234.3 million ($250.6 million based on the exchange rate on January 31, 2010) term loan B facility maturing in November 2011, denominated in U.S. dollars; and (ii) $75.0 million revolving credit facility denominated in Canadian dollars and maturing in June 2012, which includes a $25.0 million letter of credit subfacility and a $10.0 million swingline loan subfacility. As of January 31, 2010, there was an aggregate $251.9 million outstanding under the Credit Facility, including $1.3 million of letters of credit outstanding under the revolving credit facility. In addition, we may, under certain circumstances and subject to receipt of additional commitments from existing lenders or other eligible institutions, request additional term loan tranches or increases to the revolving loan commitments by an aggregate amount of up to $150.0 million (or the U.S. dollar equivalent thereof).
The interest rates per annum applicable to the loans under the Credit Facility, other than swingline loans, equal an applicable margin percentage plus, at our option, (1) in the case of U.S. dollar denominated loans, (a) a U.S. base rate equal to the greater of (i) the rate of interest per annum equal to the rate which Royal Bank of Canada establishes at its main office in Toronto from time to time as the reference rate of interest for U.S. dollar loans made in Canada and (ii) the federal funds effective rate (converted to a rate based on a 365 or 366 day period, as the case may be) plus 1.0% per annum or (b) the rate per annum equal to the rate determined by Royal Bank of Canada to be the offered rate that appears on the page of the Telerate screen 3750 that displays an average British Bankers Association Interest Settlement Rate for deposits in U.S. dollars for an interest period chosen by the applicable borrower of one, two, three, or six months (or, if made available by all applicable lenders, nine or twelve month periods) and (2) in the case of Canadian dollar denominated loans, (a) a Canadian prime rate equal to the greater of (i) the rate of interest per annum equal to the rate which Royal Bank of Canada establishes at its main office in Toronto from time to time as the reference rate for Canadian dollar loans made in Canada and (ii) the rate per annum determined as being the arithmetic average of the rates quoted for bankers’ acceptances for an interest period of one month as listed on the applicable Reuters Screen CDOR (Certificate of Deposit Offered Rate) page (plus 0.10% for certain lenders) plus 1.0% per annum or (b) the rate per annum determined as being the arithmetic average of the rates quoted for bankers’ acceptances for the appropriate interest period as listed on the applicable Reuters Screen CDOR (Certificate of Deposit Offered Rate) page (plus 0.10% for certain lenders).
The applicable margin percentages for Canadian dollar denominated loans and U.S. dollar denominated loans are subject to adjustment based upon the level of the total lease-adjusted leverage ratio. As of January 31, 2010, the applicable margin percentage for 0.75% for Canadian prime rate loans and 1.75% for bankers’ acceptances and the applicable margin percentage was 1.75% for
30
adjusted LIBOR rate loans and 0.75% for U.S. base rate loans. Swingline loans bear interest at an interest rate equal to the interest rate for Canadian prime rate loans. On the last day of each calendar quarter, we also pay a commitment fee (calculated in arrears) to each revolving credit lender in respect of any unused commitments under the revolving credit facility, subject to adjustment based upon the level of the total lease-adjusted leverage ratio. As of January 31, 2010, the commitment fee was 0.375%.
The Credit Facility contains various restrictive covenants that, subject to significant exceptions, limit our ability and the ability of our restricted subsidiaries, to, among other things: make investments and loans, make capital expenditures, incur, assume, or permit to exist additional indebtedness, guarantees, or liens, engage in mergers, acquisitions, asset sales or sale-leaseback transactions, declare dividends, make payments on, or redeem or repurchase equity interests, alter the nature of the business, engage in certain transactions, with affiliates, enter into agreements limiting subsidiary distributions, and prepay, redeem, or repurchase certain indebtedness.
The Credit Facility requires Group L.P. to comply, on a quarterly basis, with certain financial covenants, including a minimum interest coverage ratio test and a maximum lease-adjusted leverage ratio test. As of January 31, 2010, the terms of the Credit Facility required that we maintain a minimum interest coverage ratio of 2.50:1 and a lease-adjusted leverage ratio of no more than 4.50:1. The interest coverage ratio and the lease-adjusted leverage ratio financial covenants are not subject to further adjustments and will be fixed at 2.50:1 and 4.50.1, respectively, for the remaining term of the Credit Facility.
Subject to exceptions, the Credit Facility requires mandatory prepayments of or offer to prepay (with the failure to do so constituting an event of default) the loans in the event of certain asset sales or other asset dispositions, issuances of equity securities or debt securities, or if we have annual consolidated excess cash flows. The Credit Facility is guaranteed by Holdings L.P., Dollarama Group GP Inc. and all of Group L.P.’s existing and future restricted subsidiaries, and is secured by a security interest in substantially all of the existing and future assets of Holdings L.P., Dollarama Group GP Inc, Group L.P. and Group L.P.’s restricted subsidiaries, and a pledge of Group L.P.’s capital stock and the capital stock of each of its subsidiaries, subject to certain exceptions agreed upon with the lenders and local law requirements.
On September 22, 2009, we entered into Amendment No. 5 to the Credit Facility which allowed us to enter into a new secured revolving credit facility which replaced our existing secured revolving credit facility on the same terms, except that the new revolving credit facility may have a later maturity date and may have a different interest rate.
On October 21, 2009, we entered into Amendment No. 6 to the Credit Facility. The Amendment No.6 provides us with a new $75.0 million secured revolving credit facility, which matures in July 2012 and otherwise has the same terms, pricing, covenants, guarantees and security as our existing secured revolving credit facility.
8.875% Subordinated Notes
Group L.P. and Dollarama Corporation issued U.S.$200.0 million of 8.875% Subordinated Notes due in 2012 on August 12, 2005. On the Redemption Date, Group L.P. and Dollarama Corporation consummated the redemption of the 8.875% Subordinated Notes in accordance with their terms. The redemption price was 104.438% of the principal amount of the 8.875% Subordinated Notes, plus accrued and unpaid interest to the Redemption Date and was paid from cash on hand and from the net proceeds of the IPO.
Deferred Interest Notes
Holdings and Dollarama Group Holdings Corporation issued the Deferred Interest Notes on December 20, 2006 by way of a private placement in the United States in accordance with Rule 144A under the Securities Act of 1933, as amended and in certain Canadian provinces in accordance with Regulation S under the Securities Act of 1933, as amended and applicable Canadian prospectus and registration exemptions. As of January 31, 2010, there was U.S.$212.2 million in aggregate principal amount and deferred interest outstanding. The Deferred Interest Notes will mature on August 15, 2012. Interest on the Deferred Interest Notes accrues and is payable semi-annually in arrears on June 15 and December 15 of each year, at a rate per annum equal to 6-month LIBOR plus 6.75% as of December 15, 2009. On each interest payment date, Holdings and Dollarama Group Holdings Corporation may elect to pay interest in cash or defer the payment of interest, in which case such interest will become deferred interest and interest shall accrue on such deferred interest for subsequent interest periods. For the payment of interest due on June 15, 2009, Holdings and Dollarama Group Holdings Corporation deferred the payment of interest on the Deferred Interest Notes, which payment represented an amount of U.S.$8.7 million. Interest was also deferred on June 15, 2008 (U.S.$9.8 million) and December 15, 2008 (U.S.$8.7 million). An aggregate amount of U.S.$27.4 million of deferred interest remains outstanding as of January 31, 2010 and will be payable at the latest upon redemption or maturity of the Deferred Interest Notes. Holdings elected to make a cash payment of interest due on December 15, 2009 in the amount of U.S.$7.9 million.
The Deferred Interest Notes may be redeemed, in whole or in part, at the following redemption prices (expressed as percentages of principal amount plus deferred interest), plus accrued and unpaid interest, if any, to the redemption date, if redeemed during periods set forth below:
| | |
Year | | Redemption Price |
December 15, 2009 to December 14, 2010 | | 101.00 |
December 15, 2010 and thereafter | | 100.00 |
31
In addition, Holdings and Dollarama Group Holdings Corporation may redeem all of the Deferred Interest Notes at a price equal to 100% of the principal amount plus deferred interest, plus accrued and unpaid interest, if any, if Holdings and Dollarama Group Holdings Corporation become obligated to pay certain tax gross-up amounts. Following a change of control as defined in the Deferred Interest Notes Indenture, Holdings and Dollarama Group Holdings Corporation will be required to offer to purchase all of the Deferred Interest Notes at a purchase price of 101% of their principal amount plus deferred interest, plus accrued and unpaid interest (other than deferred interest), if any, to the date of purchase.
The Deferred Interest Notes Indenture contains certain restrictions on us, including restrictions on Holdings’, Dollarama Group Holdings Corporation’s and their restricted subsidiaries’ ability to make investments and loans, incur indebtedness and issue preferred stock, declare dividends, make payments on, or redeem or repurchase equity interests, engage in certain transactions with affiliates, grant liens, sell assets, enter into agreements limiting subsidiary distributions, and engage in certain other activities. The Deferred Interest Notes Indenture contains customary affirmative covenants and events of default, including, but not limited to, non-payment of principal, premium of interest, breach of covenants, cross default and cross acceleration to certain indebtedness, insolvency and bankruptcy events, material judgments and actual or asserted invalidity of the guarantees. Some of these events of default allow for notice and grace periods and are subject to materiality thresholds.
The Deferred Interest Notes constitute senior unsecured obligations of Holdings and Dollarama Group Holdings Corporation. They rank equally in right of payment to all of Holdings’ and Dollarama Group Holdings Corporation’s future unsecured senior indebtedness, senior in right of payment to any of Holdings’ and Dollarama Group Holdings Corporation’s future senior subordinated indebtedness and subordinated indebtedness and are effectively subordinated in right of payment to any of Holdings’ and Dollarama Group Holdings Corporation’s future secured debt, to the extent of such security and are structurally subordinated in right of payment to all existing and future debt and other liabilities, including the Credit Facility, trade payables and lease obligations, of Holdings’ subsidiaries. The Deferred Interest Notes are not guaranteed by any of Holdings’ subsidiaries (other than Dollarama Group Holdings Corporation, as the co-issuer of the Deferred Interest Notes).
Off-Balance Sheet Obligations
Other than operating lease obligations and letters of credit, we have no off-balance sheet obligations.
Recent Accounting Pronouncements
Goodwill and Intangible Assets
Canadian Institute of Chartered Accountants (“CICA”) Handbook Section 3064, “Goodwill and Intangible Assets”, replaces Section 3062, “Goodwill and Other Intangible Assets”, and establishes standards for the recognition, measurement and disclosure of goodwill and intangible assets. The provisions relating to the definition and initial recognition of intangible assets are equivalent to the corresponding provisions of International Accounting Standard (“IAS”) 38, “Intangible Assets”. Section 1000, “Financial Statement Concepts”, has been amended to clarify criteria for recognition of an asset. Section 3450, “Research and Development Costs”, has been replaced by guidance in Section 3064. CICA Emerging Issues Committee Abstract 27, “Revenues and Expenditures During the Pre-operating Period”, is no longer applicable for entities that have adopted Section 3064. Accounting Guideline 11, “Enterprises in the Development Stage”, has been amended to delete references to deferred costs and to provide guidance on development costs as intangible assets under Section 3064. This new standard is effective for interim and annual financial statements for years beginning on or after October 1, 2008. This Section was adopted as of February 2, 2009 with no impact on the Consolidated Financial Statements.
Accounting Changes
In June 2009, CICA amended Section 1506, “Accounting Changes”, to exclude from the scope of this Section changes in accounting policies upon the complete replacement of an entity’s primary basis of accounting. This amendment is effective for years beginning after July 1, 2009. This amendment was early adopted as of January 31, 2010 with no impact on the Consolidated Financial Statements.
Financial Instruments - Disclosures
In June 2009, the CICA amended Section 3862, “Financial Instruments— Disclosures”, to include additional disclosure requirements about fair value measurement for financial instruments and liquidity risk disclosures. These amendments require a three-level hierarchy that reflects the significance of the inputs used in making the fair value measurements. Fair value of assets and liabilities included in Level 1 are determined by reference to quoted prices in active markets for identical assets and liabilities. Assets and liabilities in Level 2 include valuations using inputs other than the quoted prices for which all significant inputs are based on observable market data, either directly or indirectly. Level 3 valuations are based on inputs that are not based on observable market data. The amendments to Section 3862 as of January 31, 2010 had no impact on the Consolidated Financial Statements.
32
Disclosures about Derivative Instruments and Hedging Activities
In March 2008, the Financial Accounting Standards Board (“FASB”) issued guidance to improve financial reporting for derivative instrument and hedging activities by requiring enhanced disclosures regarding the impact on financial position, results of operations, and cash flows. It is effective for financial statements issued for fiscal years and interim periods beginning after November 15, 2008. Disclosure requirements pertaining to this Statement is included in note 9 to the interim Consolidated Financial Statements.
Determination of the Useful Life of Intangible Assets
In April 2008, the FASB issued guidance which amends the factors that should be considered in developing renewal or extension assumptions used to determine the useful life of a recognized intangible asset and the period of expected cash flows used to measure the fair value of the asset under other U.S. generally accepted accounting principles. Disclosure requirements are effective for all intangible assets recognized as of, and subsequent to, fiscal years beginning after December 15, 2008. The adoption of this new standard had no impact on the Consolidated Financial Statements.
Business Combinations
In December 2007, the FASB issued guidance which establishes principles and requirements for how an acquirer recognizes and measures in its financial statements identifiable assets acquired, liabilities assumed, any non-controlling interest in an acquiree and the resulting goodwill. The guidance also establishes disclosure requirements to enable the evaluation of the nature and financial effects of the business combination. This guidance was effective for annual reporting periods beginning after December 15, 2008 and was adopted as of February 2, 2009 with no impact on the Consolidated Financial Statements.
Non-Controlling Interests in Consolidated Financial Statements
In December 2007, the FASB issued guidance to establish accounting and reporting standards for the non-controlling interest in a subsidiary and for the deconsolidation of a subsidiary. This topic clarifies that a non-controlling interest in a subsidiary is an ownership interest in the consolidated entity that should be reported as equity in the Consolidated Financial Statements. The topic changes the way the consolidated earnings (loss) statement is presented by requiring consolidated net earnings (loss) to be reported including the amounts attributable to both the parent interest and the non-controlling interest. It is effective for fiscal periods, and interim periods within those fiscal years, beginning on or after December 15, 2008. Its adoption as of February 2, 2009 had no impact on the Consolidated Financial Statements.
Fair Value Measurements
In April 2009, the FASB issued a modification of the Fair Value Measurements and Disclosures Topic of FASB Accounting Standards Codification (“ASC”) concerning the determination of fair value when the volume and level of activity for the asset or liability have significantly decreased and for identifying transactions that are not orderly. This modification emphasizes that even if there has been a significant decrease in the volume and level of activity for the asset or liability and regardless of the valuation technique(s) used, the objective of a fair value measurement remains the same. Fair value is the price that would be received to sell an asset or paid to transfer a liability in an orderly transaction (that is, not a forced liquidation or distressed sale) between market participants at the measurement date under current market conditions. The modification also provides guidance on indentifying transactions that are not orderly by assessing certain factors among which are: an adequate marketing period for the asset or liability, whether the seller is in a distressed state and whether the transaction price is an outlier compared with recent transactions. The modification amends the disclosure provisions required by the Fair Value Measurements and Disclosures Topic of FASB ASC to require entities to disclose in interim and annual periods the inputs and valuation technique(s) used to measure fair value.
These modifications are effective for interim and annual periods ending after June 15, 2009, and have consequently been adopted by the Partnership.
Fair Value Disclosures for Interim Periods
In April 2009, the FASB issued a modification of the Fair Value Measurements and Disclosures Topic of FASB ASC concerning the interim disclosures about fair value of financial instruments, to require interim-period disclosures about fair value of financial instruments that were previously made on an annual basis only.
This modification is effective for interim and annual periods ending after June 15, 2009, with early adoption permitted. The Partnership has adopted the disclosure requirement with no impact on the Consolidated Financial Statements.
33
Recognition and Presentation of Other-Than-Temporary Impairments
In April 2009, the FASB issued Recognition and Presentation of Other-Than-Temporary Impairments. The topic amends the other-than-temporary impairment guidance for debt securities to make the guidance more operational and to improve the presentation and disclosure of other-than-temporary impairments on debt and equity securities in the financial statements. This guidance does not amend existing recognition and measurement guidance related to other-than-temporary impairments of equity securities. The provisions of this topic are effective for interim and annual reporting periods ending after June 15, 2009. The Partnership adopted this new standard with no impact on the Consolidated Financial Statements.
Management’s Assessment of Subsequent Events
In May 2009, the FASB issued Subsequent Events that provides guidance on management’s assessment of subsequent events. Historically, management had relied on U.S. auditing literature for guidance on assessing and disclosing subsequent events. The topic represents the inclusion of guidance on subsequent events in the accounting literature and is directed specifically to management, since management is responsible for preparing an entity’s Consolidated Financial Statements.
The new topic does not significantly change practice because its guidance is similar to that in existing U.S. auditing literature on subsequent events, although with some important modifications. The new topic clarifies that management must evaluate, as of each reporting period, events or transactions that occur after the balance sheet date “through the date that the financial statements are issued or are available to be issued.” Management must perform its assessment for both interim and annual financial reporting periods.
The topic is effective prospectively for interim or annual periods ending after June 15, 2009. The Partnership applied the requirements of this topic in the preparation of our January 31, 2010 Consolidated Financial Statements.
FASB Accounting Standards Codification
On July 1, 2009, the FASB ASC became the single source of authoritative GAAP in the United States. The previous GAAP hierarchy consisted of four levels of authoritative accounting and reporting guidance, including original pronouncements of the FASB, Emerging Issues Task Force (“EITF”) abstracts, and other accounting literature (together, “previous GAAP”). The ASC eliminated this hierarchy and replaced previous GAAP (other than rules and interpretive releases of the U.S. Securities and Exchange Commission (the “SEC”)), as used by all nongovernmental entities, with just two levels of literature; namely, authoritative and non-authoritative.
The FASB has indicated that the ASC does not change previous GAAP, instead, the changes aim to reduce the time and effort it takes for users to research accounting questions and improve the usability of accounting standards by reorganizing them into a topical format, where each topic is subdivided into a number of levels that aggregate all elements of literature related to this topic.
For reporting purposes, the FASB ASC has become effective for financial statements issued for interim and annual periods ending after September 15, 2009. The Partnership adopted the FASB ASC in our January 31, 2010 Consolidated Financial Statements.
Measuring Liabilities at Fair Value
In August 2009, the FASB issued a modification of the Fair Value Measurements and Disclosures Topic of FASB ASC concerning the measurement of liabilities at fair value when there is a lack of observable market information. This modification provides clarification of the valuation techniques that are required in circumstances in which a quoted price in an active market for the identical liability is not available. The modification of the valuation techniques had no impact on the Partnership’s fair value measurements. This modification is effective for the first reporting period (including interim periods) beginning after issuance. The Partnership adopted the modification in its January 31, 2010 Consolidated Financial Statements.
Future Accounting Changes
Business Combinations, Consolidated Financial Statements and non-controlling interests
CICA Handbook Section 1582,“Business Combinations”; Section 1601, “Consolidated Financial Statements”; and Section 1602, “Non-controlling Interests”, replace Section 1581, “Business Combinations”, and Section 1600, “Consolidated Financial Statements”, and establish a new section for accounting for a non-controlling interest in a subsidiary. These sections provide the Canadian equivalent to International Financial Reporting Standard 3, “Business Combinations (January 2008)”, and IAS 27, “Consolidated and Separate Financial Statements (January 2008)”. Section 1582 is effective for business combinations for which the acquisition date is on or after the first quarter beginning on January 31, 2011 with early adoption permitted. Sections 1601 and 1602 apply to interim and annual Consolidated Financial Statements relating to years beginning on January 31, 2011 with early adoption permitted. The Partnership is assessing the impact of these new standards.
34
Financial Instruments – Recognition and Measurement
In June 2009, CICA amended Section 3855, “Financial Instruments – Recognition and Measurement”, to clarify application of the effective interest rate method after a debt instrument has been impaired. The amendment also clarifies when an embedded prepayment option is separated from its host debt instrument for accounting purposes. This amendment is effective January 1, 2011, at which time Canadian public companies will have adopted IFRS. At this point, the Partnership does not intend to adopt this amendment early. The Partnership is currently evaluating the impact of the adoption of this amendment.
Transfers of Financial Assets
In June 2009, the FASB issued Accounting for Transfers of Financial Assets, which amends the derecognition guidance required by the Transfers and Servicing Topic of FASB ASC. Some of the major changes undertaken by this amendment include:
| | • | | Eliminating the concept of a Qualified Special Purpose Entity (“QSPE”) since the FASB believes, on the basis of recent experience, that many entities that have been accounted for as QSPEs are not truly passive, a belief that challenges the premise on which the QSPE exception was based. |
| | • | | Modifying the derecognition provisions as required by the Transfers and Servicing Topic of FASB ASC. Specifically aimed to: |
| | • | | require that all arrangements made in connection with a transfer of financial assets be considered in the derecognition analysis, |
| | • | | clarify when a transferred asset is considered legally isolated from the transferor, |
| | • | | modify the requirements related to a transferee’s ability to freely pledge or exchange transferred financial assets, and |
| | • | | provide guidance on when a portion of a financial asset can be derecognized, thereby restricting the circumstances when sale accounting can be achieved to the following cases: |
| | • | | transfers of individual or groups of financial assets in their entirety and |
| | • | | transfers of participating interests |
The new amendment is effective for financial asset transfers occurring after the beginning of an entity’s first fiscal year that begins after November 15, 2009 and has not yet been codified. It is anticipated that this amendment will primarily be incorporated into the Transfers and Servicing Topic of FASB ASC. The Partnership will assess the impact of adopting this Statement on its Consolidated Financial Statements.
Variable Interest Entities
In June and December 2009, the FASB issued guidance which requires an enterprise to perform an analysis to determine whether the enterprise’s variable interest or interests give it a controlling financial interest in a variable interest entity. This guidance requires ongoing reassessments of whether an enterprise is the primary beneficiary of a variable interest entity, eliminates the quantitative approach previously required for determining the primary beneficiary of a variable interest entity and requires enhanced disclosures that will provide users of financial statements with more transparent information about an enterprise’s involvement in a variable interest entity. This guidance is effective for fiscal years beginning after November 15, 2009, and for interim and annual reporting periods thereafter. The initial adoption of this standard is not expected to have a material effect on the Partnership’s financial position, results of operations or cash flows.
Fair Value Disclosures
In January 2010, the FASB issued an Update of the Fair Value Measurements and Disclosures Topic of FASB ASC requiring new disclosures and amending existing guidance. This Update provides amendments that require new disclosures as follows:
| | • | | A reporting entity should disclose separately the amounts of significant transfers in and out of Level 1 and Level 2 fair value measurements and describe the reasons for transfers; |
| | • | | In the reconciliation for fair value measurements using significant unobservable inputs (Level 3), a reporting entity should present separately information about purchases, sales, issuances, and settlements. |
This Update also provides amendments that clarify existing disclosures as follows:
| | • | | A reporting entity should provide fair value measurements for each class of assets and liabilities; |
| | • | | A reporting entity should provide disclosures about the valuation techniques and inputs used to measure fair value for both recurring and nonrecurring fair value measurements that fall either in Level 2 or Level 3. |
These modifications are effective for interim and annual periods beginning after December 15, 2009, except for the disclosures about purchases, sales, issuances, and settlements in the roll forward activity in Level 3 fair value measurements. Those disclosures are effective for interim and annual periods beginning after December 15, 2010. We do not anticipate these new disclosure requirements to have a significant impact compared to its present level of disclosures.
35
Accounting for Own-Share Lending Arrangements in Contemplation of Convertible Debt Issuance
In October 2009, the FASB issued Accounting Standards Update (“ASU”) No. 2009-15, This Accounting Standards Update amends Subtopic 470-20, Debt with Conversion and Other Options and Subtopic 260-10, Earnings Per Share. Effective for years beginning on or after December 15, 2009 and interim periods within those years for arrangements outstanding as of the beginning of those years.
International Financial Reporting Standards (“IFRS”)
In October 2009, the Accounting Standards Board (“AcSB”) issued a third and final IFRS Omnibus Exposure Draft confirming that publicly accounting enterprises will be required to apply IFRS, in full and without modification, for financial periods beginning on January 1, 2011.
The adoption date of January 31, 2011 is the first day of the Partnership’s Fiscal 2012 and will require restatement, for comparative purposes, of amounts reported for Fiscal 2011 including the opening balance sheet as at February 1, 2010.
The Partnership has commenced the process to transition from current Canadian GAAP to IFRS. Internal staff has been appointed to lead the conversion project along with sponsorship from the leadership team. Resource requirements have been identified and all IFRS requirements will be met with internal employees supplemented with consultants as required. Regular progress reporting to the audit committee of the Board of Directors on the status of the IFRS conversion has been implemented along with scheduled training sessions throughout Fiscal 2010 At this time, the Partnership has begun the process of training key personnel, by providing general awareness training on IFRS impacts.
The implementation project of the Partnership consists of three key phases, which in certain cases will be process concurrently as IFRS is applied to specific areas from start to finish:
Phase 1: Scoping and diagnostic phase:
This phase involves performing a high level impact analysis to identify areas that may be affected by the transition to IFRS. The results of this analysis are priority ranked according to complexity and the amount of time required to assess the impact of changes in transitioning to IFRS.
Phase 2: Impact analysis and evaluation phase:
During this phase, items identified in the diagnostic are addressed according to the priority levels assigned to them.
This phase involves the development of a detailed project plan, the completion of analyses of the differences between the Partnership’s accounting policies and IFRS to provide a basis for accounting policy recommendations, completion of an IT systems impact analysis and the development of a strategy for dual Canadian GAAP and IFRS reporting during FY11 and changeover to IFRS in FY12, the assessment of the impact of accounting and other business process changes on internal controls, the review of compensation arrangements, debt agreements and other contractual arrangements, and the delivery of detailed IFRS training to key finance and other personnel.
The conclusion of the impact analysis and evaluation phase will require the audit committee of the Partnership to review and approve all accounting policy choices as proposed by management.
Phase 3: Implementation phase and review phase:
In the last phase, we will implement all changes approved in the impact analysis phase and will include changes to information systems, business processes, modification of agreements and training of all staff who are impacted by the conversion.
Current Status of Our IFRS Changeover Plan:
The Partnership has completed the scoping and diagnostic phase and has prepared draft analysis for the impact analysis and evaluation phase. During the fourth quarter of FY10, the Partnership significantly progressed in the design phase of its changeover plan. However, management has not yet finalized its analysis of accounting policies choice and impacts on the financial statements, and as such is unable to quantify the impact of adopting IFRS on the financial statements.
36
We expect to complete the final stages of the design phase of our changeover plan early in FY11. Updates regarding the progress of the IFRS changeover project are provided to the Partnership’s audit committee on a quarterly basis.
The Partnership has identified the areas noted below as those expected to have the most significant impact on our financial statements. These areas do not represent a complete list of expected changes. As we progress further into the implementation phase, and as changes to Canadian GAAP and IFRS standards may occur prior to our changeover date, the differences and impacts described below may be subject to change. We will continue to disclose additional impacts on our financial reporting, including expected quantitative impacts, systems and processes and other areas of our business in future reports as they are determined.
First time adoption
IFRS 1, “First-Time Adoption of International Financial Reporting Standards” (“IFRS 1”), provides entities adopting IFRS for the first time with a number of optional exemptions and mandatory exceptions in certain areas to the general requirement for full retrospective application of IFRS.
Management is analyzing the various accounting policy choices available and will implement those determined to be the most appropriate for the Partnership which at this time are summarized as follows:
Business Combinations
IFRS 1 generally provides for the business combinations standard to be applied either retrospectively or prospectively from the date of transition to IFRS (or to restate all business combinations after a selected date). Retrospective application would require an entity to restate all prior transactions that meet the definition of a business under IFRS.
We will not elect to retrospectively apply IFRS 3 to business combinations that occurred prior to the transition date, and such business combinations will not be restated. Any goodwill arising on such business combinations before the transition date will not be adjusted from the carrying amount previously determined under Canadian GAAP as a result of applying these exemptions except as required under IFRS 1.
Property, Plant and Equipment(“PP&E”)
IFRS 1 allows an entity to initially measure an item of PP&E and investment property upon transition to IFRS at fair value as deemed cost (or under certain circumstances using a previous GAAP revaluation) as opposed to full retroactive application of the cost model under IFRS. Under this option, fair value as deemed cost will become the new cost amount for qualifying assets at transition.
We will continue to apply the cost model for PP&E and will not restate PP&E to fair value under IFRS. We will use the historical bases under Canadian GAAP as deemed cost under IFRS at the transition date.
Share-Based Payments
IFRS 1 allows the Partnership an exemption to not apply retrospectively IFRS 2, “Share-Based Payments” requirements to equity instruments granted on or before November 2, 2002 or which vested before the Partnership’s transition date to IFRS. Although not expected to be significant, management is still in the process of assessing the application of this first time adoption option.
Major differences with current accounting policies
Leases
Under IFRS there are no bright-line finance lease criteria as compared to Canadian GAAP, which may cause certain leases to tenants to be classified as finance leases rather than operating leases, as is generally the Partnership’s current treatment under Canadian GAAP.
The Partnership has developed internal methodology (decision tree) using IFRS indicators to assist in lease classification under IFRS. Management is still in the process of finalizing its assessment review of the impact of this new accounting policy, however, no significant adjustments are expected.
Grouping of Assets for Impairment Purposes
Under Canadian GAAP, when a long-lived asset does not have identifiable cash flows that are largely independent of those from other assets, that asset must be grouped with other related assets for impairment. This is referred to as the asset group.
37
Under IFRS, asset grouping should be done when an asset does not have identifiable cash inflows, as opposed to net cash flows, that are independent of those from other assets.
Moreover, for goodwill, the grouping should be based on a rationale basis and allocated to the lowest level at which the entity’s management monitors the performance of its acquisition. This may be an individual CGU or group of CGUs but cannot be larger than a segment. However, the reporting units under Canadian GAAP may not result in assessment at as low a level as the CGU used in IAS 36 Impairment of Assets (“IAS 36”).
Management has completed its analysis with regard to the above expected differences and concluded that no material adjustment is required.
Impairment of Long-lived Assets
Under Canadian GAAP, whenever the estimated future cash flows on an undiscounted basis of a property is less than the carrying amount of the property, an impairment loss is measured and recorded based on fair values. Under IFRS, IAS 36 requires an impairment charge to be recognized if the recoverable amount, determined as the higher of the estimated fair value less costs to sell or value in use, is less than carrying amount. The impairment charge under IFRS is equal to the amount by which the carrying amount exceeds the recoverable amount.
The difference in testing and determining an impairment may result in more frequent impairment charges, where carrying values of assets may have been supported under Canadian GAAP on an undiscounted cash flow basis, but cannot be supported on a discounted cash flow basis.
IAS 36 also requires the reversal of any previous impairment losses where circumstances requiring the impairment charge have changed and reversed. Canadian GAAP does not permit the reversal of impairment losses in any circumstance.
Based on the analysis completed by management, no significant impacts are expected in this area.
Hedges and Derivatives
Under IFRS, hedge effectiveness requirements are more onerous than under Canadian GAAP. As such, documentation of hedge relationships and hedge effectiveness have been reviewed to ensure compliance with IAS 39 requirements, at the transition date.
Moreover, although hedge accounting under Canadian GAAP and IFRS is substantially the same, existing Canadian standards and methods to evaluate retrospective hedge effectiveness are not consistent with IFRS. IFRS does not allow the use of the shortcut method or the critical terms matching method for retrospectively assessing effectiveness for derivative financial instruments. Consequently a new testing methodology has been set up for retrospective testing and has been applied at the transition date. The full extent of the impact of applying IAS 39 requirements cannot be made at this time, pending further review.
Property, Plant and Equipment
IFRS requires a component approach: each part of an item of PP&E with a cost that is significant in relation to the total cost of the item must be depreciated separately over its estimated useful life. This may result in additional individual line items in the fixed assets subledger being depreciated over their useful lives.
Given the nature of the Partnership’s assets, no significant impact is expected in this area.
Share-based Payments
There are multiple differences between both GAAP in the measurement principles. For the Partnership, one of the applicable differences is the IFRS requirement to estimate forfeitures at the time of the grant, instead of accounting for as they occur.
The difference has no significant impact at the transition date, but accounting policies will be reviewed consequently.
The following table summarizes the status of our changeover plan based on the recommendations published in October 2008 by the Canadian Performance Reporting Board with regard to the Pre-2011 communications about IFRS conversion.
38
| | | | | | | | |
Area | | Key activity | | Milestones | | Status |
| Financial statements presentation | | - Identify key differences between IFRS and Canadian GAAP | | Senior management sign-off for all items to be completed by the end of Fiscal 2010 | | Completed the identification of IFRS differences |
| | - Evaluate and select ongoing policies | | Subsequent changes to IFRS will be analyzed and reviewed on a quarterly basis | | Evaluation and selection of accounting policy alternatives is completed |
| | - Evaluate and select IFRS 1 choices | | | | Preparation of draft of financial statements is under completion |
| | - Prepare financial statements format | | | | Quantification of impacts are in progress |
| | - Quantify the effects of changeover to IFRS | | | | |
IT systems | | - | | Identify and address IFRS differences that require changes to financial systems | | Required financial systems changes and set up of parallel processing to be completed by the end of Fiscal 2010 | | Identification of IFRS differences with system impacts is under progress |
| | | | |
| | - | | Evaluate and select methods to address need for parallel processing of 2010 general ledgers and for planning and monitoring purposes | | | | Selection of parallel processing solution is completed Implementation of the solution is under progress |
| | | | |
| Internal control over financial reporting | | - | | Assess required changes to existing internal control processes and procedures | | Assessment of required changes to be completed by the end of Q2 Fiscal 2011 | | Assessment of IFRS impacts on existing internal control processes and procedures under progress |
| | - | | Design and implement internal controls with respect to one-time changeover adjustments and ongoing changes | | Revision to actual internal controls modifications planned for the third quarter of Fiscal 2011 | | Revision of actual controls and design of significant process changes will start during Fiscal 2011 |
| | - | | For changes to accounting policies and practices identified, assess the disclosure controls and procedures design and effectiveness implications | | | | |
| | | | |
| Training and communication | | - | | Provide training to accounting staff, senior executives and board of directors (including audit committee) | | Timely training provided to align with work under transition – training to be substantially completed by the end of Fiscal 2011 | | General awareness training on IFRS impacts already provided. Detailed training on relevant topics will be provided during Fiscal 2011 |
| | | | |
| | - | | Communication of progress on conversion plan to internal and external stakeholders | | Communicate effect of the transition during Fiscal 2011 | | Ongoing communication to external stakeholders through disclosures |
| | | | |
| | | | | | | | Periodic status project are presented to senior management and audit committee |
| | | | |
| IFRS impacts on business groups and functions | | - | | Identify and assign necessary resources with the requisite expertise for technical analysis and implementation | | Procure and assign project resources | | Project management continues to identify critical path tasks and resourcing matters |
| | - | | Assess impacts of IFRS accounting standards on business activities | | Changes to agreement being completed by the end of third quarter Fiscal 2011 | | Process of identifying issues will start during the first quarter of Fiscal 2011 |
| | - | | Identify impact on contractual agreement including financial covenants, employee and management compensation plans | | | | |
39
| Item 6. | DIRECTORS, SENIOR MANAGEMENT AND EMPLOYEES |
A. Directors and senior management.
The following tables set out, as at the date hereof, for each of our directors and executive officers, the person’s name, positions and the date on which the person became a director or an executive officer.
Directors
| | | | |
Name | | Position(s) / Title | | Since |
Larry Rossy | | Chair of the Board of Directors and CEO | | 2004 |
| | |
Joshua Bekenstein(1) | | Director | | 2004 |
| | |
Gregory David(2) | | Director | | 2004 |
| | |
Stephen Gunn(3) (4) (5) (6) (7) | | Lead Director | | 2009 |
| | |
Matthew Levin(3) | | Director | | 2004 |
| | |
Nicholas Nomicos | | Director | | 2004 |
| | |
Donald Gray Reid(4)(8) | | Director | | 2010 |
| | |
Neil Rossy | | Director and Chief Merchandising Officer | | 2004 |
| | |
John J. Swidler, FCA(9)(10) | | Director | | 2010 |
| (1) | Chair of the Compensation Committee. |
| (2) | Gregory David resigned from his position as member and chair of the Audit Committee on January 5, 2010. |
| (3) | Member of the Compensation Committee. |
| (4) | Member of the Audit Committee. |
| (6) | Stephen Gunn was appointed Lead Director, member and chair of the Audit Committee on October 16, 2010. Stephen Gunn resigned as chair of the Audit Committee on January 5, 2010 when he was replaced by John J. Swidler. |
| (7) | Stephen Gunn was appointed as member of the Compensation Committee on February 17, 2010, in replacement of Todd Cook. |
| (8) | Donald Gray Reid was appointed as member of the Board of Directors and as a member of the Audit Committee on February 17, 2010 in replacement of Todd Cook. |
| (9) | Chair of the Audit Committee. |
| (10) | John J. Swidler was appointed to the Board of Directors and as member of the Audit Committee on January 5, 2010 in replacement of respectively Felipe Merry del Val Barbavara di Gravellona and Gregory David. On the same day, John J. Swidler was also appointed chair of the Audit Committee in replacement of Stephen Gunn. |
40
Executive Officers
| | | | |
Name and Province or State and Country of Residence | | Position(s) / Title | | Since |
Larry Rossy | | Chair of the Board of Directors and CEO | | 2004 |
| | |
Michael Ross, CA(1) | | CFO and Secretary | | 2010 |
| | |
Stéphane Gonthier | | COO | | 2007 |
| | |
Neil Rossy | | Chief Merchandising Officer | | 2004 |
| | |
Geoffrey Robillard | | Senior Vice President, Import Division | | 2004 |
| | |
Leonard Assaly | | Senior Vice President, Information Technology and Logistics | | 2004 |
| (1) | Michael Ross, CA was appointed as CFO and Secretary of the Partnership effective as of April 12, 2010. |
The following are brief profiles of the directors and executive officers of the Partnership, including a description of each individual’s principal occupation within the past five years.
Larry Rossy is the Chair of our Board of Directors and our CEO. He has been a retailer since 1965 and is the founder of Dollarama. In 1992, Mr. Rossy made the strategic decision to convert our company to the “dollar store” concept. Since that time, Mr. Rossy’s principal focus has been on the expansion of the Dollarama retail network. In addition to overseeing the organization, Mr. Rossy is directly responsible for new store development and site selection. Mr. Rossy serves as a director of Colart Design Inc. and Confection Courcel Inc.
Joshua Bekenstein is a member of our Board of Directors and the Chair of the Compensation Committee. Mr. Bekenstein is a Managing Director at Bain Capital. Prior to joining Bain Capital in 1984, Mr. Bekenstein spent several years at Bain & Company, where he was involved with companies in a variety of industries. Mr. Bekenstein serves as a director of several corporations, including Bombardier Recreational Products Inc., Bright Horizons Family Solutions, Burlington Coat Factory, Michaels Stores, Toys “R” Us and Waters Corporation.
Gregory David is a member of our Board of Directors. He is the CEO of GRI Capital Inc. and has been with the company and its affiliates since 2003. Prior to GRI Capital Inc., Mr. David provided financial and strategic advisory services to private and public companies from 2000 to 2003. Previously, he worked at Claridge Inc. from 1998 to 2000 and at McKinsey & Co. from 1996 to 1998. He has a Bachelor of Commerce from Queens University, a Bachelor of Laws and Bachelor of Civil Law from McGill University and a Master of Business Administration from Harvard Business School.
Stephen Gunnis the Lead Director of our Board of Directors. Mr. Gunn serves as Chair of the board of directors and CEO of Sleep Country Canada Inc. He was a director of Golf Town from 2005 to 2007 and a director of Connors Bros. from 2004 to 2007. He has a Bachelor of Electrical Engineering from Queens University and a Master of Business Administration from the University of Western Ontario.
Matthew Levin is a member of our Board of Directors. He is a Managing Director at Bain Capital. Prior to joining Bain Capital in 1992, Mr. Levin was a consultant at Bain & Company, where he consulted in the consumer products and manufacturing industries. He serves as a director of several corporations, including Bombardier Recreational Products, Guitar Center, Michaels Stores, Toys”R”Us and Unisource Worldwide.
41
Nicholas Nomicos is a member of our Board of Directors. Mr. Nomicos is an Operating Partner at Bain Capital. He served as our Senior Vice President, Interim CFO and Secretary from September 2009 to April 2010. Prior to joining Bain Capital in 1999, Mr. Nomicos held several senior corporate and division management positions at Oak Industries Inc., a publicly traded component manufacturing conglomerate serving the telecommunications and appliance control industries. Previously, Mr. Nomicos was a Manager at Bain & Company. He also serves as a director of Bombardier Recreational Products.
Donald Gray Reidis a member of our Board of Directors. Mr. Reid has over 26 years of experience with the Weston/Loblaw group of companies, including positions as President and CEO of President’s Choice Bank, CFO of George Weston Limited and Executive Vice President of Loblaw Companies Limited. Mr. Reid is currently Vice Chairman of the Nature Conservancy of Canada. Mr. Reid graduated from Queen’s University with a Bachelor of Science degree (honours), a Master of Science and a Master of Business Administration.
Neil Rossy joined Dollarama at its inception in 1992 and currently serves as Chief Merchandising Officer. Mr. Rossy is also a member of our Board of Directors. He led the design and construction of the Dollarama warehouses, distribution center and head office. Mr. Rossy is responsible for store design, merchandising, product development and special projects.
John J. Swidler, FCAis a member of our Board of Directors and the Chair of the Audit Committee. Mr. Swidler has been a director of Reitmans (Canada) Limited since April 2, 2008. He is also a Senior Advisor of the Montréal office of RSM Richter LLP. He was the Managing Partner of RSM Richter LLP from 1996 to January 1, 2007 and was Chairman of the firm’s executive committee from 1982 to 1996. Mr. Swidler graduated from McGill University with a Bachelor of Commerce degree and obtained his designation as a Chartered Accountant. He also received a Bachelor of Civil Law degree from McGill University. He received his Fellow Chartered Accountant (FCA) designation from the Ordre des comptables agréés du Québec in 1992.
Michael Ross, CA, was appointed as our CFO and Secretary, effective as of April 12, 2010. Prior to joining Dollarama, Mr. Ross was the CFO of Sanimax Industries Inc. for three years and from 1997 to 2007 he served as Vice President, Administration and CFO of the Bell Nordiq Group Inc. Mr. Ross earned his Bachelor of Commerce and Graduate Accounting diplomas from Concordia University in 1981 and 1983, respectively. Mr. Ross also serves as a member of the board of Investissement Québec.
Stéphane Gonthier has been our COO since September 2007. From 1998 until 2007, Mr. Gonthier served in various executive positions with Alimentation Couche-Tard Inc., a North American convenience store chain. His final position was as its Senior Vice President, Eastern North America, in charge of four divisions consisting of approximately 2,600 convenience stores in Canada and the United States. Mr. Gonthier has a Bachelor of Civil Law from Université de Sherbrooke and a Master of Business Administration from Université de Sherbrooke. Mr. Gonthier was called to the Québec Bar in 1989. Mr. Gonthier also serves as a member of the board of Investissements Trévi Inc. and Spectra Premium Industries Inc.
Geoffrey Robillard has been our Senior Vice President, Import Division since October 2006 and prior to that he was President of Aris Import Inc., a wholly-owned subsidiary from November 2004. From 1973 to November 2004, Mr. Robillard was the owner and President of 9148-7264 Québec Inc. (formerly known as Aris Import Inc.), which was at that time a major distributor for imports from overseas. In 1992, Mr. Robillard, through Aris Import Inc., began working with Dollarama towards establishing Dollarama’s direct overseas sourcing capabilities and this relationship became exclusive in 1996. Mr. Robillard became an officer of Aris Import Inc. when we acquired the assets of 9148-7264 Québec Inc. in November 2004. He has been building our import division and manages a team that sources product internationally, evaluates supplier’s offers and samples, and works with our buyers to choose merchandise. He supervises pricing negotiations, quality control issues with import suppliers and coordination of all import delivery logistics, duties, and customs.
Leonard Assaly is our Senior Vice President, Information Technology. He has worked with Mr. Larry Rossy in the retail business since 1973 and was a member of Dollarama’s founding management team in 1992. Mr. Assaly is responsible for our information technology design. He oversees the development and implementation of retail and replenishment software applications.
Two of the directors and officers are related to each other. Specifically, Larry Rossy is Neil Rossy’s father.
42
Summary Compensation Table for Fiscal Year 2010
The following table sets out information concerning compensation paid by the Partnership to its executive officers for Fiscal 2010.
| | | | | | | | | | | | | | | | | |
Name and Principal Position | | Year | | Salary ($) | | Option
Awards
($) | | Non-equity
Incentive Plan
Compensation
($)(1) | | All Other
Compensation
($) | | Total ($) |
Larry Rossy,
Chief Executive Officer and Director | | 2010 | | $ | 400,000 | | $ | — | | $ | 1,110,000 | | $ | 16,741 | | $ | 1,526,741 |
| | | | | | |
Nicholas Nomicos,
Former Senior Vice President, Interim Chief Financial Officer and Secretary(2) | | 2010 | | $ | — | | $ | — | | $ | — | | $ | — | | $ | — |
| | | | | | |
Stéphane Gonthier,
Chief Operating Officer | | 2010 | | $ | 340,000 | | $ | — | | $ | 525,000 | | $ | 3,942 | | $ | 2,582,708 |
| | | | | | |
Neil Rossy,
Chief Merchandising Officer | | 2010 | | $ | 340,000 | | $ | — | | $ | 525,000 | | $ | 7,418 | | $ | 872,418 |
| | | | | | |
Geoffrey Robillard,
President, Senior Vice President Import Division | | 2010 | | $ | 2,000,000 | | $ | — | | $ | 1,000,000 | | $ | 3,000 | | $ | 4,066,376 |
| (1) | Bonus amounts presented are for Fiscal 2010 performance. |
| (2) | Nicholas Nomicos resigned as Senior Vice President, Interim CFO and Secretary on March 18, 2010, effective April 12, 2010. On the same date, Michael Ross was appointed CFO and Secretary of the Partnership, effective April 12, 2010. Dollarama L.P. entered into an employment agreement effective April 12, 2010 and an option agreement with Michael Ross, which provides for a base salary of $340,000, an annual bonus of up to 75% of the base salary set against the achievement of certain targets, an option to purchase 100,000 Common Shares at an exercise price of $24.51, as well as a one-time signing and retention bonus payment of $40,000, payable concurrently with the fiscal 2011 annual bonus. |
Annual Bonus
The annual cash bonus plan is administered by the Compensation Committee on behalf of the Board of Directors, and the executive bonus pool is determined by the Partnership’s financial performance. An executive’s target bonus is set as a percentage of the executive’s base salary (the “Target Bonus”). The cash bonus earned by each executive officer is dependent on the Partnership’s performance and on the achievement of individual performance goals specified at the beginning of each fiscal year. Fifty percent (50%) of the Target Bonus is measured against the Partnership’s financial performance, and the other fifty percent (50%) is based on the participant’s personal performance against key objectives which are tied directly to the Partnership’s overall results.
For the fiscal year ended January 31, 2010, the Partnership’s performance determined the bonus pool on a sliding scale, allowing for bonus payouts between 0-200% of targeted amounts. The achievement of the performance target the Partnership allows the participants to potentially receive one hundred percent (100%) of their Target Bonus. If the Partnership’s performance is below or exceeds such target, the amount of bonus to which the participants will be entitled is established on the aforementioned sliding scale. Personal performance is evaluated by the CEO with the assistance of the Compensation Committee, which then make recommendations to the Board of Directors. For Fiscal 2010, the Partnership exceeded its performance target.
Management Option Plan
Under the management option plan of Dollarama Inc. adopted on October 16, 2009 (the “Plan”) options may be granted to the Partnership’s employees, officers and directors for the purchase of up to 10% of Dollarama Inc.’s issued and outstanding Common Shares pursuant to the terms of the Plan. The Plan is administered by the Compensation Committee, which reviews on an annual basis proposed option grants under the Plan in the context of the Partnership’s overall executive compensation program and its incentive and retention objectives.
43
The following table summarizes for each executive officer the number of options outstanding under the Plan at the end of Fiscal 2010:
| | | | | | | | | | | | |
Name | | Option-Based Award | | Share-Based Awards |
| | Number of
Securities
Underlying
Unexercised
Options
(#) | | Option
Exercise
Price
($) | | Option
Expiration
Date | | Value of
Unexercised
In-The-Money
Options
($) | | Number of
Shares or Units
of Shares that
have not
Vested
(#) | | Market or
Payout Value
of Share-Based
Awards that
have not
Vested
($) |
Larry Rossy
CEO | | — | | — | | — | | — | | — | | — |
| | | | | | |
Nicholas Nomicos(1)
Former Senior Vice President, Interim CFO and Secretary | | — | | — | | — | | — | | — | | — |
| | | | | | |
Stéphane Gonthier
COO | | 553,356 | | 9.38 | | September 2, 2017 | | 6,015,976 | | | | |
| | | | | | |
Neil Rossy
Chief Merchandising Officer | | 553,344 | | 2.30 | | November 18, 2014 | | 9,933,521 | | — | | — |
| | | | | | |
Geoffrey Robillard
Senior Vice President, Import Division | | 1,106,692 | | 2.30 | | November 18, 2014 | | 19,867,113 | | — | | — |
| (1) | On March 18, 2010, Dollarama L.P. entered into an employment agreement effective as of April 12, 2010 and an option agreement with Michael Ross whereby the Partnership granted to Michael Ross an option to purchase 100,000 Common Shares (the “Ross Option”) at an exercise price of $24.51, concurrently with his appointment and employment with the Partnership as CFO and Secretary. Such Ross Option has a term of ten (10) years from the date of the grant. The Ross Option will vest and become exercisable in equal installments on the first, second, third, fourth and fifth anniversaries of the date of the grant. |
As of the date hereof, the Common Shares relating to the Ross Option represent 0.1% of the aggregate number of issued and outstanding Common Shares, on a non-diluted basis. The other terms and conditions relating to the exercise of the Ross Option shall be governed by the provisions of the Plan.
The following table provides a summary of the value vested or earned during Fiscal 2010:
| | | | | | |
Name | | Option-based
Awards –
Value Vested
During the Year
($) | | Share-based
Awards –
Value Vested
During the Year
($) | | Non-Equity Incentive Plan
Compensation – Value
Earned During the Year
($) |
Larry Rossy
CEO | | — | | — | | 1,110,000 |
| | | |
Nicholas Nomicos
Former Senior Vice President, Interim CFO and Secretary | | — | | — | | — |
| | | |
Stéphane Gonthier
COO | | 299,613 | | — | | 525,000 |
| | | |
Neil Rossy
Chief Merchandising Officer | | 641,935 | | — | | 525,000 |
44
| | | | | | |
Name | | Option-based
Awards –
Value Vested
During the Year
($) | | Share-based
Awards –
Value Vested
During the Year
($) | | Non-Equity Incentive Plan
Compensation – Value
Earned During the Year
($) |
Geoffrey Robillard
Senior Vice President, Import Division | | 1,283,887 | | — | | 1,000,000 |
Pension Benefits
Certain executive officers (other than the CFO) participate in the pension benefit plan of the Partnership, a registered defined contribution plan (the “Pension Plan”). Under the terms of the Pension Plan, the Partnership will match an eligible employee’s contribution thereto, up to a maximum of $3,000 per year.
The table below provides the payments or benefits payable to the executive officers at, following or in connection with retirement pursuant to the Pension Plan:
| | | | | | | | |
Name | | Accumulated
Value at
Start of Year
($) | | Compensatory
($) | | Non-Compensatory
($) | | Accumulated
Value at
End of Year
($) |
Larry Rossy,
CEO | | — | | — | | — | | — |
| | | | |
Nicholas Nomicos,
Former Senior Vice President, Interim CFO and Secretary | | — | | — | | — | | — |
| | | | |
Stéphane Gonthier,
COO | | 10,254 | | 3,000 | | 4,498 | | 18,338 |
| | | | |
Neil Rossy,
Chief Merchandising Officer | | — | | 3,000 | | 3,362 | | 6,573 |
| | | | |
Geoffrey Robillard,
Senior Vice President, Import Division | | — | | 3,000 | | — | | 6,633 |
Director Compensation
The independent directors of the Partnership, as well as Gregory David, will each receive an annual cash retainer of $30,000. Each such independent director and Gregory David will also be granted 2,000 options to purchase Common Shares of Dollarama Inc. each year. In addition, the chairs of the Audit Committee and the Compensation Committee will each receive an additional annual cash retainer fee of $5,000. The members of the Audit Committee and the Compensation Committee will also receive a fee of $1,000 per committee meeting attended.
The following table provides information regarding the compensation provided to the directors for Fiscal 2010:
| | | | | | | | | | | | | | |
Name and Principal Position (a) | | Fees Earned(1)
($)
(c) | | Share-
based
Award
($) | | Option-
based
Award(2)
($)
(d) | | Non-equity
Incentive Plan
Compensation
($)
(e) | | Pension
Value
($) | | All Other
Compensation
($)
(f) | | Total
Compensation
($)
(g) |
Gregory David(3) | | 16,000 | | — | | 17,780 | | — | | — | | — | | 33,780 |
| | | | | | | |
Donald Gray Reid(4)(6) | | — | | — | | — | | — | | — | | — | | — |
| | | | | | | |
John J. Swidler(5)(7) | | 7,500 | | — | | 22,780 | | — | | — | | — | | 30,280 |
45
| | | | | | | | | | | | | | |
Name and Principal Position (a) | | Fees Earned(1)
($)
(c) | | Share-
based
Award
($) | | Option-
based
Award(2)
($)
(d) | | Non-equity
Incentive Plan
Compensation
($)
(e) | | Pension
Value
($) | | All Other
Compensation
($)
(f) | | Total
Compensation
($)
(g) |
Stephen Gunn(6)(8)(9)(10) | | 17,250 | | — | | 17,780 | | — | | — | | — | | 35,030 |
| (1) | No compensation is paid to the directors who are also members of management or non-independent. |
| (2) | The value of the option-based awards reflects the fair value of options granted on the dates of grant, being $8.89 for both Gregory David and Stephen Gunn and $11.39 for John J. Swidler. The fair value was computed using the Black-Scholes option pricing model with the following assumptions: a) average risk-free interest rate of 3%; b) expected life of six (6) years; c) expected volatility of 50%; and d) no expected dividend payments. The Black-Scholes model was used to compute option fair values because it is the most commonly used share-based award pricing model and is considered to produce a reasonable estimate of fair value. There is no difference between the fair value in accordance with the CICA Handbook Section 3870 calculated by use of the Black-Scholes option pricing model and the amount accounted for of the date the options were granted. |
| (3) | Gregory David resigned from his position as member of the Audit Committee on January 5, 2010. |
| (4) | Donald Grey Reid was appointed to the Board of Directors and as member of the Audit Committee on February 17, 2010 in replacement of Todd Cook. |
| (5) | John J. Swidler was appointed to the Board of Directors and as member of the Audit Committee on January 5, 2010 in replacement of respectively Felipe Merry del Val Barbavara di Gravellona and Gregory David. On the same day, John J. Swidler was also appointed chair of the Audit Committee in replacement of Stephen Gunn. |
| (6) | Member of the Audit Committee. |
| (7) | Chair of the Audit Committee. |
| (8) | Stephen Gunn was appointed to the Compensation Committee on February 17, 2010, in replacement of Todd Cook. |
| (10) | Stephen Gunn was appointed Lead Director, member and chair of the Audit Committee on October 16, 2009. Stephen Gunn resigned as chair of the Audit Committee on January 5, 2010 when he was replaced by John J. Swidler. |
C. Board practices.
Reference is made to “Item 6 – Directors, Senior Management and Employees – A. Directors and senior management” for the current term of office, if applicable, and the period during which the Partnership’s directors and senior management have served in that office. No director has any contract or arrangement with the Partnership entitling him to benefits upon termination of his directorship.
Board Committees
There are two committees of the Board of Directors: the Audit Committee and the Compensation Committee.
Composition of the Audit Committee
The Audit Committee members are currently John J. Swidler, Chair, Stephen Gunn and Donald Gray Reid. Each member of the Audit Committee is independent and financially literate, within the meaning of National Instrument 52-110 – Audit Committees.
Charter of the Audit Committee
The Board of Directors has adopted a written charter for the Audit Committee, which sets out the Audit Committee’s responsibilities, which include reviewing the financial statements of the Partnership and reporting on such review to the Board of Directors, ensuring that adequate procedures are in place for the review of the Partnership’s public disclosure documents that contain financial information, overseeing the work and reviewing the independence of the external auditors and reviewing, evaluating and approving the internal control procedures that are implemented and maintained by management.
Relevant Education and Experience of the Audit Committee Members
Each of the Audit Committee members has an understanding of the accounting principles used to prepare financial statements and varied experience as to the general application of such accounting principles, as well as an understanding of the internal controls and procedures necessary for financial reporting.
In addition to each Audit Committee member’s general business experience, the education and experience of each Audit Committee member that is relevant to the performance of his responsibilities as an Audit Committee member is as follows:
John J. Swidler (Chair)
Mr. Swidler has been a director of Reitmans (Canada) Limited since April 2, 2008. He is also a Senior Advisor of the Montréal office of RSM Richter LLP. He was the Managing Partner of RSM Richter LLP from 1996 to January 1, 2007 and was Chairman of the firm’s executive committee from 1982 to 1996. Mr. Swidler graduated from McGill University with a Bachelor of Commerce degree and obtained his designation as a Chartered Accountant. He also received a Bachelor of Civil Law degree from McGill University. He received his Fellow Chartered Accountant (FCA) designation from the Ordre des comptables agréés du Québec in 1992.
46
Stephen Gunn
Mr. Gunn serves as Chair of the Board of Directors and Chief Executive Officer of Sleep Country Canada. He was a Director of Golf Town from 2005 to 2007 and a Director of Connors Bros. from 2004 to 2007. He has a Bachelor of Electrical Engineering from Queens University and a Master of Business Administration from the University of Western Ontario.
Donald Gray Reid
Mr. Reid has over 26 years of experience with the Weston/Loblaw group of companies, including positions as President and CEO of President’s Choice Bank, CFO of George Weston Limited and Executive Vice President of Loblaw Companies Limited. Mr. Reid is currently Vice Chairman of the Nature Conservancy of Canada. Mr. Reid graduated from Queen’s University with a Bachelor of Science degree (honours), a Master of Science and a Master of Business Administration.
Compensation Committee
The Compensation Committee is composed of three (3) directors, Joshua Bekenstein, Matthew Levin and Stephen Gunn, of whom only Stephen Gunn is independent. Joshua Bekenstein acts as chair of the Compensation Committee. Each of these directors has a wealth of experience designing effective management incentive and compensation plans, which attract and retain highly qualified executives, and which align the CEO and other executives’ performance objectives with those of our stakeholders.
The Compensation Committee is charged with overseeing the administration of the Partnership’s compensation plans, assisting the Board of Directors with its responsibilities in regard of our senior executive officers’ compensation, and reviewing and approving the disclosure of executive compensation as required by securities laws before such disclosure is disseminated to the public. As part of its oversight of the implementation of the Partnership’s compensation plans, the Compensation Committee reviews and makes recommendations to the Board of Directors with respect to the adoption or amendment of incentive and equity-based compensation plans for the Partnership. The Compensation Committee annually reviews and approves the corporate goals and objectives relevant to the compensation of the CEO and other senior executive officers and evaluates their performance in light of these goals and objectives.
The Compensation Committee approves the compensation for the senior executive officers and makes recommendations to the Board regarding the CEO’s compensation package. In setting compensation, the Compensation Committee considers all factors it deems relevant including the Partnership’s performance and relative shareholder return, the value of proposed incentive awards to those with similar responsibilities at comparable companies, and the awards given by the Partnership in prior years. In fulfilling its responsibilities, the Compensation Committee may retain external compensation consultants for assistance in their evaluation. The Compensation Committee has adopted a written charter describing the mandate of such committee.
The Compensation Committee’s responsibilities include the following:
| | (a) | reviewing and approving and then recommending to the Board of Directors the compensation of the CEO and other senior executive officers of the Partnership; |
| | (b) | reviewing and approving corporate goals and objectives relevant to the CEO’s and other senior executive officers’ compensation including the evaluation of the CEO’s and senior executive officers’ performance in light of those goals and objectives and determining their respective compensation packages based on these evaluations; |
| | (c) | designing, establishing and overseeing the Partnership’s executive compensation policy; |
| | (d) | reviewing and approving annually the compensation discussion and analysis to be included in Dollarama Inc.’s management proxy circular; |
| | (e) | reviewing, at least annually, compensation market data and competitor benchmark data to attract and retain human resources needed; |
| | (f) | making recommendation to the Board of Directors with respect to the Partnership’s management option plan and such other compensation plans or structures to be adopted by the Partnership from time-to-time; and |
| | (g) | making recommendation regarding the Partnership’s overall compensation philosophy and strategy. |
47
D. Employees.
As of January 31, 2010 we employed approximately 12,764 retail employees, including full-time, part-time, and temporary employees. We also employed 166 head office employees and 109 warehouse and distribution center employees. In addition, we hire seasonal employees during busy seasons such as Christmas, which provides us with greater flexibility in our workforce and allows us to better address busier peak periods. None of our employees is a party to a collective bargaining agreement or represented by a labor union.
E. Share ownership.
No member of the Board of Directors owns limited partnership units of Holdings. Holding’s parent, Dollarama Inc., and Holdings general partner, Dollarama Group Holdings GP ULC, own all of the outstanding limited partnership units of Holdings. Holdings general partner is wholly-owned by Dollarama Inc. For a summary of the major shareholders of Dollarama Inc., including the shares held by members of the Board of Directors and senior management as a group, see “Item 7. Major Shareholders and Related Party Transactions – Major shareholders.”
| Item 7. | MAJOR SHAREHOLDERS AND RELATED PARTY TRANSACTIONS |
A. Major shareholders.
Holding’s parent, Dollarama Inc., and Holdings general partner, Dollarama Group Holdings GP ULC, own all of the outstanding limited partnership units of Holdings. Holdings general partner is wholly-owned by Dollarama Inc. As of April 28, 2010, there were 73,104,831 Common Shares of the Dollarama Inc. issued and outstanding. To the knowledge of the directors and officers, the only person who owns, directly or indirectly, or exercises control or direction over more than 10% of the outstanding Common Shares of Dollarama Inc. and the number of shares of Common Shares of Dollarama Inc. that the directors and senior management beneficially own or control or direct, directly or indirectly, as of April 28, 2010 is as follows:
| | | | |
Name | | Number of Common
Shares | | Percentage of
Outstanding Shares |
Bain Dollarama (Luxembourg) One S.à r.l. | | 22,037,446 | | 30.1% |
| | |
Directors and members of senior management as a group | | 5,333,606 | | 7.3% |
Since the consummation of the IPO, the ownership of Common Shares of Dollarama Inc. by funds advised by Bain Capital has decreased from 80% to 30.1% as of April 28, 2010. The funds advised by Bain Capital do not have different voting rights compared to other persons who hold Common Shares of Dollarama Inc.
B. Related party transactions.
The Board of Directors reviews and approves transactions between the Partnership on the one hand and a related party, such as our directors, officers, holders of more than five percent of our voting securities and their affiliates, the immediate family members of any of the foregoing persons and any other persons whom the board determined may be considered a related party, on the other hand. Prior to board consideration of a transaction with a related party, the material facts as to the related party’s relationship or interest in the transaction are disclosed to the board, and the transaction is not considered approved by the board unless a majority of the directors who are not interested in the transaction approve the transaction. We believe each of the transactions set forth below were made on terms no less favorable to us than could have been otherwise obtained from unaffiliated third parties.
Termination of Management Agreement
In connection with the Acquisition, Dollarama Group Holdings L.P. entered into a management agreement with funds advised by Bain Capital on November 18, 2004 (the “Management Agreement”), pursuant to which funds advised by Bain Capital were providing various consulting and management advisory services to Dollarama. Pursuant to the Management Agreement, we paid to the funds advised by Bain Capital approximately $10.2 million in connection with the structuring of the debt financing in connection with the Acquisition, in addition to expenses incurred in connection therewith. In addition, we paid to the funds advised by Bain Capital an annual management fee of up to $3.0 million in exchange for the ongoing management services.
The Management Agreement between the Partnership and its subsidiaries on one hand, and Bain Capital on the other hand, was terminated effective as of October 16, 2009 in connection with the closing of Dollarama Inc.’s IPO. In connection with such termination, we paid Bain Capital an aggregate one-time fee of $5.0 million. For Fiscal 2010, we incurred management fees and related expenses of approximately $7.5 million
48
Shareholders Agreement
As of the date hereof, Dollarama Inc., 4411145 Canada Inc., Bain Dollarama (Luxembourg) One S.à r.l., an entity indirectly owned by funds advised by Bain Capital, The Larry and Cookie Rossy Family Foundation, The Alan & Roula Rossy Family Foundation, The Leonard T. Assaly Family Foundation, 3457745 Canada Inc. and Edmund Rossy Holdings Ltd. are parties to a shareholders agreement (the “Shareholders Agreement”). The Shareholders Agreement has a term of three (3) years, commencing on the date of the closing of the IPO on October 16, 2009, and provides for an obligation of consultation and coordination among the parties prior to any sale of the Common Shares of Dollarama Inc.
Advisory Agreement
Dollarama Inc. and its affiliates entered into an advisory agreement with funds advised by Bain Capital for financial and structure advice and analysis, as well as assistance with due diligence investigations and negotiations in consideration of a one-time fee of $1.0 million that was paid on October 16, 2009, the whole solely in connection with the closing of the IPO on such date.
Real Property Leases
We currently lease 18 stores and five warehouses and our distribution center from entities controlled by Larry Rossy, pursuant to long-term lease agreements. Rental expenses associated with these related-party leases are established at market terms and represented an aggregate amount of approximately $9.8 million for Fiscal 2010.
C. Interests of experts and counsel.
Not Applicable.
| Item 8. | FINANCIAL INFORMATION |
A. Consolidated statements and other financial information.
The financial statements filed as part of this annual report are filed under Item 18.
B. Significant changes.
Other than as disclosed elsewhere in this annual report, no significant change has occurred since the date of the annual financial statements.
C. Legal Proceedings
We are from time to time involved in legal proceedings of a nature considered normal to our business. We believe that none of the litigation in which we are currently involved, individually or in the aggregate, is material to our consolidated financial condition or results of operations.
| Item 9. | THE OFFER AND LISTING |
Not applicable.
| Item 10. | ADDITIONAL INFORMATION |
A. Share capital.
Not applicable.
B. Memorandum and articles of association.
The following is a description of the material terms of the limited partnership agreement of Holdings (the “Limited Partnership Agreement”) and is qualified in its entirety by reference to all of the provisions of the Limited Partnership Agreement. Because this description is only a summary of the terms of the Limited Partnership Agreement, it does not contain all of the information that you may find useful. For more complete information, you should read the Limited Partnership Agreement which is available electronically on the website of the Securities and Exchange Commission at www.sec.gov.
49
Formation, Duration and Capital Structure
Holdings is a limited partnership that was formed under the laws of Québec, Canada in December 7, 2006. Holdings has a perpetual existence and will continue as a limited partnership unless the partnership is terminated or dissolved in accordance with the Limited Partnership Agreement. Holdings has an unlimited partnership interests, which are denominated in units (each a “Unit” and collectively, the “Units”). No Unit has any preference or priority of privilege of right over any other Unit. Holders of the Units are not entitled to the withdrawal or return of capital contributions in respect of the Units, except to the extent, if any, that distributions are made to such holders pursuant to the Limited Partnership Agreement, upon the liquidation of Holdings or as otherwise required by applicable law. Holders of the Units are not granted any preemptive or other similar right to acquire additional interests in Holdings. In addition, holders of the Units do not have any right to have their Units redeemed by Holdings. The general partner of Holdings (the “General Partner”) has broad rights to cause Holdings to issue additional Units and may cause Holdings to issue additional Units for any partnership purpose, at any time and on such terms and conditions as it may determine without the approval of any Limited Partners (as defined in the Limited Partnership Agreement).
Nature and Purpose
Section 2.5 of the Limited Partnership Agreement provides that Holdings may engage in any lawful activity, without restriction, within any jurisdiction in the world, without restriction.
Termination and Dissolution
Holdings shall continue indefinitely until dissolved in accordance with the Civil Code of Québec or upon consent to such dissolution by the Partners (as defined in the Limited Partnership Agreement) holding at least two-thirds ( 2/3) of the total number of Units issued and outstanding at such time.
Distributions
The General Partner will determine the amount and timing of any distribution. The General Partner may not determine or pay any distribution in cash unless Holdings has made all payments due and payable, or set aside funds or property for such purposes, in connection with the timely service of any indebtedness of Holdings for borrowed money, including debt service, capital lease payments and fee payments, and all indebtedness of Holdings to any of the General Partner and any of the Partners or their affiliates, respectively.
No Management or Control
Holdings’ Limited Partners, in their capacities as such, may not take part in the management or control of the activities and affairs of Holdings and do not have any right or authority to act for or to bind Holdings or to take part or interfere in the conduct or management of Holdings.
Amendment of the Limited Partnership Agreement
The General Partner may, without notice to or consent of other Partners, amend the Limited Partnership Agreement (a) to add any provision which, in the opinion of counsel for Holdings, is for the protection of the Limited Partners; (b) to clear any ambiguity or to correct or supplement a provision in the Limited Partnership Agreement which, in the opinion of counsel for Holdings, may be defective or inconsistent with any other provision thereof; or (c) to give effect to any legislative or regulatory change if, in the opinion of counsel for Holdings, such change is necessary.
The Limited Partnership Agreement can be amended by the General Partner if such amendment is authorized by the consent of the Partners holding at least two-thirds ( 2/3) of the total number of Units issued and outstanding at such time.
No Limited Partner Approval
Subject to applicable law, the General Partner has broad power and authority under the Limited Partnership Agreement to generally manage the affairs of Holdings.
Withdrawal of the General Partner
The General Partner may resign as such upon written notice to all other Partners, such resignation to be effective upon the earlier of the date of effectiveness stated in such notice or the date of appointment of a new General Partner by the Partners.
Transactions with Competitors; Conflicts of Interest
The General Partner and a Limited Partner and any of its affiliates may engage in or hold a direct or indirect interest in any other business, venture, investment or activity whether or not similar to or in competition with the business of Holdings. Holdings may, subject to the other provisions of the Limited Partnership Agreement and the obtaining, as the case may be, of required regulatory approvals, conclude any transaction that it deems appropriate with the General Partner or its affiliates.
50
C. Material contracts.
The following is a summary of each material contract, other than material contracts entered into in the ordinary course of business, to which we are a party, for the two years immediately preceding the date of this annual report. The summaries are qualified in their entirety by the terms of the specific contracts, each of which is included in the list of exhibits in Item 19.
Amendments Nos. 5 and 6, dated September 22, 2009 and October 21, 2009, respectively, to the Credit Agreement, dated November 18, 2004, by and among Dollarama Group L.P., Aris Import Inc., Dollarama Holdings L.P., the lenders named therein, and the Administrative Agent (as defined therein).
On November 18, 2004 Group L.P. and Aris Import Inc. and Holdings L.P. entered into a senior credit agreement with a group of lenders for the Credit Facility. See “Item 5 – Operating and Financial Review of Prospects – Debt and Commitments.” On September 22, 2009, we entered into Amendment No. 5 to the Credit Facility which permits us to refinance the existing revolving credit facility under the Credit Facility with a new revolving credit facility on the same terms as the existing revolving credit facility, except that the new revolving credit facility may have a later maturity date and may have a different interest rate. On October 21, 2009 we entered into Amendment No. 6 to the Credit Facility which provides a new $75.0 million secured revolving credit facility, which matures in July 2012 and otherwise has the same terms, pricing, covenants, guarantees and security as the existing secured revolving credit facility.
Termination of Management Agreement
In connection with the Acquisition, Holdings entered into the Management Agreement with funds advised by Bain Capital on November 18, 2004, pursuant to which funds advised by Bain Capital provide various consulting and management advisory services to the Partnership. Pursuant to the Management Agreement, the Partnership paid to the funds advised by Bain Capital approximately $10.2 million in connection with the structuring of the debt financing in connection with the Acquisition, in addition to expenses incurred in connection therewith. In addition, we paid to the funds advised by Bain Capital an annual management fee of up to $3.0 million in exchange for the ongoing management services that it provides under the Management Agreement, together with all reasonable expenses incurred in connection therewith. For Fiscal 2009 we incurred management fees and related expenses of $3.3 million, pursuant to such arrangements.
The Management Agreement was terminated effective as of the date of closing of the initial public offering of Dollarama Inc. in consideration of the payment by Dollarama Inc. to the funds advised by Bain Capital of an aggregate amount of $5.0 million, the whole pursuant to a termination agreement to be entered into between Dollarama Inc. and funds advised by Bain Capital effective as of such date.
D. Exchange controls.
There are no government laws, decrees or regulations in Canada which restrict the export or import of capital or, subject to the following sentence, which affect the remittance of dividends or other payments to non-resident holders of the shares of Holdings’ parent. However, any such remittance to a resident of the United States is generally subject to non-resident tax pursuant to Article X of the 1980 Canada-United States Income Tax Convention.
There is no limitation imposed by Canadian law or by the charter documents of Holdings on the right of a non-resident to hold voting shares of Holdings, other than as provided by theInvestment Canada Act, as amended (the “Investment Act”), as amended by theNorth American Free Trade Agreement Implementation Act(Canada) (NAFTA), and theWorld Trade Organization (WTO) Agreement Implementation Act. The Investment Act requires notification and, in certain cases, advance review and approval by the Government of Canada of the acquisition by a “non-Canadian” of “control of a Canadian business”, all as defined in the Investment Act. Generally, the threshold for review will be higher in monetary terms for a member of the WTO or NAFTA.
E. Taxation.
Not applicable.
F. Dividends and paying agents.
Not applicable.
G. Statement by experts.
Not applicable.
51
H. Documents on display.
You can read and copy documents referred to in this annual report that have been filed with the SEC at the SEC’s public reference room located at 100 F Street, N.E., Room 1580 Washington, D.C. 20549. Please call the SEC at 1-800-SEC-0330 for further information on the public reference rooms and their copy charges. The SEC also maintains a website at http://www.sec.gov that contains reports and other information that we have filed electronically with the SEC.
I. Subsidiary information.
Our subsidiaries are detailed under “Item 4.—C. Organizational structure
| Item 11. | QUANTITATIVE AND QUALITATIVE DISCLOSURES ABOUT MARKET RISK |
Foreign Exchange Risk
While all of our sales are in Canadian dollars, we have been steadily increasing our purchases of merchandise from low-cost overseas suppliers, including suppliers in China, Brazil, India, Indonesia, Taiwan, Thailand and Turkey. For Fiscal 2009 and Fiscal 2010, this direct sourcing from foreign suppliers accounted for in excess of 50% of our purchases. Accordingly, our results of operations are impacted by the fluctuation of foreign currencies against the Canadian dollar. In particular, we purchase a majority of our imported merchandise from suppliers in China using U.S. dollars. Therefore, our cost of sales is impacted by the fluctuation of the Chinese renminbi against the U.S. dollar and the fluctuation of the U.S. dollar against the Canadian dollar.
We use foreign exchange forward contracts to mitigate the risk from fluctuations in the U.S. dollar relative to the Canadian dollar. The majority of foreign exchange forward contracts are used only for risk management purposes and are designated as hedges of specific anticipated purchases of merchandise. We estimate that in the absence of our currency risk management program, every $0.01 depreciation in the Canadian dollar relative to U.S. dollar exchange rate results in approximately $2.0 million annual decrease in our operating earnings before taxes. The seasonality of our purchases will affect the quarterly impact of this variation. We periodically examine the derivative financial instruments we use to hedge exposure to foreign currency fluctuation to ensure that these instruments are highly effective at reducing or modifying foreign exchange risk associated with the hedged item.
In addition, a majority of our debt is in U.S. dollars. Therefore, a downward fluctuation in the exchange rate of the Canadian dollar versus the U.S. dollar would reduce our funds available to service our U.S. dollar-denominated debt. In absence of foreign exchange hedging of our U.S. dollar-denominated debt, each weakening by one cent of Canadian dollar relative to the US dollar would result in $4.46 million in additional Canadian dollar debt, as well as $0.54 million in additional undiscounted Canadian dollar interest obligations over the remaining life to maturity.
As required by the terms of the Credit Facility, we have entered into foreign currency and interest rate swap agreements with maturities matching those of the underlying debt to minimize our exposure to exchange rate and interest rate fluctuations in respect of our LIBOR-based U.S. dollar-denominated term loans.
Similarly, we had entered into foreign currency swap agreements to minimize our exposure to exchange rate fluctuations in respect of our 8.875% Subordinated Notes. Originally, these foreign currency swap agreements qualified for hedge accounting. However, as the Partnership exercised its call option on the 8.875% Subordinated Notes on October 16, 2009, the foreign currency swap agreements no longer qualify for hedge accounting as of that date.
On December 18, 2008, the Partnership entered into new foreign currency and interest rate swap agreements with its lenders to replace the existing foreign currency and interest rate swap agreements with a maturity date of January 30, 2009. The new currency and interest rate swap does not qualify for hedge accounting.
In addition, the December 18, 2008 swap agreement enables the Partnership to convert the interest rate on the debt from US dollar LIBOR to Canadian bankers’ acceptance rate and fix the exchange rate on these payments at 1.20. The agreement provides for the Partnership to pay interest on the stated notional amount at a variable rate of Canadian bankers’ acceptance rate plus 2.5% (in Canadian dollars) and to receive interest at LIBOR plus 1.75% (in U.S. dollars) with a fixed US/Canadian dollar conversion rate of 1.20.
On November 17, 2009, the Partnership amended an existing foreign currency and interest rate swap agreement with one of its lenders from a fixed-for-fixed rate swap arrangement to a floating-for-floating rate swap arrangement. The amended agreement provides for the Partnership to pay interest on the stated notional amount at a variable rate of Canadian bankers’ acceptance rate plus 0.3% (in Canadian dollars) and to receive interest at LIBOR (in U.S. dollars) with a fixed U.S./Canadian dollar conversion rate of 1.15.
52
On January 26, 2010, the Partnership entered into new foreign currency and interest rate swap agreements with its lenders to replace the existing foreign currency and interest rate swaps with a maturity date of January 29, 2010. The new currency and interest rate swaps do not qualify for hedge accounting.
The January 26, 2010 swap agreements enable the Partnership to convert the interest rate on the debt from U.S. dollar LIBOR to Canadian bankers’ acceptance rate and fix the exchange rate on these payments at 1.19. The agreements provide for the Partnership to pay interest on the stated notional amount at a variable rate of Canadian bankers’ acceptance rate plus 2.3% (in Canadian dollars) and to receive interest at LIBOR plus 1.75% (in U.S. dollars) with a fixed U.S./Canadian dollar conversion rate of 1.19.
Interest Rate Risk
We use variable-rate debt to finance a portion of our operations and capital expenditures. These obligations expose us to variability in interest payments due to changes in interest rates. We have approximately $250.6 million in term loans outstanding under the Credit Facility based on the exchange rate on January 31, 2010, bearing interest at variable rates. Each quarter point change in interest rates would result in a $0.6 million change in interest expense on such term loans. We also have an existing revolving loan facility which provides for borrowings of up to $75.0 million which bears interest at variable rates. Assuming the entire revolver is drawn, each quarter point change in interest rates would result in a $0.2 million change in interest expense on our existing revolving loan facility.
We also have approximately $226.9 million of Deferred Interest Notes based on the exchange rate on January 31, 2010, bearing interest at variable rates. Each quarter point change in interest rates would result in a $0.6 million change in interest expense on the notes.
| Item 12. | DESCRIPTION OF SECURITIES OTHER THAN EQUITY SECURITIES |
Not applicable.
PART II
| Item 13. | DEFAULTS, DIVIDEND ARREARAGES AND DELINQUENCIES |
None.
| Item 14. | MATERIAL MODIFICATIONS TO THE RIGHTS OF SECURITY HOLDERS AND USE OF PROCEEDS |
None.
| Item 15. | CONTROLS AND PROCEDURES |
A. Evaluation of Disclosure Controls and Procedures
As of January 31, 2010, the end of the period covered by this annual report, our management performed, under the supervision and with the participation of the Partnership’s chief executive officer and chief financial officer, an evaluation of the effectiveness of the design and operation of the Partnership’s disclosure controls and procedures, as defined in Rules 13a-15(e) and 15d-15(e) under the Securities Exchange Act of 1934 (the “Exchange Act”). Disclosure controls and procedures are those controls and procedures designed to provide reasonable assurance that the information required to be disclosed in our Exchange Act filings is (i) recorded, processed, summarized and reported within the time periods specified in the SEC’s rules and forms, and (ii) accumulated and communicated to management, including the Partnership’s chief executive officer and chief financial officer, as appropriate, to allow timely decisions regarding required disclosure. Based on that evaluation, the Partnership’s chief executive officer and chief financial officer have concluded that, as of January 31, 2010, the Partnership’s disclosure controls and procedures were effective as of January 31, 2010.
B. Management’s Annual Report on Internal Control over Financial Reporting
Management of the Partnership is responsible for establishing and maintaining adequate internal control over financial reporting as defined in Rules 13a-15(f) and 15d-15(f) under the Exchange Act. Internal control over financial reporting is a process designed by, or under the supervision of, the president and chief executive officer and the senior vice president and chief financial officer to provide reasonable assurance regarding the reliability of financial reporting and the preparation of financial statements for external purposes in accordance with Canadian generally accepted accounting principles, including a reconciliation to United States generally accepted accounting principles.
53
Management conducted an assessment of the effectiveness of the Partnership’s internal control over financial reporting, as at January 31, 2010 based on the framework and criteria established inInternal Control–Integrated Framework, issued by the Committee of Sponsoring Organizations of the Treadway Commission (COSO). Based on that assessment, management has concluded that the Partnership’s internal control over financial reporting was effective as at January 31, 2010.
The effectiveness of the Partnership’s internal control over financial reporting as of January 31, 2010 has been audited by PricewaterhouseCoopers LLP, independent auditors, as stated in their report, which is included in the Consolidated Financial Statements filed herewith.
C. Changes in Internal Control over Financial Reporting
There were no changes in internal control over financial reporting that occurred during Fiscal 2010, the period covered by this annual report on Form 20-F, that have materially affected, or are reasonably likely to materially affect the Partnership’s internal control over financial reporting.
| Item 16A. | AUDIT COMMITTEE FINANCIAL EXPERT |
Our Board of Directors determined that John J. Swidler is an “audit committee financial expert,” as defined by the regulations of the Commission issued pursuant to Section 407 of the Sarbanes-Oxley Act of 2002 and meeting the requirements of Item 16A. He is “independent,” as such term is defined in Rule 10A-3 under the Exchange Act.
Our parent, Dollarama Inc. has a written code of conduct (the “Code of Conduct”) that applies to all directors, officers, head office management and employees, warehouse management, distribution centre management, field management and store management, including those employed by subsidiaries.
The objective of the Code of Conduct is to provide guidelines for maintaining the integrity, reputation, honesty, objectivity and impartiality of the Partnership and its business units. The Code of Conduct addresses conflicts of interest, protecting the assets, confidentiality, fair dealing with the security holders, customers, suppliers, competitors and employees, insider trading, compliance with laws and reporting any illegal or unethical behavior. As part of our Code of Conduct, any person subject to the Code of Conduct is required to avoid or fully disclose interests or relationships that are harmful or detrimental to the Partnership’s best interests or that may give rise to real potential or the appearance of conflicts of interest. The board of directors of Dollarama Inc., or the persons or committee appointed, have the ultimate responsibility for the stewardship of the Code of Conduct. Procedures have been established to allow directors, officers and employees to report breaches of the Code of Conduct or any illegal or unethical behavior anonymously to the CFO.
The Code of Conduct and Ethics is filed with the Canadian securities regulatory authorities on SEDAR at http://www.sedar.com.
| Item 16C. | PRINCIPAL ACCOUNTANT FEES AND SERVICES |
The table below shows the aggregate fees billed by our principal accountant for professional services rendered in connection with the audit of our annual financial statements for the fiscal years ended January 31, 2010 and February 3, 2009; and the review of our unaudited quarterly financial statements set forth in our Quarterly Reports on Form 10-Q for each of our fiscal quarters, as well as fees paid to our principal accountant for audit-related work, tax compliance, tax planning and other consulting services. The Audit Committee approves all engagements of our principal accountant in advance, including approval of related fees.
54
| | | | | | |
| | | Fiscal 2010 | | Fiscal 2009 |
Audit Fees(1) | | $ | 582,000 | | $ | 500,000 |
Audit-Related Fees | | $ | — | | | — |
Tax Fees(2) | | $ | 187,000 | | $ | 68,000 |
All Other Fees(3) | | $ | 154,000 | | $ | 108,000 |
| | | | | | |
Total fees | | $ | 923,000 | | $ | 676,000 |
| | | | | | |
| (1) | “Audit Fees” include fees for the integrated audit of the Partnership’s annual financial statements that are included in the Annual Report on Form 20-F in Fiscal 2010, Form 10-K in Fiscal 2009 and review of interim financial statements included in the Partnership’s quarterly reports for both years filed on Form 10-Q. |
| (2) | “Tax Fees” include fees for all tax services other than those included in “Audit Fees” and “Audit-Related Fees”. This category includes fees for tax compliance, tax advice and tax planning. |
| (3) | “Other Fees” include fees for products and services provided by the auditor other than those included above. Represents primarily fees related to internal controls assessment. |
| Item 16D. | EXEMPTIONS FROM THE LISTING STANDARDS FOR AUDIT COMMITTEES |
Not applicable.
| Item 16E. | PURCHASES OF EQUITY SECURITIES BY THE ISSUER AND AFFILIATED PURCHASERS |
Not applicable.
| Item 16F. | CHANGE IN REGISTRANT’S CERTIFYING ACCOUNTANT |
None.
| Item 16G. | CORPORATE GOVERNANCE |
Not applicable.
PART III
| Item 17. | FINANCIAL STATEMENTS |
Not applicable.
| Item 18. | FINANCIAL STATEMENTS |
The audited Consolidated Financial Statements commence on page F-1 of this annual report.
55
| Item 19. | EXHIBITS AND FINANCIAL STATEMENT SCHEDULES |
Report of Independent Auditors
on the Condensed Financial Information
To the Partners
of Dollarama Group Holdings L.P.
Our audits of the consolidated financial statements and of effectiveness of internal control over financial reporting referred to in our report dated April 29, 2010 appearing in the 2010 Annual Report on Form 20-F of Dollarama Group Holdings L.P. also included an audit of the condensed financial information included in Item 19 of this Form 20-F. In our opinion, the condensed financial information presents fairly, in all material respects, the information set forth therein when read in conjunction with the related consolidated financial statements.

Montréal, Canada
April 29, 2010
| 1 | Chartered accountant auditor permit No. 19653 |
56
Dollarama Group Holdings L.P.
Schedule I – Condensed Financial Information
Dollarama Group Holdings L.P.
Balance Sheet
(expressed in thousands of Canadian dollars)
| | | | | | | | |
| | | As of
January 31,
2010
$ | | | As of
February 1,
2009
$ | | As of
February 3,
2008
$ | |
Assets | | | | | | | | |
Current assets | | | | | | | | |
Cash and cash equivalents | | 29 | | | 18 | | 14 | |
Income taxes recoverable | | 59 | | | 25 | | 18 | |
Deposits and prepaid expenses | | 5 | | | 5 | | 0 | |
| | | | | | | | |
| | 93 | | | 48 | | 32 | |
Investment in subsidiaries | | 917,687 | | | 684,561 | | 513,150 | |
| | | | | | | | |
| | 917,780 | | | 684,609 | | 513,182 | |
| | | | | | | | |
Liabilities | | | | | | | | |
Current liabilities | | | | | | | | |
Accounts payable | | 914 | | | 862 | | 590 | |
Accrued interest | | 2,121 | | | 2,910 | | 2,978 | |
| | | | | | | | |
| | 3,035 | | | 3,772 | | 3,568 | |
Long-term debt, net of debt issue costs (note 2) | | 223,425 | | | 244,367 | | 178,453 | |
| | | | | | | | |
| | 226,460 | | | 248,139 | | 182,021 | |
| | | | | | | | |
Commitments, contingencies and guarantee | | | | | | | | |
Partners’ Capital | | | | | | | | |
General partner | | 544 | | | 374 | | 374 | |
Limited partner | | 359,813 | | | 161,725 | | 163,158 | |
Contributed surplus | | 8,990 | | | 3,390 | | 2,649 | |
Retained earnings | | 335,625 | | | 211,520 | | 172,504 | |
Accumulated other comprehensive income (loss) | | (13,652 | ) | | 59,461 | | (7,524 | ) |
| | | | | | | | |
| | 691,320 | | | 436,470 | | 331,161 | |
| | | | | | | | |
| | 917,780 | | | 684,609 | | 513,182 | |
| | | | | | | | |
The accompanying notes are an integral part of the condensed financial information.
57
Dollarama Group Holdings L.P.
Schedule I – Condensed Financial Information (Continued)
Dollarama Group Holdings L.P.
Statement of Partners’ Capital
(expressed in thousands of Canadian dollars)
| | | | | | | | | | | | | | | |
| | | General
partner
capital
$ | | Limited
partner
capital
$ | | | Contributed
surplus
$ | | Retained
earnings
$ | | Accumulated
other
comprehensive
income (loss)
$ | | | Total
$ | |
Balance – February 4, 2007 | | 374 | | 167,103 | | | 1,337 | | 83,635 | | 6,782 | | | 259,231 | |
| | | | | | | | | | | | | | | |
Net earnings for the year | | — | | — | | | — | | 88,869 | | — | | | 88,869 | |
Other comprehensive loss | | | | | | | | | | | | | | | |
Unrealized loss on derivative financial instruments, net of reclassification adjustments | | — | | — | | | — | | — | | (14,306 | ) | | (14,306 | ) |
| | | | | | | | | | | | | | | |
| | | | | | |
Total comprehensive income | | | | | | | | | | | | | | 74,563 | |
| | | | | | | | | | | | | | | |
Stock-based compensation | | — | | — | | | 1,312 | | — | | — | | | 1,312 | |
Capital distributions | | — | | (3,945 | ) | | — | | — | | — | | | (3,945 | ) |
| | | | | | | | | | | | | | | |
Balance – February 3, 2008 | | 374 | | 163,158 | | | 2,649 | | 172,504 | | (7,524 | ) | | 331,161 | |
| | | | | | | | | | | | | | | |
Transition adjustment on adoption of inventory standard | | — | | — | | | — | | 15,013 | | — | | | 15,013 | |
| | | | | | | | | | | | | | | |
Balance – February 3, 2008 – Adjusted | | 374 | | 163,158 | | | 2,649 | | 187,517 | | (7,524 | ) | | 346,174 | |
Net earnings for the year | | — | | — | | | — | | 24,003 | | — | | | 24,003 | |
Other comprehensive income | | | | | | | | | | | | | | | |
Unrealized gain on derivative financial instruments, net of reclassification adjustments | | — | | — | | | — | | — | | 66,985 | | | 66,985 | |
| | | | | | | | | | | | | | | |
| | | | | | |
Total comprehensive income | | | | | | | | | | | | | | 90,988 | |
| | | | | | | | | | | | | | | |
| | | | | | |
Stock-based compensation | | — | | — | | | 741 | | — | | — | | | 741 | |
Capital distributions | | — | | (1,433 | ) | | — | | — | | — | | | (1,433 | ) |
| | | | | | | | | | | | | | | |
Balance – February 1, 2009 | | 374 | | 161,725 | | | 3,390 | | 211,520 | | 59,461 | | | 436,470 | |
| | | | | | | | | | | | | | | |
Net earnings for the year | | — | | — | | | — | | 124,105 | | — | | | 124,105 | |
Other comprehensive loss | | | | | | | | | | | | | | | |
Unrealized loss on derivative financial instruments, net of reclassification adjustments | | — | | — | | | — | | — | | (73,113 | ) | | (73,113 | ) |
| | | | | | | | | | | | | | | |
| | | | | | |
Total comprehensive income | | — | | — | | | — | | — | | — | | | 50,992 | |
| | | | | | | | | | | | | | | |
| | | | | | |
Issuance of partnership units | | 170 | | 204,543 | | | — | | — | | — | | | 204,713 | |
Stock-based compensation | | — | | — | | | 5,600 | | — | | — | | | 5,600 | |
Capital distributions | | — | | (6,455 | ) | | — | | — | | — | | | (6,455 | ) |
| | | | | | | | | | | | | | | |
Balance –January 31, 2010 | | 544 | | 359,813 | | | 8,990 | | 335,625 | | (13,652 | ) | | 691,320 | |
| | | | | | | | | | | | | | | |
The accompanying notes are an integral part of the condensed financial information.
58
Dollarama Group Holdings L.P.
Schedule I – Condensed Financial Information (Continued)
Dollarama Group Holdings L.P.
Statement of Earnings
(expressed in thousands of Canadian dollars)
| | | | | | | | | |
| | | For the
year ended
January 31,
2010
$ | | | For the
year ended
February 1,
2009
$ | | | For the
year ended
February 3,
2008
$ | |
General, administrative and store operating expenses | | 24 | | | 26 | | | 2 | |
| | | | | | | | | |
| | 24 | | | 26 | | | 2 | |
| | | | | | | | | |
Operating loss | | | | | | | | | |
Interest expense | | 19,485 | | | 20,877 | | | 24,479 | |
Foreign exchange loss (gain) on long-term debt and financing costs | | (32,844 | ) | | 45,180 | | | (36,594 | ) |
Earnings of subsidiaries | | (110,756 | ) | | (90,109 | ) | | (76,778 | ) |
| | | | | | | | | |
Earnings before income taxes | | 124,091 | | | 24,026 | | | 88,891 | |
Provision (recovery of) for current income taxes | | (14 | ) | | 23 | | | 22 | |
| | | | | | | | | |
Net earnings for the period | | 124,105 | | | 24,003 | | | 88,869 | |
| | | | | | | | | |
The accompanying notes are an integral part of the condensed financial information.
59
Dollarama Group Holdings L.P.
Statement of Cash Flows
(expressed in thousands of Canadian dollars)
| | | | | | | | | |
| | | For the
year ended
January 31,
2010
$ | | | For the
year ended
February 1,
2009
$ | | | For the
year ended
February 3,
2008
$ | |
Operating activities | | | | | | | | | |
Net earnings for the period | | 124,105 | | | 24,003 | | | 88,869 | |
Adjustments for | | | | | | | | | |
Amortization of debt issue costs | | 1,108 | | | 1,616 | | | 2,065 | |
Foreign exchange loss (gain) on long-term debt and debt issue costs | | (31,798 | ) | | 43,746 | | | (36,351 | ) |
Capitalized interest on long-term debt | | 9,748 | | | 20,760 | | | | |
Earnings of subsidiaries | | (110,756 | ) | | (90,109 | ) | | (76,778 | ) |
Distributions received from subsidiaries | | 14,830 | | | 1,437 | | | 41,918 | |
| | | | | | | | | |
| | 7,237 | | | 1,453 | | | 19,723 | |
Change in non-cash working capital components | | (771 | ) | | 192 | | | 344 | |
| | | | | | | | | |
| | 6,466 | | | 1,645 | | | 20,067 | |
| | | | | | | | | |
Investing activities | | | | | | | | | |
Investment in subsidiary | | (204,713 | ) | | — | | | — | |
| | | | | | | | | |
| | (204,713 | ) | | — | | | — | |
Financing activities | | | | | | | | | |
Repayment of long-term debt | | — | | | — | | | (15,610 | ) |
Debt issue costs | | — | | | (208 | ) | | (506 | ) |
Issuance of Partnership units | | 204,713 | | | — | | | — | |
Capital distributions | | (6,455 | ) | | (1,433 | ) | | (3,945 | ) |
| | | | | | | | | |
| | 198,258 | | | (1,641 | ) | | (20,061 | ) |
| | | | | | | | | |
Increase in cash and cash equivalents | | 11 | | | 4 | | | 6 | |
Cash and cash equivalents – Beginning of period | | 18 | | | 14 | | | 8 | |
| | | | | | | | | |
Cash and cash equivalents – End of period | | 29 | | | 18 | | | 14 | |
| | | | | | | | | |
The accompanying notes are an integral part of the condensed financial information.
60
Dollarama Group Holdings L.P.
Schedule I – Condensed Financial Information (Continued)
Dollarama Group Holdings L.P.
Notes to Consolidated Financial Statements
January 31, 2010
(tabular amounts expressed in thousands of Canadian dollars, unless otherwise noted)
1. Basis of presentation
Dollarama Group Holdings LP (the “Partnership”) was created on December 8, 2006. All partnership units are held by Dollarama Inc. (formerly known as Dollarama Capital Corporation) and Dollarama Group Holding GP ULC, acting as Limited and General Partners respectively. The Partnership conducts all of its business through Dollarama Group L.P. (“Group LP”) and its subsidiaries. The investments in subsidiaries are accounted for using the equity method.
Group L.P. operates discount variety retail stores in Canada that sell all items for $2 or less. As of January 31, 2010, the retail operations are carried on in every Canadian province. The retail operations’ corporate headquarters, distribution centre and warehouses are located in Montréal, Canada.
The condensed financial information is based upon accounting policies and methods of their application consistent with those used and described in the annual consolidated financial statements of the Partnership. The condensed financial information do not include all of the financial statement disclosures included in the annual consolidated financial statements prepared in accordance with Canadian generally accepted accounting principles (“Canadian GAAP”) and therefore should be read in conjunction with the Partnership’s most recent annual consolidated financial statements.
In the opinion of management of Dollarama Group Holdings ULC, acting in its capacity as General Partner of the Partnership, the condensed financial information reflect all adjustments, which consist only of normal and recurring adjustments, necessary to present fairly the financial position and results of operations and cash flows of the Partnership in accordance with Canadian GAAP. The results reported in the condensed financial information are not necessarily indicative of the results that may be expected for the entire year.
2. Long-term debt
Long-term debt outstanding consists of the following:
| | | | | | |
| | | January 31,
2010
$ | | | February 1,
2009
$ | |
Senior subordinated deferred interest notes (2010 – US$212,169,000; 2009 – US$203,449,000), maturing in August 2012, interest accrues semi-annually in arrears commencing in June 2007 at a rate per annum equal to 6-month LIBOR plus 5.75%, increasing to 6.25% in December 2008 and 6.75% in December 2009 | | 226,872 | | | 249,530 | |
Less: Debt issue costs | | (3,447 | ) | | (5,163 | ) |
| | | | | | |
| | 223,425 | | | 244,367 | |
| | | | | | |
61
Dollarama Group Holdings L.P.
Schedule I – Condensed Financial Information (Continued)
Dollarama Group Holdings L.P.
Notes to Consolidated Financial Statements—(Continued)
January 31, 2010
(tabular amounts expressed in thousands of Canadian dollars, unless otherwise noted)
3. Contractual Obligations
The following tables summarize the Partnership’s material contractual obligations as of January 31, 2010 (in millions):
| | | | | | | | | | | | | | | | | | | | |
Contractual obligations | | Total | | Year 1 | | Year 2 | | Year 3 | | Year 4 | | Year 5 | | Thereafter |
Long-term borrowings: | | | | | | | | | | | | | | | | | | | | |
Deferred Interest Notes | | $ | 226.9 | | $ | — | | $ | — | | $ | 226.9 | | $ | — | | $ | — | | — |
| | | | | | | | | | | | | | | | | | | | |
Total obligations | | $ | 226.9 | | $ | — | | $ | — | | $ | 226.9 | | $ | — | | $ | — | | — |
| | | | | | | | | | | | | | | | | | | | |
62
| | |
Exhibit Number | | Description |
| |
| 1.1 | | Limited Partnership Agreement of Dollarama Group Holdings L.P.‡ |
| |
| 2.1 | | Indenture governing Senior Floating Rate Deferred Interest Notes due 2012 among Dollarama Group Holdings L.P. and Dollarama Group Holdings Corporation as Co-Issuers and U.S. Bank National Association, dated December 20, 2006.‡ |
| |
| 2.2 | | Form of Senior Floating Rate Deferred Interest Notes due 2012 (included in Exhibit 4.1).‡ |
| |
| 4.1 | | Management Agreement, dated November 18, 2004, with Bain Capital Partners, LLC.* |
| |
| 4.2 | | Credit Agreement, dated as of November 18, 2004, by and among Dollarama Group L.P., Aris Import Inc., Dollarama Holdings L.P., the lenders from time to time party thereto, Royal Bank of Canada, Citibank Canada, The Bank of Nova Scotia, and JP Morgan Chase Bank, Citigroup Global Markets, Inc., RBC Capital Markets, and J.P. Morgan Securities Inc.* |
| |
| 4.3 | | Amendment No. 1 to the Credit Agreement, dated December 20, 2004, by and among Dollarama Group L.P., Aris Import Inc., Dollarama Holdings L.P., the lenders named therein, and the Administrative Agent (as defined therein).* |
| |
| 4.4 | | Amendment No. 2 to the Credit Agreement, dated August 12, 2005, by and among Dollarama Group L.P., Aris Import Inc., Dollarama Holdings L.P., the lenders named therein, the Additional Term B Lenders, and the Administrative Agent (as defined therein).* |
| |
| 4.5 | | Amendment No. 3 to the Credit Agreement, dated May 25, 2006, by and among Dollarama Group L.P., Aris Import Inc., Dollarama Holdings L.P., the Required Lenders (as defined therein), the Replacement Term B Lenders (as defined therein), the Administrative Agent (as defined therein) and Citigroup Global Markets Inc. and J.P. Morgan Securities Inc.* |
| |
| 4.6 | | Amendment No. 4 to the Credit Agreement, dated June 15, 2007, by and among Dollarama Group L.P., Aris Import Inc., Dollarama Holdings L.P., the lenders named therein, and the Administrative Agent (as defined therein).‡ |
| |
| 4.7 | | Amendment No. 5 to the Credit Agreement, dated September 22, 2009, by and among Dollarama Group L.P., Aris Import Inc., Dollarama Holdings L.P., the lenders named therein, and the Administrative Agent (as defined therein). ** |
| |
| 4.8 | | Amendment No. 6 to the Credit Agreement, dated October 21, 2009, by and among Dollarama Group L.P., Aris Import Inc., Dollarama Holdings L.P., the lenders named therein, and the Administrative Agent (as defined therein). *** |
| |
| 7.1 | | Statement of Ratio of Earnings to Fixed Charges, furnished herewith. |
| |
| 8.1 | | Subsidiaries of Dollarama Group Holdings L.P., furnished herewith |
| |
| 12.1 | | Rule 13a-14(a)/15d-14(a) Certification of the Chief Executive Officer, furnished herewith. |
| |
| 12.2 | | Rule 13a-14(a)/15d-14(a) Certification of the Chief Financial Officer, furnished herewith. |
| |
| 13.1 | | Section 1350 Certifications, furnished herewith. |
| ‡ | Filed as an exhibit to the S-4 filed by Dollarama Group Holdings L.P. and Dollarama Corporation on June 1, 2007, and incorporated by reference herein. |
| * | Filed as an exhibit to the S-4 filed by Dollarama Group L.P. and Dollarama Corporation on May 30, 2006, and incorporated herein by reference. |
| ** | Filed as an exhibit to the Current Report on Form 8-K filed by Dollarama Group Holdings L.P. on September 28, 2009, and incorporated herein by reference. |
| *** | Filed as an exhibit to the Current Report on Form 8-K filed by Dollarama Group Holdings L.P. on October 21, 2009, and incorporated herein by reference. |
63
SIGNATURE
The registrant hereby certifies that it meets all of the requirements for filing on Form 20-F and that it has duly caused and authorized the undersigned to sign this annual report on its behalf.
| | |
| DOLLARAMA GROUP HOLDINGS L.P. |
| |
| By: | | Dollarama Group Holdings GP, ULC, its general partner |
| |
| | /S/ LARRY ROSSY |
| Name: | | Larry Rossy |
| Title: | | Chief Executive Officer |
| Date: | | April 29, 2010 |
64
CONSOLIDATED FINANCIAL STATEMENTS
AS OF JANUARY 31, 2010
INDEX
F-1
| | |
 | | |
| | PricewaterhouseCoopers LLP/s.r.l./s.e.n.c.r.l. |
| | Chartered Accountants |
| | 1250 René-Lévesque Boulevard West |
| | Suite 2800 |
| | Montréal, Quebec |
| | Canada H3B 2G4 |
| | Telephone +1 514 205 5000 |
| | Facsimile +1 514 876 1502 |
Independent Auditors’ Report
To the Partners of
Dollarama Group Holdings L.P.
We have completed integrated audits of Dollarama Group Holdings L.P.’s (the “Partnership”) 2010 and 2009 consolidated financial statements and of its internal control over financial reporting as at January 31, 2010 and an audit of its 2008 consolidated financial statements. Our opinions, based on our audits, are presented below.
Consolidated Financial statements
We have audited the accompanying consolidated balance sheets of the Partnership as at January 31, 2010 and February 1, 2009, and the related consolidated statements of earnings, partners’ capital and cash flows for each years included in the three-year period ended January 31, 2010. These financial statements are the responsibility of the management of Dollarama Group Holdings ULC, acting in its capacity as General Partner of the Partnership. Our responsibility is to express an opinion on these financial statements based on our audits.
We conducted our audits of the Partnership’s financial statements in accordance with Canadian generally accepted auditing standards and the standards of the Public Company Accounting Oversight Board (United States). Those standards require that we plan and perform an audit to obtain reasonable assurance about whether the financial statements are free of material misstatement. An audit of financial statements includes examining, on a test basis, evidence supporting the amounts and disclosures in the financial statements. A financial statement audit also includes assessing the accounting principles used and significant estimates made by management, and evaluating the overall financial statement presentation. We believe that our audits provide a reasonable basis for our opinion.
In our opinion, the consolidated financial statements referred to above present fairly, in all material respects, the financial position of the Partnership as at January 31, 2010 and February 1, 2009 and the results of its operations and its cash flows for each of the years included in the three-year period ended January 31, 2010 in accordance with Canadian generally accepted accounting principles.
Internal control over financial reporting
We have also audited the Partnership’s internal control over financial reporting as at January 31, 2010, based on criteria established inInternal Control - Integrated Framework issued by the Committee of Sponsoring Organizations of the Treadway Commission (COSO). The Partnership’s management is responsible for maintaining effective internal control over financial reporting and for its assessment of the effectiveness of internal control over financial reporting, included in item 15 of their annual report filed on Form 20F. Our responsibility is to express an opinion on the Partnership’s internal control over financial reporting based on our audit.
We conducted our audit of internal control over financial reporting in accordance with the standards of the Public Company Accounting Oversight Board (United States). Those standards require that we plan and perform the audit to obtain reasonable assurance about whether effective internal control over financial reporting was maintained in all material respects. An audit of internal control over financial reporting includes obtaining an understanding of internal control over financial reporting, assessing the risk that a material weakness exists, testing and evaluating the design and operating effectiveness of internal control based on the assessed risk, and performing such other procedures as we consider necessary in the circumstances. We believe that our audit provides a reasonable basis for our opinion.
A Partnership’s internal control over financial reporting is a process designed to provide reasonable assurance regarding the reliability of financial reporting and the preparation of financial statements for external purposes in accordance with generally accepted accounting principles. A Partnership’s internal control over financial reporting includes those policies and procedures that (i) pertain to the maintenance of records that, in reasonable detail, accurately and fairly reflect the transactions and dispositions of the assets of the Partnership; (ii) provide reasonable assurance that transactions are recorded as necessary to permit preparation of financial statements in accordance with generally accepted accounting principles, and that receipts and expenditures of the Partnership are being made only in accordance with authorizations of management and directors of the Partnership; and (iii) provide reasonable assurance regarding prevention or timely detection of unauthorized acquisition, use, or disposition of the Partnership’s assets that could have a material effect on the financial statements.
Because of its inherent limitations, internal control over financial reporting may not prevent or detect misstatements. Also, projections of any evaluation of effectiveness to future periods are subject to the risk that controls may become inadequate because of changes in conditions, or that the degree of compliance with the policies or procedures may deteriorate.
In our opinion, the Partnership maintained, in all material respects, effective internal control over financial reporting as at January 31, 2010 based on criteria established in Internal Control — Integrated Framework issued by the COSO.

April 8, 2010
“PricewaterhouseCoopers” refers to PricewaterhouseCoopers LLP/s.r.l./s.e.n.c.r.l., an Ontario limited liability partnership, or, as the context requires, the PricewaterhouseCoopers global network or other member firms of the network, each of which is a separate legal entity.
| 2 | Chartered accountant auditor permit No. 19653 |
F-2
Dollarama Group Holdings L.P.
Consolidated Balance Sheets
(expressed in thousands of Canadian dollars)
| | | | | |
| | | As of
January 31,
2010
$ | | | As of
February 1,
2009
$ |
Assets | | | | | |
| | |
Current assets | | | | | |
Cash and cash equivalents | | 92,794 | | | 66,141 |
Accounts receivable | | 4,222 | | | 2,998 |
Income taxes recoverable | | — | | | 80 |
Deposits and prepaid expenses | | 4,924 | | | 4,710 |
Merchandise inventories | | 234,684 | | | 249,644 |
Derivative financial instruments (note 9) | | 3,479 | | | 33,175 |
| | | | | |
| | 340,103 | | | 356,748 |
| | |
Property and equipment (note 3) | | 138,214 | | | 129,878 |
| | |
Goodwill | | 727,782 | | | 727,782 |
| | |
Other intangible assets (note 4) | | 113,302 | | | 115,210 |
| | |
Derivative financial instruments (note 9) | | 5,342 | | | 33,423 |
| | | | | |
| | 1,324,743 | | | 1,363,041 |
| | | | | |
| | |
Liabilities | | | | | |
| | |
Current liabilities | | | | | |
Accounts payable | | 31,697 | | | 39,027 |
Accrued expenses and other (note 5) | | 45,925 | | | 37,760 |
Income taxes payable | | 103 | | | — |
Derivative financial instruments (note 9) | | 55,194 | | | — |
Current portion of long-term debt (note 6) | | 1,925 | | | 15,302 |
| | | | | |
| | 134,844 | | | 92,089 |
| | |
Long-term debt (note 6) | | 468,591 | | | 806,384 |
| | |
Other liabilities (note 7) | | 29,988 | | | 28,098 |
| | | | | |
| | 633,423 | | | 926,571 |
| | | | | |
| | |
Commitments (note 8) | | | | | |
| | |
Partners’ Capital | | | | | |
| | |
General partner (note 10) | | 544 | | | 374 |
| | |
Limited partner (note 10) | | 359,813 | | | 161,725 |
| | |
Contributed surplus | | 8,990 | | | 3,390 |
| | |
Retained earnings | | 335,625 | | | 211,520 |
| | |
Accumulated other comprehensive income (loss) | | (13,652 | ) | | 59,461 |
| | | | | |
| | 691,320 | | | 436,470 |
| | | | | |
| | 1,324,743 | | | 1,363,041 |
| | | | | |
The accompanying notes are an integral part of the consolidated financial statements.
F-3
Dollarama Group Holdings L.P.
Consolidated Statements of Earnings
(expressed in thousands of Canadian dollars)
| | | | | | | | |
| | | For the
year ended
January 31,
2010
$ | | | For the
year ended
February 1,
2009
$ | | For the
year ended
February 3,
2008
$ | |
| | | |
Sales | | 1,253,706 | | | 1,089,011 | | 972,352 | |
| | | | | | | | |
| | | |
Cost of sales and expenses | | | | | | | | |
Cost of sales | | 810,624 | | | 724,150 | | 643,579 | |
General, administrative and store operating expenses | | 262,530 | | | 212,814 | | 183,571 | |
Amortization | | 24,919 | | | 21,818 | | 18,389 | |
| | | | | | | | |
| | 1,098,073 | | | 958,782 | | 845,539 | |
| | | | | | | | |
| | | |
Operating income | | 155,633 | | | 130,229 | | 126,813 | |
| | | |
Interest expense | | 62,343 | | | 61,192 | | 72,053 | |
Foreign exchange loss (gain) on derivative financial instruments and long-term debt (note 9) | | (31,108 | ) | | 44,793 | | (34,411 | ) |
| | | | | | | | |
| | | |
Earnings before income taxes | | 124,398 | | | 24,244 | | 89,171 | |
| | | |
Provision for current income taxes (note 16) | | 293 | | | 241 | | 302 | |
| | | | | | | | |
| | | |
Net earnings for the year | | 124,105 | | | 24,003 | | 88,869 | |
| | | | | | | | |
The accompanying notes are an integral part of the consolidated financial statements.
F-4
Dollarama Group Holdings L.P.
Consolidated Statements of Partners’ Capital
(expressed in thousands of Canadian dollars)
| | | | | | | | | | | | | | | |
| | | General
partner
capital
$ | | Limited
partner
capital
$ | | | Contributed
surplus
$ | | Retained
earnings
$ | | Accumulated
other
comprehensive
income (loss)
$ | | | Total
$ | |
| | | | | | |
Balance – February 4, 2007 | | 374 | | 167,103 | | | 1,337 | | 83,635 | | 6,782 | | | 259,231 | |
| | | | | | | | | | | | | | | |
| | | | | | |
Net earnings for the year | | — | | — | | | — | | 88,869 | | — | | | 88,869 | |
Other comprehensive loss | | | | | | | | | | | | | | | |
Unrealized loss on derivative financial instruments, net of reclassification adjustments | | — | | — | | | — | | — | | (14,306 | ) | | (14,306 | ) |
| | | | | | | | | | | | | | | |
| | | | | | |
Total comprehensive income | | | | | | | | | | | | | | 74,563 | |
| | | | | | | | | | | | | | | |
| | | | | | |
Stock-based compensation (note 11) | | — | | — | | | 1,312 | | — | | — | | | 1,312 | |
Capital distributions | | — | | (3,945 | ) | | — | | — | | — | | | (3,945 | ) |
| | | | | | | | | | | | | | | |
| | | | | | |
Balance – February 3, 2008 | | 374 | | 163,158 | | | 2,649 | | 172,504 | | (7,524 | ) | | 331,161 | |
| | | | | | |
Transition adjustment on adoption of inventory standard | | — | | — | | | — | | 15,013 | | — | | | 15,013 | |
| | | | | | | | | | | | | | | |
| | | | | | |
Balance – February 3, 2008 – adjusted | | 374 | | 163,158 | | | 2,649 | | 187,517 | | (7,524 | ) | | 346,174 | |
| | | | | | | | | | | | | | | |
| | | | | | |
Net earnings for the year | | — | | — | | | — | | 24,003 | | — | | | 24,003 | |
Other comprehensive income | | | | | | | | | | | | | | | |
Unrealized gain on derivative financial instruments, net of reclassification adjustments | | — | | — | | | — | | — | | 66,985 | | | 66,985 | |
| | | | | | | | | | | | | | | |
| | | | | | |
Total comprehensive income | | | | | | | | | | | | | | 90,988 | |
| | | | | | | | | | | | | | | |
| | | | | | |
Stock-based compensation (note 11) | | — | | — | | | 741 | | — | | — | | | 741 | |
Capital distributions | | — | | (1,433 | ) | | — | | — | | — | | | (1,433 | ) |
| | | | | | | | | | | | | | | |
| | | | | | |
Balance – February 1, 2009 | | 374 | | 161,725 | | | 3,390 | | 211,520 | | 59,461 | | | 436,470 | |
| | | | | | | | | | | | | | | |
| | | | | | |
Net earnings for the year | | — | | — | | | — | | 124,105 | | — | | | 124,105 | |
Other comprehensive loss | | | | | | | | | | | | | | | |
Unrealized loss on derivative financial instruments, net of reclassification adjustments | | — | | — | | | — | | — | | (73,113 | ) | | (73,113 | ) |
| | | | | | | | | | | | | | | |
| | | | | | |
Total comprehensive income | | | | | | | | | | | | | | 50,992 | |
| | | | | | | | | | | | | | | |
| | | | | | |
Issuance of partnership units (note 10) | | 170 | | 204,543 | | | — | | — | | — | | | 204,713 | |
Stock-based compensation (note 11) | | — | | — | | | 5,600 | | — | | — | | | 5,600 | |
Capital distributions | | — | | (6,455 | ) | | — | | — | | — | | | (6,455 | ) |
| | | | | | | | | | | | | | | |
| | | | | | |
Balance – January 31, 2010 | | 544 | | 359,813 | | | 8,990 | | 335,625 | | (13,652 | ) | | 691,320 | |
| | | | | | | | | | | | | | | |
The sum of retained earnings and accumulated other comprehensive income (loss) amounted to $321,973 as of January 31, 2010 (February 1, 2009 – $270,981; 2008 – $164,980).
The accompanying notes are an integral part of the consolidated financial statements.
F-5
Dollarama Group Holdings L.P.
Consolidated Statements of Cash Flows
(expressed in thousands of Canadian dollars)
| | | | | | | | | |
| | | For the
year ended
January 31,
2010
$ | | | For the
year ended
February 1,
2009
$ | | | For the
year ended
February 3,
2008
$ | |
Operating activities | | | | | | | | | |
Net earnings for the year | | 124,105 | | | 24,003 | | | 88,869 | |
Adjustments for | | | | | | | | | |
Amortization of property and equipment | | 25,327 | | | 22,310 | | | 18,094 | |
Amortization of intangible assets | | 1,737 | | | 2,267 | | | 3,521 | |
Change in fair value of derivative financial instruments | | 46,287 | | | (84,437 | ) | | 74,748 | |
Amortization of debt issue costs | | 8,439 | | | 5,802 | | | 6,340 | |
Deemed interest on debt repayments | | (8,288 | ) | | (1,129 | ) | | (1,083 | ) |
Foreign exchange loss (gain) on long-term debt | | (103,371 | ) | | 143,512 | | | (118,777 | ) |
Amortization of unfavourable lease rights | | (2,145 | ) | | (2,759 | ) | | (3,226 | ) |
Deferred lease inducements | | 2,139 | | | 2,276 | | | 2,312 | |
Deferred leasing costs | | (157 | ) | | (575 | ) | | (450 | ) |
Deferred tenant allowances | | 3,594 | | | 2,643 | | | 3,806 | |
Amortization of deferred tenant allowances | | (1,698 | ) | | (1,343 | ) | | (1,024 | ) |
Stock-based compensation | | 5,600 | | | 741 | | | 1,312 | |
Amortization of deferred leasing costs | | 328 | | | 245 | | | 161 | |
Deferred interest on long-term debt | | 9,748 | | | 20,760 | | | — | |
Other | | (1 | ) | | 61 | | | 197 | |
| | | | | | | | | |
| | 111,644 | | | 134,377 | | | 74,800 | |
| | | |
Changes in non-cash working capital components (note 14) | | 14,540 | | | (17,290 | ) | | (18,625 | ) |
| | | | | | | | | |
| | | |
| | 126,184 | | | 117,087 | | | 56,175 | |
| | | | | | | | | |
| | | |
Investing activities | | | | | | | | | |
Purchase of property and equipment | | (33,772 | ) | | (40,502 | ) | | (45,994 | ) |
Proceeds on disposal of property and equipment | | 110 | | | 189 | | | 432 | |
Net settlement of derivative financial instruments (note 9) | | (6,429 | ) | | (9,415 | ) | | — | |
| | | | | | | | | |
| | | |
| | (40,091 | ) | | (49,728 | ) | | (45,562 | ) |
| | | | | | | | | |
| | | |
Financing activities | | | | | | | | | |
Debt issue costs | | — | | | (208 | ) | | (506 | ) |
Issuance of partnership units | | 204,713 | | | — | | | — | |
Repayment of long-term debt | | (257,698 | ) | | (25,791 | ) | | (27,651 | ) |
Capital distributions | | (6,455 | ) | | (1,433 | ) | | (3,945 | ) |
| | | | | | | | | |
| | | |
| | (59,440 | ) | | (27,432 | ) | | (32,102 | ) |
| | | | | | | | | |
| | | |
Increase (decrease) in cash and cash equivalents | | 26,653 | | | 39,927 | | | (21,489 | ) |
| | | |
Cash and cash equivalents – Beginning of year | | 66,141 | | | 26,214 | | | 47,703 | |
| | | | | | | | | |
| | | |
Cash and cash equivalents – End of year | | 92,794 | | | 66,141 | | | 26,214 | |
| | | | | | | | | |
F-6
Dollarama Group Holdings L.P.
Notes to Consolidated Financial Statements
January 31, 2010 and February 1, 2009
(tabular amounts expressed in thousands of Canadian dollars, unless otherwise noted)
1 Basis of presentation and nature of business
Dollarama Group Holdings L.P. (the “Partnership”) was created on December 8, 2006. All partnership units are held by Dollarama Inc. (formerly known as Dollarama Capital Corporation) and Dollarama Group Holdings GP ULC, acting as Limited and General Partners respectively. The Partnership conducts all of its business through Dollarama Group L.P. and its subsidiaries.
The Partnership operates discount variety retail stores in Canada that sell all items for $2 or less. As of January 31, 2010, its retail operations are carried on in every Canadian province. The corporate headquarters, distribution centre and warehouse are located in the Montréal area, Canada. The Partnership manages its business on the basis of one reportable segment.
The significant entities within the legal structure of the Partnership are as follows:
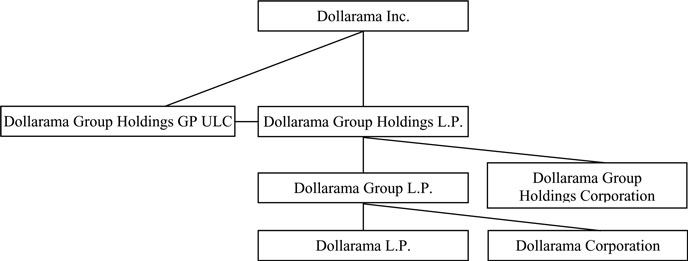
Dollarama Group Holdings Corporation is the co-issuer of the senior subordinated deferred interest notes, as further described in note 6(c).
Dollarama Group L.P. has a senior secured credit facility as further described in note 6(b).
Dollarama L.P. and Dollarama Corporation operate the chain of stores and perform related logistical and administrative support activities.
F-7
Dollarama Group Holdings L.P.
Notes to Consolidated Financial Statements—(Continued)
January 31, 2010 and February 1, 2009
(tabular amounts expressed in thousands of Canadian dollars, unless otherwise noted)
2 Summary of significant accounting policies
Use of estimates
The preparation of financial statements in accordance with Canadian generally accepted accounting principles (“GAAP”) requires the use of estimates that affect the reported amounts of assets and liabilities and disclosure of contingent assets and liabilities at the balance sheet date and the reported amounts of revenue and expense items for the reporting period. On an ongoing basis, management reviews its estimates, including those related to the net realizable value of merchandise inventories, useful lives, impairment of long-lived assets and goodwill, operating leases and financial instruments based on currently available information. Actual results could differ from those estimates.
Cash and cash equivalents
Cash and cash equivalents include highly liquid investments with original maturities from date of purchase of three months or less.
Merchandise inventories
Merchandise inventories at the distribution centre, warehouses and stores are stated at the lower of cost and net realizable value. Cost is determined on a weighted average cost basis and is assigned to store inventories using the retail inventory method. Costs of inventory include amounts paid to suppliers, duties and freight into the warehouses as well as costs directly associated with warehousing and distribution.
Property and equipment
Property and equipment are carried at cost and amortized over the estimated useful lives of the assets as follows:
| | | |
On the declining balance method | | | |
Computer equipment | | 30 | % |
Vehicles | | 30 | % |
| |
On the straight-line method | | | |
Store and warehouse equipment | | 8-10 years | |
Leasehold improvements | | Term of lease | |
Computer software | | 5 years | |
F-8
Dollarama Group Holdings L.P.
Notes to Consolidated Financial Statements—(Continued)
January 31, 2010 and February 1, 2009
(tabular amounts expressed in thousands of Canadian dollars, unless otherwise noted)
Goodwill
Goodwill is tested for impairment annually or when events or changes in circumstances indicate that it may be impaired. A Step I impairment test of goodwill of the Partnership’s reporting unit is accomplished mainly by determining whether the fair value of the reporting unit, based on discounted estimated cash flows, exceeds its net carrying amount as of the assessment date. If the fair value is greater than the net carrying amount, no impairment is necessary. In the event that the net carrying amount of the reporting unit exceeds the sum of the discounted estimated cash flows, a Step II impairment test must be performed whereby the fair value of the reporting unit’s goodwill must be estimated to determine if it is less than its net carrying amount. Fair value of goodwill in the Step II impairment test is estimated in the same way as goodwill was determined at the date of the acquisition in a business combination, that is, the excess of the fair value of the reporting unit over the fair value of the identifiable net assets of the reporting unit. The Partnership conducts its annual impairment test as of the balance sheet date.
Trade name
The trade name is recorded at cost and is not subject to amortization. It is tested for impairment annually or more frequently if events or circumstances indicate that it may be impaired. The impairment test consists of a comparison of the fair value, based on discounted estimated cash flows related to the trade name, with its carrying amount. If the fair value is greater than the carrying amount, no impairment is necessary. If the carrying amount exceeds the fair value, an impairment loss shall be recognized in an amount equal to that excess. The Partnership conducts its annual impairment test as of the balance sheet date.
Favourable and unfavourable lease rights
Favourable and unfavourable lease rights represent the fair value of lease rights as established on the date of acquisition and are amortized on a straight-line basis over the terms of the related leases.
Covenants not to compete
The covenants not to compete are amortized on a straight-line basis over the terms of the agreements.
Deferred leasing instruments
Deferred leasing costs and deferred tenant allowances are recorded on the balance sheet and amortized using the straight-line method over the term of the respective lease.
Debt issue costs
Debt issue costs are deducted from the carrying value of the related debt and are accounted for at amortized cost using the effective interest method.
F-9
Dollarama Group Holdings L.P.
Notes to Consolidated Financial Statements—(Continued)
January 31, 2010 and February 1, 2009
(tabular amounts expressed in thousands of Canadian dollars, unless otherwise noted)
Operating leases
The Partnership recognizes rental expense incurred and inducements received from landlords on a straight-line basis over the term of the lease. Any difference between the calculated expense and the amounts actually paid is reflected as deferred lease inducements in the Partnership’s balance sheet. Contingent rental expense is recognized when the achievement of specified sales targets is considered probable.
Impairment of long-lived assets
Long-lived assets are reviewed for impairment whenever events or changes in circumstances indicate that the carrying amount of an asset may not be recoverable. Impairment is assessed by comparing the carrying amount of an asset with the expected future net undiscounted cash flows from its use together with its residual value. If such asset is considered to be impaired, the impairment to be recognized is measured by the amount by which the carrying amount of the asset exceeds its fair value.
Revenue recognition
The Partnership recognizes revenue at the time the customer tenders payment for and takes possession of the merchandise. All sales are final.
Cost of sales
The Partnership includes the cost of merchandise inventories, procurement, warehousing and distribution costs, and certain occupancy costs in its cost of sales.
General, administrative and store operating expenses
The Partnership includes store and head office salaries and benefits, repairs and maintenance, professional fees, store supplies and other related expenses in general, administrative and store operating expenses.
Pre-opening costs
Costs associated with the opening of new stores are expensed as incurred.
Vendor rebates
The Partnership records vendor rebates, consisting of volume purchase rebates, when it is probable that they will be received. The rebates are recorded as a reduction of inventory purchases and are reflected as a reduction of cost of sales.
Advertising costs
The Partnership expenses advertising costs as incurred. Advertising costs for the year ended January 31, 2010 amounted to $630,000 (2009 – $1,953,000; 2008 – $1,358,000).
F-10
Dollarama Group Holdings L.P.
Notes to Consolidated Financial Statements—(Continued)
January 31, 2010 and February 1, 2009
(tabular amounts expressed in thousands of Canadian dollars, unless otherwise noted)
Employee future benefits
The Partnership offers a group defined contribution plan to eligible employees whereby it matches an employee’s contributions of up to 3% of the employee’s salary. The pension expense for the year ended January 31, 2010 amounted to $1,132,000 (2009 – $1,153,000; 2008 – $892,000).
Income taxes
The net earnings for the year constitute income of the individual partners and are subject to income tax in their hands. Income taxes recorded represent the income taxes of subsidiary companies.
Subsidiaries formed as corporations use the liability method of accounting for income taxes. Future tax assets and liabilities are determined based on temporary differences between the carrying amount and the tax bases of assets and liabilities. Future income tax assets and liabilities are measured using enacted or substantively enacted tax rates, as appropriate, in effect when these differences are expected to reverse. Future income tax assets, if any, are recognized only to the extent that, in the opinion of management, it is more likely than not that the assets will be realized.
Foreign currency transactions
Monetary assets and liabilities denominated in foreign currencies are translated at year-end exchange rates while non-monetary assets and liabilities are translated at historical rates. Revenues and expenses are translated at prevailing market rates in the recognition period. The resulting exchange gains or losses are recorded in the consolidated statement of earnings.
Derivative financial instruments
The Partnership uses derivative financial instruments in the management of its foreign currency and interest rate exposures.
When hedge accounting is used, the Partnership documents relationships between the hedging instruments and the hedged items, as well as its risk management objective and strategy for undertaking various hedge transactions. This process includes linking derivatives to specific assets and liabilities on the balance sheet or to specific firm commitments or forecasted transactions. The Partnership also assesses whether the derivatives that are used in hedging transactions are effective in offsetting changes in cash flows of hedged items.
F-11
Dollarama Group Holdings L.P.
Notes to Consolidated Financial Statements—(Continued)
January 31, 2010 and February 1, 2009
(tabular amounts expressed in thousands of Canadian dollars, unless otherwise noted)
Foreign exchange forward contracts and foreign currency swap agreements
The Partnership has significant cash flows and long-term debt denominated in US dollars. It uses foreign exchange forward contracts and foreign currency swap agreements to mitigate risks from fluctuations in exchange rates. All forward contracts and swap agreements are used for risk management purposes. Some forward contracts are designated as cash flow hedges of specific anticipated transactions. Under the cash flow hedge model, the fair value of the foreign exchange forward contracts are recorded in “Accumulated other comprehensive income” and reclassified to the consolidated statement of earnings when the related hedged item is recorded in earnings.
Foreign exchange forward contracts are classified as current assets or liabilities on the consolidated balance sheet.
Interest rate swap agreements
The Partnership’s interest rate risk is primarily in relation to its floating rate borrowings. The Partnership has entered into swap agreements to mitigate this risk.
Others
In the event a derivative financial instrument designated as a hedge is terminated or ceases to be effective prior to maturity, related realized and unrealized gains or losses are deferred under assets or liabilities and recognized in earnings in the period in which the underlying original hedged transaction is recognized. In the event a designated hedged item is sold, extinguished or matures prior to the termination of the related derivative financial instrument, any realized or unrealized gain or loss on such derivative financial instrument is recognized in earnings.
Derivative financial instruments which are not designated as hedges or have ceased to be effective prior to maturity are recorded at their estimated fair values under assets or liabilities, with changes in their estimated fair values recorded in earnings.
Stock-based compensation
The Partnership recognizes a compensation expense for options granted based on the fair value of the options at the grant date. The options vest in tranches (graded vesting), and accordingly, the expense is recognized using the accelerated expense attribution method over the vesting period. When the vesting of an award is contingent upon the attainment of performance conditions, the Partnership recognizes the expense based on management’s best estimate of the outcome of the conditions and consequently the number of options that are expected to vest. When awards are forfeited because service or performance conditions are not met, any expense previously recorded is reversed in the period of forfeiture.
Comparative figures
To conform with the basis of presentation adopted in the current year, certain figures previously reported have been reclassified.
F-12
Dollarama Group Holdings L.P.
Notes to Consolidated Financial Statements—(Continued)
January 31, 2010 and February 1, 2009
(tabular amounts expressed in thousands of Canadian dollars, unless otherwise noted)
Changes in accounting policies during the year
Goodwill and intangible assets
Canadian Institute of Chartered Accountants (“CICA”) Handbook Section 3064, “Goodwill and Intangible Assets”, replaces Section 3062, “Goodwill and Other Intangible Assets”, and establishes standards for the recognition, measurement and disclosure of goodwill and intangible assets. The provisions relating to the definition and initial recognition of intangible assets are equivalent to the corresponding provisions of International Accounting Standard (“IAS”) 38, “Intangible Assets”. Section 1000, “Financial Statement Concepts”, is amended to clarify criteria for recognition of an asset. Section 3450, “Research and Development Costs”, is replaced by guidance in Section 3064. CICA Abstract EIC-27, “Revenues and Expenditures During the Pre-operating Period”, is no longer applicable for entities that have adopted Section 3064. Accounting Guideline 11, “Enterprises in the Development Stage”, is amended to delete references to deferred costs and to provide guidance on development costs as intangible assets under Section 3064. This new standard is effective for interim and annual financial statements for years beginning on or after October 1, 2008. This Section was adopted as of February 2, 2009 with no impact on the consolidated financial statements.
Accounting changes
In June 2009, the CICA amended Section 1506, “Accounting Changes”, to exclude from the scope of this Section changes in accounting policies upon the complete replacement of an entity’s primary basis of accounting. This amendment is effective for years beginning after July 1, 2009. This amendment was early adopted as of January 31, 2010 with no impact on the consolidated financial statements.
Financial instruments – Disclosures
In June 2009, the CICA amended Section 3862, “Financial Instruments – Disclosures”, to include additional disclosure requirements about fair value measurement for financial instruments and liquidity risk disclosures. These amendments require a three-level hierarchy that reflects the significance of the inputs used in making the fair value measurements. Fair value of assets and liabilities included in Level 1 are determined by reference to quoted prices in active markets for identical assets and liabilities. Assets and liabilities in Level 2 include valuations using inputs other than the quoted prices for which all significant inputs are based on observable market data, either directly or indirectly. Level 3 valuations are based on inputs that are not based on observable market data. The amendments to Section 3862 apply for annual financial statements relating to fiscal years ending after September 30, 2009. The Partnership has adopted the disclosure requirements under this amendment with respect to its January 31, 2010 consolidated financial statements.
F-13
Dollarama Group Holdings L.P.
Notes to Consolidated Financial Statements—(Continued)
January 31, 2010 and February 1, 2009
(tabular amounts expressed in thousands of Canadian dollars, unless otherwise noted)
Future accounting standards not yet applied
Business combinations, consolidated financial statements and non-controlling interests
CICA Handbook Section 1582, “Business Combinations”; Section 1601, “Consolidated Financial Statements”; and Section 1602, “Non-controlling Interests”, replace Section 1581, “Business Combinations”, and Section 1600, “Consolidated Financial Statements”, and establish a new section for accounting for a non-controlling interest in a subsidiary. These sections provide the Canadian equivalent to International Financial Reporting Standard 3, “Business Combinations (January 2008)”, and IAS 27, “Consolidated and Separate Financial Statements (January 2008)”. Section 1582 is effective for business combinations for which the acquisition date is on or after the first quarter beginning on January 31, 2011 with early adoption permitted. Sections 1601 and 1602 apply to interim and annual consolidated financial statements relating to years beginning on January 31, 2011 with early adoption permitted. The Partnership is assessing the impact of these new standards.
3 Property and equipment
| | | | | | |
| | | 2010 |
| | | Cost
$ | | Accumulated
amortization
$ | | Net
$ |
Store and warehouse equipment | | 123,475 | | 46,567 | | 76,908 |
Leasehold improvements | | 79,993 | | 28,061 | | 51,932 |
Computer software | | 14,712 | | 8,455 | | 6,257 |
Computer equipment | | 3,142 | | 1,365 | | 1,777 |
Vehicles | | 2,681 | | 1,341 | | 1,340 |
| | | | | | |
| | | |
| | 224,003 | | 85,789 | | 138,214 |
| | | | | | |
| |
| | | 2009 |
| | | Cost
$ | | Accumulated
amortization
$ | | Net
$ |
Store and warehouse equipment | | 105,844 | | 32,331 | | 73,513 |
Leasehold improvements | | 66,527 | | 20,875 | | 45,652 |
Computer software | | 13,698 | | 5,426 | | 8,272 |
Computer equipment | | 2,001 | | 1,043 | | 958 |
Vehicles | | 2,493 | | 1,010 | | 1,483 |
| | | | | | |
| | | |
| | 190,563 | | 60,685 | | 129,878 |
| | | | | | |
F-14
Dollarama Group Holdings L.P.
Notes to Consolidated Financial Statements—(Continued)
January 31, 2010 and February 1, 2009
(tabular amounts expressed in thousands of Canadian dollars, unless otherwise noted)
4 Other intangible assets
| | | | | | |
| | | 2010 |
| | | Cost
$ | | Accumulated
amortization
$ | | Net
$ |
Trade name | | 108,200 | | — | | 108,200 |
Favourable lease rights | | 20,862 | | 17,521 | | 3,341 |
Covenants not to compete | | 400 | | 298 | | 102 |
Deferred leasing costs | | 2,550 | | 891 | | 1,659 |
| | | | | | |
| | | |
| | 132,012 | | 18,710 | | 113,302 |
| | | | | | |
| |
| | | 2009 |
| | | Cost
$ | | Accumulated
amortization
$ | | Net
$ |
Trade name | | 108,200 | | — | | 108,200 |
Favourable lease rights | | 20,862 | | 15,842 | | 5,020 |
Covenants not to compete | | 400 | | 240 | | 160 |
Deferred leasing costs | | 2,393 | | 563 | | 1,830 |
| | | | | | |
| | | |
| | 131,855 | | 16,645 | | 115,210 |
| | | | | | |
The weighted average amortization periods (expressed in number of years) are as follows:
| | |
Favourable lease rights | | 9.4 |
Covenants not to compete | | 7.0 |
Deferred leasing costs | | 9.8 |
Amortization of other intangible assets for the next five years is approximately as follows:
| | |
| | | $ |
| |
2011 | | 1,681 |
2012 | | 1,344 |
2013 | | 862 |
2014 | | 478 |
2015 | | 352 |
F-15
Dollarama Group Holdings L.P.
Notes to Consolidated Financial Statements—(Continued)
January 31, 2010 and February 1, 2009
(tabular amounts expressed in thousands of Canadian dollars, unless otherwise noted)
5 Accrued expenses and other
| | | | |
| | | 2010
$ | | 2009
$ |
| | |
Compensation and benefits | | 19,597 | | 12,265 |
Interest | | 2,152 | | 13,053 |
Inventory in transit | | 5,321 | | 1,974 |
Rent | | 4,607 | | 3,754 |
Sales taxes | | 5,366 | | 1,352 |
Other | | 8,882 | | 5,362 |
| | | | |
| | |
| | 45,925 | | 37,760 |
| | | | |
6 Long-term debt
Long-term debt outstanding consists of the following:
| | | | | | |
| | | Note | | 2010
$ | | 2009
$ |
| | | |
Term bank loan (US$234,325,000; 2009 – US$236,760,000), maturing in November 2011, repayable in quarterly capital instalments of US$608,000. Advances under the term bank loan bear interest at rates ranging from 0.75% to 1.0% per annum above the bank’s prime rate. However, borrowings under the term bank loan by way of LIBOR loans bear interest at rates ranging from 1.75% to 2.0% per annum above the bank’s LIBOR | | 6(b) | | 250,564 | | 290,386 |
Senior subordinated deferred interest notes (US$212,169,000; 2009 – US$203,449,000), maturing in August 2012, interest accrues semi-annually in arrears at a rate per annum equal to six-month LIBOR plus 5.75%, increasing to 6.25% in December 2008 and 6.75% in December 2009 | | 6(c) | | 226,872 | | 249,530 |
Senior subordinated notes, repaid during the year | | 6(a) | | — | | 245,300 |
Term bank loan, repaid during the year | | 6(b) | | — | | 53,195 |
| | | | | | |
| | | |
| | | | 477,436 | | 838,411 |
Less: Current portion | | | | 1,925 | | 15,302 |
| | | | | | |
| | | |
| | | | 475,511 | | 823,109 |
Less: Debt issue costs and discount | | | | 6,920 | | 16,725 |
| | | | | | |
| | | |
| | | | 468,591 | | 806,384 |
| | | | | | |
F-16
Dollarama Group Holdings L.P.
Notes to Consolidated Financial Statements—(Continued)
January 31, 2010 and February 1, 2009
(tabular amounts expressed in thousands of Canadian dollars, unless otherwise noted)
| | a) | Senior subordinated notes (the “Notes”) |
On November 17, 2009, the Partnership redeemed all of the issued and outstanding Notes in the aggregate principal amount of US$200,000,000 in accordance with section 5(a) of the Notes and section 3.01(a) of the Indenture at a redemption price equal to 104.438% (US$208,876,000) of the principal amounts of such Notes, plus accrued and unpaid interest up to November 17, 2009. As a result, an additional expense of US$8,876,000 ($9,183,000 using the exchange rate as of the transaction date) has been recorded as a redemption premium in interest expense.
Prior to their redemption, the Notes were converted into Canadian dollars at the foreign exchange rates prevailing at the balance sheet date. As a result, a foreign exchange gain of $35,200,000 was recorded in earnings under “Foreign exchange loss (gain) on derivative financial instruments and long-term debt” for the period from February 2, 2009 to November 17, 2009 (2009 – loss of $46,500,000).
| | b) | Senior secured credit facility |
Dollarama Group L.P. has a senior secured revolving credit facility amounting to $75,000,000 and consisting of revolving credit loans, bankers’ acceptances, swing line loans and a letter of credit facility. Borrowings under swing line loans are limited to $10,000,000 and the letter of credit facility is limited to $25,000,000. As of January 31, 2010, there were no borrowings under this facility. The senior secured credit facility also includes term bank loans. The borrowings under the term bank loans amounted to $250,564,000 as of January 31, 2010 (February 1, 2009 – $343,581,000) and letters of credit issued for the purchase of inventories amounting to $1,312,000 (February 1, 2009 – $2,170,000). Subject to certain exceptions and reductions in the total lease-adjusted leverage ratio, the term bank loans require payment of 100% of net cash proceeds on certain sales of assets, 100% of net cash proceeds on issuance of certain new indebtedness, 50% of net proceeds of a public offering or private placement, and 50% of annual excess cash flow (as defined in the credit agreement).
The term bank loan of US$234,325,000 (February 1, 2009 – US$236,759,000) has been converted into Canadian dollars at foreign exchange rates prevailing at the balance sheet dates and a foreign exchange gain of $36,821,000 (February 1, 2009 – loss of $55,624,000) has been included in the consolidated statements of earnings in “Foreign exchange loss (gain) on derivative financial instruments and long-term debt”.
The credit facilities are subject to the customary terms and conditions for loans of this nature, including limits on incurring additional indebtedness and granting liens or selling assets without the consent of the lenders. The credit facilities are also subject to the maintenance of a maximum lease-adjusted leverage ratio test and a minimum interest coverage ratio test. The credit facilities may, in certain circumstances, restrict Dollarama Group L.P.’s ability to pay distributions, including limiting distributions, unless sufficient funds are available for the repayment of indebtedness and the payment of interest expenses and taxes.
F-17
Dollarama Group Holdings L.P.
Notes to Consolidated Financial Statements—(Continued)
January 31, 2010 and February 1, 2009
(tabular amounts expressed in thousands of Canadian dollars, unless otherwise noted)
Failure to comply with the terms of the credit facilities would entitle the lenders to accelerate all amounts outstanding under the credit facilities and upon such acceleration, the lenders would be entitled to begin enforcement procedures against the assets of Dollarama Group L.P., including accounts receivable, inventories and equipment. The lender would then be repaid from the proceeds of such enforcement proceedings, using all available assets. Only after such repayment, and the payment of any other secured and unsecured creditors, would the holders of units receive any proceeds from the liquidation of the assets of Dollarama Group L.P. As of January 31, 2010, Dollarama Group L.P. was in compliance with these covenants.
| | c) | Senior subordinated deferred interest notes (the “Deferred Interest Notes”) |
The Deferred Interest Notes were issued at 99% of face value and are senior unsecured obligations of the Partnership and Dollarama Group Holdings Corporation and are structurally subordinated in right of payment to all existing and future debt and other liabilities of the Partnership’s subsidiaries. On each interest payment date, the Partnership and the Dollarama Group Holdings Corporation may elect to pay interest in cash or defer the payment of interest, and interest shall accrue on such deferred interest for subsequent interest periods. The Partnership and Dollarama Group Holdings Corporation may redeem some or all of the Deferred Interest Notes at the following redemption prices (expressed as percentages of principal plus deferred interest) plus accrued and unpaid interest, if any, to the redemption date:
| | |
| | | Redemption
price
% |
| |
Years commencing December 15, 2009 | | 101.00 |
December 15, 2010 and thereafter | | 100.00 |
Following a change in control, the Partnership will be required to offer to purchase all Deferred Interest Notes at a price of 101% of their principal amount plus deferred interest plus accrued and unpaid interest, if any, to the date of the purchase.
The Deferred Interest Notes are subject to the customary covenants restricting the Partnership’s and Dollarama Group Holdings Corporation’s ability to, among other things, incur additional debt, pay dividends and make other restricted payments, create liens, consolidate, merge or enter into business combinations, or sell assets.
The Deferred Interest Notes have been translated into Canadian dollars at the foreign exchange rates prevailing at the balance sheet dates and a foreign exchange gain of $31,798,000 (February 1, 2009 – loss of $43,746,000) has been included in the consolidated statements of earnings (loss) in “Foreign exchange loss (gain) on derivative financial instruments and long-term debt.”
| | d) | As collateral for the long-term debt, the Partnership has pledged substantially all of its assets. |
F-18
Dollarama Group Holdings L.P.
Notes to Consolidated Financial Statements—(Continued)
January 31, 2010 and February 1, 2009
(tabular amounts expressed in thousands of Canadian dollars, unless otherwise noted)
| | e) | As of January 31, 2010, the fair value of long-term debt amounted to $474,291,000. |
The fair value of long-term debt, including the portion due within one year, is primarily based on prices obtained on the quoted markets and from a third party broker.
| | f) | Principal repayments on long-term debt due in each of the next three years are approximately as follows: |
| | |
| | | $ |
| |
2011 | | 1,925 |
2012 | | 248,639 |
2013 | | 226,872 |
| | g) | As described in (b) and (c) above, certain restrictions exist regarding the transfer of funds in the form of loans, advances or cash dividends (defined as “Restricted Payments”) to and from Dollarama Group L.P. Virtually all operations of the Partnership are conducted through its subsidiary, Dollarama Group L.P., and consequently, the capacity to make Restricted Payments to the Partnership depends on the capacity of Dollarama Group L.P. to make Restricted Payments. As of January 31, 2010, the net assets of Dollarama Group L.P. amounted to $917.7 million, of which $747.6 million was restricted from payments. Subject to limitations imposed by the indenture governing the Deferred Interest Notes, as of January 31, 2010, the Partnership’s net assets amounted to $691.3 million, of which $619.4 million was restricted from payments. |
7 Other liabilities
| | | | |
| | | 2010
$ | | 2009
$ |
| | |
Unfavourable lease rights, (including accumulated amortization of $15,777,000; 2009 – $13,633,000) | | 4,288 | | 6,432 |
Deferred lease inducements | | 12,903 | | 10,764 |
Deferred tenant allowances (including accumulated amortization of $4,852,000; 2009 – $3,154,000) | | 12,797 | | 10,902 |
| | | | |
| | |
| | 29,988 | | 28,098 |
| | | | |
F-19
Dollarama Group Holdings L.P.
Notes to Consolidated Financial Statements—(Continued)
January 31, 2010 and February 1, 2009
(tabular amounts expressed in thousands of Canadian dollars, unless otherwise noted)
8 Commitments
As of January 31, 2010, contractual obligations for operating leases amounted to approximately $567,599,000 (2009 – $486,938,000). The leases extend over various periods up to the year 2024.
The basic annual rent, exclusive of contingent rentals, for the next five years and thereafter is as follows:
| | |
| | | $ |
| |
2011 | | 75,514 |
2012 | | 70,567 |
2013 | | 65,635 |
2014 | | 61,072 |
2015 | | 56,227 |
Thereafter | | 238,584 |
The rent and contingent rent expense of operating leases for stores, warehouses, the distribution centre and corporate headquarters included in the consolidated statement of earnings are as follows:
| | | | | | |
| | | 2010
$ | | 2009
$ | | 2008
$ |
| | | |
Basic rent | | 73,979 | | 67,142 | | 57,696 |
Contingent rent | | 2,298 | | 1,839 | | 1,069 |
| | | | | | |
| | | |
| | 76,277 | | 68,981 | | 58,765 |
| | | | | | |
F-20
Dollarama Group Holdings L.P.
Notes to Consolidated Financial Statements—(Continued)
January 31, 2010 and February 1, 2009
(tabular amounts expressed in thousands of Canadian dollars, unless otherwise noted)
9 Derivative financial instruments
A summary of the aggregate contractual or notional amounts, balance sheet location and estimated fair values of derivative financial instruments as of January 31, 2010 and February 1, 2009 is as follows:
| | | | | | | | | |
| | | As of January 31, 2010 |
| | | Contractual
nominal
value
US$ | | Balance
sheet
location | | Fair value –
Asset
(liability)
$ | | | Nature of
hedging
relationship |
| | | | |
Hedging instruments | | | | | | | | | |
Foreign exchange forward contracts | | 125,000 | | Current assets | | 3,479 | | | Cash flow hedge |
Foreign exchange forward contracts | | 130,000 | | Current liabilities | | (9,889 | ) | | Cash flow hedge |
| | | | | | | | | |
| | | | |
| | 255,000 | | | | (6,410 | ) | | |
| | | | |
Non-hedging instruments | | | | | | | | | |
Foreign currency and interest rate swaps | | 234,300 | | Current liabilities | | (32,759 | ) | | |
Foreign currency swap agreements | | 70,000 | | Long-term assets | | 5,342 | | | |
Foreign currency swap agreements | | 143,000 | | Current liabilities | | (12,546 | ) | | |
| | | | | | | | | |
| | | | |
| | 702,300 | | | | (46,373 | ) | | |
| | | | | | | | | |
| |
| | | As of February 1, 2009 |
| | | Contractual
nominal
value
US$ | | Balance
sheet
location | | Fair value –
Asset
$ | | | Nature of
hedging
relationship |
| | | | |
Hedging instruments | | | | | | | | | |
Foreign exchange forward contracts | | 174,000 | | Current assets | | 33,175 | | | Cash flow hedge |
Foreign currency swap agreements | | 200,000 | | Long-term assets | | 25,447 | | | Cash flow hedge |
| | | | | | | | | |
| | | | |
| | 374,000 | | | | 58,622 | | | |
| | | | |
Non-hedging instruments | | | | | | | | | |
Foreign currency and interest rate swap agreements | | 236,700 | | Long-term assets | | 7,976 | | | |
| | | | | | | | | |
| | | | |
| | 610,700 | | | | 66,598 | | | |
| | | | | | | | | |
F-21
Dollarama Group Holdings L.P.
Notes to Consolidated Financial Statements—(Continued)
January 31, 2010 and February 1, 2009
(tabular amounts expressed in thousands of Canadian dollars, unless otherwise noted)
| | | | | |
| | | As of
January 31,
2010
$ | | | As of
February 1,
2009
$ |
| | |
Derivative financial instruments | | | | | |
Current assets | | 3,479 | | | 33,175 |
Long-term assets | | 5,342 | | | 33,423 |
Current liabilities | | (55,194 | ) | | — |
| | | | | |
| | |
| | (46,373 | ) | | 66,598 |
| | | | | |
The Partnership is exposed to certain risks relating to its ongoing business operations. The primary risks managed by using derivative financial instruments are currency risk and interest rate risk. Foreign exchange forward contracts are entered into to manage the currency fluctuation risk associated with forecasted US-dollar merchandise purchases sold in the stores. Foreign currency swap agreements and foreign currency and interest rate swap agreements are entered into to manage currency fluctuation risk and interest rate risk associated with the Partnership’s US-dollar borrowings.
The Partnership formally documents the relationship between the hedging instruments and the hedged items, as well as its risk management objectives and strategies for undertaking the hedge transactions.
Derivative financial instruments are classified as held for trading or designated as hedging instruments. Derivative financial instruments are recorded at fair value determined using market prices. All gains and losses from changes in fair value of derivative financial instruments not designated as hedges are recognized in earnings. The Partnership has designated its derivatives as hedges of the variability in highly probable future cash flows attributable to a recognized asset or liability or a forecasted transaction (cash flow hedges). All gains and losses from changes in fair value of derivative financial instruments designated as cash flow hedges are recorded in accumulated other comprehensive income (loss) and reclassified to earnings when the associated gains (losses) on the related hedged items are recognized.
F-22
Dollarama Group Holdings L.P.
Notes to Consolidated Financial Statements—(Continued)
January 31, 2010 and February 1, 2009
(tabular amounts expressed in thousands of Canadian dollars, unless otherwise noted)
| | | | | | | | | | | | | | | | | | | | |
| | | | | 2010 | |
| | | | | Impact on
balance sheet | | | Impact on other
comprehensive loss | | | Impact on
earnings | | | Impact on cash flows | |
| | | Note | | Change in fair
value during
the year on
investment,
long-term debt
and derivative
financial
instruments
$ | | | Unrealized
loss on derivative
financial
instruments net of
reclassification
adjustment
$ | | | Foreign
exchange gain
(loss) on
long-term debt
and derivative
financial
instruments
$ | | | Change in
fair value of
derivative
financial
instruments
$ | | | Foreign
exchange
gain (loss)
on long-term
debt
$ | | | Net
settlement of
derivative
financial
instruments
$ | |
| | | | | | | |
Investment and long-term debt | | | | | | | | | | | | | | | | | | | | |
Senior subordinated notes | | 6(a) | | 35,200 | | | — | | | 35,200 | | | — | | | (35,200 | ) | | — | |
Term B loan | | 6(b) | | 36,821 | | | — | | | 36,821 | | | — | | | (36,821 | ) | | — | |
Senior subordinated deferred interest notes | | 6(c) | | 31,798 | | | — | | | 31,798 | | | — | | | (31,798 | ) | | — | |
Short-term investment (classified as cash and cash equivalents) | | | | 2,812 | | | — | | | 2,812 | | | — | | | — | | | — | |
Other foreign exchange gain | | | | — | | | — | | | 1,386 | | | — | | | 448 | | | — | |
| | | | | | | | | | | | | | | | | | | | |
| | | | | | | |
| | | | | | | — | | | 108,017 | | | — | | | (103,371 | ) | | — | |
| | | | | | | | | | | | | | | | | | | | |
| | | | | | | |
Derivative financial instruments | | | | | | | | | | | | | | | | | | | | |
Hedging | | | | | | | | | | | | | | | | | | | | |
Foreign exchange forward contracts, net of reclassification | | 9(b) | | (39,585 | ) | | (39,585 | ) | | — | | | — | | | — | | | — | |
Impact of lag on foreign exchange forward contracts | | 9(b) | | — | | | (24,899 | ) | | — | | | (24,899 | ) | | — | | | — | |
Foreign currency swap agreements | | 9(c) | | (43,708 | ) | | (6,048 | ) | | (37,660 | ) | | 37,660 | | | — | | | — | |
Reclassification under discontinuance of hedge relationship | | 9(c) | | — | | | (2,581 | ) | | 2,581 | | | (2,581 | ) | | — | | | — | |
Realized gain on foreign currency swap agreement interest payments | | 9(c) | | — | | | — | | | 177 | | | — | | | — | | | — | |
| | | | | | | | | | | | | | | | | | | | |
| | | | | | | |
| | | | | | | (73,113 | ) | | (34,902 | ) | | 10,180 | | | — | | | — | |
| | | | | | | | | | | | | | | | | | | | |
| | | | | | | |
Non-hedging | | | | | | | | | | | | | | | | | | | | |
Foreign currency and interest rate swap agreements | | 9(a) | | (40,735 | ) | | — | | | (40,735 | ) | | 40,735 | | | — | | | — | |
Materialized loss on early settlement of derivative | | 9(c) | | 6,429 | | | — | | | — | | | — | | | — | | | (6,429 | ) |
Foreign currency swap agreements | | 9(c) | | 4,628 | | | — | | | 4,628 | | | (4,628 | ) | | — | | | — | |
Foreign exchange forward contracts – Not under hedge accounting | | 9(b) | | — | | | — | | | (4,314 | ) | | — | | | — | | | — | |
Realized loss on foreign currency and interest rate swap interest payments | | 9(a) | | — | | | — | | | (1,586 | ) | | — | | | — | | | — | |
| | | | | | | | | | | | | | | | | | | | |
| | | | | | | |
| | | | | | | — | | | (42,007 | ) | | 36,107 | | | — | | | (6,429 | ) |
| | | | | | | | | | | | | | | | | | | | |
| | | | | | | |
Total | | | | | | | (73,113 | ) | | 31,108 | | | 46,287 | | | (103,371 | ) | | (6,429 | ) |
| | | | | | | | | | | | | | | | | | | | |
F-23
Dollarama Group Holdings L.P.
Notes to Consolidated Financial Statements—(Continued)
January 31, 2010 and February 1, 2009
(tabular amounts expressed in thousands of Canadian dollars, unless otherwise noted)
| | | | | | | | | | | | | | | | | | | |
| | | | | 2009 | |
| | | | | Impact on
balance sheet | | | Impact on other
comprehensive income | | Impact on
earnings | | | Impact on cash flows | |
| | | Note | | Change in fair
value during
the year on
long-term debt
and derivative
financial
instruments
$ | | | Unrealized gain
on derivative
financial
instruments net of
reclassification
adjustment
$ | | Foreign
exchange gain
(loss) on
long-term debt
and derivative
financial
instruments
$ | | | Change in
fair value of
derivative
financial
instruments
$ | | | Foreign
exchange
gain (loss)
on long-term
debt
$ | | | Net
settlement of
derivative
financial
instruments
$ | |
| | | | | | | |
Long-term debt | | | | | | | | | | | | | | | | | | | |
Senior subordinated notes | | 6(a) | | (46,500 | ) | | — | | (46,500 | ) | | — | | | 46,500 | | | — | |
Term B loan | | 6(b) | | (55,624 | ) | | — | | (55,624 | ) | | — | | | 55,624 | | | — | |
Senior subordinated deferred interest notes | | 6(c) | | (43,746 | ) | | — | | (43,746 | ) | | — | | | 43,746 | | | — | |
Other foreign exchange loss on revaluation | | | | — | | | — | | (339 | ) | | — | | | (2,358 | ) | | — | |
| | | | | | | | | | | | | | | | | | | |
| | | | | | | |
| | | | | | | — | | (146,209 | ) | | — | | | 143,512 | | | — | |
| | | | | | | | | | | | | | | | | | | |
| | | | | | | |
Derivative financial instruments | | | | | | | | | | | | | | | | | | | |
Hedging | | | | | | | | | | | | | | | | | | | |
Foreign exchange forward contracts, net of reclassification | | 9(b) | | 37,682 | | | 37,682 | | — | | | — | | | — | | | — | |
Impact lag on foreign exchange forward contracts | | 9(b) | | — | | | 23,749 | | — | | | 23,749 | | | — | | | — | |
Foreign currency swap agreements | | 9(c) | | 50,338 | | | 3,838 | | 46,500 | | | (42,916 | ) | | — | | | — | |
Settlement of derivatives | | | | 14,035 | | | 1,716 | | 2,512 | | | (2,512 | ) | | — | | | (9,807 | ) |
Other materialized loss on early settlement of derivatives | | 9(c) | | — | | | — | | (3,584 | ) | | (3,584 | ) | | — | | | — | |
Realized loss on foreign currency agreement interest payments | | 9(c) | | — | | | — | | (498 | ) | | — | | | — | | | — | |
| | | | | | | | | | | | | | | | | | | |
| | | | | | | |
| | | | | | | 66,985 | | 44,930 | | | (25,263 | ) | | — | | | (9,807 | ) |
| | | | | | | | | | | | | | | | | | | |
| | | | | | | |
Non-hedging | | | | | | | | | | | | | | | | | | | |
Foreign currency and interest rate swap agreements | | 9(a) | | 48,693 | | | — | | 48,693 | | | (46,969 | ) | | — | | | — | |
Settlement of foreign currency and interest rate swap agreements | | 9(a) | | 10,089 | | | — | | 12,205 | | | (12,205 | ) | | — | | | 2,116 | |
Other materialized loss on early settlement of derivatives | | 9(a) | | — | | | — | | (1,724 | ) | | — | | | — | | | (1,724 | ) |
Realized loss on foreign currency and interest rate swap interest payments | | 9(a) | | — | | | — | | (2,688 | ) | | — | | | — | | | — | |
| | | | | | | | | | | | | | | | | | | |
| | | | | | | |
| | | | | | | — | | 56,486 | | | (59,174 | ) | | — | | | 392 | |
| | | | | | | | | | | | | | | | | | | |
| | | | | | | |
Total | | | | | | | 66,985 | | (44,793 | ) | | (84,437 | ) | | 143,512 | | | (9,415 | ) |
| | | | | | | | | | | | | | | | | | | |
F-24
Dollarama Group Holdings L.P.
Notes to Consolidated Financial Statements—(Continued)
January 31, 2010 and February 1, 2009
(tabular amounts expressed in thousands of Canadian dollars, unless otherwise noted)
| | | | | | | | | | | | | | | | | |
| | | | | 2008 | |
| | | | | Impact on
balance sheet | | | Impact on other
comprehensive loss | | | Impact on
earnings | | | Impact on cash flows | |
| | | Note | | Change in fair
value during
the year on
long-term debt
and derivative
financial
instruments
$ | | | Unrealized gain
(loss) on derivative
financial
instruments net of
reclassification
adjustment
$ | | | Foreign
exchange gain
(loss) on
long-term debt
and derivative
financial
instruments
$ | | | Change in
fair value of
derivative
financial
instruments
$ | | | Foreign
exchange
gain (loss) on
long-term
debt
$ | |
| | | | | | |
Long-term debt | | | | | | | | | | | | | | | | | |
Senior subordinated notes | | 6(a) | | 38,300 | | | — | | | 38,300 | | | — | | | (38,300 | ) |
Term B loan | | 6(b) | | 45,694 | | | — | | | 45,694 | | | — | | | (45,694 | ) |
Senior subordinated deferred interest notes | | 6(c) | | 36,351 | | | — | | | 36,351 | | | — | | | (36,351 | ) |
Other foreign exchange gain (loss) on revaluation | | | | — | | | — | | | (740 | ) | | — | | | 1,568 | |
| | | | | | | | | | | | | | | | | |
| | | | | | |
| | | | | | | — | | | 119,605 | | | — | | | (118,777 | ) |
| | | | | | | | | | | | | | | | | |
| | | | | | |
Derivative financial instruments | | | | | | | | | | | | | | | | | |
Hedging | | | | | | | | | | | | | | | | | |
Foreign exchange forward contracts, net of reclassification | | 9(b) | | (11,731 | ) | | (11,731 | ) | | — | | | — | | | — | |
Impact lag on foreign exchange forward contracts | | 9(b) | | — | | | (8,347 | ) | | — | | | (8,347 | ) | | — | |
Foreign currency swap agreements | | 9(c) | | (32,528 | ) | | 5,772 | | | (38,300 | ) | | 38,300 | | | — | |
Realized gain on foreign currency agreement interest payments | | 9(c) | | — | | | — | | | 60 | | | — | | | — | |
| | | | | | | | | | | | | | | | | |
| | | | | | |
| | | | | | | (14,306 | ) | | (38,240 | ) | | 29,953 | | | — | |
| | | | | | | | | | | | | | | | | |
| | | | | | |
Non-hedging | | | | | | | | | | | | | | | | | |
Foreign currency and interest rate swap agreements | | 9(a) | | (44,795 | ) | | — | | | (44,795 | ) | | 44,795 | | | — | |
Realized loss on foreign currency and interest rate swap interest payments | | 9(a) | | — | | | — | | | (2,159 | ) | | — | | | — | |
| | | | | | | | | | | | | | | | | |
| | | | | | |
| | | | | | | — | | | (46,954 | ) | | 44,795 | | | — | |
| | | | | | | | | | | | | | | | | |
| | | | | | |
Total | | | | | | | (14,306 | ) | | 34,411 | | | 74,748 | | | 118,777 | |
| | | | | | | | | | | | | | | | | |
| | a) | Foreign currency and interest rate swap agreements |
The Partnership enters into swap agreements consisting of a combination of a foreign currency swap and an interest rate swap that are undertaken to address two risks with its US dollar-denominated LIBOR-based term bank loan (note 6).
As of January 31, 2010, the various swap agreements called for the Partnership to exchange the following amounts:
| | | | | | |
| | | Interval | | Amount
paid by
Partnership
CA$ | | Amount
received
from lenders
US$ |
| | | |
January 31, 2011 | | One time | | 139,392 | | 116,588 |
November 17, 2011 | | One time | | 134,565 | | 112,596 |
April 30, 2009 to October 31, 2011 (in the aggregate) | | Quarterly | | 6,074 | | 5,069 |
| | | | | | |
| | | |
Total | | | | 280,031 | | 234,253 |
| | | | | | |
F-25
Dollarama Group Holdings L.P.
Notes to Consolidated Financial Statements—(Continued)
January 31, 2010 and February 1, 2009
(tabular amounts expressed in thousands of Canadian dollars, unless otherwise noted)
As of February 1, 2009, the various swap agreements called for the Partnership to exchange the following amounts:
| | | | | | |
| | | Interval | | Amount
paid by
Partnership
CA$ | | Amount
received
from lenders
US$ |
| | | |
January 29, 2010 | | One time | | 85,771 | | 71,943 |
January 31, 2011 | | One time | | 139,392 | | 116,588 |
November 17, 2011 | | One time | | 50,297 | | 41,912 |
April 30, 2009 to October 31, 2011 (in the aggregate) | | Quarterly | | 7,446 | | 6,212 |
| | | | | | |
| | | |
Total | | | | 282,906 | | 236,655 |
| | | | | | |
Changes in fair value of the foreign currency and interest rate swap agreements are reported in earnings under “Foreign exchange loss (gain) on derivative financial instruments and long-term debt”. Accordingly, for the year ended January 31, 2010, a loss of $40,735,000 (February 1, 2009 – gain of $60,898,000) was recorded to earnings.
Furthermore, the settlement of US$47,370,000 for CA$56,844,000 on the swap agreements entered into by the Partnership on December 18, 2008 resulted in a net cash outflow of $1,724,000.
| | b) | Foreign exchange forward contracts |
As of January 31, 2010, the Partnership was party to foreign exchange forward contracts to purchase US$255,000,000 for CA$269,385,000 (February 1, 2009 – US$174,000,000 for CA$179,977,000), maturing between February 2010 and November 2010.
In addition to the fair value of the foreign exchange forward contracts representing a loss of $6,410,000 as of January 31, 2010 (February 1, 2009 – gain of $33,175,000), “Accumulated other comprehensive income (loss)” includes a loss of $7,242,000 (February 1, 2009 – gain of $17,657,000) on foreign exchange forward contracts settled before January 31, 2010 but which will be reported in earnings based on the recognition of the related inventory in earnings.
F-26
Dollarama Group Holdings L.P.
Notes to Consolidated Financial Statements—(Continued)
January 31, 2010 and February 1, 2009
(tabular amounts expressed in thousands of Canadian dollars, unless otherwise noted)
| | c) | Foreign currency swap agreements |
In August 2005, the Partnership entered into two foreign currency swap agreements with its lenders which were undertaken to mitigate foreign exchange risk associated with the principal and interest payments on the US$200,000,000 senior subordinated notes (note 6). The swap agreements call for the Partnership to exchange fixed amounts as follows:
| | | | | | | | |
Date | | Interval | | Amount
paid by
Partnership | | Amount
received
from lender |
| | | |
August 12, 2005 | | One time | | US$ | 200,000 | | CA$ | 240,200 |
August 15, 2008 | | One time | | CA$ | 84,070 | | US$ | 70,000 |
August 15, 2012 | | One time | | CA$ | 156,130 | | US$ | 130,000 |
February 15, 2006 | | One time | | CA$ | 10,171 | | US$ | 9,023 |
August 15, 2006 to August 15, 2008 | | Semi-annual | | CA$ | 3,340 | | US$ | 3,106 |
August 15, 2006 to August 15, 2012 | | Semi-annual | | CA$ | 6,534 | | US$ | 5,769 |
In July 2008, the Partnership entered into a foreign currency swap agreement with its lenders to replace the existing foreign currency swap agreement which had a maturity date of August 15, 2008. The new swap agreement calls for the Partnership to exchange fixed amounts as follows:
| | | | | | | | |
Date | | Interval | | Amount
paid by
Partnership | | Amount
received
from lender |
| | | |
August 15, 2008 | | One time | | US$ | 70,000 | | CA$ | 70,679 |
August 15, 2012 | | One time | | CA$ | 70,679 | | US$ | 70,000 |
February 15, 2009 to August 15, 2012 | | Semi-annual | | CA$ | 3,191 | | US$ | 3,106 |
In addition, the foreign currency swap agreement which expired on August 15, 2008 no longer qualified as a cash flow hedge starting in July 2008. On August 15, 2008, the settlement of this instrument resulted in a net cash outflow of $9,807,000, which corresponded to the fair value of the swap at that time. The fair value of the swap was $(14,035,000) as of February 3, 2008.
Furthermore, the settlement of US$70,000,000 for CA$70,679,000 on the swap agreement entered into by the Partnership in July 2008 resulted in a net cash outflow of $3,584,000.
Until October 16, 2009, the fair value of the foreign currency swap agreements (the “Derivatives”) was recorded in accumulated other comprehensive income. A portion of the changes in the fair value of the Derivatives (representing the offsetting impact on the conversion of the Notes from US dollars to Canadian dollars at the balance sheet date) was reclassified from accumulated other comprehensive income to earnings under “Foreign exchange loss (gain) on derivative financial instruments and long-term debt”. Accordingly, for the period from February 2, 2009 to October 16, 2009, a loss of $37,660,000 (52-week period ended February 1, 2009 – gain of $46,500,000) was reclassified from accumulated other comprehensive income to earnings.
F-27
Dollarama Group Holdings L.P.
Notes to Consolidated Financial Statements—(Continued)
January 31, 2010 and February 1, 2009
(tabular amounts expressed in thousands of Canadian dollars, unless otherwise noted)
On October 16, 2009, the Partnership notified the Notes holders that it would redeem all of the issued and outstanding Notes. As a result, it was no longer probable that the anticipated hedge transaction linked to the Derivatives would occur, and the hedge relationship between the Notes and the Derivatives was discontinued on that date. Accordingly, as of October 16, 2009, a gain of $2,581,000 has been reclassified from accumulated other comprehensive income to earnings. From October 16, 2009 forward, as the derivatives are no longer accounted for under the hedge accounting model, changes in the fair value of the derivatives are recorded in earnings of the period under “Foreign exchange loss (gain) on derivative financial instruments and long-term debt”. A gain of $4,628,000 on the swaps was recorded in earnings for the period of October 16, 2009 to January 31, 2010.
On November 17, 2009, the Partnership modified its swap agreement described above to better mitigate the risk surrounding the outstanding debt following the reimbursement of the Notes. The modification of the swap agreement resulted in a net cash outflow of $6,429,000 by the Partnership. As a result, the current swap agreements call for the Partnership to exchange the following fixed amounts:
| | | | | | | | |
Date | | Interval | | Amount
paid by
Partnership | | Amount
received
from lender |
| | | |
August 15, 2012 | | One time | | CA$ | 164,150 | | US$ | 143,000 |
10 Partnership units
| | | | | |
| | | Number of units
(in thousands) | | Amount
$ | |
| | |
General partner | | | | | |
As of February 1, 2009 | | 374 | | 374 | |
Issued on October 16, 2009 | | 170 | | 170 | |
| | | | | |
| | |
As of January 31, 2010 | | 544 | | 544 | |
| | | | | |
| | |
| | | Number of units
(in thousands) | | Amount
$ | |
| | |
Limited partner | | | | | |
As of February 1, 2009 | | 454,484 | | 161,725 | |
Issued on October 16, 2009 | | 204,543 | | 204,543 | |
Distribution | | — | | (6,455 | ) |
| | | | | |
| | |
As of January 31, 2010 | | 659,027 | | 359,813 | |
| | | | | |
For the year ended January 31, 2010, the Partnership made capital distributions amounting to $6,455,000 (2009 – $1,433,000; 2008 – $3,945,000).
F-28
Dollarama Group Holdings L.P.
Notes to Consolidated Financial Statements—(Continued)
January 31, 2010 and February 1, 2009
(tabular amounts expressed in thousands of Canadian dollars, unless otherwise noted)
11 Stock-based compensation
Up to October 16, 2009, Dollarama Inc. (formerly known as Dollarama Capital Corporation), a parent company of the Partnership, had a management stock option plan (the “Old Plan”) whereby managers, directors and employees of the Partnership were eligible to be granted stock options to acquire shares of Dollarama Inc. (the “Corporation”).
On October 16, 2009, the Corporation completed a reorganization of its capital structure immediately followed by an initial public offering. Concurrently, the Corporation established a new management option plan (the “New Plan”) whereby managers, directors and employees of the Partnership may be granted stock options to acquire shares of Dollarama Inc. Under the New Plan, the number and characteristics of stock options granted are determined by the Board of Directors of the Corporation, and the options will have a life not exceeding 10 years.
All of the outstanding options previously granted under the Old Plan were exchanged for options issued under the New Plan. The exchange has not resulted in any incremental value being awarded to the option holders. As a result of the initial public offering completed by the Corporation, the Performance Conditions were fulfilled and as such, an expense of $4,938,000 was recorded during the year ended January 31, 2010.
Under the New Plan, the following types of options are available:
| | a) | Options with service requirements (“Service Conditions”) |
These options were granted to purchase an equivalent number of common shares. The options vest at a rate of 20% annually on the anniversary of the grant date.
| | b) | Options with service and performance requirements (“Performance Conditions”) |
These options were granted to purchase an equivalent number of common shares. The options become eligible to vest annually from the date of grant at a rate of 20% when the performance conditions are met.
F-29
Dollarama Group Holdings L.P.
Notes to Consolidated Financial Statements—(Continued)
January 31, 2010 and February 1, 2009
(tabular amounts expressed in thousands of Canadian dollars, unless otherwise noted)
| | | | | | | | | | | | | | | | |
| | | Number of
common share options | | | Weighted
average
purchase
price
$ | | Number of
preferred share options | | | Weighted
average
purchase
price
$ |
| | | Service | | | Performance | | | | Service | | | Performance | | |
| | | | | | |
Outstanding – February 3, 2008 | | 880,422 | | | 1,760,844 | | | 3.24 | | 2,513,462 | | | 5,026,924 | | | 0.88 |
| | | | | | | | | | | | | | | | |
| | | | | | |
Outstanding – February 1, 2009 | | 880,422 | | | 1,760,844 | | | 3.24 | | 2,513,462 | | | 5,026,924 | | | 0.88 |
Granted before October 16, 2009 | | 35,121 | | | 70,242 | | | 11.20 | | 100,274 | | | 200,548 | | | 1.56 |
Forfeited before October 16, 2009 | | (35,344 | ) | | (212,062 | ) | | 1.00 | | (100,900 | ) | | (605,398 | ) | | — |
| | | | | | | | | | | | | | | | |
| | | | | | |
Outstanding – October 16, 2009 | | 880,199 | | | 1,619,024 | | | 3.80 | | 2,512,836 | | | 4,622,074 | | | 0.93 |
Impact of reorganization (stock split) | | 26,683 | | | 49,081 | | | | | — | | | — | | | |
Impact of New Plan | | 241,503 | | | 444,216 | | | 9.66 | | (2,512,836 | ) | | (4,622,074 | ) | | 0.93 |
Granted after October 16, 2009 | | 17,934 | | | — | | | 18.05 | | — | | | — | | | — |
| | | | | | | | | | | | | | | | |
| | | | | | |
Outstanding – January 31, 2010 | | 1,166,319 | | | 2,112,321 | | | 5.02 | | — | | | — | | | — |
| | | | | | | | | | | | | | | | |
| | | | | | |
Exercisable – January 31, 2010 | | 998,377 | | | 1,812,307 | | | | | — | | | — | | | |
| | | | | | | | | | | | | | | | |
The weighted average remaining contractual terms of all options outstanding and of exercisable options as of January 31, 2010 and February 1, 2009 were 5.5 years and 6.4 years respectively.
The total intrinsic value for the common share options fully vested as of January 31, 2010 is $45,168,000 (February 1, 2009 – $2,269,000; February 3, 2008 – $1,719,000). The total intrinsic value for the preferred share options fully vested as of January 31, 2010 is nil since all the preferred share options under the Old Plan were exchanged for common share options under the New Plan in 2010 (February 1, 2009 – $1,162,599; February 3, 2008 – $665,461).
The Partnership has recognized a stock-based compensation expense of $5,600,000 for the year ended January 31, 2010 (February 1, 2009 – $741,000; February 3, 2008 – $1,312,000) relating to the options with Service and Performance Conditions (no amount recorded in 2009 and 2008 periods for options with Performance Conditions).
The total compensation costs related to non-vested awards not yet recognized as of January 31, 2010 amounted to $544,000 for options with Service Conditions and $489,000 for options with Performance Conditions.
F-30
Dollarama Group Holdings L.P.
Notes to Consolidated Financial Statements—(Continued)
January 31, 2010 and February 1, 2009
(tabular amounts expressed in thousands of Canadian dollars, unless otherwise noted)
12 Capital disclosures
Capital is defined as long-term debt, partners’ capital excluding accumulated other comprehensive income (loss) and the fair value of the foreign currency swap agreements when they qualify as cash flow hedges.
| | | | |
| | | As of
January 31,
2010
$ | | As of
February 1,
2009
$ |
| | |
Long-term debt, including current portion | | 470,516 | | 821,686 |
Foreign currency swap agreements | | — | | 25,447 |
Partners’ capital* | | 704,972 | | 377,009 |
| | | | |
| | |
Total capital | | 1,175,488 | | 1,224,142 |
| | | | |
| * | Excluding accumulated other comprehensive income (loss) |
The Partnership’s objectives when managing capital are to:
| | • | | provide a strong capital base so as to maintain investor, creditor and market confidence and to sustain future development of the business; |
| | • | | maintain a flexible capital structure that optimizes the cost of capital at acceptable risk and preserves the ability to meet financial obligations; and |
| | • | | ensure sufficient liquidity to pursue its organic growth strategy. |
In managing its capital structure, the Partnership monitors performance throughout the year to ensure anticipated cash distributions, working capital requirements and maintenance capital expenditures are funded from operations, available cash on deposit and, where applicable, bank borrowings. The Partnership manages its capital structure and may make adjustments to it in order to support the broader corporate strategy or in response to changes in economic conditions and risk. In order to maintain or adjust its capital structure, the Partnership may issue new debt, issue new debt to replace existing debt (with different characteristics), or reduce the amount of existing debt.
The Partnership monitors debt using a number of financial metrics, including but not limited to:
| | • | | the leverage ratio, defined as debt adjusted for value of lease obligations to the sum of (i) adjusted earnings before interest, taxes, depreciation and amortization, adjusted for annualized earnings for new stores (defined as “consolidated adjusted EBITDA”), and (ii) lease expense (EBITDA plus (ii) is defined as “consolidated EBITDAR”); and |
| | • | | the interest coverage ratio, defined as adjusted EBITDA to net interest expense (interest expense incurred net of interest income earned). |
F-31
Dollarama Group Holdings L.P.
Notes to Consolidated Financial Statements—(Continued)
January 31, 2010 and February 1, 2009
(tabular amounts expressed in thousands of Canadian dollars, unless otherwise noted)
The Partnership uses EBITDA and EBITDAR as measurements to monitor performance. Both measures, as presented, are not recognized for financial statement presentation purposes under Canadian generally accepted accounting principles and do not have a standardized meaning. Therefore, they are not likely to be comparable to similar measures presented by other entities.
The Partnership is subject to financial covenants pursuant to the credit facility agreements, which are measured on a quarterly basis. These covenants include the leverage and debt service ratios presented above. The Partnership is in compliance with all such covenants.
13 Financial instruments
Classification of financial instruments
The classification of financial instruments as of January 31, 2010 is detailed below, and their respective carrying amounts equal their fair values in all material respects.
Cash and cash equivalents are classified as held for trading, which refers to financial assets and financial liabilities typically acquired or assumed for the purpose of selling or repurchasing the instrument in the near term. Cash and cash equivalents are recorded at fair market value determined using market prices. Interest earned, gains and losses realized on disposal and unrealized gains and losses from the change in fair value are reflected in earnings.
Accounts receivable are classified as loans and receivables, which refer to non-derivative financial assets resulting from the delivery of cash or other assets by a lender to a borrower in return for a promise to repay on a specified date or on demand. Accounts receivable are recorded at amortized cost using the effective interest method.
Accounts payable, accrued expenses and other and long-term debt are classified as other liabilities. Other financial liabilities are recorded at amortized cost using the effective interest method.
Derivative financial instruments are classified as held for trading or designated as hedging instruments. The derivative financial instruments are recorded at fair value determined using market prices. All gains and losses from changes in fair value of derivative financial instruments not designated as hedges are recognized in earnings. When derivatives are designated as hedges, the Partnership has determined that they were hedges of the variability in highly probable future cash flows attributable to a recognized asset or liability, or a forecasted transaction (cash flow hedges). All gains and losses from changes in fair value of derivative financial instruments which were designed as cash flow hedges are initially recorded in “Accumulated other comprehensive income (loss)”.
F-32
Dollarama Group Holdings L.P.
Notes to Consolidated Financial Statements—(Continued)
January 31, 2010 and February 1, 2009
(tabular amounts expressed in thousands of Canadian dollars, unless otherwise noted)
Financial risk factors
The Partnership’s activities expose it to a variety of financial risks: market risk (including currency risk, fair value interest rate risk and cash flow interest rate risk), credit risk and liquidity risk. The Partnership’s overall risk management program focuses on the unpredictability of the financial market and seeks to minimize potential adverse effects on the Partnership’s financial performance. The Partnership uses derivative financial instruments to hedge certain risk exposures.
Risk management is carried out by the finance department under practices approved by the Board of Directors. This department identifies, evaluates and hedges financial risks based on the requirements of the organization. The Board of Directors provides guidance for overall risk management, covering specific areas such as currency risk, interest rate risk, credit risk and the use of derivative financial instruments.
The Partnership is exposed to foreign exchange risks arising from (1) US dollar-denominated debt and (2) the purchase of imported merchandise using US dollars, which is partially covered by foreign exchange forward contracts.
The Partnership’s risk management policy is to hedge up to 100% of anticipated cash flows required for purchases of merchandise in US dollars over the next rolling 12 months.
The Partnership uses foreign exchange forward contracts to manage risks from fluctuations in the US dollar relative to the Canadian dollar. The majority of forward contracts are used only for risk management purposes and are designated as hedges of specific anticipated purchases of merchandise. Upon redesignation or amendment of a foreign exchange forward contract, the ineffective portion of such contracts is recognized immediately in earnings. The Partnership estimates that in the absence of its currency risk management program, every $0.01 appreciation in the Canadian dollar relative to the US dollar would result in an increase in earnings before income taxes of approximately $2.0 million. The seasonality of the Partnership’s purchases would affect the quarterly impact of this variation. The Partnership periodically examines the derivative financial instruments it uses to hedge exposure to foreign currency fluctuations to ensure that these instruments are highly effective at reducing or modifying foreign exchange risk associated with the hedged item.
In addition, a majority of the Partnership’s debt is in US dollars. Therefore, a reduction in the value of the Canadian dollar versus the US dollar would reduce the funds available to service its US dollar-denominated debt. As required by the terms of its senior secured credit facility, the Partnership has entered into swap agreements consisting of foreign currency swaps and an interest rate swap that expire between January 31, 2011 and August 15, 2012, to minimize its exposure to exchange rate and interest rate fluctuations in respect of its US dollar-denominated LIBOR-based term bank loan. The Partnership estimates that in the absence of its currency risk management program, every $0.01 appreciation in the Canadian dollar relative to the US dollar would result in an increase in earnings before income taxes of $4.8 million.
F-33
Dollarama Group Holdings L.P.
Notes to Consolidated Financial Statements—(Continued)
January 31, 2010 and February 1, 2009
(tabular amounts expressed in thousands of Canadian dollars, unless otherwise noted)
The Partnership entered into other swap agreements consisting of foreign currency swaps to minimize its exposure to exchange rate fluctuations in respect of its long-term debt. These swap agreements do not qualify for hedge accounting, and their fair value fluctuations are reported in the consolidated statement of earnings.
The Partnership’s interest rate risk arises from long-term borrowings. Borrowings issued at variable rates expose the Partnership to cash flow interest rate risk. Borrowings issued at fixed rates expose the Partnership to fair value interest rate risk.
When appropriate, the Partnership analyzes its interest rate risk exposure. Various scenarios are simulated, taking into consideration refinancing, renewal of existing positions, alternative financing and hedging. Based on these scenarios, the Partnership calculates the impact on earnings of a defined interest rate shift. It uses variable-rate debt to finance a portion of its operations and capital expenditures. These obligations expose it to variability in interest payments due to changes in interest rates. It has approximately $250.6 million in a term bank loan outstanding under its senior secured credit facility based on the exchange rate on January 31, 2010, bearing interest at variable rates. Each quarter point change in interest rates would result in a $0.6 million change in interest expense on such term bank loans.
The Partnership also has approximately $226.9 million of senior floating rate deferred interest notes based on the exchange rate on January 31, 2010, bearing interest at variable rates. Each quarter point change in interest rates would result in a $0.6 million change in interest expense on the notes.
The Partnership is exposed to credit risk to the extent of non-payment by counterparties of its financial instruments. The Partnership has credit policies covering financial exposures. The maximum exposure to credit risk at the balance sheet date is represented by the carrying value of each financial asset, including derivative financial instruments. The Partnership mitigates this credit risk by dealing with counterparties which are major financial institutions that the Partnership anticipates will satisfy their contractual obligations.
The Partnership is exposed to credit risk on accounts receivable from its landlords for tenant allowances. In order to reduce this risk, the Partnership retains rent payments until accounts receivable are fully satisfied.
Liquidity risk is the risk that the Partnership will not be able to meet its obligations as they fall due. As of January 31, 2010, the Partnership had available credit facilities of $73.7 million (February 1, 2009 – $72.8 million), taking into consideration outstanding letters of credit of $1.3 million (February 1, 2009 – $2.2 million).
F-34
Dollarama Group Holdings L.P.
Notes to Consolidated Financial Statements—(Continued)
January 31, 2010 and February 1, 2009
(tabular amounts expressed in thousands of Canadian dollars, unless otherwise noted)
The contractual maturities, including interest, of the Partnership’s financial liabilities as of January 31, 2010 are summarized in the following table:
| | | | | | | | | | |
| | | Carrying
amount
$ | | Contractual
cash flows
$ | | Under
1 year
$ | | From 1 to
2 years
$ | | From 2 to
5 years
$ |
| | | | | |
Non-derivative financial liabilities | | | | | | | | | | |
Accounts payable | | 31,697 | | 31,697 | | 31,697 | | — | | — |
Accrued expenses and other | | 45,925 | | 45,925 | | 45,925 | | — | | — |
Senior subordinated deferred interest notes | | 226,872 | | 275,913 | | 16,347 | | 16,347 | | 243,219 |
Term bank loan – B | | 250,564 | | 259,630 | | 5,740 | | 253,890 | | — |
| | | | | | | | | | |
| | | | | |
| | 555,058 | | 613,165 | | 99,709 | | 270,237 | | 243,219 |
| | | | | | | | | | |
| | | | | |
Derivative financial liabilities | | | | | | | | | | |
Foreign exchange forward contracts | | 9,889 | | 9,889 | | 9,889 | | — | | — |
Foreign currency and interest rate swap | | 32,759 | | 32,759 | | — | | 32,759 | | — |
Foreign currency swap agreements | | 12,546 | | 12,546 | | — | | 12,546 | | — |
| | | | | | | | | | |
| | | | | |
| | 55,194 | | 55,194 | | 9,889 | | 45,305 | | — |
| | | | | | | | | | |
Foreign currencies
Monetary assets and liabilities denominated in foreign currencies are translated at year-end exchange rates, while non-monetary assets and liabilities are translated at historical rates. Revenues and expenses are translated at prevailing market rates in the recognition period. The resulting exchange gains or losses are recorded in the consolidated statements of earnings.
| | | | | |
| | | 2010
$ | | | 2009
$ |
| | |
Foreign exchange loss (gain) on derivative financial instruments and long-term debt | | (31,108 | ) | | 44,793 |
Foreign exchange loss (gain) included in cost of sales | | (29,820 | ) | | 3,723 |
| | | | | |
| | |
Aggregate foreign exchange loss (gain) included in net earnings | | (60,928 | ) | | 48,516 |
| | | | | |
Fair value of financial instruments
The Partnership adopted the amendments to CICA Handbook Section 3862 for these annual consolidated financial statements; comparative disclosures are not required in the year of adoption. The amendments require the use of a fair value hierarchy in order to classify the fair value disclosures related to the Partnership’s financial assets and financial liabilities that are recognized in the balance sheet at fair value.
F-35
Dollarama Group Holdings L.P.
Notes to Consolidated Financial Statements—(Continued)
January 31, 2010 and February 1, 2009
(tabular amounts expressed in thousands of Canadian dollars, unless otherwise noted)
The fair value hierarchy has the following levels:
| | • | | Level 1 – quoted market prices in active markets for identical assets or liabilities; |
| | • | | Level 2 – inputs other than quoted market prices included in Level 1 that are observable for the asset or liability, either directly (as prices) or indirectly (derived from prices); and |
| | • | | Level 3 – unobservable inputs such as inputs for the asset or liability that are not based on observable market data. The level in the fair value hierarchy within which the fair value measurement is categorized in its entirety is determined on the basis of the lowest level input that is significant to the fair value measurement in its entirety. |
The fair value of financial assets and financial liabilities measured in the consolidated balance sheet as of January 31, 2010 are as follows:
| | | | | | | | |
Balance sheet classification and nature | | January 31,
2010
$ | | Quoted prices
in active
markets for
identical assets
(Level 1)
$ | | Significant
observable
inputs
(Level 2)
$ | | Significant
observable
inputs
(Level 3)
$ |
| | | | |
Assets | | | | | | | | |
Cash and cash equivalents | | 92,794 | | 92,794 | | — | | — |
Accounts receivable | | 4,222 | | — | | — | | 4,222 |
Derivative financial instruments – Current | | 3,479 | | — | | 3,479 | | — |
Derivative financial instruments – Non-current | | 5,342 | | — | | 5,342 | | — |
| | | | |
Liabilities | | | | | | | | |
Accounts payable | | 31,697 | | — | | — | | 31,697 |
Accrued expenses and other | | 45,925 | | — | | — | | 45,925 |
Derivative financial instruments – Current | | 55,194 | | — | | 55,194 | | — |
Fair value measurements of the Partnership’s cash and cash equivalents are classified under Level 1 because such measurements are determined using quoted prices in active markets for identical assets.
Derivative financial instruments include foreign currency and interest rate swap agreements, foreign currency swap agreements and foreign exchange forward contracts. Fair value measurement of the Partnership’s derivative financial instruments are classified under Level 2 because such measurements are determined using published market prices or estimates based on observable inputs such as interest rates, yield curves, and spot and future exchange rates.
Fair value measurements of accounts receivable, accounts payable, and accrued expenses and other are classified under Level 3 because inputs are generally unobservable and reflect management’s estimates of assumptions that market participants would use in pricing the asset or liability.
F-36
Dollarama Group Holdings L.P.
Notes to Consolidated Financial Statements—(Continued)
January 31, 2010 and February 1, 2009
(tabular amounts expressed in thousands of Canadian dollars, unless otherwise noted)
14 Statement of cash flows information
The changes in non-cash working capital components are as follows:
| | | | | | | | | |
| | | 2010
$ | | | 2009
$ | | | 2008
$ | |
| | | |
Accounts receivable | | (1,224 | ) | | 365 | | | 2,397 | |
Income taxes recoverable/payable | | 183 | | | 1,442 | | | (463 | ) |
Deposits and prepaid expenses | | (214 | ) | | 6,809 | | | (2,921 | ) |
Merchandise inventories | | 14,960 | | | (36,131 | ) | | (32,483 | ) |
Accounts payable | | (7,330 | ) | | 15,527 | | | 7,720 | |
Accrued expenses and other | | 8,165 | | | (5,302 | ) | | 7,125 | |
| | | | | | | | | |
| | | |
| | 14,540 | | | (17,290 | ) | | (18,625 | ) |
| | | | | | | | | |
Interest paid by the Partnership for the year ended January 31, 2010 was approximately $41,758,000 (2009 – $34,004,000; 2008 – $64,622,000).
15 Related party transactions
Included in expenses are management fees of $7,054,000 (including a $5,000,000 fee payable in connection with the termination of the management agreement) for the year ended January 31, 2010 (February 1, 2009 – $3,331,000) charged by an affiliate of Bain Capital Partners VIII, LP (“Bain Capital”), a private equity firm that controls the Partnership’s parent. Furthermore, an affiliate of Bain Capital, charged a $1,000,000 consulting fee which is included in the initial public offering expenses.
Expenses charged by entities controlled by a director, which mainly comprise rent, total $9,815,211 for the year ended January 31, 2010 (February 1, 2009 – $9,559,000).
No amount was payable to Bain Capital as of January 31, 2010 (February 1, 2009 – $1,500,000 included in accrued expenses and other).
As of January 31, 2010, $2,769,000 was receivable from the Partnership’s parent and is included in accounts receivable (February 1, 2009 – payable of $693,000 included in accounts payable).
These transactions were measured at the exchange amount, which is the amount of the consideration established and agreed to by the related parties.
F-37
Dollarama Group Holdings L.P.
Notes to Consolidated Financial Statements—(Continued)
January 31, 2010 and February 1, 2009
(tabular amounts expressed in thousands of Canadian dollars, unless otherwise noted)
16 Income taxes
Reconciliation of income tax rates
| | | | | | | | | |
| | | 2010
$ | | | 2009
$ | | | 2008
$ | |
| | | |
Earnings before income taxes | | 124,398 | | | 24,244 | | | 89,171 | |
Portion of above earnings generated by non-taxable entities | | 123,628 | | | 23,712 | | | 88,441 | |
| | | | | | | | | |
| | | |
Taxable earnings | | 770 | | | 532 | | | 730 | |
| | | |
Combined statutory tax rate | | 36 | % | | 36 | % | | 38 | % |
| | | | | | | | | |
| | | |
Income taxes at statutory rate | | 277 | | | 191 | | | 277 | |
| | | |
Add: Net impact of non-deductible expense and large corporations tax | | 16 | | | 50 | | | 25 | |
| | | | | | | | | |
| | | |
Provision for current income taxes | | 293 | | | 241 | | | 302 | |
| | | | | | | | | |
Future income taxes
In computing the taxable income allocated to the partners, the Partnership has claimed capital cost allowance and certain other deductions relating to deferred charges that reduce the income allocation to the partners, thereby deferring to future years portions of income taxes otherwise payable by them.
The net difference between the reported amounts of assets and liabilities and the tax bases relating to the activities carried out by the various limited partnerships in the group is estimated at $231,964,000 as of January 31, 2010 (2009 – $186,630,000; 2008 – $156,120,000).
17 Reconciliation of accounting principles generally accepted in Canada and the United States
The Partnership has prepared these consolidated financial statements in accordance with Canadian GAAP, which conform in all material respects to those in the United States except as follows.
Merchandise inventories
Following the adoption of the new Canadian GAAP standard for inventories in its February 1, 2009 consolidated financial statements, the Partnership has opted to also change its accounting policy over merchandise inventories under US GAAP. The change in accounting policy was made to better reflect the total costs included in the supply chain, which involve purchasing in bulk and redistributing the goods within the store network.
F-38
Dollarama Group Holdings L.P.
Notes to Consolidated Financial Statements—(Continued)
January 31, 2010 and February 1, 2009
(tabular amounts expressed in thousands of Canadian dollars, unless otherwise noted)
With the above change, the Partnership has determined that costs directly associated with warehousing and distribution are capitalized as merchandise inventories whereas in all prior years, these costs were treated as period costs. This change in accounting policy has been applied retrospectively as if this accounting policy had always been applied by the Partnership. The following financial statement line items for fiscal year 2008 were affected by the change in accounting policy.
Statement of earnings
| | | | | | | |
| | | 2008 | |
| | | As
originally
reported
$ | | With
change in
accounting
policy
$ | | Effect of
change
$ | |
| | | |
Cost of sales | | 643,579 | | 642,299 | | (1,280 | ) |
Net earnings | | 88,869 | | 90,149 | | 1,280 | |
As at result of the change in accounting policy described above, the following differences exist between Canadian GAAP and US GAAP as they relate to the Partnership for the year ended February 3, 2008.
| | | | | | |
| | | 2010
$ | | 2009
$ | | 2008
$ |
| | | |
Net earnings for the year under Canadian GAAP | | 124,105 | | 24,003 | | 88,869 |
Merchandise inventories | | — | | — | | 1,280 |
Net earnings for the year under US GAAP | | 124,105 | | 24,003 | | 90,149 |
| | | |
Partners’ capital under Canadian GAAP | | 691,320 | | 436,470 | | 331,161 |
Merchandise inventories | | — | | — | | 15,013 |
Partners’ capital under US GAAP | | 691,320 | | 436,470 | | 346,174 |
Debt issue costs
For US GAAP purposes, debt issue costs are capitalized as long-term assets instead of being netted against long-term debt. Refer to note 6 for the details of the debt issue costs.
F-39
Dollarama Group Holdings L.P.
Notes to Consolidated Financial Statements—(Continued)
January 31, 2010 and February 1, 2009
(tabular amounts expressed in thousands of Canadian dollars, unless otherwise noted)
Summary of significant new accounting principles generally accepted in the United States
Accounting changes implemented
Disclosures about derivative instruments and hedging activities
In March 2008, the Financial Accounting Standards Board (“FASB”) issued guidance to improve financial reporting for derivative instruments and hedging activities by requiring enhanced disclosures regarding the impact on financial position, results of operations, and cash flows. This guidance is effective for financial statements issued for fiscal years and interim periods beginning after November 15, 2008. Disclosure requirements pertaining to this guidance are included in note 9 to the consolidated financial statements.
Determination of the useful life of intangible assets
In April 2008, the FASB issued guidance which amends the factors that should be considered in developing renewal or extension assumptions used to determine the useful life of a recognized intangible asset and the period of expected cash flows used to measure the fair value of the asset under other US GAAP. Disclosure requirements are effective for all intangible assets recognized as of, and subsequent to, fiscal years beginning after December 15, 2008. The adoption of this new standard had no impact on the consolidated financial statements.
Business combinations
In December 2007, the FASB issued guidance which establishes principles and requirements for how an acquirer recognizes and measures in its financial statements identifiable assets acquired, liabilities assumed, any non-controlling interest in an acquiree and the resulting goodwill. The guidance also establishes disclosure requirements to enable the evaluation of the nature and financial effects of the business combination. This guidance was effective for annual reporting periods beginning after December 15, 2008 and was adopted as of February 2, 2009 with no impact on the consolidated financial statements as there were no business combinations during the year ended January 31, 2010.
Non-controlling interests in consolidated financial statements
In December 2007, the FASB issued guidance to establish accounting and reporting standards for the non-controlling interest in a subsidiary and for the deconsolidation of a subsidiary. This topic clarifies that a non-controlling interest in a subsidiary is an ownership interest in the consolidated entity that should be reported as equity in the consolidated financial statements. The topic changes the way the consolidated statement of earnings (loss) is presented by requiring consolidated net earnings (loss) to be reported including the amounts attributable to both the parent interest and the non-controlling interest. It is effective for fiscal periods, and interim periods within those fiscal years, beginning on or after December 15, 2008. Its adoption as of February 2, 2009 had no impact on the consolidated financial statements.
F-40
Dollarama Group Holdings L.P.
Notes to Consolidated Financial Statements—(Continued)
January 31, 2010 and February 1, 2009
(tabular amounts expressed in thousands of Canadian dollars, unless otherwise noted)
Fair value measurements
In April 2009, the FASB issued a modification of the Fair Value Measurements and Disclosures Topic of FASB Accounting Standards Codification (the “ASC”) concerning the determination of fair value when the volume and level of activity for the asset or liability have significantly decreased and for identifying transactions that are not orderly. This modification emphasizes that even if there has been a significant decrease in the volume and level of activity for the asset or liability and regardless of the valuation technique(s) used, the objective of a fair value measurement remains the same. Fair value is the price that would be received to sell an asset or paid to transfer a liability in an orderly transaction (that is, not a forced liquidation or distressed sale) between market participants at the measurement date under current market conditions. The modification also provides guidance on identifying transactions that are not orderly by assessing certain factors among which are: an adequate marketing period for the asset or liability, whether the seller is in a distressed state and whether the transaction price is an outlier compared with recent transactions. The modification amends the disclosure provisions required by the Fair Value Measurements and Disclosures Topic of FASB ASC to require entities to disclose in interim and annual periods the inputs and valuation technique(s) used to measure fair value.
These modifications are effective for interim and annual periods ending after June 15, 2009, and have consequently been adopted by the Partnership.
Fair value disclosures for interim periods
In April 2009, the FASB issued a modification of the Fair Value Measurements and Disclosures Topic of FASB ASC concerning the interim disclosures about fair value of financial instruments, to require interim-period disclosures about fair value of financial instruments that were previously made on an annual basis only.
This modification is effective for interim and annual periods ending after June 15, 2009, with early adoption permitted. The Partnership has adopted the disclosure requirement with no impact on the consolidated financial statements.
Recognition and presentation of other-than-temporary impairments
In April 2009, the FASB issued Recognition and Presentation of Other-Than-Temporary Impairments. The new topic amends the other-than-temporary impairment guidance for debt securities to make the guidance more operational and to improve the presentation and disclosure of other-than-temporary impairments on debt and equity securities in the financial statements. This guidance does not amend existing recognition and measurement guidance related to other-than-temporary impairments of equity securities. The provisions of this topic are effective for interim and annual reporting periods ending after June 15, 2009. The Partnership adopted this new standard with no impact on the consolidated financial statements.
Management’s assessment of subsequent events
In May 2009, the FASB issued Subsequent Events which provides guidance on management’s assessment of subsequent events. Historically, management had relied on US auditing literature for guidance on assessing and disclosing subsequent events. The topic represents the inclusion of guidance on subsequent events in the accounting literature and is directed specifically to management, since management is responsible for preparing an entity’s consolidated financial statements.
F-41
Dollarama Group Holdings L.P.
Notes to Consolidated Financial Statements—(Continued)
January 31, 2010 and February 1, 2009
(tabular amounts expressed in thousands of Canadian dollars, unless otherwise noted)
The new topic does not significantly change practice because its guidance is similar to that in existing US auditing literature on subsequent events, although with some important modifications. The new topic clarifies that management must evaluate, as of each reporting period, events or transactions that occur after the balance sheet date “through the date that the financial statements are issued or are available to be issued.” Management must perform its assessment for both interim and annual financial reporting periods.
The topic is effective prospectively for interim or annual periods ending after June 15, 2009. The Partnership applied the requirements of this topic in the preparation of its January 31, 2010 consolidated financial statements.
FASB Accounting Standards Codification
On July 1, 2009, the FASB ASC became the single source of authoritative GAAP in the United States. The previous GAAP hierarchy consisted of four levels of authoritative accounting and reporting guidance, including original pronouncements of the FASB, Emerging Issues Task Force (“EITF”) abstracts, and other accounting literature (together, “previous GAAP”). The ASC eliminated this hierarchy and replaced previous GAAP (other than rules and interpretive releases of the SEC), as used by all non-governmental entities, with just two levels of literature; namely, authoritative and non-authoritative.
The FASB has indicated that the ASC does not change previous GAAP, instead, the changes aim to reduce the time and effort it takes for users to research accounting questions and improve the usability of accounting standards by reorganizing them into a topical format, where each topic is subdivided into a number of levels that aggregate all elements of literature related to that topic.
For reporting purposes, the FASB ASC has become effective for financial statements issued for interim and annual periods ending after September 15, 2009. The Partnership adopted the FASB ASC in its January 31, 2010 consolidated financial statements.
Measuring liabilities at fair value
In August 2009, the FASB issued a modification of the Fair Value Measurements and Disclosures Topic of FASB ASC concerning the measurement of liabilities at fair value when there is a lack of observable market information. This modification provides clarification of the valuation techniques that are required in circumstances in which a quoted price in an active market for the identical liability is not available. The modification of the valuation techniques had no impact on the Partnership’s fair value measurements. This modification is effective for the first reporting period (including interim periods) beginning after issuance. The Partnership adopted the modification in its January 31, 2010 consolidated financial statements.
F-42
Dollarama Group Holdings L.P.
Notes to Consolidated Financial Statements—(Continued)
January 31, 2010 and February 1, 2009
(tabular amounts expressed in thousands of Canadian dollars, unless otherwise noted)
New accounting pronouncements issued but not yet adopted
Transfers of financial assets
In June 2009, the FASB issued Accounting for Transfers of Financial Assets, which amends the derecognition guidance required by the Transfers and Servicing Topic of FASB ASC. Some of the major changes undertaken by this amendment include:
| | • | | Eliminating the concept of a Qualified Special Purpose Entity (“QSPE”) since the FASB believes, on the basis of recent experience, that many entities that have been accounted for as QSPEs are not truly passive, a belief that challenges the premise on which the QSPE exception was based. |
| | • | | Modifying the derecognition provisions as required by the Transfers and Servicing Topic of FASB ASC. The specific aims are to: |
| | • | | require that all arrangements made in connection with a transfer of financial assets be considered in the derecognition analysis; |
| | • | | clarify when a transferred asset is considered legally isolated from the transferor; |
| | • | | modify the requirements related to a transferee’s ability to freely pledge or exchange transferred financial assets; and |
| | • | | provide guidance on when a portion of a financial asset can be derecognized, thereby restricting the circumstances when sale accounting can be achieved to the following cases: |
| | • | | transfers of individual or groups of financial assets in their entirety; and |
| | • | | transfers of participating interests. |
The new amendment is effective for financial asset transfers occurring after the beginning of an entity’s first fiscal year that begins after November 15, 2009. The Partnership will assess the impact of adopting this Statement on its consolidated financial statements.
Variable interest entities
In June and December 2009, the FASB issued guidance which requires an enterprise to perform an analysis to determine whether the enterprise’s variable interest or interests give it a controlling financial interest in a variable interest entity. This guidance requires ongoing reassessments of whether an enterprise is the primary beneficiary of a variable interest entity, eliminates the quantitative approach previously required for determining the primary beneficiary of a variable interest entity and requires enhanced disclosures that will provide users of financial statements with more transparent information about an enterprise’s involvement in a variable interest entity. This guidance is effective for fiscal years beginning after November 15, 2009, and for interim and annual reporting periods thereafter. The initial adoption of this standard is not expected to have a material effect on the Partnership’s financial position, results of operations or cash flows.
F-43
Dollarama Group Holdings L.P.
Notes to Consolidated Financial Statements—(Continued)
January 31, 2010 and February 1, 2009
(tabular amounts expressed in thousands of Canadian dollars, unless otherwise noted)
Fair value disclosures
In January 2010, the FASB issued an Update of the Fair Value Measurements and Disclosures Topic of FASB ASC requiring new disclosures and amending existing guidance. This Update provides amendments that require new disclosures as follows:
| | • | | A reporting entity should disclose separately the amounts of significant transfers in and out of Level 1 and Level 2 fair value measurements and describe the reasons for the transfers; and |
| | • | | In the reconciliation for fair value measurements using significant unobservable inputs (Level 3), a reporting entity should present separately information about purchases, sales, issuances, and settlements. |
This Update also provides amendments that clarify existing disclosures as follows:
| | • | | A reporting entity should provide fair value measurements for each class of assets and liabilities; and |
| | • | | A reporting entity should provide disclosures about the valuation techniques and inputs used to measure fair value for both recurring and nonrecurring fair value measurements that fall either in Level 2 or Level 3. |
These modifications are effective for interim and annual periods beginning after December 15, 2009, except for the disclosures about purchases, sales, issuances, and settlements in the roll forward activity in Level 3 fair value measurements. Those disclosures are effective for interim and annual periods beginning after December 15, 2010. These new disclosure requirements are not expected to have a significant impact compared to the present level of disclosures.
Accounting for own-share lending arrangements in contemplation of convertible debt issuance
In October 2009, the FASB issued Accounting Standards Update (“ASU”) No. 2009-15, Accounting for Own-Share Lending Arrangements in Contemplation of Convertible Debt Issuance or Other Financing. This ASU amends Subtopic 470-20, Debt with Conversion and Other Options and Subtopic 260-10, Earnings Per Share. The ASU is effective for years beginning on or after December 15, 2009 and interim periods within those years for arrangements outstanding as of the beginning of those years.
F-44