Merger with
United Insurance Holdings, L.C.
April 2008
Safe Harbor
This presentation may contain forward-looking statements within the meaning of the Private Securities Litigation Reform Act of 1995 about FMG Acquisition Corp. (“FMG”), United Insurance Holdings, L.C. (“United”) and their combined business after completion of the proposed business combination. Forward-looking statements are statements that are not historical facts. Such forward-looking statements, based upon the current beliefs and expectations of FMG’s and United’s management, are subject to risks and uncertainties, which could cause actual results to differ from the forward-looking statements. The following factors, among others, could cause actual results to meaningfully differ from those set forth in the forward-looking statements:
| · | Continued compliance with government regulations; |
| · | Changing legislation or regulatory environments; |
| · | Requirements or changes affecting the businesses in which United is engaged; |
| · | Insurance industry trends, including factors affecting supply and demand; |
| · | Labor and personnel relations; |
| · | Credit risks affecting United’s revenue and profitability; |
| · | Changing interpretations of generally accepted accounting principles; |
| · | General economic conditions; and |
| · | Other relevant risks detailed in FMG’s filings with the Securities and Exchange Commission. |
The information set forth herein should be read in light of such risks. Neither FMG, nor United assumes any obligation to update the information contained in this presentation.
| · | Compelling business combination with United Insurance Holdings, L.C. (“United”) |
| · | Profitable homeowners insurance underwriter in Florida |
| · | 2007 results: $145 million gross written premium, $30 million net income(1) |
| · | Return on average equity of 85% |
| · | Attractive valuation and structure |
| · | $95 million consideration ($100 million with earn-out) |
| · | 8.75 million shares at $8.00 |
| · | Diluted trailing P/E multiple of 4.3x, believed to be lowest SPAC multiple EVER |
| · | United owners to retain approximately 60% position in the merged company |
| · | No external financing required to complete the merger |
| · | Reinsurance protects United from low probability, high cost storms |
| · | Significant growth opportunities |
| · | Selective expansion in Florida (currently United has a 1% share) |
| · | Expansion to states in need (Louisiana, South Carolina, New York, Massachusetts) |
| · | More service fee income through growth in United’s MGA business |
| · | Attractive use for warrant proceeds |
| · | Near-term opportunities to deploy capital at high ROE |
(1) Pro forma assuming an effective federal and state corporate tax rate of 37.6%.
| · | FMG will pay $25 million in cash plus 8.75 million shares and a maximum deferred incentive-based consideration of $5 million in cash |
| · | The transaction valuation yields an attractive trailing P/E multiple of 3.9x basic and 4.3x diluted |
| · | Fairness opinion from Piper Jaffray & Co |
($ in millions) | | | |
Current Consideration | | | |
Cash consideration | | $25.0 | |
| 8.75 million common shares at $8.00 | | 70.0 | |
Total | | $95.0 | |
Incentive-Based Consideration | | | |
Cash consideration maximum | | | |
| ($2 for every $1 earned over annual Net Income target of $25 million) | | $ | 5.0 | |
Total Consideration | | $ | 100.0 | |
($ and shares in millions) | | | | | |
Basic and Diluted Valuation for FMG Shareholders | | | |
| | | Basic | | Treasury Method | |
Price per share | | $ | 8.00 | | $ | 8.00 | |
Shares outstanding | | | 14.7 | | | 16.2 | |
Equity Value | | $ | 117.3 | | $ | 129.3 | |
2007 Net Income | | $ | 29.9 | | $ | 29.9 | |
P/E | | | 3.9 | x | | 4.3 | x |
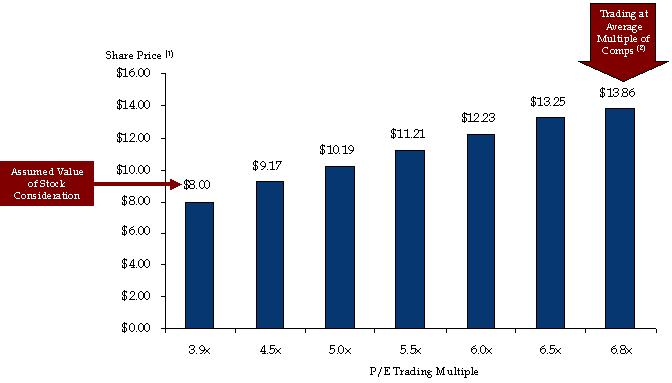
Trading Range Based on P/E Multiple
| · | The significant discount of the United purchase multiple to publicly-traded comps provides for substantial share-price appreciation potential |
| (1) | Share price assumption based on the following calculation: [P/E Trading Multiple × $29.9mm (United’s 2007 Net Income)] ÷ 14.7M (primary shares). |
| (2) | See comparable companies on page 20. |
��
| · | The size of FMG’s business combination candidate ($95 million) in relation to the size of FMG’s SPAC represents an acquisition ratio of 2.5x |
| · | As the chart below illustrates, SPACs merging with a target twice their size or greater have shown returns of 24% on average as compared to generally poor returns for transactions with smaller ratios |
Acquisition/ | | | | | |
SPAC Ratio | | Deals | | Performance | |
| <1x | | | 15 | | | (28.0 | %) |
| 1x - 2x | | | 24 | | | 5.8 | % |
| 2x+ | | | 32 | | | 24.4 | % |
United’s Shareholders Retain 60%
United’s current members will retain substantial ownership post business combination
(shares in millions)
2008 Pro Forma
| | | Basic | | Treasury | |
FMG | | | 5.9 | | | 40.3 | % | | 7.4 | | | 45.9 | % |
United | | | 8.8 | | | 59.7 | % | | 8.8 | | | 54.1 | % |
Synovus Financial Inc. | | | 1.5 | | | 10.3 | % | | 1.5 | | | 9.3 | % |
Greg Branch (United Chairman) | | | 1.5 | | | 10.0 | % | | 1.5 | | | 9.0 | % |
York Capital | | | 0.4 | | | 2.8 | % | | 0.4 | | | 2.6 | % |
Ballantyne, McKean and Sullivan | | | 0.4 | | | 2.7 | % | | 0.4 | | | 2.5 | % |
Total | | | 14.7 | | | 100.0 | % | | 16.2 | | | 100.0 | % |
(1) Assumes a share price $8.00.
| · | United underwrites homeowners insurance and selected small business insurance in the state of Florida |
| · | United was founded in 1999 to capitalize on Florida state legislation enacted to promote the formation of homeowners insurance companies |
| · | From its headquarters in St. Petersburg, 28 employees manage all business aspects including sales, underwriting, policy owner service and claims |
| · | United distributes its products through 200 agency groups throughout the state |
| · | United conducts business through its three wholly-owned subsidiaries |
| Licensed insurer that writes all policies, conducts policy assumptions, collects premiums, pays losses and manages investments and contracts with reinsurers | | Licensed managing general agent that is responsible for all other insurance-related operations | | Provides claims adjusting services |
Experienced Post-Closing Management Team
| · | Greg C. Branch – Chairman of the Board |
| · | Founder of United and chairman with previous public market and insurance experience |
| · | Chairman of Sunz Insurance Company, a Florida domiciled provider of workers’ compensation insurance |
| · | Chairman of the Board of Summit Southeast—went public in 1997 and acquired by Liberty Mutual in 1998 |
| · | Shareholder and Director of Prime Holdings (insurance group focused on excess and surplus lines products) |
| · | Florida native, with longstanding industry and political relationships |
| · | President and owner of Branch Properties |
| · | Gordon G. Pratt – Vice Chairman of the Board |
| · | Founder of FMG and executive with 20+ years’ insurance industry experience |
| · | Current or past director, investor, executive or advisor to more than two dozen insurance enterprises |
| · | Private equity, banking , insurance finance and executive |
| · | Chase Manhattan Bank, Conning & Company, Hales Group, Willis Group, Fund Management Group |
| · | Donald J. Cronin – President & CEO |
| · | Named President and CEO in 2002; directed United’s growth, underwriting, and risk management in the challenging Florida market |
| · | Experienced marketing, underwriting, and operations executive |
| · | Previously executive of United Agents Insurance Company of Louisiana; former advisor to Louisiana State University’s School of Insurance |
| · | Nicholas W. Griffin – Chief Financial Officer |
| · | Joined at United’s founding in 1999 |
| · | Oversees finance, accounting, and risk analysis functions |
| · | In-house catastrophe risk models; dynamic financial analysis and capital allocation |
| · | Accounting, investment, and treasury functions |
| · | Melville A. Russell II – Chief Underwriting Officer |
| · | Joined at United’s founding in 1999 |
| · | Gained deep underwriting experience for complex risks at two multi-line national insurance groups |
| · | Oversees underwriting, policy design, and United’s commercial lines business |
Post-closing management team has an average of over 20 years of experience in the industry |
| |
Person | | Title | | Years in Industry | | Years at Company |
| Greg C. Branch | | Chairman of the Board | | 30 | | Inception |
| Gordon G. Pratt | | Vice-Chairman of the Board | | 21 | | NA |
| Donald J. Cronin | | President and CEO | | 31 | | 7 |
| Nicholas W. Griffin | | Chief Financial Officer | | 9 | | Inception |
| Melville A. Russell II | | Chief Underwriting Officer | | 30 | | Inception |
| Larry G. Swets | | Director | | 11 | | NA |
| James R. Zuhlke | | Director | | 32 | | NA |

United’s Subsidiaries and Services
| · | United Insurance Management |
| · | Licensed MGA providing all insurance-related operations |
| · | Employs all United personnel |
| · | Sells policies through retail agents (93% of premium) |
| · | Designs and manages commercial lines programs (7% of premium) |
| · | Conducts policy and claim administration |
| · | Contains United’s “intellectual capital” |
| · | Product and program design; modeling and analytics team |
| · | Underwriting and geographic management |
| · | Risk retention and reinsurance program design |
| · | United Property and Casualty Insurance Company |
| · | Financially responsible for United’s insurance policies |
| · | Location of United’s capital for bearing insurance risk |
| · | Executes reinsurance contracts to manage retained insurance risk |
| · | Provides claim handling services to United |
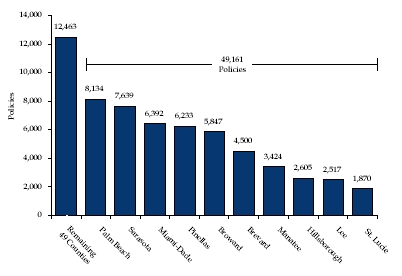
Diversified Geographically
| The United portfolio has a broad distribution across 59 counties in Florida |
| · | No single county makes up more than 15% of total policies (1) |
Policy Concentration by County
| (1) | Includes homeowners and dwelling insurance policies only. |
Marketing & Underwriting
| United’s agency relationships with multiple distribution sources has built a wide network |
| | | | 200 voluntary agents | | | 450 Florida Association of Independent Agents sub-agents |
| | | | | | | |
| | | | 725 Allstate agents | | | 2,100 takeout agents |
| · | Customized and flexible internet-based point of sale system for agents |
| United’s underwriting standards are aimed at minimizing loss, maximizing premium and optimizing geographic exposure with respect to probable maximum loss (“PML”) |
| In-house risk modeling allows for appropriate geographic distribution of exposures and better capital allocation |
| Focus on attritional (non-catastrophe) losses (25% loss ratio or below) |
| Optimization of portfolio and single exposures to street level address |
| Proactive analysis and execution |
| Zip code analysis is completed monthly to reallocate portfolio exposure (e.g. writing business based on the relationship between premium, PML contribution and Florida Hurricane Catastrophe Fund attachment point) |
| Underwriting guidelines are adjusted periodically to address strategic goals as well as to improve attritional loss results |
| In-house claims management, adjusting and processing |
| Significantly increased loss mitigation |
| Custom-built, flexible, internet-based claims processing system |
| Managers and adjusters have an average of 17 years experience |
Results of Underwriting and Claims Focus
| · | In-house claims management, adjusting and processing |
| · | Significantly increased loss mitigation |
| · | Custom-built, flexible, internet-based claims processing system |
| · | How a company manages “daily claims” (slips/falls, cracked tiles, fire, etc.) often determines the success of a Florida insurer and the level of return |
| · | As shown in the table below, United’s loss ratios have trended downwards significantly over time due to active portfolio risk management strategies |
| · | Voluntary non-renewal of unprofitable policies |
| · | Termination of poor performing agents |
| · | Reduced exposure to sinkhole losses that adversely affected calendar year 2005 |
Homeowners Non-CAT Gross Loss Ratios
| | | Calendar Year | | Accident Year | |
Year | | Loss Ratio | | Loss Ratio | |
| 2001 | | | 34 | % | | 26 | % |
| 2002 | | | 36 | % | | 34 | % |
| 2003 | | | 33 | % | | 28 | % |
| 2004 | | | 29 | % | | 31 | % |
| 2005 | | | 40 | % | | 30 | % |
| 2006 | | | 25 | % | | 20 | % |
| 2007 | | | 17 | % | | 19 | % |
Rates and Voluntary Policy Growth
| United’s rates vary across its 107 rating territories |
| United has increased rates in each year from 2001 to 2006 |
| The State of Florida mandated presumed factor and true-up filings for a 6.8% reduction in 2007 and a 3.4% reduction in 2008 |
United Rate Index (2000 = 100%) (1) | | | | | | | | | |
| 2000 | | 2001 | | 2002 | | 2003 | | 2004 | | 2005 | | 2006 | | 2007 | | 2008 |
| 100% | | 116% | | 124% | | 138% | | 151% | | 166% | | 258% | | 230% | | 222% |
| United has captured a record number of new business policies in 2007 with the trend continuing into 2008 |
| Initially, United’s disciplined underwriting criteria contributed to lower overall new business production |
| Through aggressive marketing efforts, however, agents began to understand and appreciate the United approach and value-proposition. Consequently, new business policies have shown significant growth |
| United is poised for premium growth for 2008 and beyond based on current policy writings already in place |
Monthly New Sales
Month | | Policy Count | |
| Oct-06 | | | 232 | |
| Nov-06 | | | 555 | |
| Dec-06 | | | 1,099 | |
| Jan-07 | | | 1,210 | |
| Feb-07 | | | 1,775 | |
| Mar-07 | | | 2,975 | |
| Apr-07 | | | 3,527 | |
| May-07 | | | 2,523 | |
| Jun-07 | | | 3,367 | |
| Jul-07 | | | 2,385 | |
| Aug-07 | | | 2,282 | |
| Sep-07 | | | 1,854 | |
| Oct-07 | | | 1,696 | |
| Nov-07 | | | 1,416 | |
| Dec-07 | | | 1,369 | |
| Jan-08 | | | 1,665 | |
| Feb-08 | | | 2,049 | |
| (1) | For HO3 policy, most common Florida homeowner policy. |
| The overall rate environment in Florida has improved. Based on 2007 data: |
| Estimated direct written homeowners premium statewide is $13.8 billion(1) |
| Statewide average annual loss from catastrophes model estimate of $3.8 billion(2) |
| Other expenses estimated at $6.2 billion |
| · | 25% for attritional, day-to-day homeowners losses |
| 3% for state-required boards, bureaus and taxes |
| 5% for administration costs |
| $3.8 billion for purchase of reinsurance protection beyond the average annual loss and for returns on capital |
| Florida’s direct premiums now are about 1.4x Florida’s total costs (including average annual loss) |
| Assuming average rates have doubled from seven years ago, the ratio in 2001 would have been 0.7x, pointing to the needed large rate increases over the next five years |
| Since 2000, United has obtained rate increases and managed its book to be in a position: |
| Buy flexible reinsurance to protect its shareholders and policyholders |
| Offer rate decreases in 2007 and 2008 |
| Provide an appropriate return on capital for shareholders |
| (1) | Statutory data complied by Highline Data; Citizens Property Corp. website (estimated from Q3 2007 data). |
| (2) | Jack Nicholson, Senior Officer of FHCF, on conference call of February 26, 2008. |
Reinsurance Protection
| · | United purchases substantial reinsurance protection for catastrophic events |
| · | Purchase substantial excess-of-loss multi-event coverage |
| · | Quality reinsurers with an A.M. Best rating of A- or better |
| · | 2007 Retention - 27% of statutory surplus |
| · | Reinsure up to the 100-year probable maximum loss (PML) |
| · | For the 2007 storm season (June to November): |
| · | United effectively retained $16.5 million of exposure for each event |
| · | Purchased protection through $391 million |
Probability of Hurricanes in Florida
| · | Hurricanes are a fact of life for Florida and the 2004 and 2005 storm seasons were exceptionally active |
| · | However, the last 10 storm seasons (1998-2007) included eight years with no catastrophic storms for the state |
| · | Sophisticated insurance companies manage Florida risk first through understanding how likely a catastrophic storm is and second by testing their own portfolios against a range of possible outcomes |
| · | Current estimates of a catastrophic storm (defined as a Category 3 or above hurricane) suggest that a catastrophic storm strikes the state about once every four years(1) |
| · | Not all Cat 3+ storms making landfall cause significant damage in Florida |
| · | A storm causing damage with losses of more than $7.0 billion statewide is much less likely - occurring perhaps once every nine years(2) |
| · | United manages its book of business, underwriting risk, and retention such that it estimates that it would experience a net after tax loss of $5 million or less due to a single catastrophe in 70.6% of cases |
| · | United estimates that it would experience a net after tax loss of $10.3 million or less due to a single catastrophe in 99% of cases(3) |
(1) Robert Hartwig, Insurance Information Institute, Tallahassee briefing, January 22, 2008.
(2) FHCF website, 2007 ratemaking formula report, “Modeled Adjusted Loss Severity Distributions.”
(3) AIR Clasic/2 version 9.2 Model, using United’s portfolio and management estimates.
Financial Effect of Repeat of 2005 Hurricanes
| · | The 2005 hurricane season in Florida (4 hurricanes) was statistically a highly improbable event |
($ in thousands) | | Gross Loss Before Reinsurance Protection | |
| | | 2005 Actual Gross Incurred Loss | | Jan 2008 Modeled Gross Loss(1) | | Difference | |
| Hurricane: | | | | | | | | | | |
| Dennis | | $ | 767 | | $ | 420 | | | ($ 347 | ) |
| Katrina | | $ | 46,094 | | $ | 2,662 | | $ | ( 43,432 | ) |
| Rita | | $ | 275 | | $ | 0 | | | ($ 275 | ) |
| Wilma | | $ | 300,330 | | $ | 59,451 | | | ($ 240,879 | ) |
| Gross Loss | | $ | 347,466 | | $ | 62,533 | | | ($ 284,933 | ) |
| · | The table above illustrates the actual losses United incurred in 2005 as compared to the losses it would occur today if the exact same set of storms were to occur again. The main drivers of the different outcomes are: |
| · | Shift in business mix away from higher risk areas |
| · | Premium rate increases statewide (not just in highly exposed areas) |
| · | Underwriting better homes with more windstorm mitigation features |
| · | Added “pool cage” (enclosure around pools) exclusion on all homeowners policies |
| · | “Pool cage” losses accounted for approximately 35% of all CAT losses in 2004-2005 |
1) Simulated results based on AIR Clasic/2 version 9.2.
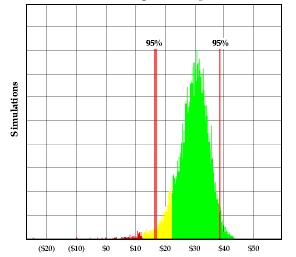
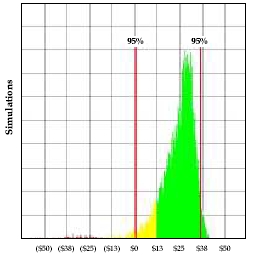
Simulation of 2008 Net Income
| · | Based on the reinsurance United has in place, standard insurance models for the state of Florida using 10,000 simulations under dynamic financial analysis produces the following statistical results for United’s 2008 net income |
2008 Net Income Forecast Excluding Catastrophes | | 2008 Net Income Forecast Including Catastrophes(1) |
| | | |
| | | |
| $ in millions | | $ in millions |
(1) Events resulting in net annual retention exceeding $65 million before tax were excluded.
| · | United has only 1% of the Florida market |
| · | Agents prefer business with United, not Citizens (state-owned insurance company) |
| · | Marketing relationship established with Allstate, Net Quote.com, Countrywide Financial and the Florida Association of Independent Agents |
| · | Apply underwriting skills and experience to selected additional states |
| · | United makes in-house use of storm modeling, portfolio optimization, and dynamic financial analysis |
| · | Management focuses on “states in need” of homeowner’s insurance capacity receptive to private-market solutions: |
| · | New York (Long Island area) |
| · | Operate on an insurance company or an MGA basis (see next point) |
| · | Expand United Insurance Management, L.C., a licensed managing general agency |
| · | Fee-based business that retains no risk |
| · | Underwriting, policy administration, accounting, reporting and risk modeling services performed by United Insurance Management, L.C. for other companies |
| · | Florida and other “states in need” attract start up capital in need of quality administration |
United is the Right Merger Partner for FMG
| · | Possess skills necessary to underwrite and control risk |
| · | In-house operation of sophisticated risk analysis models |
| · | Long-standing relationships with the Florida insurance and regulatory authorities |
| · | Chairman, Vice Chairman and Board of Directors that can optimize public market, insurance, and reinsurance experience and contacts to the benefit of United |
| · | United occupies only 1% market share in Florida - presents significant growth opportunities |
| · | Specific plans for expansion that use the company’s strength to take advantage of dislocations |
| · | Ability to perform fee-only, highly value-added services for other insurance companies |
| · | Consideration of 3.9x 2007 earnings |
| · | No external financing required to complete merger |
| · | United investors staying in: will own 60% of post-merger shares outstanding |
| · | Business opportunity not fundamentally correlated to interest rates or broader stock markets |
| · | Ability to deploy warrant proceeds directly to high ROE projects |
| · | Board will consider initiation a target payout/dividend policy |
Appendix: Comparable Company Analysis
($ in millions, except per share data)
| | | | | | | | | | | | | | | Price/ | | | | | |
| | | | | | | Market | | Boo | | PF Net | | Forward | | Book | | PF | | Forward | |
Company Name | | Ticker | | Price (1) | | Cap | | Value | | Income | | EPS (2) | | Value | | LTM/P/E | | P/E | |
| Safety Insurance Group | | | SAFT | | $ | 34.13 | | $ | 554.8 | | $ | 570.0 | | $ | 87.4 | | $ | 4.54 | | | 1.0 | x | | 6.3 | x | | 7.5 | x |
| Donegal Group | | | DGICA | | | 17.40 | | | 444.3 | | | 352.7 | | | 38.3 | | | 1.42 | | | 1.3 | x | | 11.6 | x | | 12.3 | x |
Universal Insurance Holdings | | | UVE | | | 3.78 | | | 156.5 | | | 72.6 | | | 54.0 | | | n.a. | | | 2.2 | x | | 2.9 | x | | n.a. | |
| Mercer Insurance Group | | | MIG | | | 17.39 | | | 116.9 | | | 133.4 | | | 14.2 | | | 2.20 | | | 0.9 | x | | 8.2 | x | | 7.9 | x |
21st Century Holdings | | | TCH | | | 12.81 | | | 104.9 | | | 79.2 | | | 21.3 | | | n.a. | | | 1.3 | x | | 4.9 | x | | n.a. | |
| National Security Group | | | NSEC | | | 16.76 | | | 41.3 | | | 48.4 | | | 6.0 | | | n.a. | | | 0.9 | x | | 6.8 | x | | n.a. | |
| | | | | | | | | | | | | | | | | | | | | | | | | | | | | |
| | | | | | | | | | | | | | | | | | Max | | | 2.2 | x | | 11.6 | x | | 12.3 | x |
| | | | | | | | | | | | | | | | | | Mean | | | 1.2 | x | | 6.8 | x | | 9.2 | x |
| | | | | | | | | | | | | | | | | | Median | | | 1.1 | x | | 6.6 | x | | 7.9 | x |
| | | | | | | | | | | | | | | | | | Min | | | 0.9 | x | | 2.9 | x | | 7.5 | x |
| | | | | | | | | | | | | | | | | | | | | | | | | | | | | |
United Insurance Holdings Corp. | | | FMGQ | | $ | 8.00 | | $ | 117.3 | | $ | 57.0 | | $ | 29.9 | | | n.a. | | | 2.1 | x | | 3.9 | x | | n.a. | |
| | | | | | | | | | | | | | | | | | | | | | | | | | | | | |
Reinsurance | | | | | | | | | | | | | | | | | | | | | | | | | | | | |
Allied World Assurance Company Holdings | | | AWH | | $ | 39.70 | | $ | 2,412.4 | | $ | 2,239.8 | | $ | 469.2 | | $ | 7.28 | | | 1.1 | x | | 5.1 | x | | 5.5 | x |
| Validus Holdings | | | V | | | 23.43 | | | 1,782.3 | | | 1,934.8 | | | 403.0 | | | 5.09 | | | 0.9 | x | | 4.4 | x | | 4.6 | x |
IPC Holdings | | | IPC | | | 28.00 | | | 1,693.1 | | | 2,125.7 | | | 385.4 | | | 4.67 | | | 0.8x | x | | 4.4 | x | | 6.0 | x |
Montpelier Re Holdings | | | MR | | | 16.05 | | | 1,559.2 | | | 1,653.1 | | | 315.8 | | | 2.53 | | | 0.9x | x | | 4.9 | x | | 6.4 | x |
Flagstone Reinsurance Holdings | | | FSR | | | 12.10 | | | 1,032.3 | | | 1,210.5 | | | 167.9 | | | 2.22 | | | 0.9 | x | | 6.1 | x | | 5.5 | x |
| | | | | | | | | | | | | | | | | | | | | | | | | | | | | |
| | | | | | | | | | | | | | | | | | Max | | | 1.1 | x | | 6.1 | x | | 6.4 | x |
| | | | | | | | | | | | | | | | | | Mean | | | 0.9 | x | | 5.0 | x | | 5.6 | x |
| | | | | | | | | | | | | | | | | | Median | | | 0.9 | x | | 4.9 | x | | 5.5 | x |
| | | | | | | | | | | | | | | | | | Min | | | 0.8 | x | | 4.4 | x | | 4.6 | x |
Source: SEC filings, Capital IQ.
| (1) | Share price as of 3/31/08. |
| (2) | Bloomberg consensus estimates. |
Appendix: United Income Statement
| | | For the Period Ending December 31, | |
| | 2007 | | 2006 | | 2005 | |
($ in thousands) | | | | | | | |
Revenue | | | | | | | |
| Premiums earned, net | | $ | 85,358 | | $ | 73,630 | | $ | 75,664 | |
| Net investment income | | | 7,751 | | | 5,917 | | | 2,984 | |
| Net realized investment gains | | | 322 | | | 111 | | | 85 | |
| Commission and fees | | | 2,414 | | | 2,399 | | | 1,730 | |
| Takeout bonus income | | | 13,556 | | | - | | | - | |
| Other income | | | 3,200 | | | 395 | | | 149 | |
| Total | | $ | 112,601 | | $ | 82,452 | | $ | 80,612 | |
Expenses | | | | | | | | | | |
| Losses and LAE expense | | $ | 25,662 | | $ | 35,357 | | $ | 61,617 | |
| Policy acquisition costs | | | 17,316 | | | 15,545 | | | 12,982 | |
| Operating and underwriting expenses | | | 9,110 | | | 9,748 | | | 3,958 | |
| General and administrative expenses | | | 4,870 | | | 3,589 | | | 3,142 | |
| Interest expense | | | 7,704 | | | 5,019 | | | 312 | |
| Total | | $ | 64,662 | | $ | 69,258 | | $ | 82,011 | |
| Income before income taxes | | | 47,939 | | | 13,194 | | | (1,399 | ) |
| Income taxes expense / (benefit) | | | 8,297 | | | (4,014 | ) | | (2,560 | ) |
Net income | | $ | 39,642 | | $ | 17,208 | | $ | 1,161 | |
| Effective federal tax rate | | | 37.6 | % | | 37.6 | % | | 37.6 | % |
| Income before income taxes | | $ | 47,939 | | $ | 13,194 | | | ($1,399 | ) |
| Federal taxes | | | 18,025 | | | 4,961 | | | (526 | ) |
Pro forma net income | | | 29,914 | | | 8,233 | | | (873 | ) |
| | 2007 | | 2006 | | 2005 | |
| Key Statistics | | | | | | | |
| Loss and LAE Ratio | | | 30.1 | % | | 48.0 | % | | 81.4 | % |
| Expense Ratio | | | 45.7 | % | | 46.0 | % | | 27.0 | % |
| Combined Ratio | | | 75.8 | % | | 94.0 | % | | 108.4 | % |
Appendix: United Balance Sheet
| | | As of December | |
($ in thousands) | | 2007 | | 2006 | | 2005 | |
Assets | | | | | | | | | | |
| | | 170,634 | | | 177,215 | | | 85,117 | |
| | | 9,966 | | | 10,140 | | | 5,095 | |
| | | 16,816 | | | 38,521 | | | 166,005 | |
| Prepaid reinsurance premiums | | | 26,345 | | | 34,160 | | | 10,759 | |
Deferred policy acquisition costs | | | 7,547 | | | 7,231 | | | 7,241 | |
| | | 11,118 | | | 8,773 | | | 4,149 | |
Total Assets | | $ | 242,426 | | $ | 276,040 | | $ | 278,366 | |
Liabilities and owners' equity | | | | | | | | | | |
| Liabilities | | | | | | | | | | |
| | $ | 36,005 | | $ | 57,175 | | $ | 174,217 | |
| | | 73,051 | | | 79,684 | | | 48,235 | |
Reinsurance premiums payable | | | 10,852 | | | 27,831 | | | 18,115 | |
| | | 32,586 | | | 37,597 | | | 8,290 | |
| | | 43,833 | | | 49,640 | | | 9,722 | |
| | $ | 196,327 | | $ | 251,927 | | $ | 258,579 | |
| | | | | | | | | | |
| | $ | 7,464 | | $ | 6,963 | | $ | 6,248 | |
Retained earnings | | | 37,891 | | | 17,601 | | | 14,385 | |
Accumulated other comprehensive loss | | | 744 | | | (451 | ) | | (846 | ) |
| | | 46,099 | | | 24,113 | | | 19,788 | |
Total liabilities and owners' equity | | $ | 242,426 | | $ | 276,040 | | $ | 278,366 | |
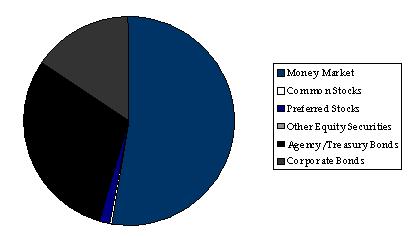
Appendix: Investment Portfolio
| · | Conservative investment philosophy |
| · | Average credit quality of fixed income portfolio AA- |
| · | Average duration of 3.51 years |
Appendix: Reinsurance Recoverables
| · | All reinsurance recoverables are ceded with “excellent” and “superior” companies according to A.M. Best ratings |
($ in thousands) | | | | | | | | | | | | | | | |
| | | | | | | | | | | | | | | | |
| Reinsurance Carrier | | AM Best Rating | | Reinsurance Recoverable on Paid Losses and LAE | |
Unpaid Losses and LAE | |
Unearned Premium | |
Total Recoverable | |
Ceded Balances Payable | |
Net Recoverable | |
| ACE Tempest Reinsurance Ltd | | | A+ | | $ | 70 | | $ | 381 | | $ | 428 | | $ | 879 | | $ | 244 | | $ | 635 | |
| Alea North America Insurance Company | | | NR-4 | | | - | | | 63 | | | - | | | 63 | | | - | | | 63 | |
| Amlin Bermuda Ltd | | | A | | | - | | | - | | | 1,253 | | | 1,253 | | | 822 | | | 431 | |
| AXA Re | | | A- | | | - | | | - | | | 282 | | | 282 | | | 229 | | | 53 | |
| Catlin Insurance Company Ltd | | | A | | | 22 | | | 151 | | | - | | | 173 | | | - | | | 173 | |
| Everest Re | | | A+ | | | - | | | - | | | 1,179 | | | 1,179 | | | 775 | | | 404 | |
| Flagstone Re | | | A- | | | - | | | - | | | 589 | | | 589 | | | 387 | | | 202 | |
| Florida Hurricane Catastrophe Fund | | | — | | | 1,612 | | | 8,236 | | | 7,812 | | | 17,660 | | | - | | | 17,660 | |
| Harco National Insurance Group | | | A- | | | 16 | | | 1,569 | | | 1,351 | | | 2,936 | | | 1,320 | | | 1,616 | |
| Hiscox Insurance Co Ltd | | | A- | | | - | | | - | | | 253 | | | 253 | | | 166 | | | 87 | |
| Lloyd's Syndicates | | | A s | | | 571 | | | 3,560 | | | 7,359 | | | 11,490 | | | 4,865 | | | 6,625 | |
| Markel International | | | A | | | 1 | | | 22 | | | 161 | | | 184 | | | 124 | | | 60 | |
| Montpelier Reinsurance Ltd | | | A- | | | 44 | | | 327 | | | 1,769 | | | 2,140 | | | 1,162 | | | 978 | |
| National Flood Insurance Program | | | — | | | - | | | - | | | 2,739 | | | 2,739 | | | - | | | 2,739 | |
| New Castle Reinsurance Co Ltd | | | A- | | | - | | | - | | | 702 | | | 702 | | | 453 | | | 249 | |
| Odyssey America Reinsurance | | | A | | | 30 | | | 111 | | | - | | | 141 | | | - | | | 141 | |
| Omega Specialty Insurance Co Ltd | | | A- | | | - | | | - | | | 294 | | | 294 | | | 194 | | | 100 | |
| WR Berkley Europe Ltd | | | A | | | 4 | | | 26 | | | 174 | | | 204 | | | 111 | | | 93 | |
| Total | | | | | $ | 2,370 | | $ | 14,446 | | $ | 26,345 | | $ | 43,161 | | $ | 10,852 | | $ | 32,309 | |
As of December 31, 2007 |
| | | | |
($ in thousands) | | | |
| | | | | |
| Florida SBA surplus notes | | $ | 20,000 | |
| Other notes payable | | | 23,833 | |
| Total shareholders' equity | | | 46,099 | |
| Total capitalization | | $ | 89,932 | |
| Statutory surplus | | $ | 51,699 | |