 United Insurance Holdings Corp. Follow-On Roadshow November 2012 Filed Pursuant to Rule 433 Issuer Free Writing Prospectus dated November 30, 2012 Relating to Preliminary Prospectus dated November 29, 2012 Registration Statement No. 333-184555 |
 2 Cautionary Statements The issuer has filed a registration statement (including a prospectus) with the SEC for the offering to which this communication relates. Before you invest, you should read the prospectus in that registration statement and other documents the issuer has filed with the SEC for more complete information about the issuer and this offering. You may get these documents for free by visiting EDGAR on the SEC Web site at www.sec.gov. Alternatively, the issuer, any underwriter or any dealer participating in the offering will arrange to send you the prospectus if you request it by calling toll-free 1-800-248-8863. This prospectus is available at Statements in this presentation that are not historical facts are forward-looking statements that are subject to certain risks and uncertainties that could cause actual events and results to differ materially from those discussed herein. Without limiting the generality of the foregoing, words such as “may,” “will,” “expect,” “believe,” “anticipate,” “intend,” “could,” “would,” “estimate,” “or “continue” or the other negative variations thereof or comparable terminology are intended to identify forward-looking statements. The forward-looking statements in this presentation include statements regarding the completion of the proposed public offering, participation of selling stockholders in the offering, participation of directors and employees in the directed share program, listing of the Company’s common stock on NASDAQ and other statements regarding Company’s or management’s plans, objectives, goals, strategies, expectations, estimates, beliefs or projections, or any other statements concerning future performance or events. The risks and uncertainties that could cause our actual results to differ from those expressed or implied herein include, without limitation, the success of the Company’s marketing initiatives, inflation and other changes in economic conditions (including changes in interest rates and financial markets); the impact of new regulations adopted in the states in which we do business which affect the property and casualty insurance market; the costs of reinsurance and the collectability of reinsurance, assessments charged by various governmental agencies; pricing competition and other initiatives by competitors; or ability to obtain regulatory approval for requested rate changes, and the timing thereof; legislative and regulatory developments; the outcome of litigation pending against us, including the terms of any settlements; risks related to the nature of our business; dependence on investment income and the composition of our investment portfolio; the adequacy of our liability for loss and loss adjustment expense; insurance agents; claims experience; ratings by industry services; catastrophe losses; reliance on key personnel; weather conditions (including the severity and frequency of storms, hurricanes, tornadoes and hail); changes in loss trends; acts of war and terrorist activities; court decisions and trends in litigation; and other matters described from time to time by us in our filings with the SEC, including, but not limited to, the risks and uncertainties described under “Risk Factors” in the Company’s Registration Statement filed November 29, 2012. In addition, investors should be aware that generally accepted accounting principles prescribe when a company may reserve for particular risks, including litigation exposures. Accordingly, results for a given reporting period could be significantly affected if and when a reserve is established for a major contingency. Reported results may therefore, appear to be volatile in certain accounting periods. The information contained in this presentation is as of September 30, 2012 and the forward-looking statements made in this presentation are only made as of the date of this presentation. The Company undertakes no obligations to update, change or revise any forward-looking statement, whether as a result of new information, additional or subsequent developments or otherwise. |
 3 Offering Size 5,000,000 primary shares and 300,075 secondary shares Approximately $30 million at recent share price Last Trade $5.38 as of November 27 th , 2012 Type Follow-on public offering of common stock Over-Allotment 15% (Primary) Exchange and Symbol Currently traded on OTCBB under “UIHC” Concurrent with this offering, United will list on the NASDAQ Capital Market under “UIHC” Use of Proceeds General corporate purposes including statutory capital in support of growth Expected Pricing Date Week of December 10 th , 2012 (1) Source: SNL Financial LC Offering Summary (1) |
   4 Directed Share Program Estimated Shares Shares to be Pro Forma Participants Currently Owned Purchased Shares Owned Greg Branch 1,527,530 263,488 1,791,018 Alec Poitevint 355,938 61,397 417,335 Kent Whittemore 221,009 38,123 259,132 Bill Hood 208,542 35,972 244,514 Kern Davis 204,152 35,215 239,367 John Forney 91,629 15,805 107,434 Employees NA 50,000 NA Total 2,608,800 500,000 3,058,800 • United Directors and Employees expect to purchase the maximum amount, 10%, of primary shares sold in this offering • Certain United shareholders associated with the formation of FMG Acquisition Corp in May 2007 have elected to exercise piggyback registration rights to sell a portion of their shares in this offering Selling Shareholders Shares Shares to be Pro Forma Participants Currently Owned Sold Shares Owned FMG Investors LLC 932,231 233,058 699,173 John Petry 31,339 31,339 - David Sturgess 17,839 17,839 - Thomas Sargent 17,839 17,839 - Total 999,248 300,075 699,173 Directed Share Program and Selling Shareholders |
 5 Compelling Market Opportunity Strong Financial Performance Superior Insurance Capabilities Exceptional Management Team Attractive Valuation UIHC Investment Highlights |
 6 Gregory C. Branch Chairman • Chairman of United since inception in 1999 • Former Chairman of Summit Holding Southeast, Inc. • Prior Member of Lloyd’s of London for over 20 years • President/Owner, Branch Properties – Parent company of Seminole Feed John L. Forney CEO • Joined United in June 2012 • Former Managing Director, Raymond James – Advised state government agencies in Florida, California, Texas and Louisiana on property catastrophe risks • Advised major national industry consortium led by State Farm and Allstate on issues relating to managing residential natural catastrophe risk B. Bradford Martz CFO • Joined United in September 2012 • Former CFO/CAO, Bankers Financial Corporation – FL-based P&C insurance holding company that insures across multiple lines and states with approximately $700 million in assets and $350 million of premiums • Former Managing Partner, Lake, Martz & Company, P.A. – Regional accounting firm Melvin A. Russell, Jr. President of UPC • Joined United at its inception in 1999 • Prior positions: Chief Underwriting Officer, SVP and Secretary • 35+ years of experience in the P&C market; 23+ years in the Florida insurance market • Prior experience in both commercial and personal lines underwriting, as well as in management with two large, national carriers Jay Williams VP of Marketing • Joined United in July 2012 • Former Managing Director, FAIA Member Services – “For-profit” subsidiary of the Florida Association of Insurance Agents • 33+ years of insurance experience; served in various new business development and marketing roles for a number of FL-based insurance agencies including Bankers Financial Corporation John Langowski VP of Claims • Joined United in October 2012 • Former VP and Chief Claims Officer, Cypress Insurance Group – FL-based homeowners and business insurer with over 100,000 policies in-force • Former Regional Director of Claims, Farmers Insurance Group • 22+ years of industry-related experience; 10+ years spent at Fortune 100 companies specializing in P&C insurance Exceptional Management Team |
 7 An insurance holding company that sources, writes and services residential property and casualty insurance policies using a network of independent agents and a group of wholly- owned insurance subsidiaries. UIHC is……….. |
 8 • Focused strategy – Opportunity is homeowners’ market in wind-exposed areas from Texas to Maine • Well established relationships with distribution channels – Total active network includes approximately 2,000 agents – Key strategic relationships: FAIA and Allstate • Strong and careful underwriting – Zip code level analysis of individual policies to optimize premium vs. PML – Avoided sinkhole problems that have plagued Florida companies • Experienced claims management – Adjusters (all in-house) average over 10 years experience • Conservative reinsurance program – Buy to 1-100 years loss and multiple event coverage • Successfully managed catastrophe risk since 1999 – Maintained profitability through unprecedented storm activity of 2004 & 2005 Business Overview |
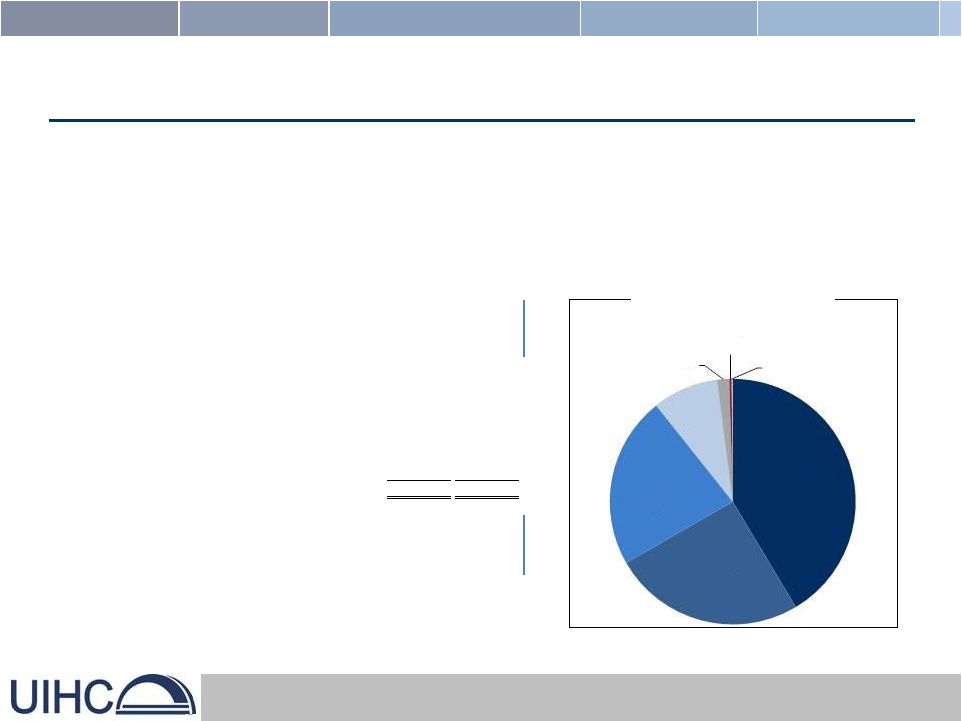
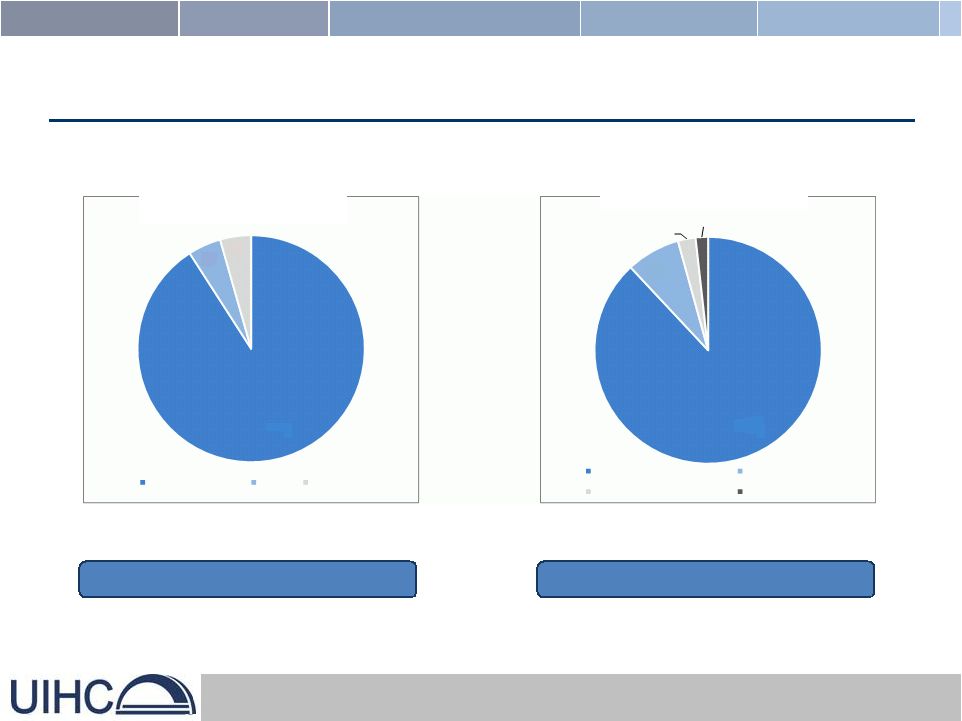 9 (1) Policy numbers exclude flood line of business Data as of September 30, 2012 Premium In-Force by Line of Business Policies In-Force Total policies in-force: 124,496 (1) Total premium in-force: $241,956 UIHC – What and Where We Write 8% 3% 2% Florida South Carolina Massachusetts Rhode Island 91% 5% 4% Homeowners Fire Flood 88% |
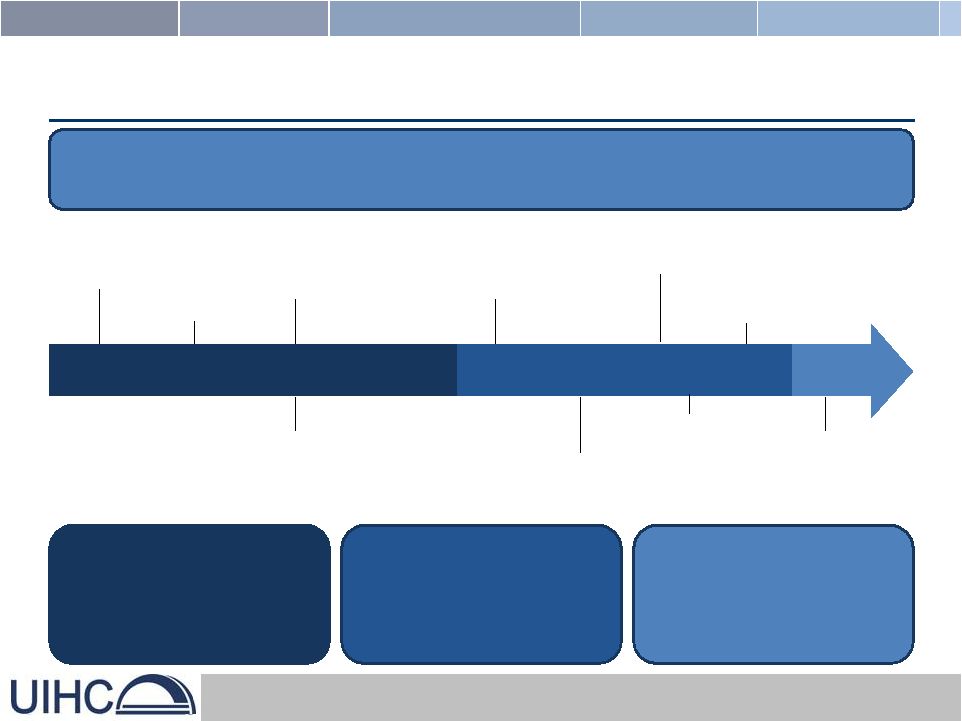 10 UIHC Has a Successful Operating History United has been profitable in all but one of its thirteen years of operations and is well-positioned to grow rapidly in Florida and other markets 1999 2002 2004 2005 2008 2009 2010 2011 PHASE 1: 1999-2007 United begins operations in Florida in 1999 and records profits every year, even in the wake of 8 hurricanes in 2004-2005 PHASE 2: 2008-2011 United becomes a public company; growth slows as regulatory and market changes impact Florida, but underlying operations remain strong and expansion outside Florida commences PHASE 3: 2012- Growth and profitability resume upward trajectory with revamped Board and management team leading business expansion in Florida and other states UPC & UIM formed with 12,000 policies Established in-house claims department United remains profitable throughout unprecedented storm activity Hurricanes Charley Frances Ivan Jeanne Dennis Rita Katrina Wilma Wind mitigation credits and rising reinsurance rates affect industry UIHC becomes publicly traded in FMG acquisition 9/29/2008 Expands into South Carolina Expands into Massachusetts Approved for rate increases, currently affecting new and renewal business Expands into Rhode Island 2012 |
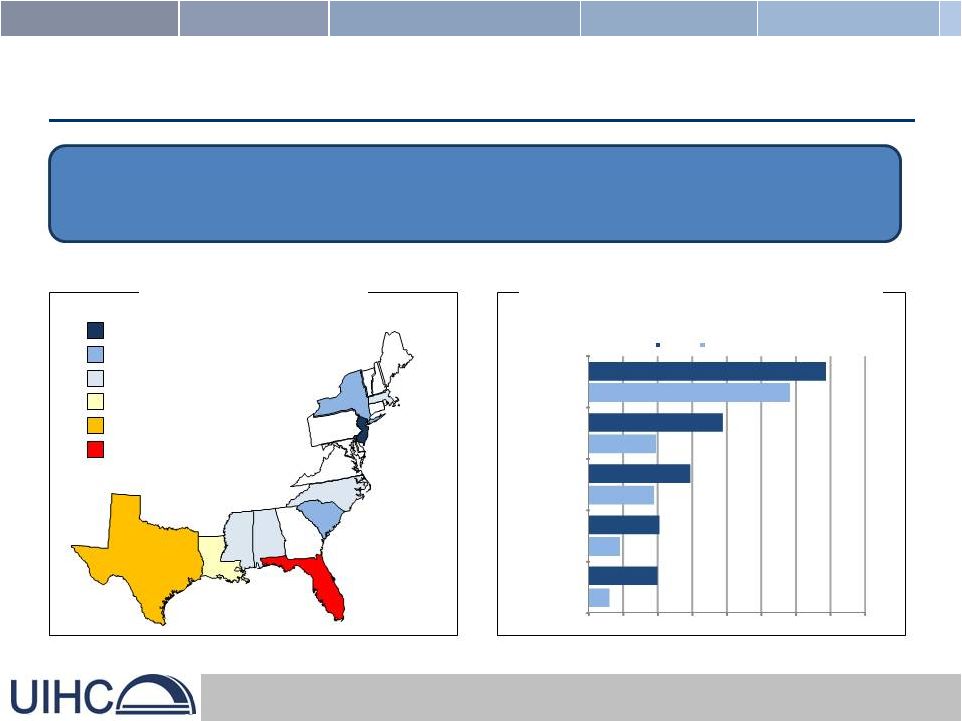 11 Source: Insurance Information Institute $2-$3B $3-$4B $4-$5B $5-$10B $10-$20B $20B+ TX $13.4 LA $7.9 MS $4.1 AL $4.9 SC $3.1 NC $4.1 NJ $2.1 MA $4.4 NY $3.7 FL $54.6 100 Year Residential PML By State Increased perception of risk and resulting dislocation in property insurance markets creates an opportunity to establish a successful and defensible market position for UIHC FAIR/Beach Plan Earned Premium as % of Overall Property Market (Top 5 States) 2002 vs. 2010 Market Opportunity 0% 2% 4% 6% 8% 10% 12% 14% 16% Texas (TWIA) Rhode Island Louisiana Massachusetts Florida 2010 2002 |
 12 Source: SNL Financial UIHC’s Percentage of 2011 Homeowner’s Market S. Carolina Massachusetts Rhode Island UIHC can achieve scale with a diverse book spread across various states 2.18% 0.65% 0.01% NA Market Opportunity Florida 2011 Homeowner’s Market – Direct Premiums Written (Premiums in $000’s) |
 13 UIHC is Growing in the Right Way Not Dependent on “Takeouts” from Citizens Strong independent agent distribution channels The Right Rate for the Right Risk Not competing on price for new business Conservative Risk Metrics Stringent portfolio optimization process for each policy added Robust, Comprehensive Reinsurance Program Buy to one-in-100 year single event plus multiple event coverage |
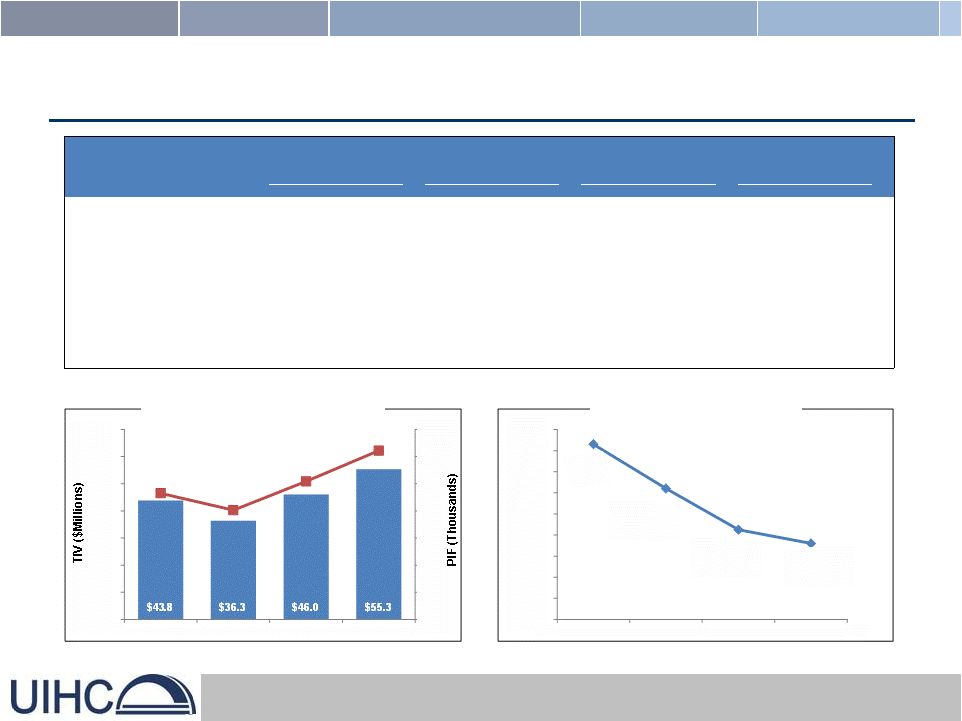 14 Quality Growth Reflected in Portfolio Metrics Total Insured Value and Policies In-Force Avg. Annual Loss to Premium In-Force $ in thousands, except policy data Nine Months Ended Years Ended December 31, Sept. 30, 2012 2011 2010 2009 Number of Policies In-Force (PIF) 124,496 101,754 80,514 93,022 Growth of PIF 22.4% 26.4% -13.4% 15.6% Total Insured Value (TIV) $55,325,100 $46,032,280 $36,312,297 $43,846,415 Growth of TIV 20.2% 26.8% -17.2% 25.3% Probable Maximum Loss (PML) $497,950 $472,620 $500,628 $618,206 Growth of PML 5.4% -5.6% -19.0% 11.1% Note: AAL and PML are modeled using AIR assuming long-term and no demand surge 0 20 40 60 80 100 120 140 $- $10 $20 $30 $40 $50 $60 $70 2009 2010 2011 2012YTD 26.6% 22.4% 18.5% 17.2% 10.0% 12.0% 14.0% 16.0% 18.0% 20.0% 22.0% 24.0% 26.0% 28.0% 2009 2010 2011 2012YTD |
 15 2012 Reinsurance Program • $103 million cost for • Cover includes a diverse and strong group of 24 separate reinsurers • Horizontal and vertical coverage: one-in-100 year single event plus multiple event coverage Total $552.6M First Event Coverage over $536 million of coverage Private Layer 4 (INCR) $38,551,403 x $150,666,720 Private Layer 5 (Top and Drop) $10,000,000 x $189,218,123 Private Layer 3 $87,333,392 x $63,333,328 Company Retention $10,000,000 Private Layer 2 $38,333,328 x $25,000,000 Private Layer 1 (Prepaid Reinstatement) $10,000,000 x $15,000,000 Florida Hurricane Catastrophe Fund Mandatory Layer 90% of $392,334,274 x $153,332,209 Captive Layer (Prepaid Reinstatement) $5,000,000 x $10,000,000 |
  16 UIHC Financial Highlights Note: AAL and PML are modeled using AIR assuming long-term and no demand surge $ in thousands, except ratios, policy data and per share amounts YTD Years Ended December 31, 9/30/2012 2011 2010 2009 Gross Written Premiums 195,385 $ 203,806 $ 158,637 $ 155,840 $ Net Premiums Earned 87,735 90,080 66,855 78,181 Average Gross Written Premium In-Force per Policy 1,858 1,894 1,878 1,664 Net Income 8,722 $ 8,088 $ (925) $ 4,057 $ Earnings per Share 0.84 0.77 (0.09) 0.38 Dividends per Share 0.05 0.05 0.05 0.15 Total Equity 64,993 $ 54,989 $ 45,293 $ 48,071 $ Total Statutory Surplus 44,528 48,188 48,495 50,345 Book Value Per Share 6.22 5.31 4.28 4.55 Ratios: Loss and LAE Ratio (based on GPE) 24.1% 21.5% 27.4% 26.1% Loss and LAE Ratio (based on NPE) 44.9% 43.1% 63.6% 52.1% Combined Ratio (based on GPE) 48.4% 45.8% 51.3% 50.5% Combined Ratio (based on NPE) 90.3% 92.0% 119.1% 101.0% Other: Total Insured Value (TIV) 55,325,100 $ 46,032,280 $ 36,312,297 $ 43,846,415 $ Probable Maximum Loss (PML) 497,950 472,620 500,628 618,206 Number of Policies In-Force (PIF) 124,496 101,800 80,500 93,000 PML to Premium In-Force 2.20x 2.45x 3.31x 3.99x AAL to Premium In-Force 17.2% 18.5% 22.4% 26.6% |
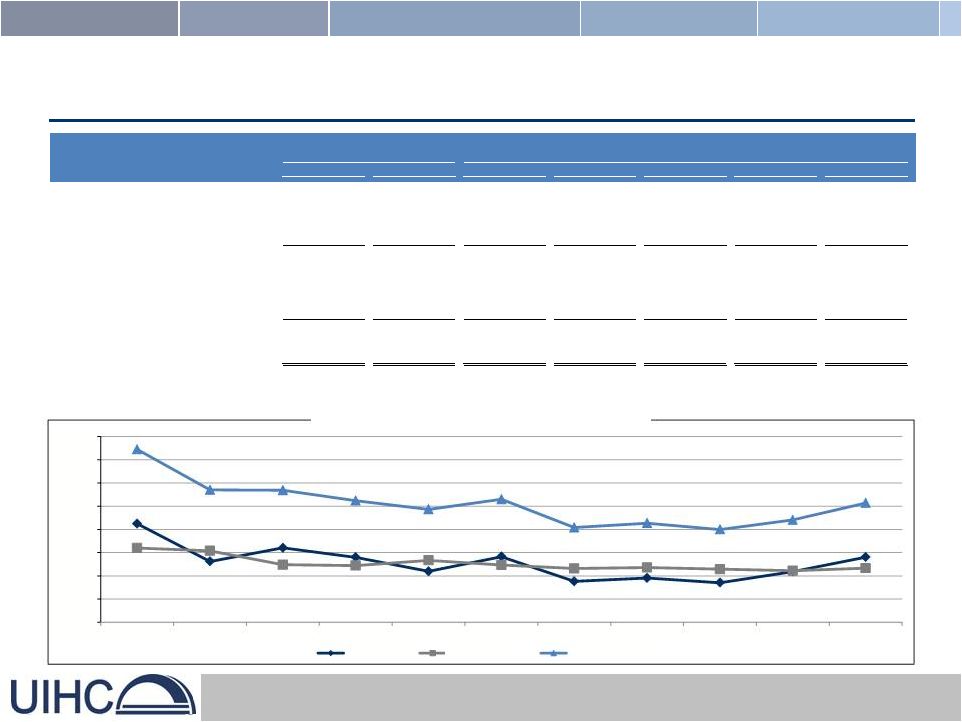 17 Historical Income Statement Historical Underwriting Ratios $ in thousands, except per share data For the Nine Months Ended September 30, For the Years Ended December 31, 2012 2011 2011 2010 2009 2008 2007 Gross premiums written 195,385 $ 160,337 $ 203,806 $ 158,637 $ 155,840 $ 141,556 $ 145,050 $ Gross premiums earned 163,683 131,752 180,837 155,307 156,393 140,223 151,684 Net premiums earned 87,735 65,267 90,080 66,855 78,181 81,144 85,358 Other revenue 5,604 4,689 6,338 13,136 10,288 19,918 27,243 Total Revenue 93,339 $ 69,956 $ 96,418 $ 79,991 $ 88,469 $ 101,062 $ 112,601 $ Losses and loss adjustment expenses 39,401 29,399 38,861 42,533 40,755 28,063 25,662 Other operating expenses 39,519 32,024 43,818 36,373 38,210 31,149 31,296 Interest expense 283 453 548 1,767 3,177 2,811 6,078 Total Expenses 79,203 $ 61,876 $ 83,227 $ 80,673 $ 82,142 $ 62,023 $ 63,036 $ Net Income 8,722 $ 4,863 $ 8,088 $ (925) $ 4,057 $ 33,419 $ 39,642 $ Earnings Per Common Share 0.84 $ 0.46 $ 0.77 $ (0.09) $ 0.38 $ 3.08 $ 3.37 $ 0.0% 20.0% 40.0% 60.0% 80.0% 100.0% 120.0% 140.0% 160.0% 1Q10 2Q10 3Q10 4Q10 1Q11 2Q11 3Q11 4Q11 1Q12 2Q12 3Q12 Loss Ratio Expense Ratio Combined Ratio |
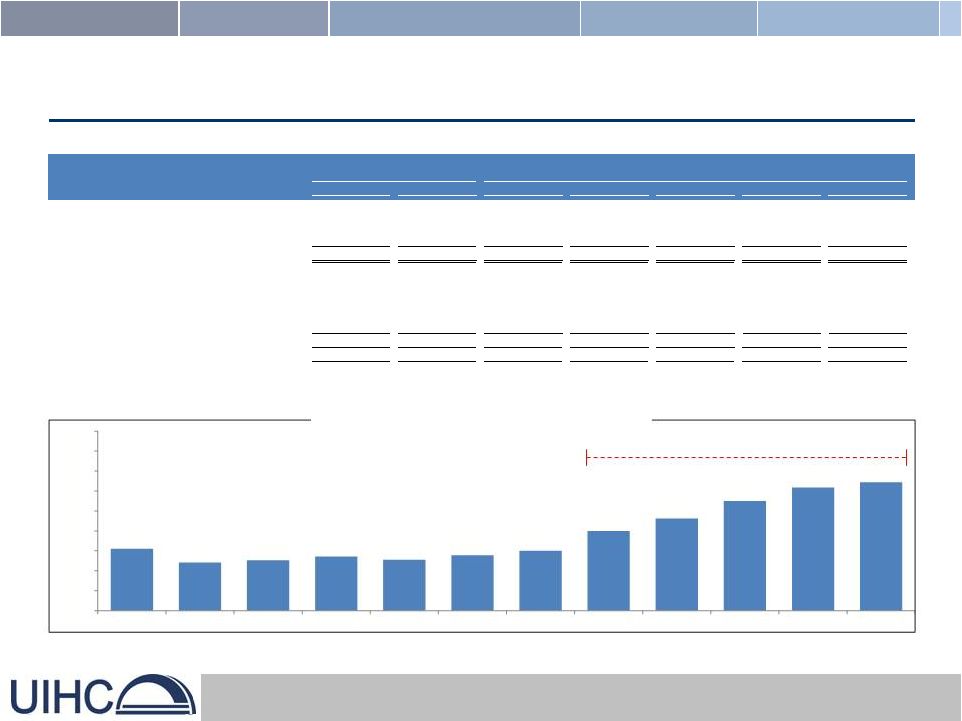 18 Historical Balance Sheet Growth of Book Value Per Share LTM growth of 24.4% $ in thousands As of September 30, As of December 31, 2012 2011 2011 2010 2009 2008 2007 Cash and invested assets 219,391 $ 185,583 $ 165,898 $ 126,242 $ 160,110 $ 155,712 $ 170,634 $ Reinsurance recoverable on paid and unpaid losses 3,013 6,643 4,458 27,304 25,477 22,604 16,816 Prepaid reinsurance premiums 77,774 63,152 40,968 38,307 40,285 26,518 26,345 Total Assets 336,895 $ 286,133 $ 240,215 $ 213,621 $ 247,758 $ 232,065 $ 242,426 $ Unpaid losses and loss adjustment expenses 35,801 $ 39,857 $ 33,600 $ 47,414 $ 44,112 $ 40,098 $ 36,005 $ Unearned premiums 131,832 105,746 100,130 77,161 73,831 74,384 73,051 Reinsurance payable 72,679 55,665 16,571 14,982 28,162 16,694 10,852 Notes payable 16,176 17,353 17,059 18,235 41,428 41,303 43,833 Total Liabilities 271,902 $ 234,345 $ 185,226 $ 168,328 $ 199,687 $ 189,138 $ 196,327 $ Total Stockholders' Equity 64,993 $ 51,788 $ 54,989 $ 45,293 $ 48,071 $ 42,927 $ 46,099 $ Statutory Surplus 44,528 $ 47,599 $ 48,188 $ 48,495 $ 50,345 $ 54,675 $ 51,699 $ $4.55 $4.21 $4.27 $4.36 $4.28 $4.39 $4.50 $5.00 $5.31 $5.75 $6.09 $6.22 $3.00 $3.50 $4.00 $4.50 $5.00 $5.50 $6.00 $6.50 $7.00 $7.50 4Q09 1Q10 2Q10 3Q10 4Q10 1Q11 2Q11 3Q11 4Q11 1Q12 2Q12 3Q12 |
   19 Investment Portfolio • Designed to preserve capital, maximize after-tax investment income, maintain liquidity and minimize risk • As of September 30, 2012, 100% of the Company’s fixed maturity portfolio was rated investment grade – Average Duration: 5.1 years – Average S&P Rating: A Securities Portfolio Securities Portfolio Value ($MMs) % Cash 90.9 $ 41.4% Corporate Debt Securities 55.4 25.3% U.S. Government & Agency Securities 49.6 22.6% States, Municipalities & Political Subdivisions 19.0 8.7% Common Stocks 3.5 1.6% Preferred Stocks 0.7 0.3% Other Long-Term Investments 0.3 0.1% 219.4 $ 100.0% Historical Return on Investments (1) 2008 2009 2010 2011 2012 1 Year 5.99% 5.52% 6.99% 4.21% 5.97% 3 Year 6.17% 5.57% 5.72% 5 Year 5.74% (1) Includes investment income and realized and unrealized gains Data as of September 30, 2012 Cash $90.9 41% Corporates $55.4 25% Gov. & Agencies $49.6 23% Munis $19.0 9% Stocks $3.5 2% Preferreds $0.7 0% Other $0.3 0% |
  20 Valuation Parameters are Favorable Market Price / LTM Price/ Cap LTM EPS ROAE Book Ticker ($MMs) (x) (%) (%) Homeowners Choice, Inc. HCI 208.2 8.1x 28.0 201 Universal Insurance Holdings, Inc. UVE 173.3 7.8x 15.0 105 Federated National Holding Company FNHC 42.7 8.6x 8.6 65 United Insurance Holdings Corp. UIHC 56.2 4.5x 20.2 86 Florida’s Publicly-Held Homeowners Insurance Companies Source: SNL Financial LC; market data as of November 27 th , 2012 |
 21 Compelling Market Opportunity Strong Financial Performance Superior Insurance Capabilities Exceptional Management Team Attractive Valuation UIHC Investment Highlights |