United Insurance Holdings Corp. NASDAQ: UIHC Investor Presentation March 2016 “Growing Gains”

2 MARCH 2016 INVESTOR PRESENTATION “Growing Gains” Who We Are UPC Insurance is a specialized personal and commercial property cat writer with a geographically diversified book of business and a long track record of consistent underwriting profitability and strong returns on invested capital.
3 MARCH 2016 INVESTOR PRESENTATION “Growing Gains” Vision and Implications To be the premier provider of property insurance in catastrophe exposed areas. VISION Intrinsic volatility must – and can – be managed while generating strong returns for shareholders
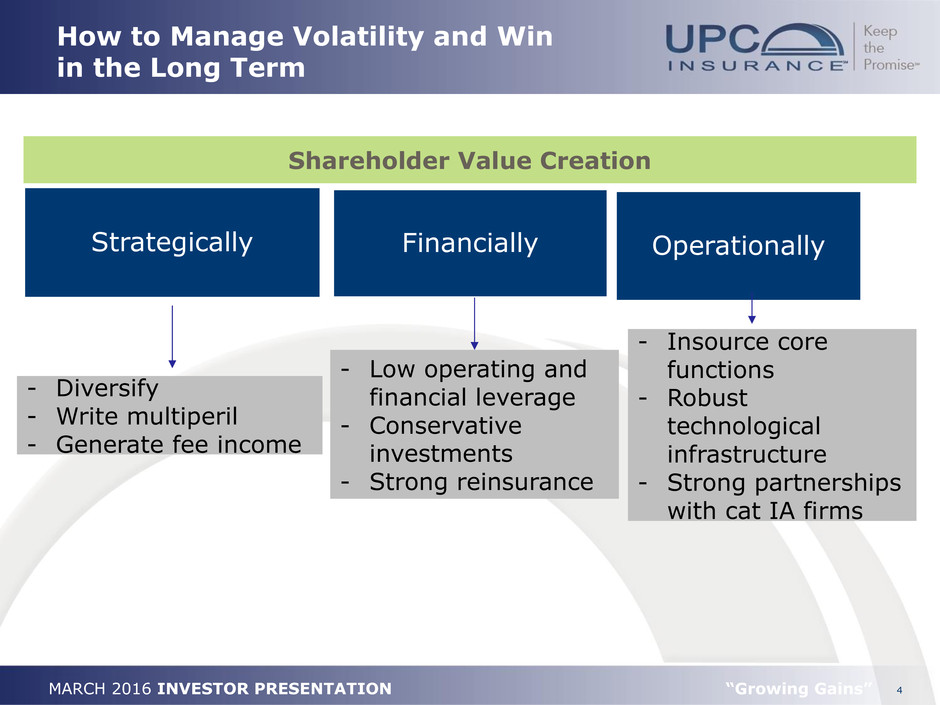
4 MARCH 2016 INVESTOR PRESENTATION “Growing Gains” How to Manage Volatility and Win in the Long Term Strategically Financially Operationally - Diversify - Write multiperil - Generate fee income Shareholder Value Creation - Low operating and financial leverage - Conservative investments - Strong reinsurance - Insource core functions - Robust technological infrastructure - Strong partnerships with cat IA firms
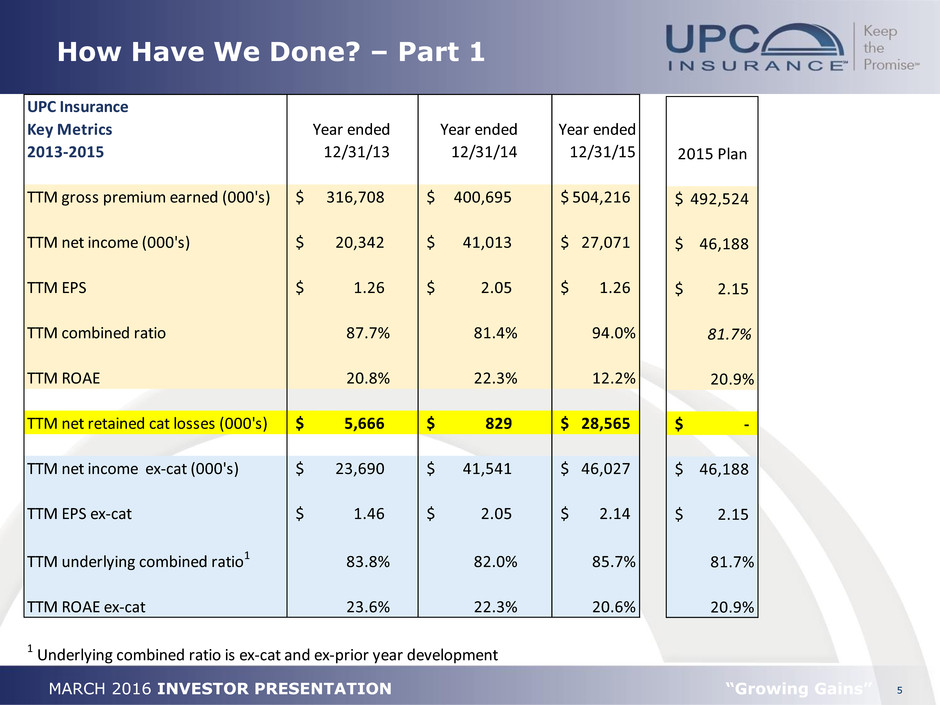
5 MARCH 2016 INVESTOR PRESENTATION “Growing Gains” How Have We Done? – Part 1 UPC Insurance Key Metrics 2013-2015 Year ended 12/31/13 Year ended 12/31/14 Year ended 12/31/15 TTM gross premium earned (000's) 316,708$ 400,695$ 504,216$ TTM net income (000's) 20,342$ 41,013$ 27,071$ TTM EPS 1.26$ 2.05$ 1.26$ TTM combined ratio 87.7% 81.4% 94.0% TTM ROAE 20.8% 22.3% 12.2% TTM net retained cat losses (000's) 5,666$ 829$ 28,565$ TTM net income ex-cat (000's) 23,690$ 41,541$ 46,027$ TTM EPS ex-cat 1.46$ 2.05$ 2.14$ TTM underlying combined ratio1 83.8% 82.0% 85.7% TTM ROAE ex-cat 23.6% 22.3% 20.6% 1 Underlying combined ratio is ex-cat and ex-prior year development 2015 Plan 492,524$ 46,188$ 2.15$ 81.7% 20.9% -$ 46,188$ 2.15$ 81.7% 20.9%

6 MARCH 2016 INVESTOR PRESENTATION “Growing Gains” How Have We Done? – Part 2 Consistent Dividend & Book Value Growth Strong Performance Relative to Indices 2012 2013 2014 2015 UIHC $198.68 $469.44 $737.16 $581.00 Russell 2000 $108.38 $148.49 $153.73 $144.95 NASDAQ Insr Index $117.01 $150.69 $163.56 $174.12 S&P Insr EFT (KIE) $105.93 $126.58 $179.74 $196.87 $- $100.00 $200.00 $300.00 $400.00 $500.00 $600.00 $700.00 $800.00 Cumulative Value of $100 Investment from 1/1/12 to 12/31/15 $- $0.05 $0.10 $0.15 $0.20 $0.25 FY12 FY13 FY14 FY15 Common Stock Dividends Paid $- $2.00 $4.00 $6.00 $8.00 $10.00 $12.00 FY12 FY13 FY14 FY15 Book Value Per Share CAGR 20.3%
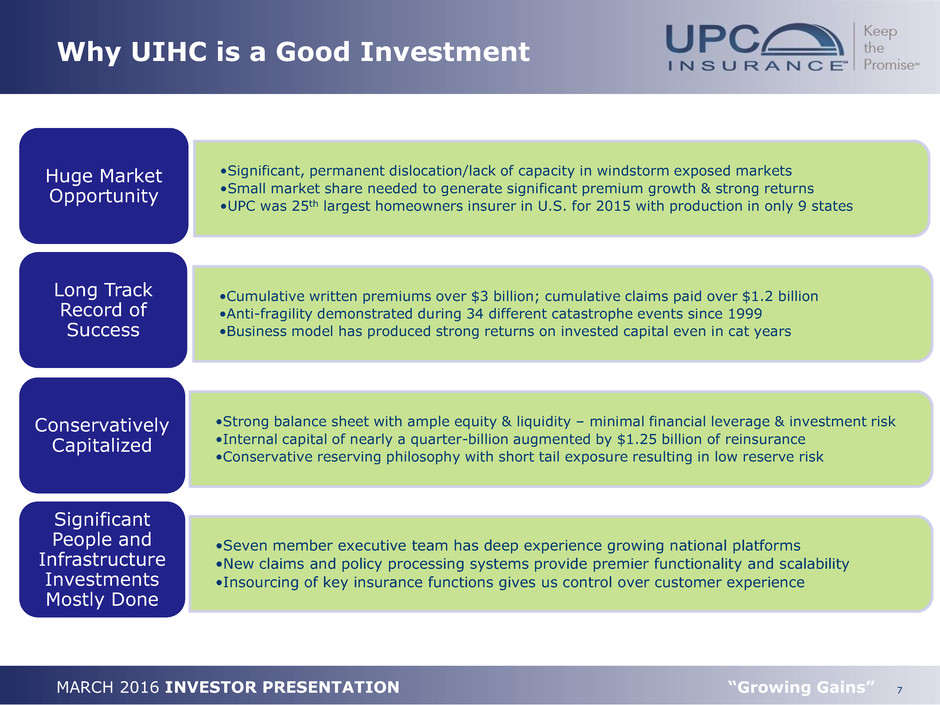
7 MARCH 2016 INVESTOR PRESENTATION “Growing Gains” Why UIHC is a Good Investment •Cumulative written premiums over $3 billion; cumulative claims paid over $1.2 billion •Anti-fragility demonstrated during 34 different catastrophe events since 1999 •Business model has produced strong returns on invested capital even in cat years Long Track Record of Success •Significant, permanent dislocation/lack of capacity in windstorm exposed markets •Small market share needed to generate significant premium growth & strong returns •UPC was 25th largest homeowners insurer in U.S. for 2015 with production in only 9 states Huge Market Opportunity •Strong balance sheet with ample equity & liquidity – minimal financial leverage & investment risk •Internal capital of nearly a quarter-billion augmented by $1.25 billion of reinsurance •Conservative reserving philosophy with short tail exposure resulting in low reserve risk Conservatively Capitalized •Seven member executive team has deep experience growing national platforms •New claims and policy processing systems provide premier functionality and scalability •Insourcing of key insurance functions gives us control over customer experience Significant People and Infrastructure Investments Mostly Done

MARCH 2016 INVESTOR PRESENTATION OPPORTUNITY AND EXECUTION
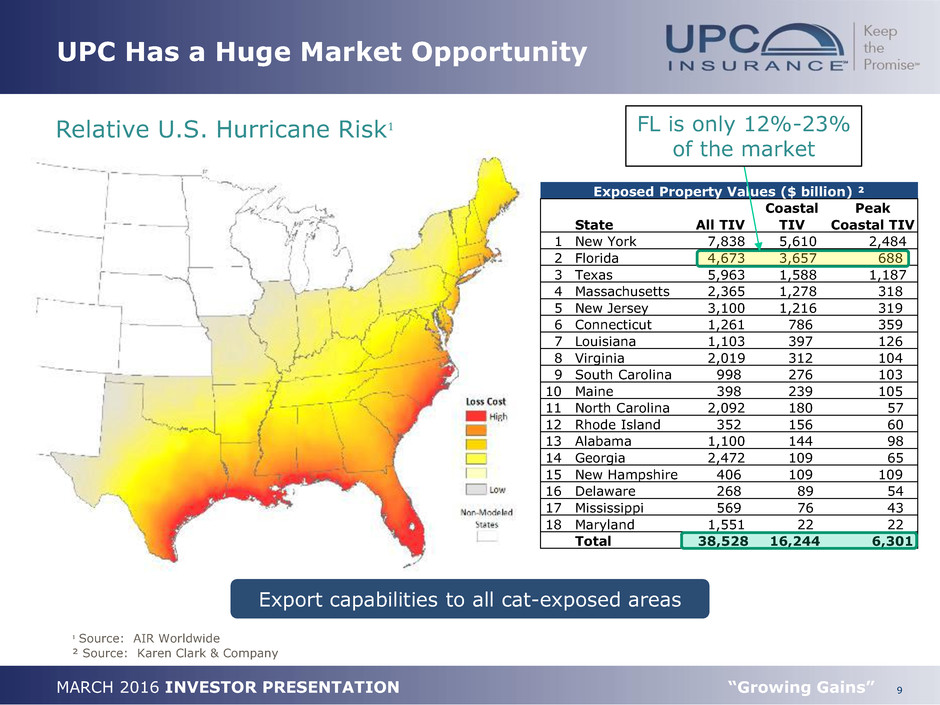
9 MARCH 2016 INVESTOR PRESENTATION “Growing Gains” UPC Has a Huge Market Opportunity Relative U.S. Hurricane Risk¹ ¹ Source: AIR Worldwide ² Source: Karen Clark & Company Export capabilities to all cat-exposed areas Exposed Property Values ($ billion) ² Coastal Peak State All TIV TIV Coastal TIV 1 New York 7,838 5,610 2,484 2 Florida 4,673 3,657 688 3 Texas 5,963 1,588 1,187 4 Massachusetts 2,365 1,278 318 5 New Jersey 3,100 1,216 319 6 Connecticut 1,261 786 359 7 Louisiana 1,103 397 126 8 Virginia 2,019 312 104 9 South Carolina 998 276 103 10 Maine 398 239 105 11 North Carolina 2,092 180 57 12 Rhode Island 352 156 60 13 Alabama 1,100 144 98 14 Georgia 2,472 109 65 15 New Hampshire 406 109 109 16 Delaware 268 89 54 17 Mississippi 569 76 43 18 Maryland 1,551 22 22 Total 38,528 16,244 6,301 FL is only 12%-23% of the market
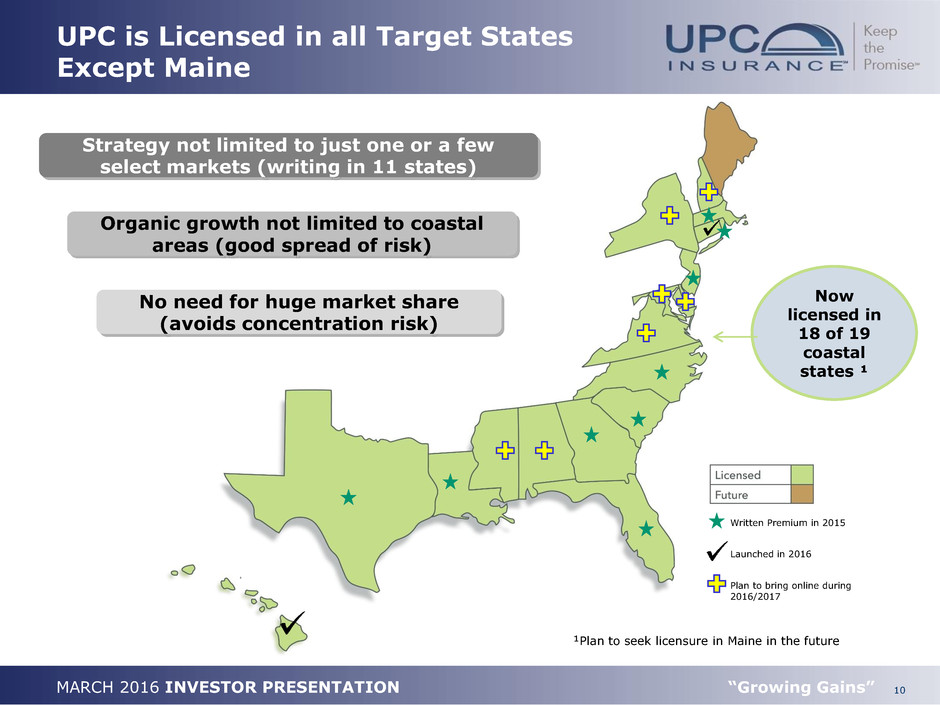
10 MARCH 2016 INVESTOR PRESENTATION “Growing Gains” UPC is Licensed in all Target States Except Maine Strategy not limited to just one or a few select markets (writing in 11 states) No need for huge market share (avoids concentration risk) Organic growth not limited to coastal areas (good spread of risk) Now licensed in 18 of 19 coastal states ¹ Written Premium in 2015 Plan to bring online during 2016/2017 ¹Plan to seek licensure in Maine in the future Launched in 2016
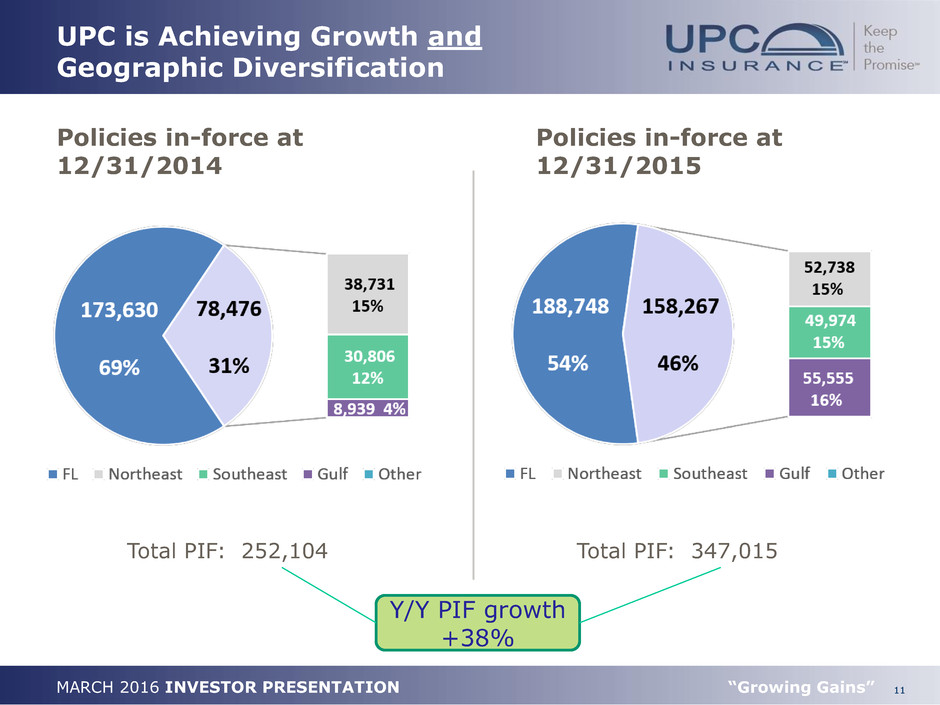
11 MARCH 2016 INVESTOR PRESENTATION “Growing Gains” UPC is Achieving Growth and Geographic Diversification Policies in-force at 12/31/2015 Policies in-force at 12/31/2014 Total PIF: 252,104 Total PIF: 347,015 Y/Y PIF growth +38%
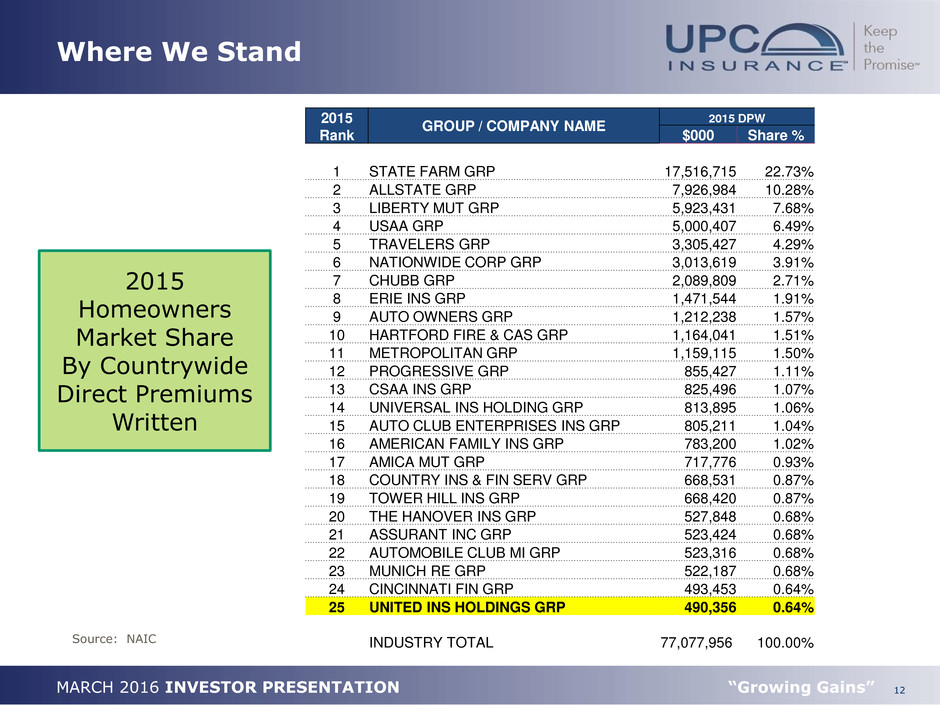
12 MARCH 2016 INVESTOR PRESENTATION “Growing Gains” Where We Stand Source: NAIC 2015 Homeowners Market Share By Countrywide Direct Premiums Written 2015 Rank GROUP / COMPANY NAME 2015 DPW $000 Share % 1 STATE FARM GRP 17,516,715 22.73% 2 ALLSTATE GRP 7,926,984 10.28% 3 LIBERTY MUT GRP 5,923,431 7.68% 4 USAA GRP 5,000,407 6.49% 5 TRAVELERS GRP 3,305,427 4.29% 6 NATIONWIDE CORP GRP 3,013,619 3.91% 7 CHUBB GRP 2,089,809 2.71% 8 ERIE INS GRP 1,471,544 1.91% 9 AUTO OWNERS GRP 1,212,238 1.57% 10 HARTFORD FIRE & CAS GRP 1,164,041 1.51% 11 METROPOLITAN GRP 1,159,115 1.50% 12 PROGRESSIVE GRP 855,427 1.11% 13 CSAA INS GRP 825,496 1.07% 14 UNIVERSAL INS HOLDING GRP 813,895 1.06% 15 AUTO CLUB ENTERPRISES INS GRP 805,211 1.04% 16 AMERICAN FAMILY INS GRP 783,200 1.02% 17 AMICA MUT GRP 717,776 0.93% 18 COUNTRY INS & FIN SERV GRP 668,531 0.87% 19 TOWER HILL INS GRP 668,420 0.87% 20 THE HANOVER INS GRP 527,848 0.68% 21 ASSURANT INC GRP 523,424 0.68% 22 AUTOMOBILE CLUB MI GRP 523,316 0.68% 23 MUNICH RE GRP 522,187 0.68% 24 CINCINNATI FIN GRP 493,453 0.64% 25 UNITED INS HOLDINGS GRP 490,356 0.64% INDUSTRY TOTAL 77,077,956 100.00%
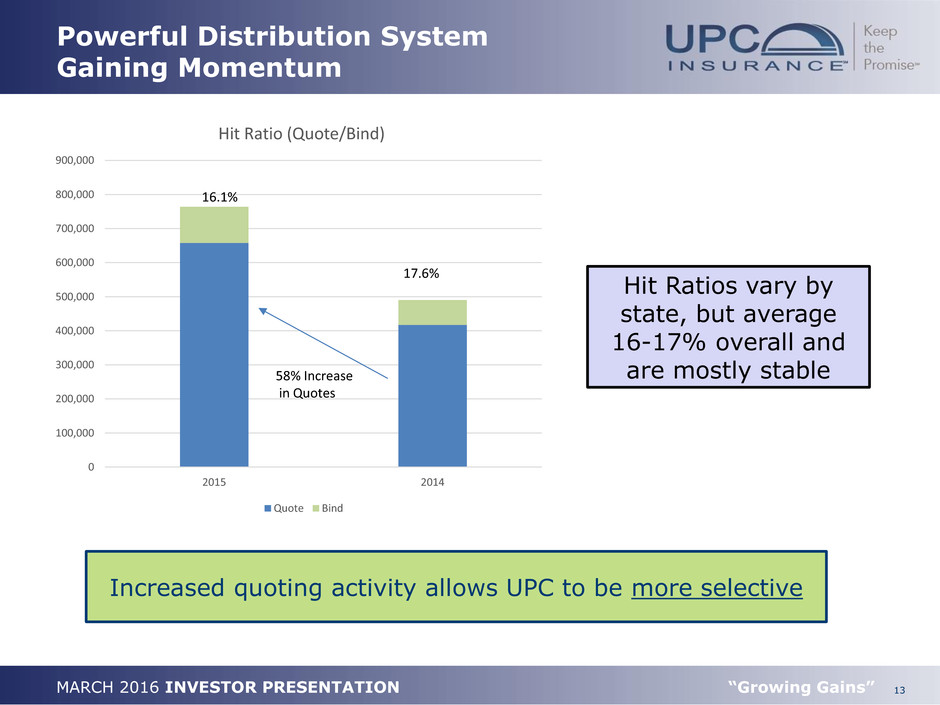
13 MARCH 2016 INVESTOR PRESENTATION “Growing Gains” Powerful Distribution System Gaining Momentum 0 100,000 200,000 300,000 400,000 500,000 600,000 700,000 800,000 900,000 2015 2014 Hit Ratio (Quote/Bind) Quote Bind 16.1% 17.6% 58% Increase in Quotes Increased quoting activity allows UPC to be more selective Hit Ratios vary by state, but average 16-17% overall and are mostly stable
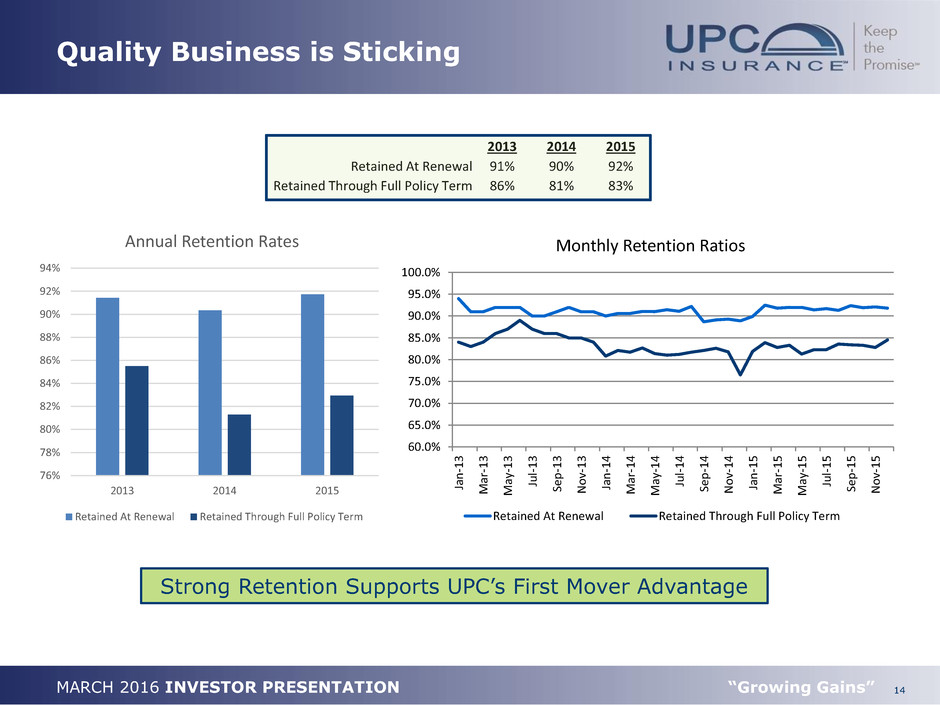
14 MARCH 2016 INVESTOR PRESENTATION “Growing Gains” Quality Business is Sticking Strong Retention Supports UPC’s First Mover Advantage 2013 2014 2015 Retained At Renewal 91% 90% 92% Retained Through Full Policy Term 86% 81% 83% 76% 78% 80% 82% 84% 86% 88% 90% 92% 94% 2013 2014 2015 Annual Retention Rates Retained At Renewal Retained Through Full Policy Term 60.0% 65.0% 70.0% 75.0% 80.0% 85.0% 90.0% 95.0% 100.0% Ja n -1 3 M ar -1 3 M ay -1 3 Ju l- 1 3 Se p -1 3 N o v- 1 3 Ja n -1 4 M ar -1 4 M ay -1 4 Ju l- 1 4 Se p -1 4 N o v- 1 4 Ja n -1 5 M ar -1 5 M ay -1 5 Ju l- 1 5 Se p -1 5 N o v- 1 5 Monthly Retention Ratios Retained At Renewal Retained Through Full Policy Term
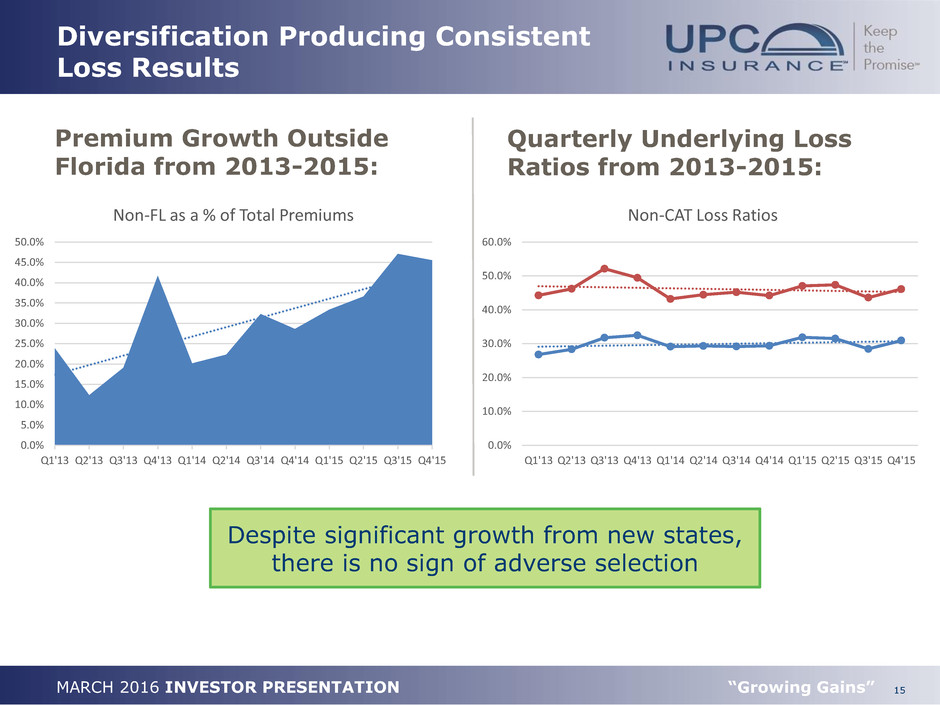
15 MARCH 2016 INVESTOR PRESENTATION “Growing Gains” Diversification Producing Consistent Loss Results Quarterly Underlying Loss Ratios from 2013-2015: 0.0% 10.0% 20.0% 30.0% 40.0% 50.0% 60.0% Q1'13 Q2'13 Q3'13 Q4'13 Q1'14 Q2'14 Q3'14 Q4'14 Q1'15 Q2'15 Q3'15 Q4'15 Non-CAT Loss Ratios 0.0% 5.0% 10.0% 15.0% 20.0% 25.0% 30.0% 35.0% 40.0% 45.0% 50.0% Q1'13 Q2'13 Q3'13 Q4'13 Q1'14 Q2'14 Q3'14 Q4'14 Q1'15 Q2'15 Q3'15 Q4'15 Non-FL as a % of Total Premiums Premium Growth Outside Florida from 2013-2015: Despite significant growth from new states, there is no sign of adverse selection

16 MARCH 2016 INVESTOR PRESENTATION “Growing Gains” UPC Has Four Proven Pathways for Growth Organic Underwriting Carrier Partnerships Depopulation Initiatives Merger & Acquisition 7,000 Appointed Independent Agencies & MGA’s Nationally 75% 17% 4% 4% 2015 Contribution
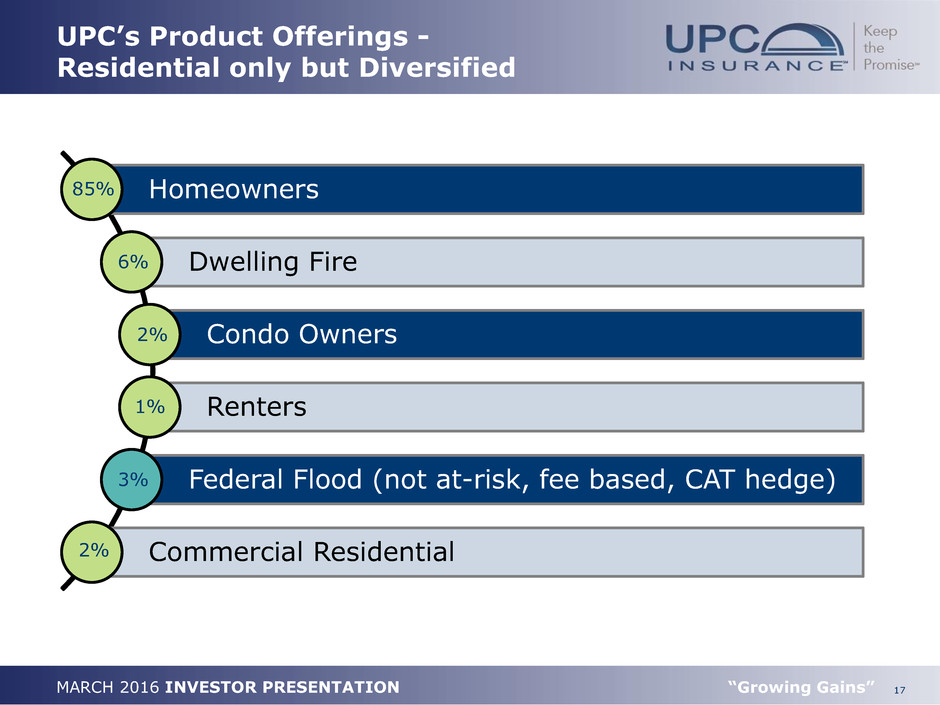
17 MARCH 2016 INVESTOR PRESENTATION “Growing Gains” UPC’s Product Offerings - Residential only but Diversified Homeowners Dwelling Fire Condo Owners Renters Federal Flood (not at-risk, fee based, CAT hedge) Commercial Residential 85% 6% 2% 1% 3% 2%
MARCH 2016 INVESTOR PRESENTATION OPERATIONAL STRENGTH
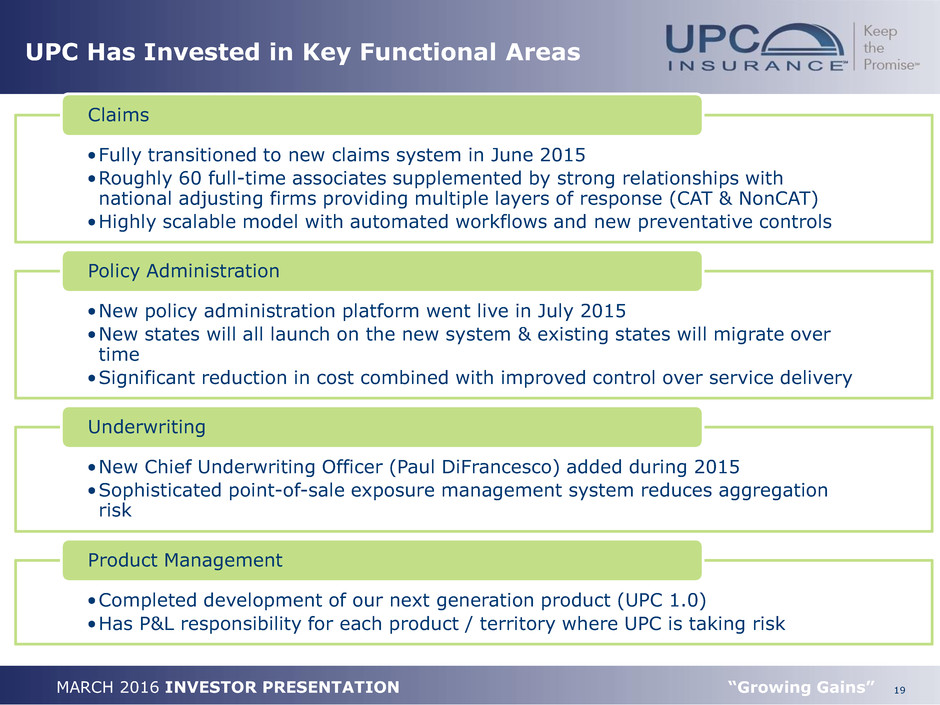
19 MARCH 2016 INVESTOR PRESENTATION “Growing Gains” UPC Has Invested in Key Functional Areas •Fully transitioned to new claims system in June 2015 •Roughly 60 full-time associates supplemented by strong relationships with national adjusting firms providing multiple layers of response (CAT & NonCAT) •Highly scalable model with automated workflows and new preventative controls Claims •New policy administration platform went live in July 2015 •New states will all launch on the new system & existing states will migrate over time •Significant reduction in cost combined with improved control over service delivery Policy Administration •New Chief Underwriting Officer (Paul DiFrancesco) added during 2015 •Sophisticated point-of-sale exposure management system reduces aggregation risk Underwriting •Completed development of our next generation product (UPC 1.0) •Has P&L responsibility for each product / territory where UPC is taking risk Product Management
MARCH 2016 INVESTOR PRESENTATION FINANCIAL STRENGTH
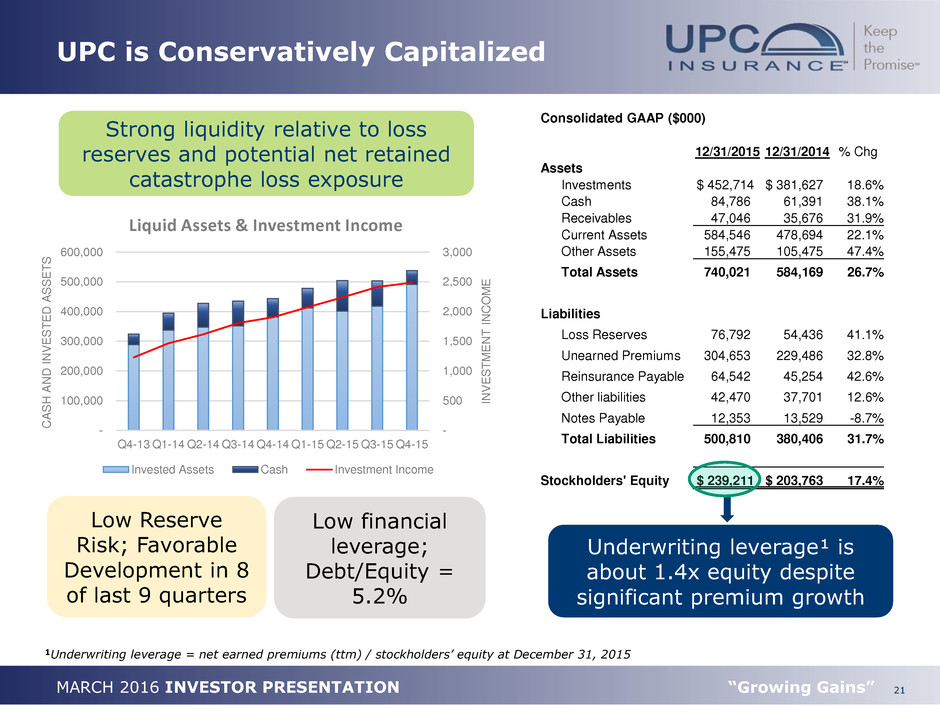
21 MARCH 2016 INVESTOR PRESENTATION “Growing Gains” UPC is Conservatively Capitalized Strong liquidity relative to loss reserves and potential net retained catastrophe loss exposure Underwriting leverage¹ is about 1.4x equity despite significant premium growth 1Underwriting leverage = net earned premiums (ttm) / stockholders’ equity at December 31, 2015 Low Reserve Risk; Favorable Development in 8 of last 9 quarters Low financial leverage; Debt/Equity = 5.2% Consolidated GAAP ($000) 12/31/2015 12/31/2014 % Chg Assets Investments $ 452,714 $ 381,627 18.6% Cash 84,786 61,391 38.1% Receivables 47,046 35,676 31.9% Current Assets 584,546 478,694 22.1% Other Assets 155,475 105,475 47.4% Total Assets 740,021 584,169 26.7% Liabilities Loss Reserves 76,792 54,436 41.1% Unearned Premiums 304,653 229,486 32.8% Reinsurance Payable 64,542 45,254 42.6% Other liabilities 42,470 37,701 12.6% Notes Payable 12,353 13,529 -8.7% Total Liabilities 500,810 380,406 31.7% Stockholders' Equity $ 239,211 $ 203,763 17.4% - 500 1,000 1,500 2,000 2,500 3,000 - 100,000 200,000 300,000 400,000 500,000 600,000 Q4-13 Q1-14 Q2-14 Q3-14 Q4-14 Q1-15 Q2-15 Q3-15 Q4-15 INVES T M EN T INC O M E CAS H AND INVES T ED ASSE T S Liquid Assets & Investment Income Invested Assets Cash Investment Income
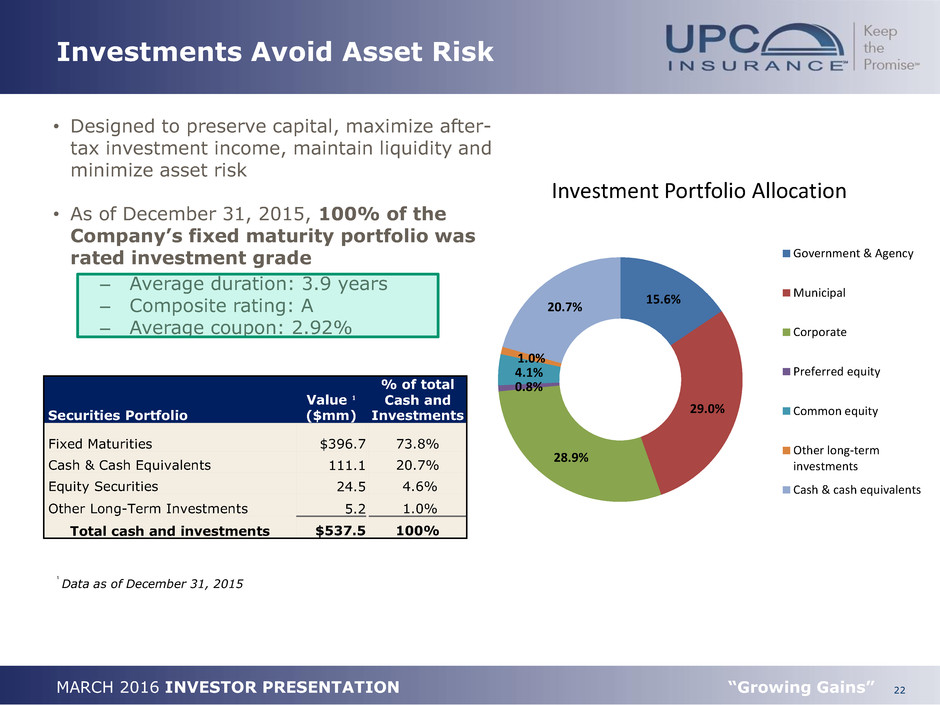
22 MARCH 2016 INVESTOR PRESENTATION “Growing Gains” Investments Avoid Asset Risk • Designed to preserve capital, maximize after- tax investment income, maintain liquidity and minimize asset risk • As of December 31, 2015, 100% of the Company’s fixed maturity portfolio was rated investment grade – Average duration: 3.9 years – Composite rating: A – Average coupon: 2.92% ¹ Data as of December 31, 2015 Securities Portfolio Value ¹ ($mm) % of total Cash and Investments Fixed Maturities $396.7 73.8% Cash & Cash Equivalents 111.1 20.7% Equity Securities 24.5 4.6% Other Long-Term Investments 5.2 1.0% Total cash and investments $537.5 100% 15.6% 29.0% 28.9% 0.8% 4.1% 1.0% 20.7% Investment Portfolio Allocation Government & Agency Municipal Corporate Preferred equity Common equity Other long-term investments Cash & cash equivalents
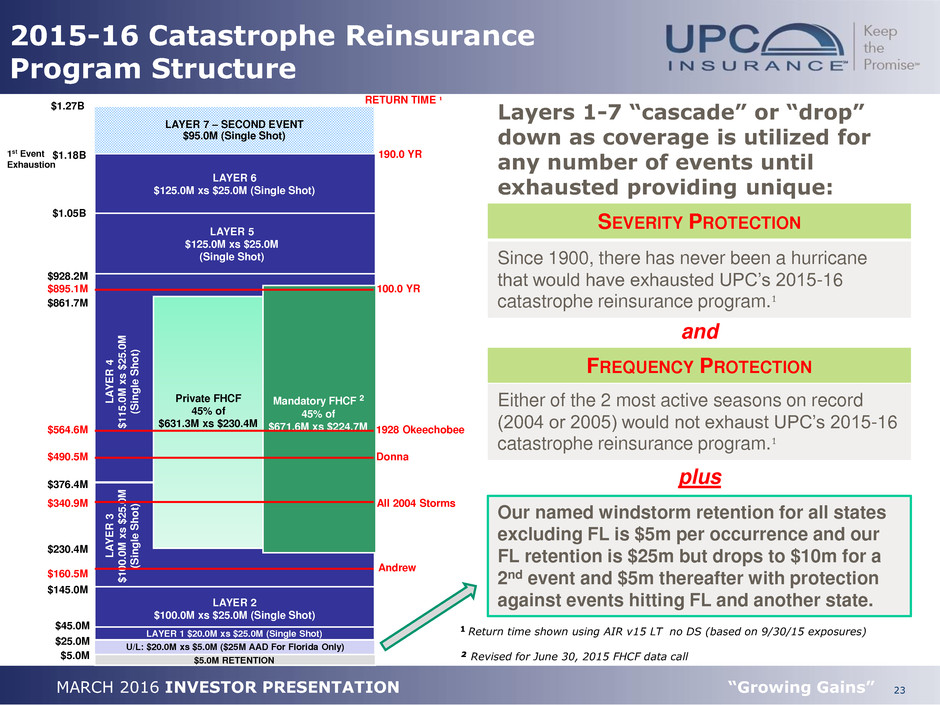
23 MARCH 2016 INVESTOR PRESENTATION “Growing Gains” 2015-16 Catastrophe Reinsurance Program Structure LAYER 1 $20.0M xs $25.0M (Single Shot) $45.0M $928.2M $1.18B $1.05B LAYER 2 $100.0M xs $25.0M (Single Shot) $376.4M $230.4M LAYER 6 $125.0M xs $25.0M (Single Shot) $145.0M L A Y E R 3 $ 1 0 0 .0 M x s $ 2 5 .0 M (S ing le S hot ) Mandatory FHCF ² 45% of $671.6M xs $224.7M L A Y E R 4 $ 1 1 5 .0 M x s $ 2 5 .0 M (S ing le S hot ) $861.7M LAYER 5 $125.0M xs $25.0M (Single Shot) 1928 Okeechobee LAYER 7 – SECOND EVENT $95.0M (Single Shot) $1.27B $564.6M Private FHCF 45% of $631.3M xs $230.4M RETURN TIME ¹ $25.0M Since 1900, there has never been a hurricane that would have exhausted UPC’s 2015-16 catastrophe reinsurance program.¹ SEVERITY PROTECTION Either of the 2 most active seasons on record (2004 or 2005) would not exhaust UPC’s 2015-16 catastrophe reinsurance program.¹ FREQUENCY PROTECTION Layers 1-7 “cascade” or “drop” down as coverage is utilized for any number of events until exhausted providing unique: and 1 Return time shown using AIR v15 LT no DS (based on 9/30/15 exposures) ² Revised for June 30, 2015 FHCF data call Our named windstorm retention for all states excluding FL is $5m per occurrence and our FL retention is $25m but drops to $10m for a 2nd event and $5m thereafter with protection against events hitting FL and another state. plus 190.0 YR Andrew $160.5M Donna $490.5M All 2004 Storms $340.9M 100.0 YR $895.1M $5.0M RETENTION U/L: $20.0M xs $5.0M ($25M AAD For Florida Only) $5.0M 1st Event Exhaustion
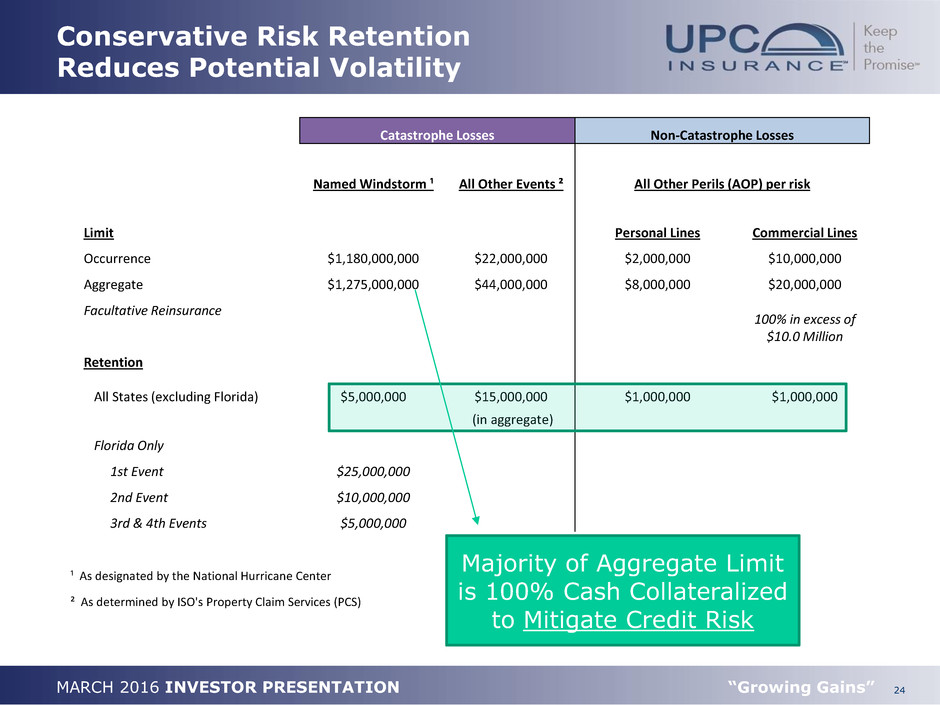
24 MARCH 2016 INVESTOR PRESENTATION “Growing Gains” Conservative Risk Retention Reduces Potential Volatility Catastrophe Losses Non-Catastrophe Losses Named Windstorm ¹ All Other Events ² All Other Perils (AOP) per risk Limit Personal Lines Commercial Lines Occurrence $1,180,000,000 $22,000,000 $2,000,000 $10,000,000 Aggregate $1,275,000,000 $44,000,000 $8,000,000 $20,000,000 Facultative Reinsurance 100% in excess of $10.0 Million Retention All States (excluding Florida) $5,000,000 $15,000,000 $1,000,000 $1,000,000 (in aggregate) Florida Only 1st Event $25,000,000 2nd Event $10,000,000 3rd & 4th Events $5,000,000 ¹ As designated by the National Hurricane Center ² As determined by ISO's Property Claim Services (PCS) Majority of Aggregate Limit is 100% Cash Collateralized to Mitigate Credit Risk
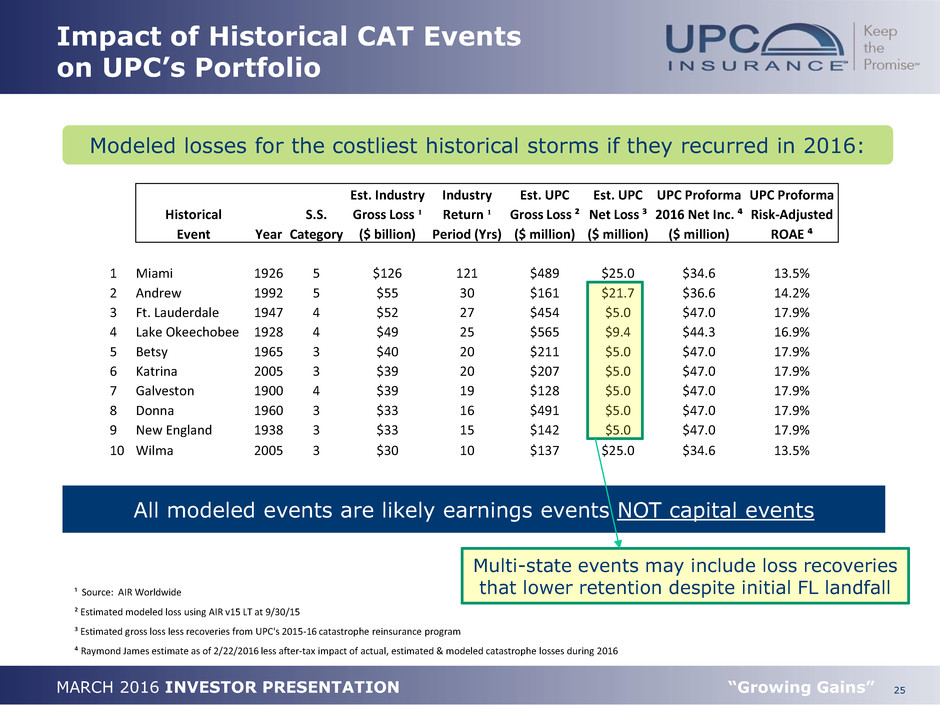
25 MARCH 2016 INVESTOR PRESENTATION “Growing Gains” Impact of Historical CAT Events on UPC’s Portfolio All modeled events are likely earnings events NOT capital events Modeled losses for the costliest historical storms if they recurred in 2016: ¹ Source: AIR Worldwide ² Estimated modeled loss using AIR v15 LT at 9/30/15 ³ Estimated gross loss less recoveries from UPC's 2015-16 catastrophe reinsurance program ⁴ Raymond James estimate as of 2/22/2016 less after-tax impact of actual, estimated & modeled catastrophe losses during 2016 Multi-state events may include loss recoveries that lower retention despite initial FL landfall Est. Industry Industry Est. UPC Est. UPC UPC Proforma UPC Proforma Historical S.S. Gross Loss ¹ Return ¹ Gross Loss ² Net Loss ³ 2016 Net Inc. ⁴ Risk-Adjusted Event Year Category ($ billion) Period (Yrs) ($ million) ($ million) ($ million) ROAE ⁴ 1 Miami 1926 5 $126 121 $489 $25.0 $34.6 13.5% 2 Andrew 1992 5 $55 30 $161 $21.7 $36.6 14.2% 3 Ft. Lauderdale 1947 4 $52 27 $454 $5.0 $47.0 17.9% 4 Lake Okeechobee 1928 4 $49 25 $565 $9.4 $44.3 16.9% 5 Betsy 1965 3 $40 20 $211 $5.0 $47.0 17.9% 6 Katrina 2005 3 $39 20 $207 $5.0 $47.0 17.9% 7 Galveston 1900 4 $39 19 $128 $5.0 $47.0 17.9% 8 Donna 1960 3 $33 16 $491 $5.0 $47.0 17.9% 9 New England 1938 3 $33 15 $142 $5.0 $47.0 17.9% 10 Wilma 2005 3 $30 10 $137 $25.0 $34.6 13.5%
MARCH 2016 INVESTOR PRESENTATION RESULTS

27 MARCH 2016 INVESTOR PRESENTATION “Growing Gains” Key Operating Metrics 27.6% Revenue Growth 12.4% ROAE 13.9% BVPS Growth 86.2% Underlying Combined Ratio ¹ Results for the year ended December 31, 2015: ¹ “Underlying” results exclude losses incurred from catastrophes and prior year reserve development Despite $28.6 million of net catastrophe losses!
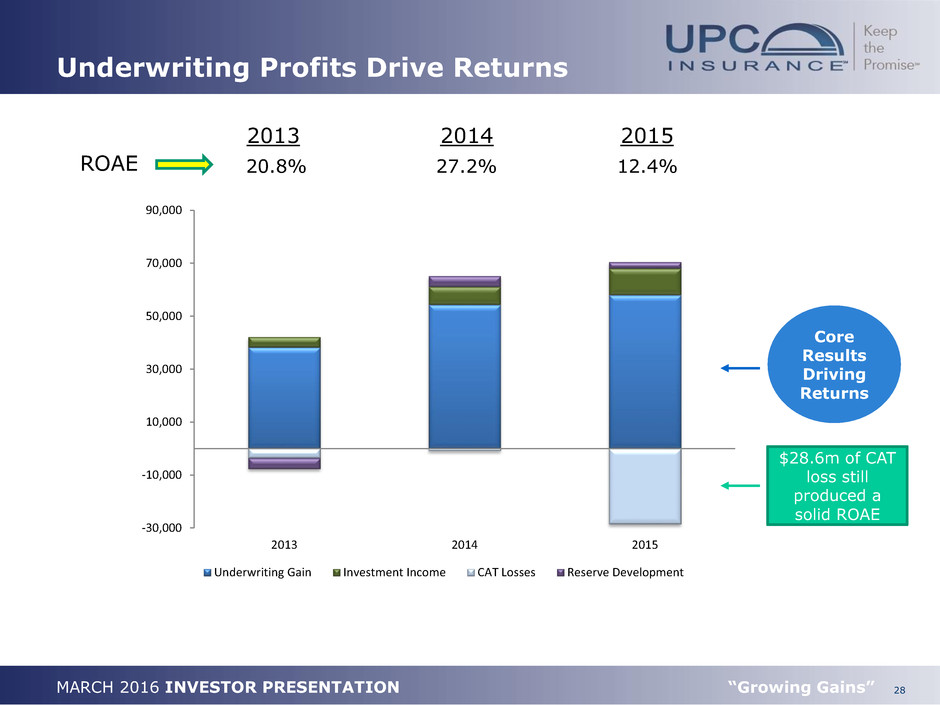
28 MARCH 2016 INVESTOR PRESENTATION “Growing Gains” Underwriting Profits Drive Returns Core Results Driving Returns 20.8% 27.2% 12.4% ROAE 2013 2014 2015 $28.6m of CAT loss still produced a solid ROAE -30,000 -10,000 10,000 30,000 50,000 70,000 90,000 2013 2014 2015 Underwriting Gain Investment Income CAT Losses Reserve Development
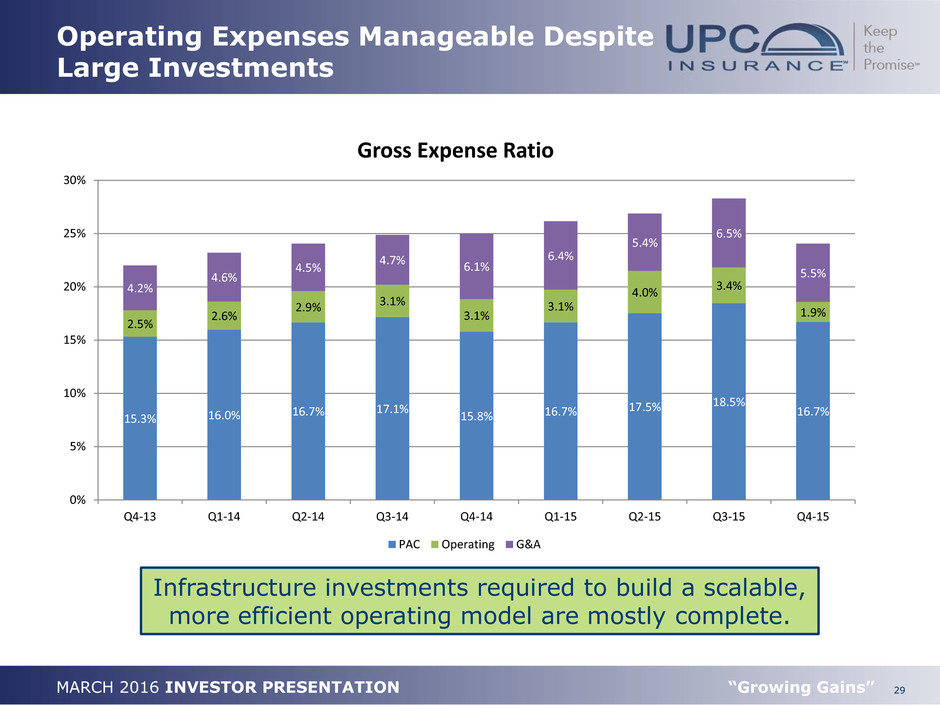
29 MARCH 2016 INVESTOR PRESENTATION “Growing Gains” Operating Expenses Manageable Despite Large Investments Infrastructure investments required to build a scalable, more efficient operating model are mostly complete. 15.3% 16.0% 16.7% 17.1% 15.8% 16.7% 17.5% 18.5% 16.7% 2.5% 2.6% 2.9% 3.1% 3.1% 3.1% 4.0% 3.4% 1.9% 4.2% 4.6% 4.5% 4.7% 6.1% 6.4% 5.4% 6.5% 5.5% 0% 5% 10% 15% 20% 25% 30% Q4-13 Q1-14 Q2-14 Q3-14 Q4-14 Q1-15 Q2-15 Q3-15 Q4-15 Gross Expense Ratio PAC Operating G&A
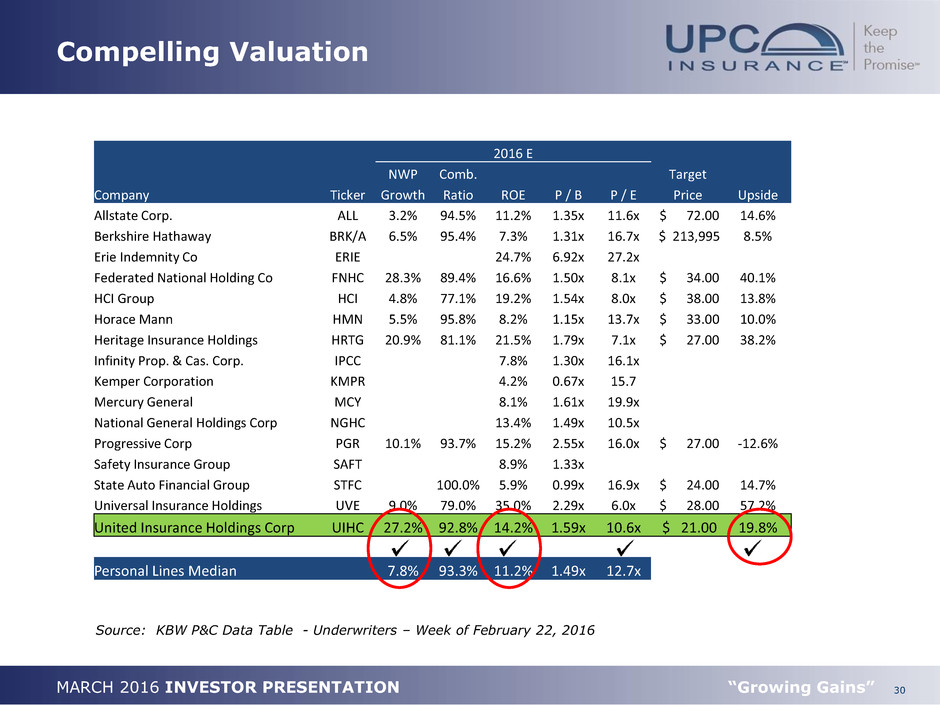
30 MARCH 2016 INVESTOR PRESENTATION “Growing Gains” Compelling Valuation Source: KBW P&C Data Table - Underwriters – Week of February 22, 2016 2016 E NWP Comb. Target Company Ticker Growth Ratio ROE P / B P / E Price Upside Allstate Corp. ALL 3.2% 94.5% 11.2% 1.35x 11.6x $ 72.00 14.6% Berkshire Hathaway BRK/A 6.5% 95.4% 7.3% 1.31x 16.7x $ 213,995 8.5% Erie Indemnity Co ERIE 24.7% 6.92x 27.2x Federated National Holding Co FNHC 28.3% 89.4% 16.6% 1.50x 8.1x $ 34.00 40.1% HCI Group HCI 4.8% 77.1% 19.2% 1.54x 8.0x $ 38.00 13.8% Horace Mann HMN 5.5% 95.8% 8.2% 1.15x 13.7x $ 33.00 10.0% Heritage Insurance Holdings HRTG 20.9% 81.1% 21.5% 1.79x 7.1x $ 27.00 38.2% Infinity Prop. & Cas. Corp. IPCC 7.8% 1.30x 16.1x Kemper Corporation KMPR 4.2% 0.67x 15.7 Mercury General MCY 8.1% 1.61x 19.9x National General Holdings Corp NGHC 13.4% 1.49x 10.5x Progressive Corp PGR 10.1% 93.7% 15.2% 2.55x 16.0x $ 27.00 -12.6% Safety Insurance Group SAFT 8.9% 1.33x State Auto Financial Group STFC 100.0% 5.9% 0.99x 16.9x $ 24.00 14.7% Universal Insurance Holdings UVE 9.0% 79.0% 35.0% 2.29x 6.0x $ 28.00 57.2% United Insurance Holdings Corp UIHC 27.2% 92.8% 14.2% 1.59x 10.6x $ 21.00 19.8% Personal Lines Median 7.8% 93.3% 11.2% 1.49x 12.7x
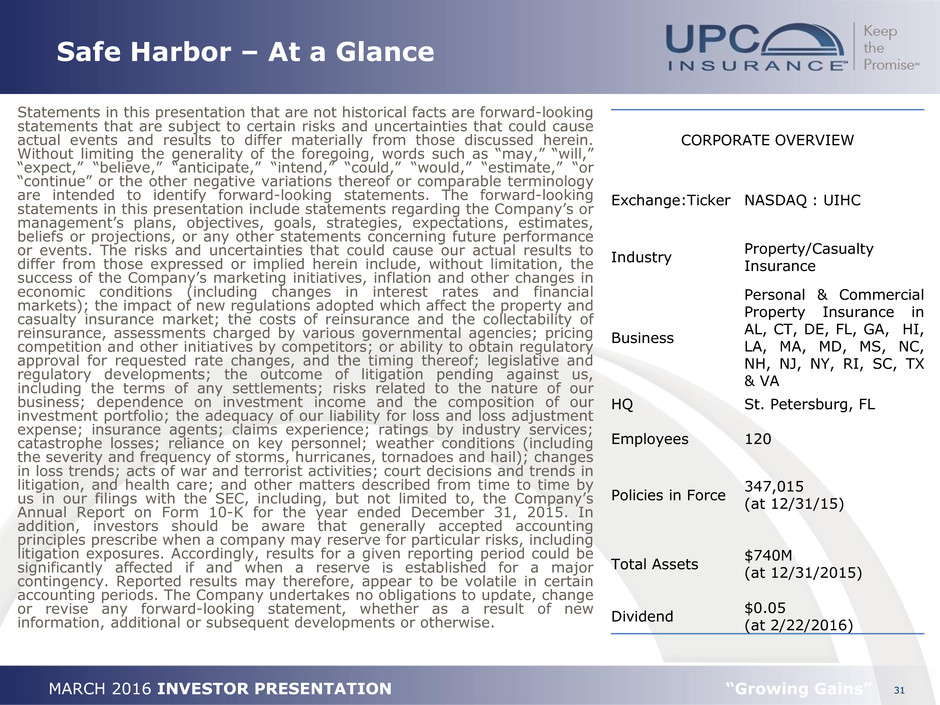
31 MARCH 2016 INVESTOR PRESENTATION “Growing Gains” Safe Harbor – At a Glance Statements in this presentation that are not historical facts are forward-looking statements that are subject to certain risks and uncertainties that could cause actual events and results to differ materially from those discussed herein. Without limiting the generality of the foregoing, words such as “may,” “will,” “expect,” “believe,” “anticipate,” “intend,” “could,” “would,” “estimate,” “or “continue” or the other negative variations thereof or comparable terminology are intended to identify forward-looking statements. The forward-looking statements in this presentation include statements regarding the Company’s or management’s plans, objectives, goals, strategies, expectations, estimates, beliefs or projections, or any other statements concerning future performance or events. The risks and uncertainties that could cause our actual results to differ from those expressed or implied herein include, without limitation, the success of the Company’s marketing initiatives, inflation and other changes in economic conditions (including changes in interest rates and financial markets); the impact of new regulations adopted which affect the property and casualty insurance market; the costs of reinsurance and the collectability of reinsurance, assessments charged by various governmental agencies; pricing competition and other initiatives by competitors; or ability to obtain regulatory approval for requested rate changes, and the timing thereof; legislative and regulatory developments; the outcome of litigation pending against us, including the terms of any settlements; risks related to the nature of our business; dependence on investment income and the composition of our investment portfolio; the adequacy of our liability for loss and loss adjustment expense; insurance agents; claims experience; ratings by industry services; catastrophe losses; reliance on key personnel; weather conditions (including the severity and frequency of storms, hurricanes, tornadoes and hail); changes in loss trends; acts of war and terrorist activities; court decisions and trends in litigation, and health care; and other matters described from time to time by us in our filings with the SEC, including, but not limited to, the Company’s Annual Report on Form 10-K for the year ended December 31, 2015. In addition, investors should be aware that generally accepted accounting principles prescribe when a company may reserve for particular risks, including litigation exposures. Accordingly, results for a given reporting period could be significantly affected if and when a reserve is established for a major contingency. Reported results may therefore, appear to be volatile in certain accounting periods. The Company undertakes no obligations to update, change or revise any forward-looking statement, whether as a result of new information, additional or subsequent developments or otherwise. CORPORATE OVERVIEW Exchange:Ticker NASDAQ : UIHC Industry Property/Casualty Insurance Business Personal & Commercial Property Insurance in AL, CT, DE, FL, GA, HI, LA, MA, MD, MS, NC, NH, NJ, NY, RI, SC, TX & VA HQ St. Petersburg, FL Employees 120 Policies in Force 347,015 (at 12/31/15) Total Assets $740M (at 12/31/2015) Dividend $0.05 (at 2/22/2016)

32 MARCH 2016 INVESTOR PRESENTATION “Growing Gains” Definitions of Non-GAAP Measures We believe that investors’ understanding of UPC Insurance’s performance is enhanced by our disclosure of the following non-GAAP measures. Our methods for calculating these measures may differ from those used by other companies and therefore comparability may be limited. Combined ratio excluding the effects of current year catastrophe losses, prior year development from lines in run-off and prior year development (underlying combined ratio) is a non-GAAP ratio, which is computed as the difference between four GAAP operating ratios: the combined ratio, the effect of current year catastrophe losses on the combined ratio, and prior year development on the combined ratio. We believe that this ratio is useful to investors and it is used by management to reveal the trends in our business that may be obscured by current year catastrophe losses, losses from lines in run-off and prior year development. Current year catastrophe losses cause our loss trends to vary significantly between periods as a result of their incidence of occurrence and magnitude, and can have a significant impact on the combined ratio. Prior year development from lines in run-off is caused by unexpected development from our commercial auto product that is no longer offered by the Company. Prior year development is unexpected loss development on historical reserves. We believe it is useful for investors to evaluate these components separately and in the aggregate when reviewing our performance. The most direct comparable GAAP measure is the combined ratio. The underlying combined ratio should not be considered as a substitute for the combined ratio and does not reflect the overall profitability of our business.


