Investor Presentation Supplement to Third Quarter 2020 Results November 5, 2020
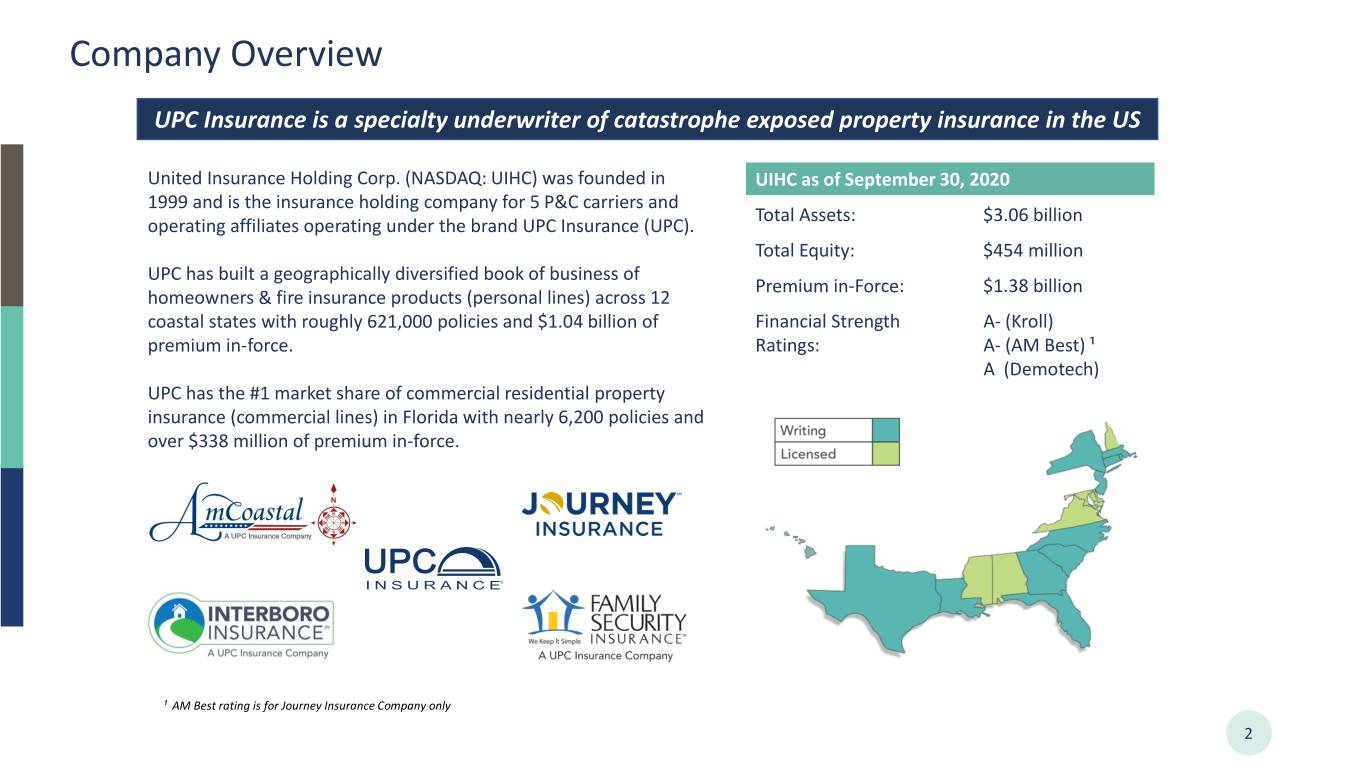
Company Overview UPC Insurance is a specialty underwriter of catastrophe exposed property insurance in the US United Insurance Holding Corp. (NASDAQ: UIHC) was founded in UIHC as of September 30, 2020 1999 and is the insurance holding company for 5 P&C carriers and Total Assets: $3.06 billion operating affiliates operating under the brand UPC Insurance (UPC). Total Equity: $454 million UPC has built a geographically diversified book of business of Premium in-Force: $1.38 billion homeowners & fire insurance products (personal lines) across 12 coastal states with roughly 621,000 policies and $1.04 billion of Financial Strength A- (Kroll) premium in-force. Ratings: A- (AM Best) ¹ A (Demotech) UPC has the #1 market share of commercial residential property insurance (commercial lines) in Florida with nearly 6,200 policies and over $338 million of premium in-force. ¹ AM Best rating is for Journey Insurance Company only 2
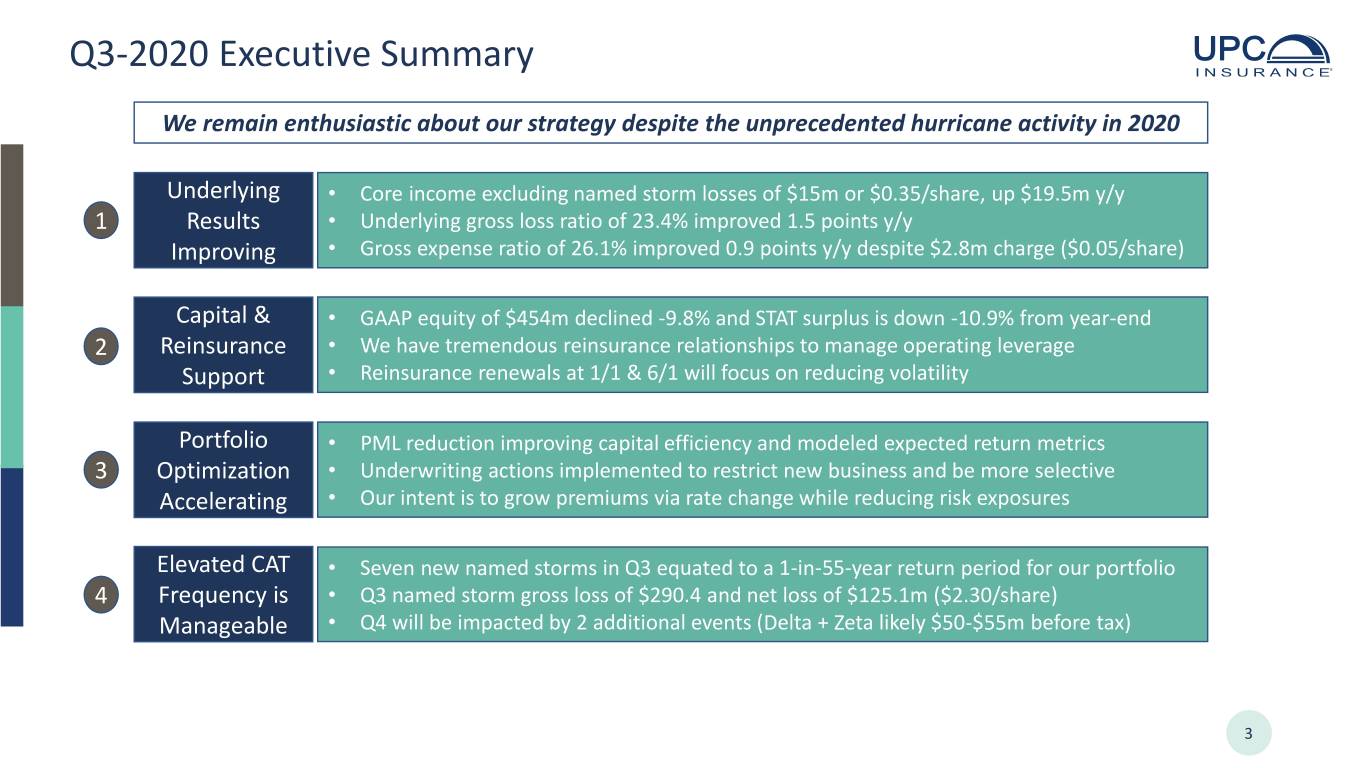
Q3-2020 Executive Summary We remain enthusiastic about our strategy despite the unprecedented hurricane activity in 2020 Underlying • Core income excluding named storm losses of $15m or $0.35/share, up $19.5m y/y 1 Results • Underlying gross loss ratio of 23.4% improved 1.5 points y/y Improving • Gross expense ratio of 26.1% improved 0.9 points y/y despite $2.8m charge ($0.05/share) Capital & • GAAP equity of $454m declined -9.8% and STAT surplus is down -10.9% from year-end 2 Reinsurance • We have tremendous reinsurance relationships to manage operating leverage Support • Reinsurance renewals at 1/1 & 6/1 will focus on reducing volatility Portfolio • PML reduction improving capital efficiency and modeled expected return metrics 3 Optimization • Underwriting actions implemented to restrict new business and be more selective Accelerating • Our intent is to grow premiums via rate change while reducing risk exposures Elevated CAT • Seven new named storms in Q3 equated to a 1-in-55-year return period for our portfolio 4 Frequency is • Q3 named storm gross loss of $290.4 and net loss of $125.1m ($2.30/share) Manageable • Q4 will be impacted by 2 additional events (Delta + Zeta likely $50-$55m before tax) 3
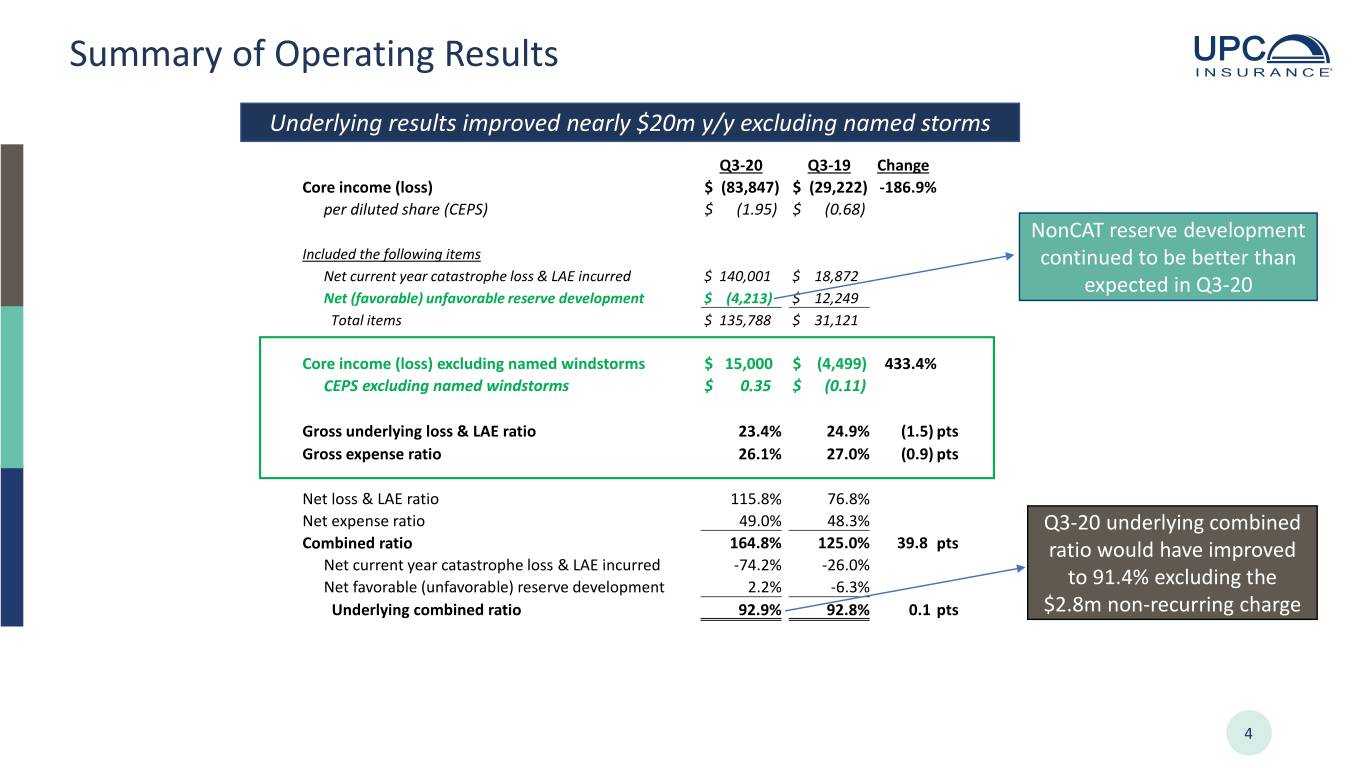
Summary of Operating Results Underlying results improved nearly $20m y/y excluding named storms Q3-20 Q3-19 Change Core income (loss) $ (83,847) $ (29,222) -186.9% per diluted share (CEPS) $ (1.95) $ (0.68) NonCAT reserve development Included the following items continued to be better than Net current year catastrophe loss & LAE incurred $ 140,001 $ 18,872 expected in Q3-20 Net (favorable) unfavorable reserve development $ (4,213) $ 12,249 Total items $ 135,788 $ 31,121 Core income (loss) excluding named windstorms $ 15,000 $ (4,499) 433.4% CEPS excluding named windstorms $ 0.35 $ (0.11) Gross underlying loss & LAE ratio 23.4% 24.9% (1.5) pts Gross expense ratio 26.1% 27.0% (0.9) pts Net loss & LAE ratio 115.8% 76.8% Net expense ratio 49.0% 48.3% Q3-20 underlying combined Combined ratio 164.8% 125.0% 39.8 pts ratio would have improved Net current year catastrophe loss & LAE incurred -74.2% -26.0% Net favorable (unfavorable) reserve development 2.2% -6.3% to 91.4% excluding the Underlying combined ratio 92.9% 92.8% 0.1 pts $2.8m non-recurring charge 4

Underlying Results Trending Favorably We have positive core earnings momentum excluding the noise from named storms 3Q20 +$19.5m (433%) $0.40 2Q20 +$16.4m (473%) $0.35 Q320 was $17.2m 1Q20 +$5.9m (185%) $0.30 or $0.40 excluding $0.30 the non-recurring $0.21 expense item, up $0.20 $21.7m (482%) y/y $0.10 $0.07 $- Q1-19 Q1-20 Q2-19 Q2-20 Q3-19 Q3-20 $(0.10) $(0.08) $(0.11) $ in thousands except per share $(0.20) amounts Q1-19 Q1-20 Change Q2-19 Q2-20 Change Q3-19 Q3-20 Change Core income(loss) $ 3,202 $ 9,129 $ 5,927 $ (3,459) $ 8,816 $ 12,275 $ (29,222) $ (83,847) $ (54,625) per share $ 0.07 $ 0.21 $ 0.14 $ (0.08) $ 0.20 $ 0.28 $ (0.68) $ (1.95) $ (1.27) Named storms, net of tax $ - $ - $ - $ - $ 4,100 $ 4,100 $ 24,723 $ 98,847 $ 74,124 per share $ - $ - $ - $ - $ 0.10 $ 0.10 $ 0.58 $ 2.30 $ 1.73 Adjusted Core income(loss) $ 3,202 $ 9,129 $ 5,927 $ (3,459) $ 12,916 $ 16,375 $ (4,499) $ 15,000 $ 19,499 per share $ 0.07 $ 0.21 $ 0.14 $ (0.08) $ 0.30 $ 0.38 $ (0.11) $ 0.35 $ 0.45 5
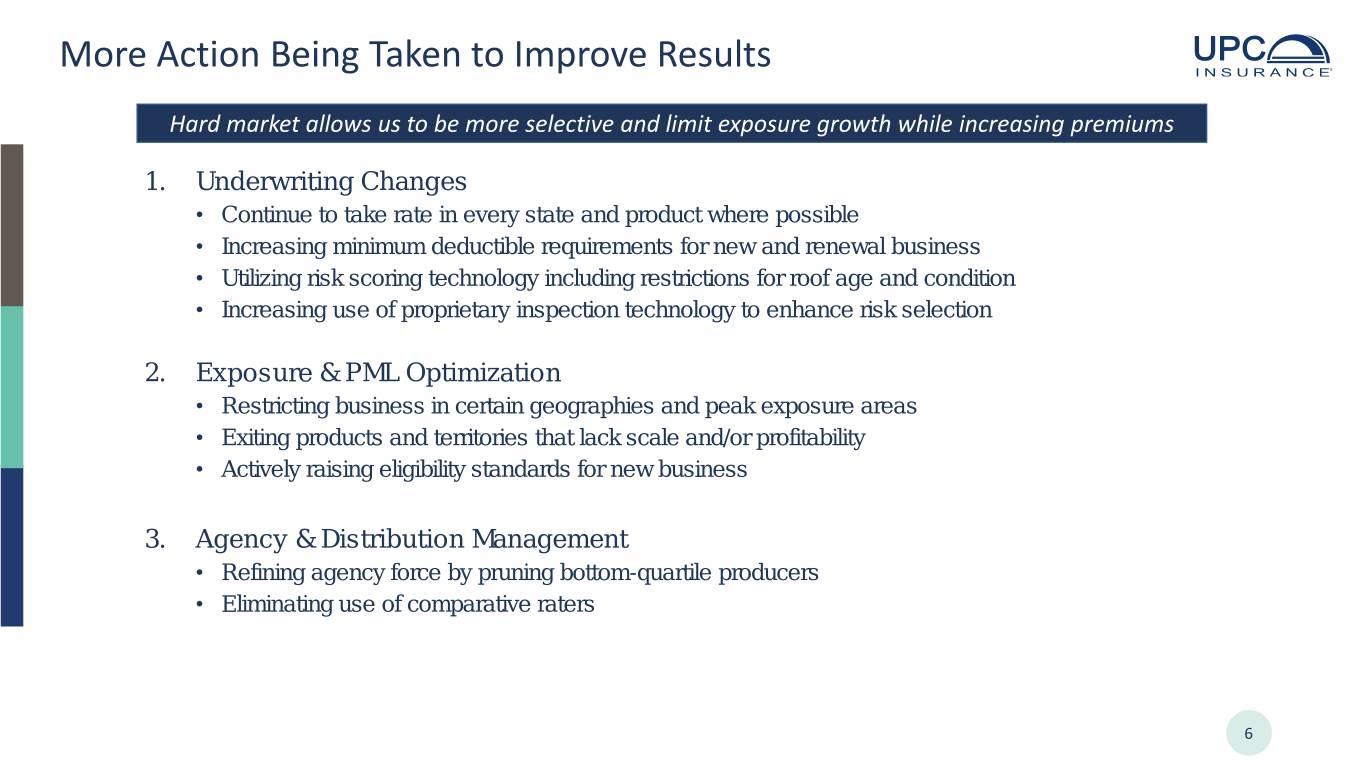
More Action Being Taken to Improve Results Hard market allows us to be more selective and limit exposure growth while increasing premiums 1. Underwriting Changes • Continue to take rate in every state and product where possible • Increasing minimum deductible requirements for new and renewal business • Utilizing risk scoring technology including restrictions for roof age and condition • Increasing use of proprietary inspection technology to enhance risk selection 2. Exposure & PML Optimization • Restricting business in certain geographies and peak exposure areas • Exiting products and territories that lack scale and/or profitability • Actively raising eligibility standards for new business 3. Agency & Distribution Management • Refining agency force by pruning bottom-quartile producers • Eliminating use of comparative raters 6

Premium Increasing Faster Than Exposure Driving more rate relative to TIV & PML is the key to margin improvement Probable Maximum Loss (PML) is the primary driver for catastrophe reinsurance needed and trending favorably 7

Rate Adequacy Is Accelerating Most states have rate increases earning in with additional rate hikes coming effective 2H-2020 STATE PROGRAM / LOB TYPE / POLICY FORM EFFECTIVE DATE RATE CHANGE STATUS Florida Homeowners HO-3 UPC 11/1/2020 14.1% Approved Homeowners HO-3 FSIC 9/1/2020 14.5% Approved Homeowners HO-3 FSIC 2/6/2020 13.7% Approved The effect of these changes Dwelling Fire DF-3 UPC 1/1/2021 14.9% Use & File could be up to $100 million South Carolina Homeowners HO-3 8/1/2020 6.9% Approved of additional premium with North Carolina Homeowners HO-3 9/10/2020 10.2% Approved no increase in exposure Homeowners HO-3 10/1/2020 15.4% Approved over the next 12-24 months Rhode Island Homeowners HO-3 9/15/2020 9.5% Approved Massachusetts Homeowners HO-3 7/19/2020 8.7% Approved Texas Homeowners HO-3 7/6/2020 13.2% File & Use This is schedule doesn’t Louisiana Homeowners HO-3 UPC 3/1/2021 9.5% File & Use include all potential rate Homeowners HO-3 FSIC 3/1/2021 9.8% File & Use actions, but covers most key Georgia Dwelling Fire DF-3 12/1/2020 8.5% Approved products and states Homeowners HO-3 12/1/2020 9.9% Approved New York Homeowners HO-3 UPC 3/22/2021 25.7% Approved Homeowners HO-3 UPC 3/9/2020 9.4% Approved Connecticut Homeowners HO-3 10/17/2020 5.7% Approved 8

2020 Hurricane Season in Perspective Zeta marked the 11th continental US landfall in 2020 eclipsing the prior record of 9 set in 1916 Return Periods for Number of US Hurricanes with Industry Loss > $1 Billion Frequency 1x $1B 2x $1B 3x $1B 4x $1B 5x $1B 6x $1B 7x $1B RT (Years) 1.36 2.61 6.04 15.48 43.86 142.86 416.67 Probability 73.5% 38.3% 16.6% 6.5% 2.3% 0.7% 0.2% Source: AIR According to PCS, the US has already incurred 3 storms with at least $1 billion of industry loss (Isaias, Laura & Sally). We believe it is likely to reach 5 with hurricanes Delta & Zeta Source: NOAA Hurricane ETA tied the Atlantic season record of 28 named storms set in 2005 9
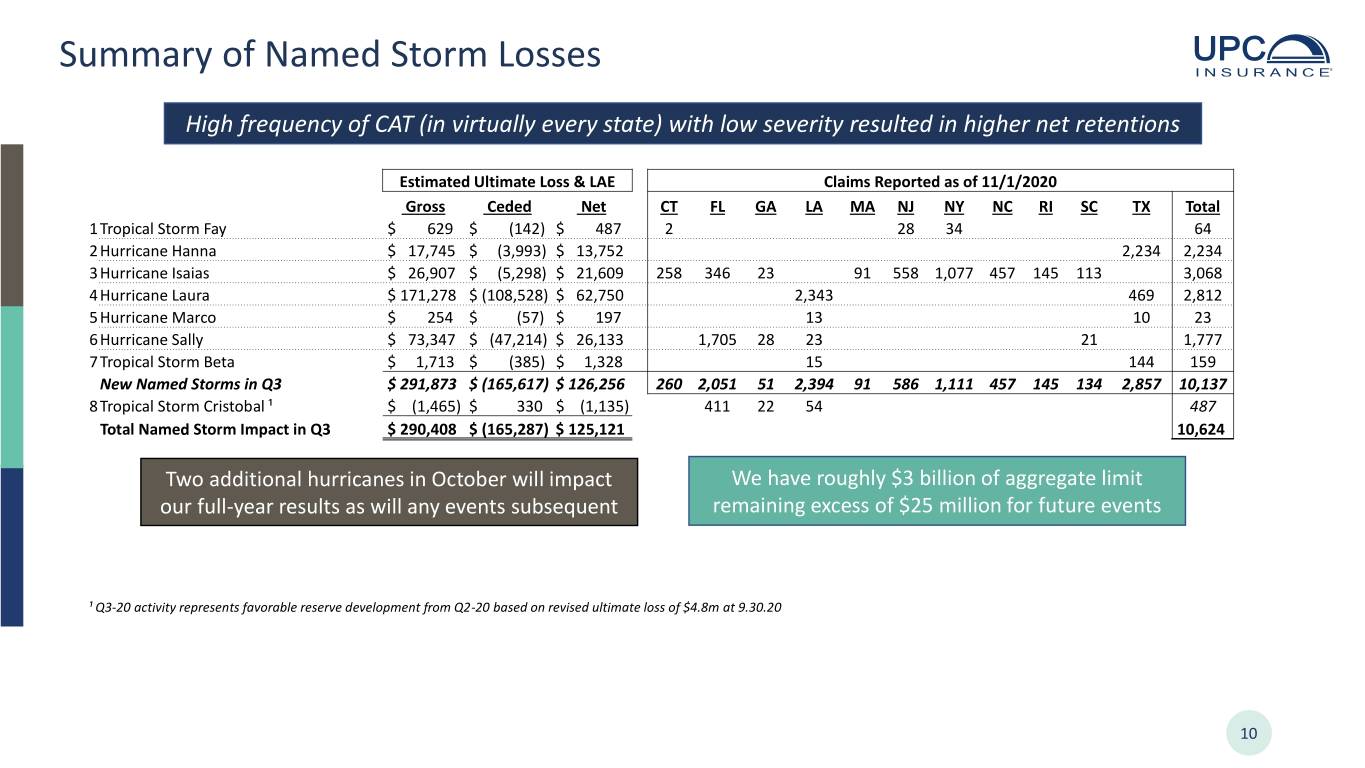
Summary of Named Storm Losses High frequency of CAT (in virtually every state) with low severity resulted in higher net retentions Estimated Ultimate Loss & LAE Claims Reported as of 11/1/2020 Gross Ceded Net CT FL GA LA MA NJ NY NC RI SC TX Total 1Tropical Storm Fay $ 629 $ (142) $ 487 2 28 34 64 2Hurricane Hanna $ 17,745 $ (3,993) $ 13,752 2,234 2,234 3Hurricane Isaias $ 26,907 $ (5,298) $ 21,609 258 346 23 91 558 1,077 457 145 113 3,068 4Hurricane Laura $ 171,278 $ (108,528) $ 62,750 2,343 469 2,812 5Hurricane Marco $ 254 $ (57) $ 197 13 10 23 6Hurricane Sally $ 73,347 $ (47,214) $ 26,133 1,705 28 23 21 1,777 7Tropical Storm Beta $ 1,713 $ (385) $ 1,328 15 144 159 New Named Storms in Q3 $ 291,873 $ (165,617) $ 126,256 260 2,051 51 2,394 91 586 1,111 457 145 134 2,857 10,137 8Tropical Storm Cristobal ¹ $ (1,465) $ 330 $ (1,135) 411 22 54 487 Total Named Storm Impact in Q3 $ 290,408 $ (165,287) $ 125,121 10,624 Two additional hurricanes in October will impact We have roughly $3 billion of aggregate limit our full-year results as will any events subsequent remaining excess of $25 million for future events ¹ Q3-20 activity represents favorable reserve development from Q2-20 based on revised ultimate loss of $4.8m at 9.30.20 10
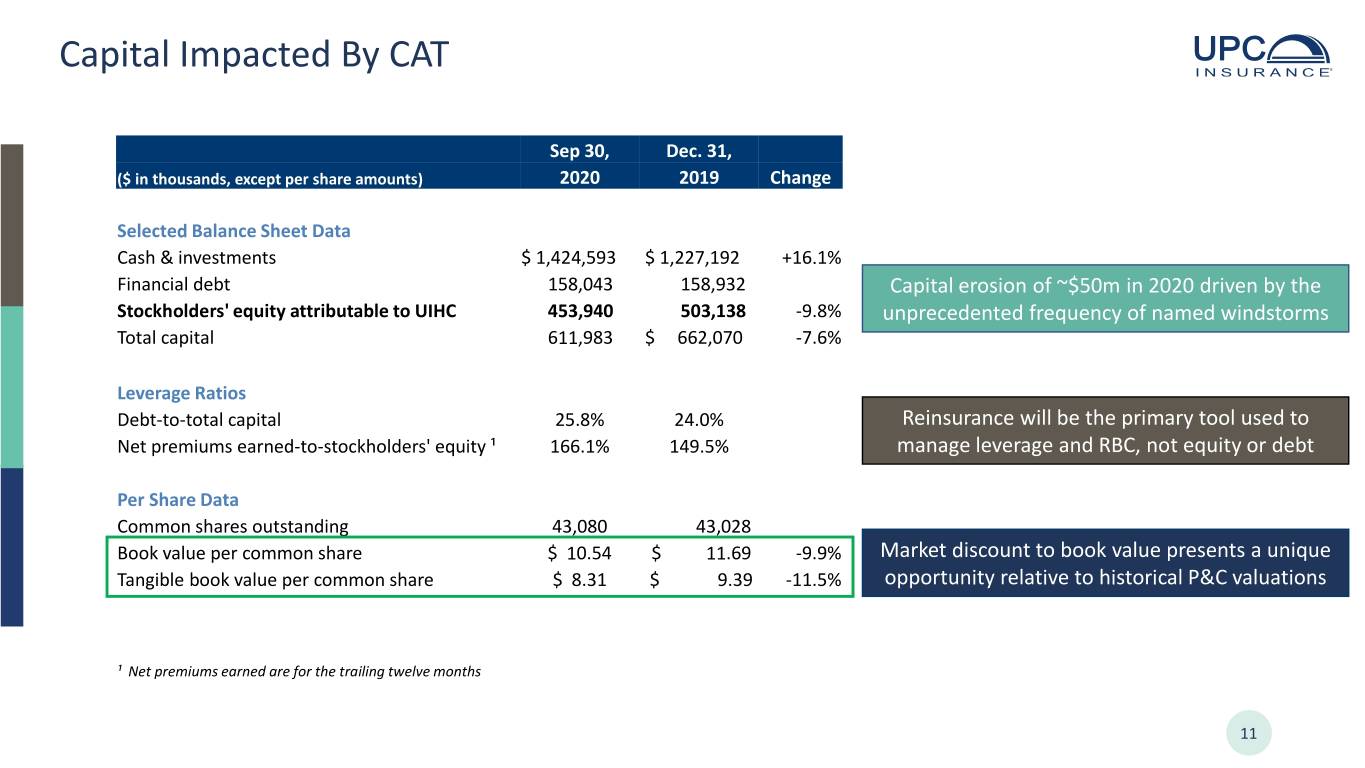
Capital Impacted By CAT Sep 30, Dec. 31, ($ in thousands, except per share amounts) 2020 2019 Change Selected Balance Sheet Data Cash & investments $ 1,424,593 $ 1,227,192 +16.1% Financial debt 158,043 158,932 Capital erosion of ~$50m in 2020 driven by the Stockholders' equity attributable to UIHC 453,940 503,138 -9.8% unprecedented frequency of named windstorms Total capital 611,983 $ 662,070 -7.6% Leverage Ratios Debt-to-total capital 25.8% 24.0% Reinsurance will be the primary tool used to Net premiums earned-to-stockholders' equity ¹ 166.1% 149.5% manage leverage and RBC, not equity or debt Per Share Data Common shares outstanding 43,080 43,028 Book value per common share $ 10.54 $ 11.69 -9.9% Market discount to book value presents a unique Tangible book value per common share $ 8.31 $ 9.39 -11.5% opportunity relative to historical P&C valuations ¹ Net premiums earned are for the trailing twelve months 11
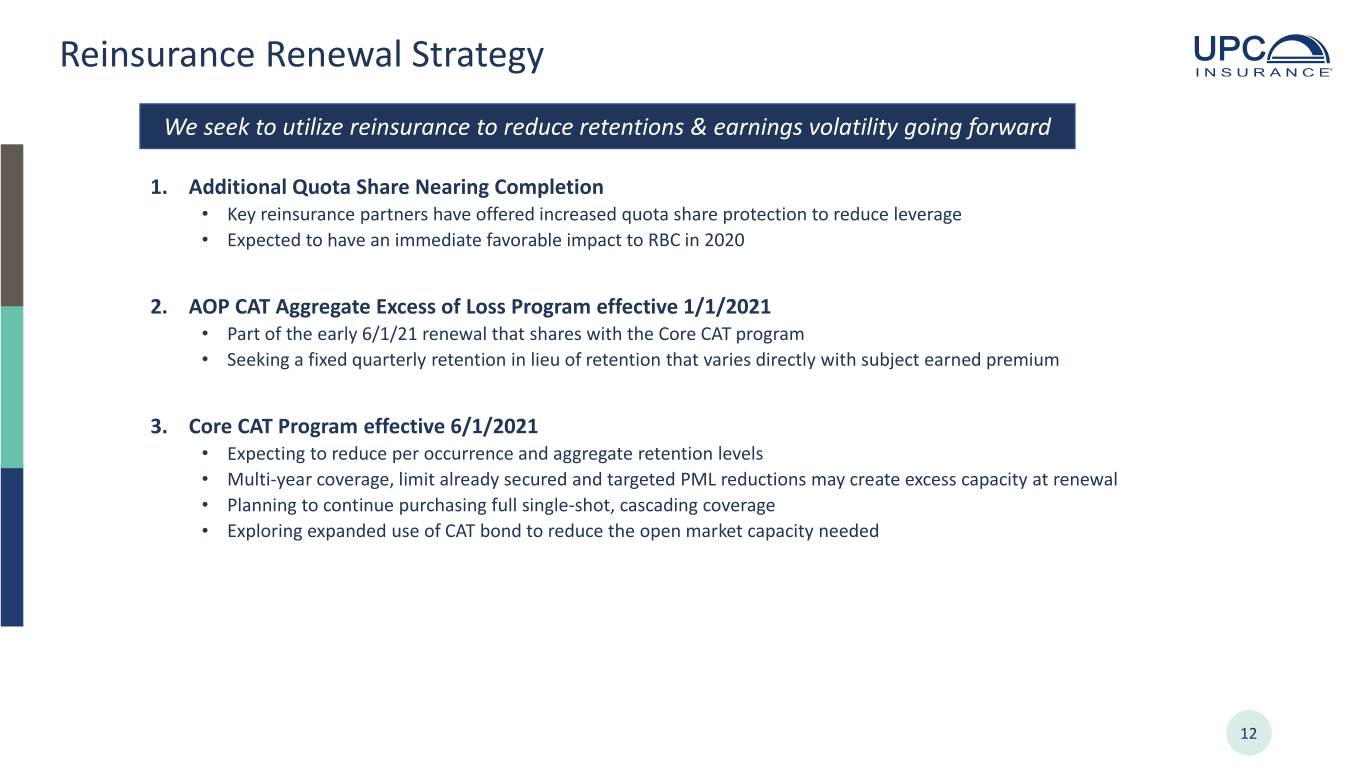
Reinsurance Renewal Strategy We seek to utilize reinsurance to reduce retentions & earnings volatility going forward 1. Additional Quota Share Nearing Completion • Key reinsurance partners have offered increased quota share protection to reduce leverage • Expected to have an immediate favorable impact to RBC in 2020 2. AOP CAT Aggregate Excess of Loss Program effective 1/1/2021 • Part of the early 6/1/21 renewal that shares with the Core CAT program • Seeking a fixed quarterly retention in lieu of retention that varies directly with subject earned premium 3. Core CAT Program effective 6/1/2021 • Expecting to reduce per occurrence and aggregate retention levels • Multi-year coverage, limit already secured and targeted PML reductions may create excess capacity at renewal • Planning to continue purchasing full single-shot, cascading coverage • Exploring expanded use of CAT bond to reduce the open market capacity needed 12

Cautionary Statements This presentation contains "forward-looking statements" within the meaning of the Private Securities Litigation Reform Act of 1995. These forward looking statements include expectations regarding our diversification, growth opportunities, retention rates, liquidity, investment returns and our ability to meet our investment objectives and to manage and mitigate market risk with respect to our investments. These statements are based on current expectations, estimates and projections about the industry and market in which we operate, and management's beliefs and assumptions. Without limiting the generality of the foregoing, words such as "may," "will," "expect," "endeavor," "project," "believe," "anticipate," "intend," "could," "would," "estimate," or "continue" or the negative variations thereof, or comparable terminology, are intended to identify forward-looking statements. Forward-looking statements are not guarantees of future performance and involve certain known and unknown risks and uncertainties that could cause actual results to differ materially from those expressed or implied by such statements. The risks and uncertainties include, without limitation: the regulatory, economic and weather conditions in the states in which we operate; the impact of new federal or state regulations that affect the property and casualty insurance market; the cost, variability and availability of reinsurance; assessments charged by various governmental agencies; pricing competition and other initiatives by competitors; our ability to attract and retain the services of senior management; the outcome of litigation pending against us, including the terms of any settlements; dependence on investment income and the composition of our investment portfolio and related market risks; our exposure to catastrophic events and severe weather conditions; downgrades in our financial strength ratings; risks and uncertainties relating to our acquisitions including our ability to successfully integrate the acquired companies; and other risks and uncertainties described in the section entitled "Risk Factors" and elsewhere in our filings with the Securities and Exchange Commission (the "SEC"), including our Annual Report in Form 10-K for the year ended December 31, 2019 and Form 10-Q for the periods ending March 31, 2020, June 30, 2020 and September 30, 2020. We caution you not to place undue reliance on these forward looking statements, which are valid only as of the date they were made. Except as may be required by applicable law, we undertake no obligation to update or revise any forward-looking statements to reflect new information, the occurrence of unanticipated events, or otherwise. This presentation contains certain non-GAAP financial measures. See the Appendix section of this presentation for further information regarding these non-GAAP financial measures. The information in this presentation is confidential. Any photocopying, disclosure, reproduction or alteration of the contents of this presentation and any forwarding of a copy of this presentation or any portion of this presentation to any person is prohibited. 13


