United Insurance Holdings Corporation (Nasdaq: UIHC) Investor Presentation May 9th, 2022
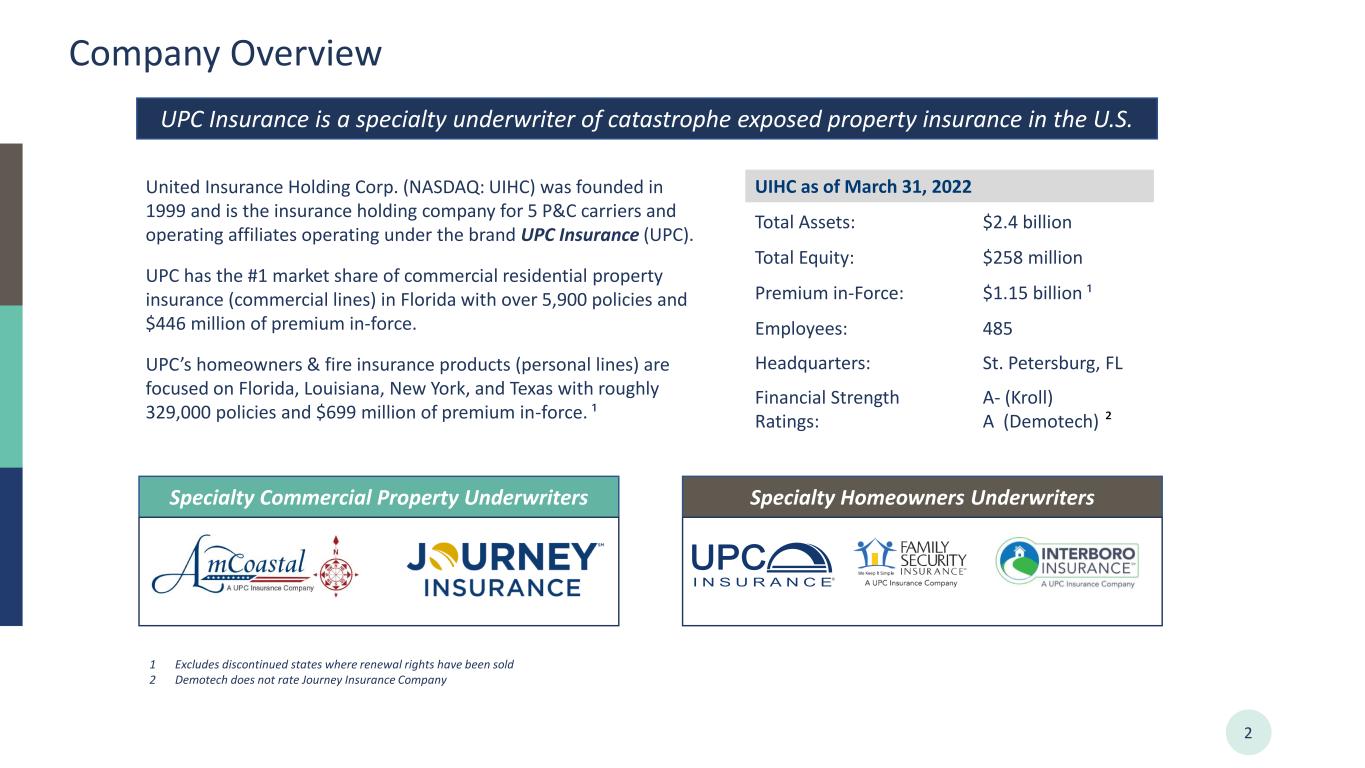
Company Overview 2 UPC Insurance is a specialty underwriter of catastrophe exposed property insurance in the U.S. United Insurance Holding Corp. (NASDAQ: UIHC) was founded in 1999 and is the insurance holding company for 5 P&C carriers and operating affiliates operating under the brand UPC Insurance (UPC). UPC has the #1 market share of commercial residential property insurance (commercial lines) in Florida with over 5,900 policies and $446 million of premium in-force. UPC’s homeowners & fire insurance products (personal lines) are focused on Florida, Louisiana, New York, and Texas with roughly 329,000 policies and $699 million of premium in-force. ¹ UIHC as of March 31, 2022 Total Assets: $2.4 billion Total Equity: $258 million Premium in-Force: $1.15 billion ¹ Employees: 485 Headquarters: St. Petersburg, FL Financial Strength Ratings: A- (Kroll) A (Demotech) 1 Excludes discontinued states where renewal rights have been sold 2 Demotech does not rate Journey Insurance Company Specialty Commercial Property Underwriters Specialty Homeowners Underwriters ²

3 • Q1-2022 Results • Core loss of -$29.3m (-$0.68 per share) compared unfavorably to -$19.4m (-$0.45 per share) last year due to higher net retained losses from 10 new catastrophe events and higher loss severity on attritional claims. • Net premiums were driven lower by the renewal rights sales (NE & SE regions) and quota share cessions intended to de-risk and provide capital support via ceding commissions that also reduced losses and policy acquisition costs. • Stockholders’ equity attributable to UIHC on March 31, 2022, was $258.0m or $5.96 per share with tangible book value of $3.86 per share. • Other Highlights • Received regulatory approval to terminate our intercompany pooling agreement effective January 1, 2022. • Merger of Journey Insurance Company into American Coastal Insurance Company is pending regulatory approval but is expected to assist with improving capital adequacy across our insurance group during the second quarter of 2022. • Lower layers of our core catastrophe reinsurance program renewing on June 1, 2022, are mostly complete. Executive Summary
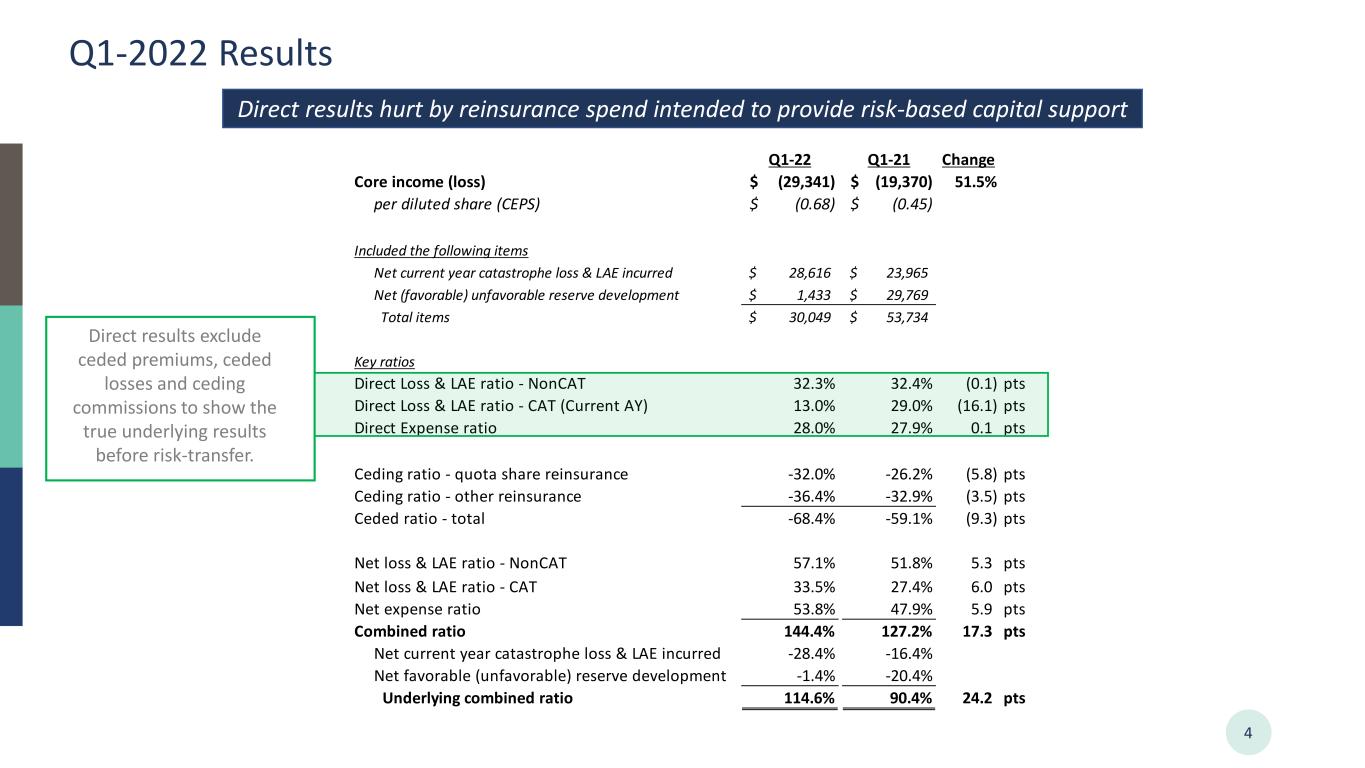
Q1-2022 Results 4 Direct results hurt by reinsurance spend intended to provide risk-based capital support Direct results exclude ceded premiums, ceded losses and ceding commissions to show the true underlying results before risk-transfer. Q1-22 Q1-21 Change Core income (loss) (29,341)$ (19,370)$ 51.5% per diluted share (CEPS) (0.68)$ (0.45)$ Included the following items Net current year catastrophe loss & LAE incurred 28,616$ 23,965$ Net (favorable) unfavorable reserve development 1,433$ 29,769$ Total items 30,049$ 53,734$ Key ratios Direct Loss & LAE ratio - NonCAT 32.3% 32.4% (0.1) pts Direct Loss & LAE ratio - CAT (Current AY) 13.0% 29.0% (16.1) pts Direct Expense ratio 28.0% 27.9% 0.1 pts Ceding ratio - quota share reinsurance -32.0% -26.2% (5.8) pts Ceding ratio - other reinsurance -36.4% -32.9% (3.5) pts Ceded ratio - total -68.4% -59.1% (9.3) pts Net loss & LAE ratio - NonCAT 57.1% 51.8% 5.3 pts Net loss & LAE ratio - CAT 33.5% 27.4% 6.0 pts Net expense ratio 53.8% 47.9% 5.9 pts Combined ratio 144.4% 127.2% 17.3 pts Net current year catastrophe loss & LAE incurred -28.4% -16.4% Net favorable (unfavorable) reserve development -1.4% -20.4% Underlying combined ratio 114.6% 90.4% 24.2 pts
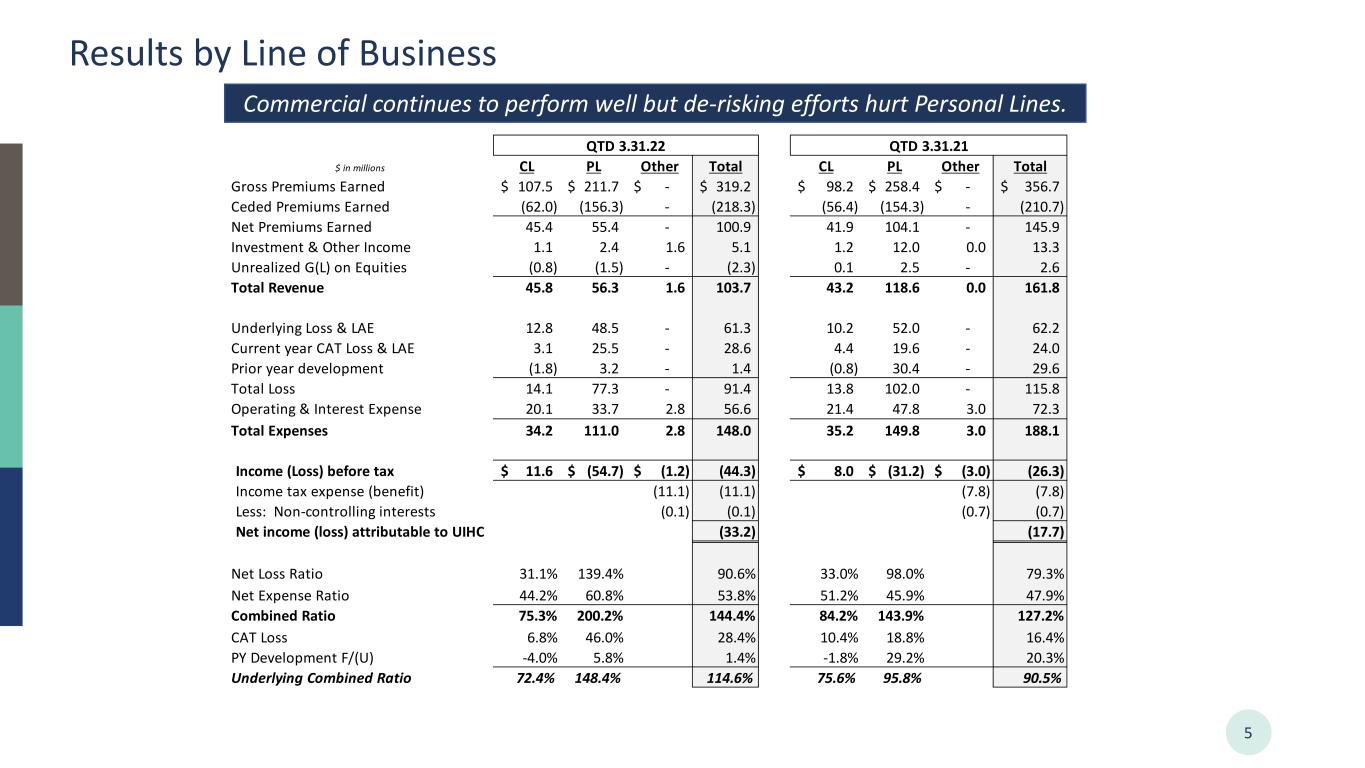
Results by Line of Business 5 Commercial continues to perform well but de-risking efforts hurt Personal Lines. $ in millions CL PL Other Total CL PL Other Total Gross Premiums Earned 107.5$ 211.7$ -$ 319.2$ 98.2$ 258.4$ -$ 356.7$ Ceded Premiums Earned (62.0) (156.3) - (218.3) (56.4) (154.3) - (210.7) Net Premiums Earned 45.4 55.4 - 100.9 41.9 104.1 - 145.9 Investment & Other Income 1.1 2.4 1.6 5.1 1.2 12.0 0.0 13.3 Unrealized G(L) on Equities (0.8) (1.5) - (2.3) 0.1 2.5 - 2.6 Total Revenue 45.8 56.3 1.6 103.7 43.2 118.6 0.0 161.8 Underlying Loss & LAE 12.8 48.5 - 61.3 10.2 52.0 - 62.2 Current year CAT Loss & LAE 3.1 25.5 - 28.6 4.4 19.6 - 24.0 Prior year development (1.8) 3.2 - 1.4 (0.8) 30.4 - 29.6 Total Loss 14.1 77.3 - 91.4 13.8 102.0 - 115.8 Operating & Interest Expense 20.1 33.7 2.8 56.6 21.4 47.8 3.0 72.3 Total Expenses 34.2 111.0 2.8 148.0 35.2 149.8 3.0 188.1 Income (Loss) before tax 11.6$ (54.7)$ (1.2)$ (44.3) 8.0$ (31.2)$ (3.0)$ (26.3) Income tax expense (benefit) (11.1) (11.1) (7.8) (7.8) Less: Non-controlling interests (0.1) (0.1) (0.7) (0.7) Net income (loss) attributable to UIHC (33.2) (17.7) Net Loss Ratio 31.1% 139.4% 90.6% 33.0% 98.0% 79.3% Net Expense Ratio 44.2% 60.8% 53.8% 51.2% 45.9% 47.9% Combined Ratio 75.3% 200.2% 144.4% 84.2% 143.9% 127.2% CAT Loss 6.8% 46.0% 28.4% 10.4% 18.8% 16.4% PY Development F/(U) -4.0% 5.8% 1.4% -1.8% 29.2% 20.3% Underlying Combined Ratio 72.4% 148.4% 114.6% 75.6% 95.8% 90.5% QTD 3.31.22 QTD 3.31.21

6 Personal Lines Renewal Rate Change is Significant We continued to see improved rate adequacy in Q1, but it takes time to earn through. LA TX All Personal Lines Metric 2021 Q1 2021 Q2 2021 Q3 2021 Q4 2022 Q1 Renewing Policies 79,241 99,964 93,364 71,661 64,016 Renewal Acceptance 84.8% 82.7% 80.8% 82.3% 79.4% Company Initiated Non-Renewals 4,931 10,756 11,959 5,046 5,755 Renewal Acceptance xNon-Renewals 89.5% 90.8% 90.2% 87.4% 85.5% Renewed TIV 38,259,906,721 49,343,350,477 45,444,516,211 35,129,624,436 33,159,540,114 Expiring TIV 37,311,555,741 48,111,730,896 44,302,602,896 33,842,563,649 30,865,894,811 Additional TIV 948,350,979 1,231,619,581 1,141,913,315 1,287,060,787 2,293,645,304 Percent Change 2.5% 2.6% 2.6% 3.8% 7.4% Renewed Premium 152,669,228 204,744,103 199,430,515 156,293,383 151,429,011 Expiring Premium 134,921,223 180,860,424 169,762,340 134,640,765 119,597,661 Additional Premium 17,748,005 23,883,678 29,668,175 21,652,618 31,831,351 Percent Change 13.2% 13.2% 17.5% 16.1% 26.6% Renewal Premium Rate/$1k TIV 3.99 4.15 4.39 4.45 4.57 Expiring Premium Rate/$1k TIV 3.62 3.76 3.83 3.98 3.87 Monthly Rate Change 10.3% 10.4% 14.5% 11.8% 17.9% R e n e w in g P o li ci e s O n ly Renewal retention dipped down to 85.5% in Q1 2022 vs. 89.5% in Q1 2021 driven by FL rate changes Record high quarterly rate changes in Q1 2022 Overall TIV increase reflecting efforts of ITV initiatives+37¢ +39¢ +56¢ +47¢ +70¢ Despite 19% fewer policies renewing in Q1 YoY, 79% more premium is being collected as a result of rate increases Companies: UPC, FSIC & IIC States: TX, LA, FL & NY
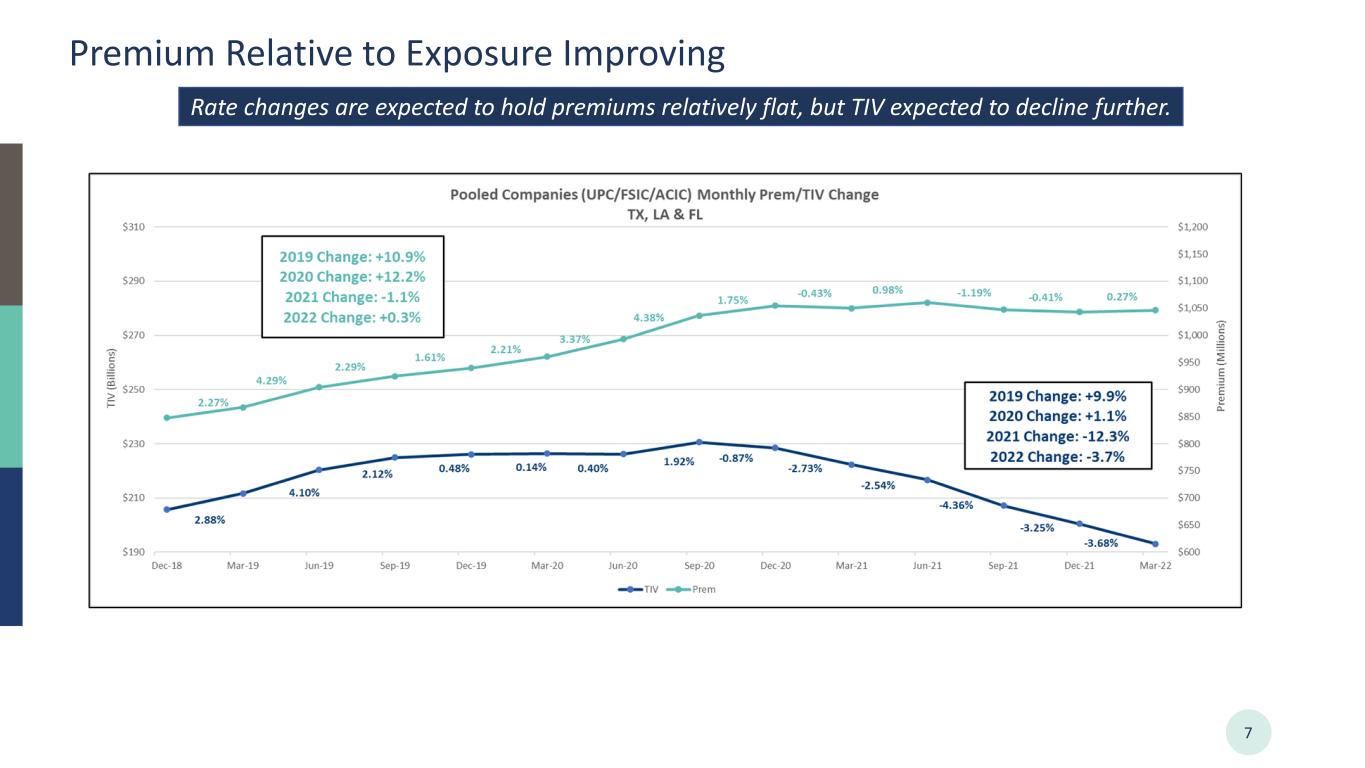
Premium Relative to Exposure Improving 7 Rate changes are expected to hold premiums relatively flat, but TIV expected to decline further.
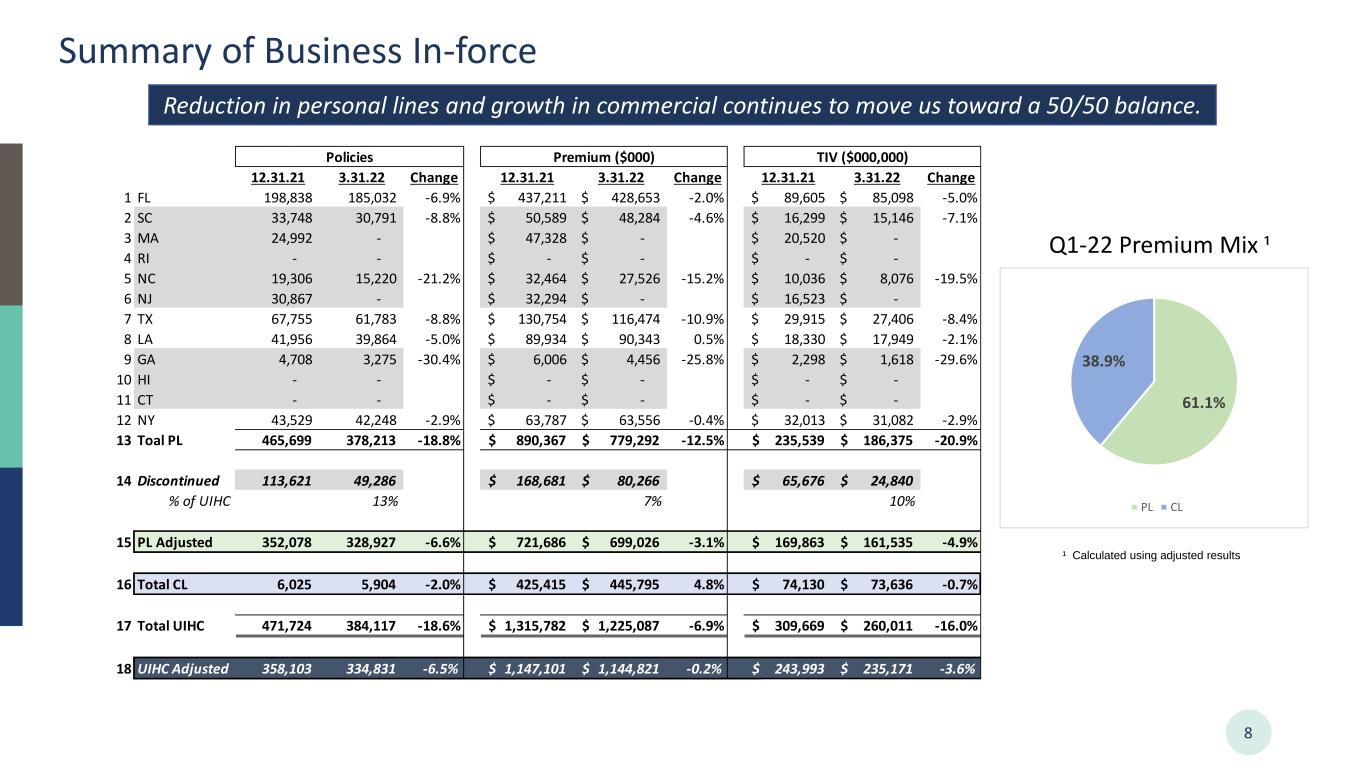
Summary of Business In-force 8 Q1-22 Premium Mix ¹ Reduction in personal lines and growth in commercial continues to move us toward a 50/50 balance. ¹ Calculated using adjusted results 12.31.21 3.31.22 Change 12.31.21 3.31.22 Change 12.31.21 3.31.22 Change 1 FL 198,838 185,032 -6.9% 437,211$ 428,653$ -2.0% 89,605$ 85,098$ -5.0% 2 SC 33,748 30,791 -8.8% 50,589$ 48,284$ -4.6% 16,299$ 15,146$ -7.1% 3 MA 24,992 - 47,328$ -$ 20,520$ -$ 4 RI - - -$ -$ -$ -$ 5 NC 19,306 15,220 -21.2% 32,464$ 27,526$ -15.2% 10,036$ 8,076$ -19.5% 6 NJ 30,867 - 32,294$ -$ 16,523$ -$ 7 TX 67,755 61,783 -8.8% 130,754$ 116,474$ -10.9% 29,915$ 27,406$ -8.4% 8 LA 41,956 39,864 -5.0% 89,934$ 90,343$ 0.5% 18,330$ 17,949$ -2.1% 9 GA 4,708 3,275 -30.4% 6,006$ 4,456$ -25.8% 2,298$ 1,618$ -29.6% 10 HI - - -$ -$ -$ -$ 11 CT - - -$ -$ -$ -$ 12 NY 43,529 42,248 -2.9% 63,787$ 63,556$ -0.4% 32,013$ 31,082$ -2.9% 13 Toal PL 465,699 378,213 -18.8% 890,367$ 779,292$ -12.5% 235,539$ 186,375$ -20.9% 14 Discontinued 113,621 49,286 168,681$ 80,266$ 65,676$ 24,840$ % of UIHC 13% 7% 10% 15 PL Adjusted 352,078 328,927 -6.6% 721,686$ 699,026$ -3.1% 169,863$ 161,535$ -4.9% 16 Total CL 6,025 5,904 -2.0% 425,415$ 445,795$ 4.8% 74,130$ 73,636$ -0.7% 17 Total UIHC 471,724 384,117 -18.6% 1,315,782$ 1,225,087$ -6.9% 309,669$ 260,011$ -16.0% 18 UIHC Adjusted 358,103 334,831 -6.5% 1,147,101$ 1,144,821$ -0.2% 243,993$ 235,171$ -3.6% Policies Premium ($000) TIV ($000,000) 61.1% 38.9% PL CL
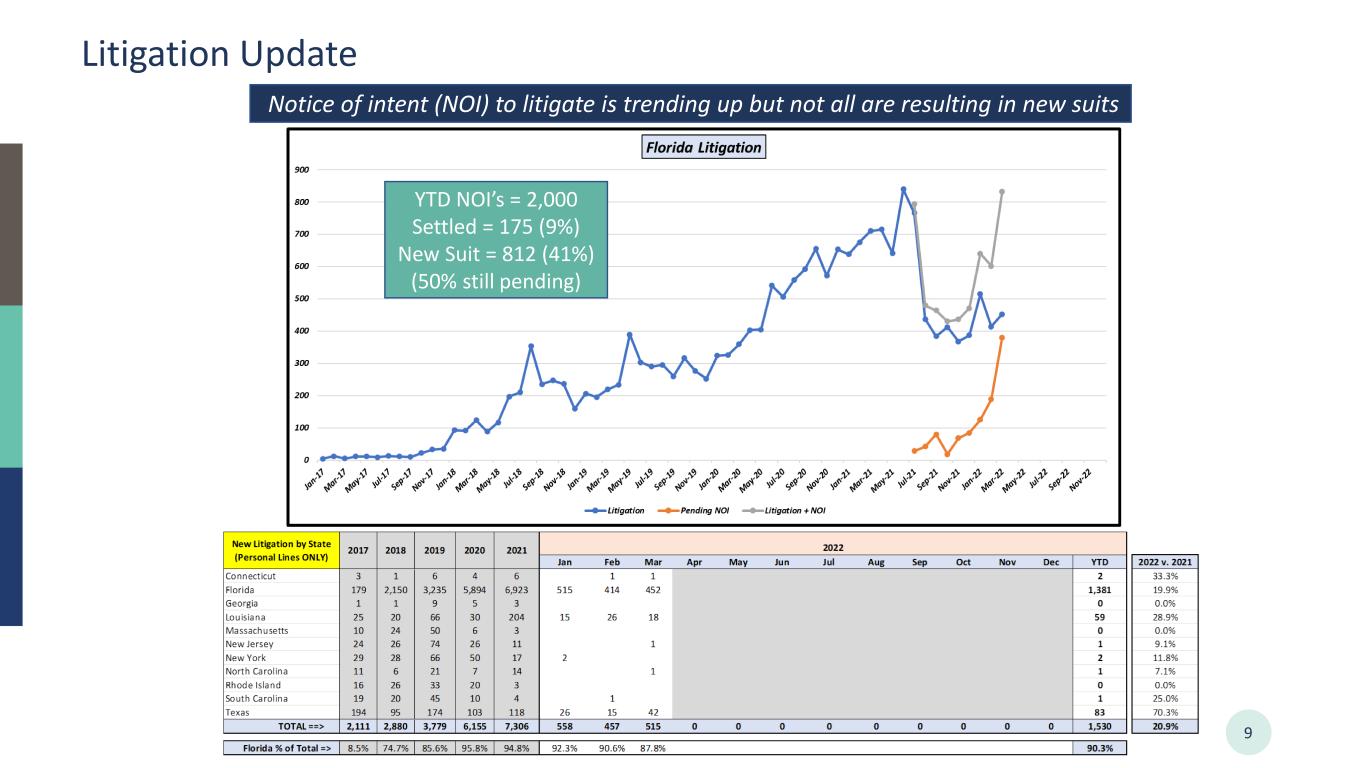
9 Litigation Update Notice of intent (NOI) to litigate is trending up but not all are resulting in new suits YTD NOI’s = 2,000 Settled = 175 (9%) New Suit = 812 (41%) (50% still pending)
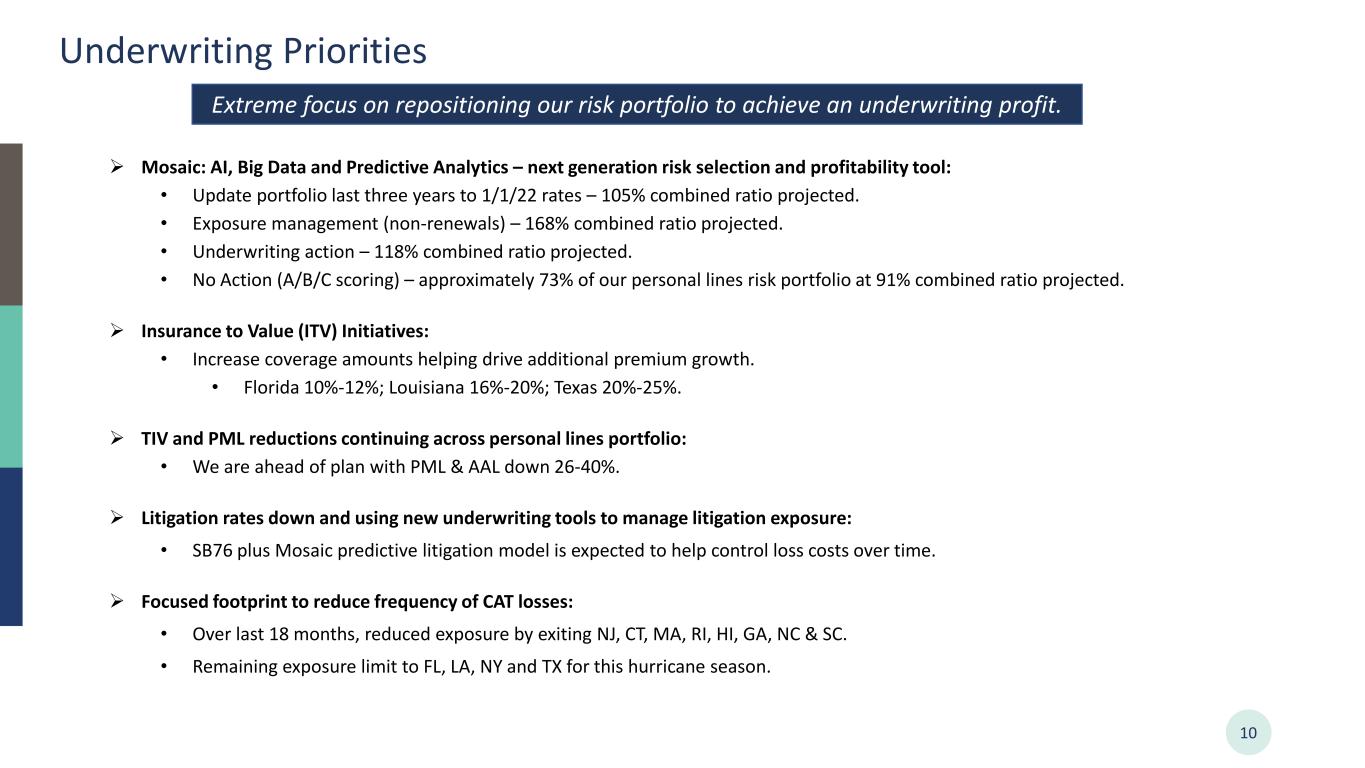
Underwriting Priorities 10 Extreme focus on repositioning our risk portfolio to achieve an underwriting profit. ➢ Mosaic: AI, Big Data and Predictive Analytics – next generation risk selection and profitability tool: • Update portfolio last three years to 1/1/22 rates – 105% combined ratio projected. • Exposure management (non-renewals) – 168% combined ratio projected. • Underwriting action – 118% combined ratio projected. • No Action (A/B/C scoring) – approximately 73% of our personal lines risk portfolio at 91% combined ratio projected. ➢ Insurance to Value (ITV) Initiatives: • Increase coverage amounts helping drive additional premium growth. • Florida 10%-12%; Louisiana 16%-20%; Texas 20%-25%. ➢ TIV and PML reductions continuing across personal lines portfolio: • We are ahead of plan with PML & AAL down 26-40%. ➢ Litigation rates down and using new underwriting tools to manage litigation exposure: • SB76 plus Mosaic predictive litigation model is expected to help control loss costs over time. ➢ Focused footprint to reduce frequency of CAT losses: • Over last 18 months, reduced exposure by exiting NJ, CT, MA, RI, HI, GA, NC & SC. • Remaining exposure limit to FL, LA, NY and TX for this hurricane season.
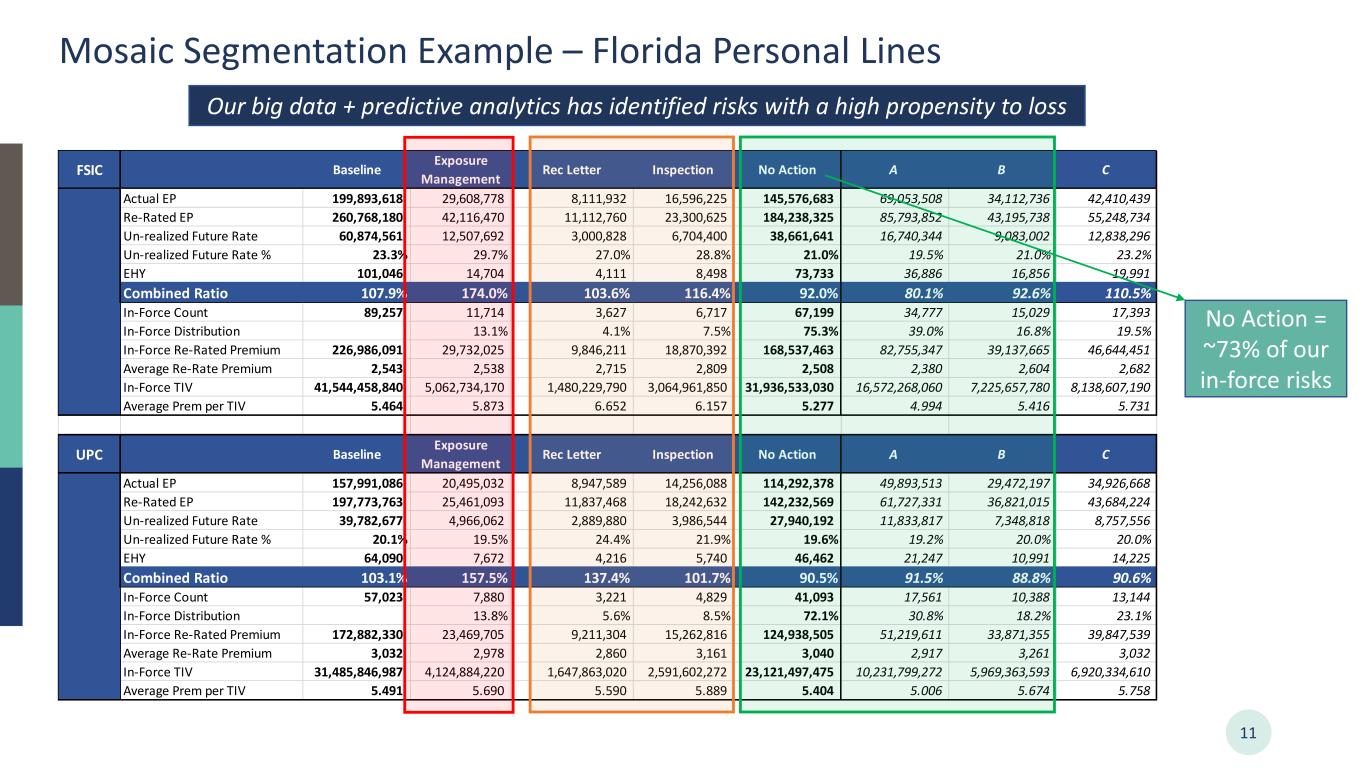
Mosaic Segmentation Example – Florida Personal Lines 11 Our big data + predictive analytics has identified risks with a high propensity to loss FSIC Baseline Exposure Management Rec Letter Inspection No Action A B C Actual EP 199,893,618 29,608,778 8,111,932 16,596,225 145,576,683 69,053,508 34,112,736 42,410,439 Re-Rated EP 260,768,180 42,116,470 11,112,760 23,300,625 184,238,325 85,793,852 43,195,738 55,248,734 Un-realized Future Rate 60,874,561 12,507,692 3,000,828 6,704,400 38,661,641 16,740,344 9,083,002 12,838,296 Un-realized Future Rate % 23.3% 29.7% 27.0% 28.8% 21.0% 19.5% 21.0% 23.2% EHY 101,046 14,704 4,111 8,498 73,733 36,886 16,856 19,991 Combined Ratio 107.9% 174.0% 103.6% 116.4% 92.0% 80.1% 92.6% 110.5% In-Force Count 89,257 11,714 3,627 6,717 67,199 34,777 15,029 17,393 In-Force Distribution 13.1% 4.1% 7.5% 75.3% 39.0% 16.8% 19.5% In-Force Re-Rated Premium 226,986,091 29,732,025 9,846,211 18,870,392 168,537,463 82,755,347 39,137,665 46,644,451 Average Re-Rate Premium 2,543 2,538 2,715 2,809 2,508 2,380 2,604 2,682 In-Force TIV 41,544,458,840 5,062,734,170 1,480,229,790 3,064,961,850 31,936,533,030 16,572,268,060 7,225,657,780 8,138,607,190 Average Prem per TIV 5.464 5.873 6.652 6.157 5.277 4.994 5.416 5.731 UPC Baseline Exposure Management Rec Letter Inspection No Action A B C Actual EP 157,991,086 20,495,032 8,947,589 14,256,088 114,292,378 49,893,513 29,472,197 34,926,668 Re-Rated EP 197,773,763 25,461,093 11,837,468 18,242,632 142,232,569 61,727,331 36,821,015 43,684,224 Un-realized Future Rate 39,782,677 4,966,062 2,889,880 3,986,544 27,940,192 11,833,817 7,348,818 8,757,556 Un-realized Future Rate % 20.1% 19.5% 24.4% 21.9% 19.6% 19.2% 20.0% 20.0% EHY 64,090 7,672 4,216 5,740 46,462 21,247 10,991 14,225 Combined Ratio 103.1% 157.5% 137.4% 101.7% 90.5% 91.5% 88.8% 90.6% In-Force Count 57,023 7,880 3,221 4,829 41,093 17,561 10,388 13,144 In-Force Distribution 13.8% 5.6% 8.5% 72.1% 30.8% 18.2% 23.1% In-Force Re-Rated Premium 172,882,330 23,469,705 9,211,304 15,262,816 124,938,505 51,219,611 33,871,355 39,847,539 Average Re-Rate Premium 3,032 2,978 2,860 3,161 3,040 2,917 3,261 3,032 In-Force TIV 31,485,846,987 4,124,884,220 1,647,863,020 2,591,602,272 23,121,497,475 10,231,799,272 5,969,363,593 6,920,334,610 Average Prem per TIV 5.491 5.690 5.590 5.889 5.404 5.006 5.674 5.758 No Action = ~73% of our in-force risks
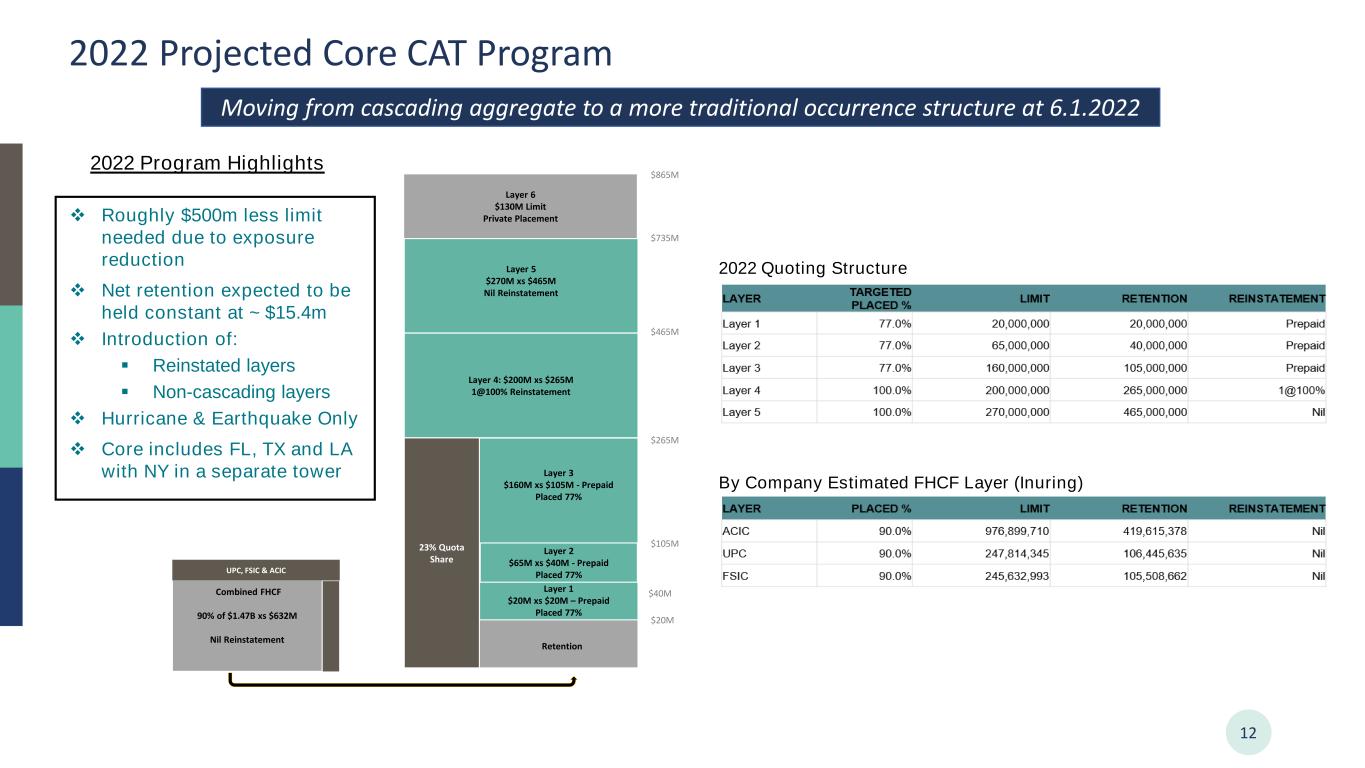
2022 Projected Core CAT Program 12 Moving from cascading aggregate to a more traditional occurrence structure at 6.1.2022 Combined FHCF 90% of $1.47B xs $632M Nil Reinstatement UPC, FSIC & ACIC $735M $865M Layer 1 $20M xs $20M – Prepaid Placed 77% Layer 2 $65M xs $40M - Prepaid Placed 77% Layer 3 $160M xs $105M - Prepaid Placed 77% Layer 4: $200M xs $265M 1@100% Reinstatement Layer 5 $270M xs $465M Nil Reinstatement Layer 6 $130M Limit Private Placement $20M $40M $105M $265M $465M Retention 23% Quota Share 2022 Quoting Structure By Company Estimated FHCF Layer (Inuring) ❖ Roughly $500m less limit needed due to exposure reduction ❖ Net retention expected to be held constant at ~ $15.4m ❖ Introduction of: ▪ Reinstated layers ▪ Non-cascading layers ❖ Hurricane & Earthquake Only ❖ Core includes FL, TX and LA with NY in a separate tower 2022 Program Highlights
Cautionary Statements 13 This presentation contains "forward-looking statements" within the meaning of the Private Securities Litigation Reform Act of 1995. These forward looking statements include expectations regarding our diversification, growth opportunities, retention rates, liquidity, investment returns and our ability to meet our investment objectives and to manage and mitigate market risk with respect to our investments. These statements are based on current expectations, estimates and projections about the industry and market in which we operate, and management's beliefs and assumptions. Without limiting the generality of the foregoing, words such as "may," "will," "expect," "endeavor," "project," "believe," "anticipate," "intend," "could," "would," "estimate," or "continue" or the negative variations thereof, or comparable terminology, are intended to identify forward-looking statements. Forward-looking statements are not guarantees of future performance and involve certain known and unknown risks and uncertainties that could cause actual results to differ materially from those expressed or implied by such statements. The risks and uncertainties include, without limitation: the regulatory, economic and weather conditions in the states in which we operate; the impact of new federal or state regulations that affect the property and casualty insurance market; the cost, variability and availability of reinsurance; assessments charged by various governmental agencies; pricing competition and other initiatives by competitors; our ability to attract and retain the services of senior management; the outcome of litigation pending against us, including the terms of any settlements; dependence on investment income and the composition of our investment portfolio and related market risks; our exposure to catastrophic events and severe weather conditions; downgrades in our financial strength ratings; risks and uncertainties relating to our acquisitions including our ability to successfully integrate the acquired companies; and other risks and uncertainties described in the section entitled "Risk Factors" and elsewhere in our filings with the Securities and Exchange Commission (the "SEC"), including our Annual Report in Form 10-K for the year ended December 31, 2020 and 2021 and our Form 10-Q for the periods ending March 31, 2021, June 30, 2021, September 30, 2021, and March 31, 2022 once available. We caution you not to place undue reliance on these forward looking statements, which are valid only as of the date they were made. Except as may be required by applicable law, we undertake no obligation to update or revise any forward-looking statements to reflect new information, the occurrence of unanticipated events, or otherwise. This presentation contains certain non-GAAP financial measures. See our earnings release, Form 10-K ,and Form 10-Q for further information regarding these non-GAAP financial measures. The information in this presentation is confidential. Any photocopying, disclosure, reproduction or alteration of the contents of this presentation and any forwarding of a copy of this presentation or any portion of this presentation to any person is prohibited.
