Exhibit 99.1
|
Interim 5-Year Analysis of iDFS Data from Phase III ExteNET Trial
July 2016
Copyright 2016 Puma Biotechnology
|
Forward-Looking Safe Harbor Statement
This presentation contains forward-looking statements within the meaning of the Private Securities Litigation Reform Act of 1995, including, but not limited to, statements regarding the potential indications of our drug candidates and the development of our drug candidates, including, but not limited to, the anticipated timing for the announcement of data from our clinical trials. These statements are often, but not always, made through the use of words or phrases such as ``anticipates,’’ ``expects,’’ ``plans,’’ ``believes,’’ ``intends,’’ and similar words or phrases. All forward–looking statements included in this presentation involve risks and uncertainties that could cause our actual results to differ materially from the anticipated results and expectations expressed in these forward-looking statements. These statements are based on current expectations, forecasts and assumptions, and actual outcomes and results could differ materially from these statements due to a number of factors, which include, but are not limited to, the fact that we have no product revenue and no products approved for marketing; our dependence on our lead product candidate PB272, which is still under development and may never receive regulatory approval; the challenges associated with conducting and enrolling clinical trials; the risk that results of clinical trials may not support our drug candidate claims; even if approved, the risk that physicians and patients may not accept or use our products; our reliance on third parties to conduct our clinical trials and to formulate and manufacture our drug candidates; our dependence on licensed intellectual property; and the other risk factors disclosed in our periodic and current reports filed with the Securities and Exchange Commission from time to time, including our Annual Report on Form 10-K for the fiscal year ended December 31, 2015. Readers are cautioned not to place undue reliance on these forward-looking statements, which speak only as of the date hereof. We assume no obligation to update these forward-looking statements except as required by law.
Copyright 2016 Puma Biotechnology
2
|
ExteNET: study design
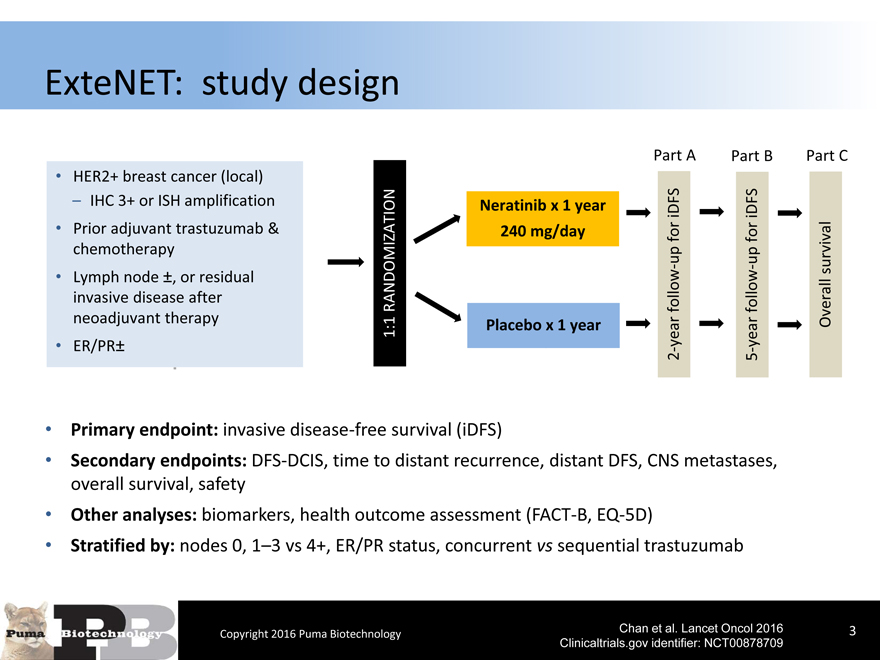
HER2+ breast cancer (local) – IHC 3+ or ISH amplification
Prior adjuvant trastuzumab & chemotherapy
Lymph node ±, or residual invasive disease after neoadjuvant therapy
ER/PR±
Part APart BPart C
Neratinib x 1 year iDFSiDFS
240 mg/day forfor
upup
RANDOMIZATION N=2840 --survival
followfollowOverall
1:1 Placebo x 1 year yearyear
--
25
Primary endpoint: invasive disease-free survival (iDFS)
Secondary endpoints: DFS-DCIS, time to distant recurrence, distant DFS, CNS metastases, overall survival, safety
Other analyses: biomarkers, health outcome assessment (FACT-B, EQ-5D)
Stratified by: nodes 0, 1–3 vs 4+, ER/PR status, concurrent vs sequential trastuzumab
Copyright 2016 Puma Biotechnology Chan et al. Lancet Oncol 2016 3
Clinicaltrials.gov identifier: NCT00878709
|
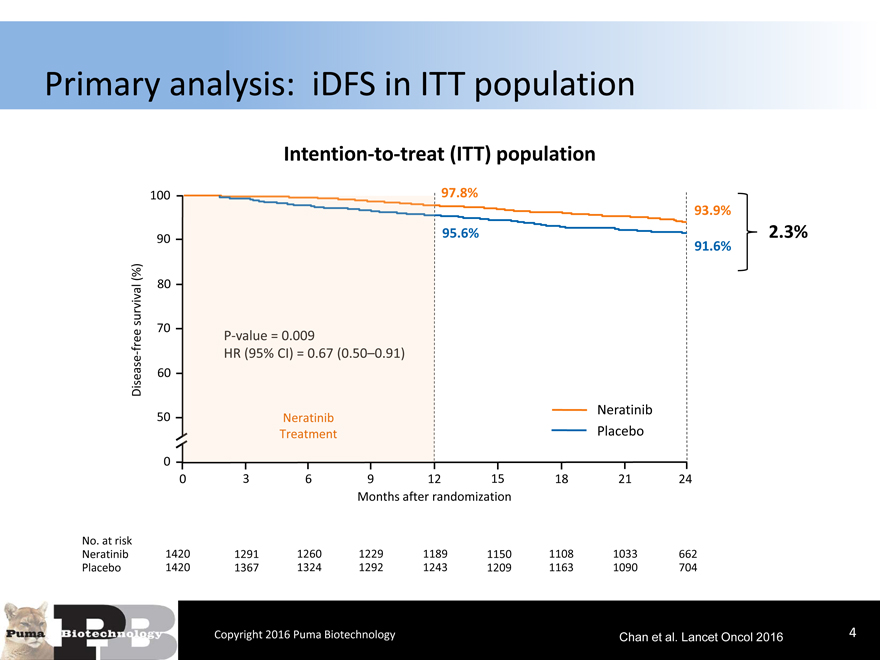
Primary analysis: iDFS in ITT population
Intention-to-treat (ITT) population
100 97.8%
93.9%
90 95.6%2.3%
91.6%
(%) 80
survival 70
free
-
Disease 60
50 NeratinibNeratinib
TreatmentPlacebo
0
0 3691215182124
Months after randomization
No. at risk
Neratinib 1420 1291126012291189115011081033662
Placebo 1420 1367132412921243120911631090704
Copyright 2016 Puma Biotechnology
Chan et al. Lancet Oncol 2016 4
|
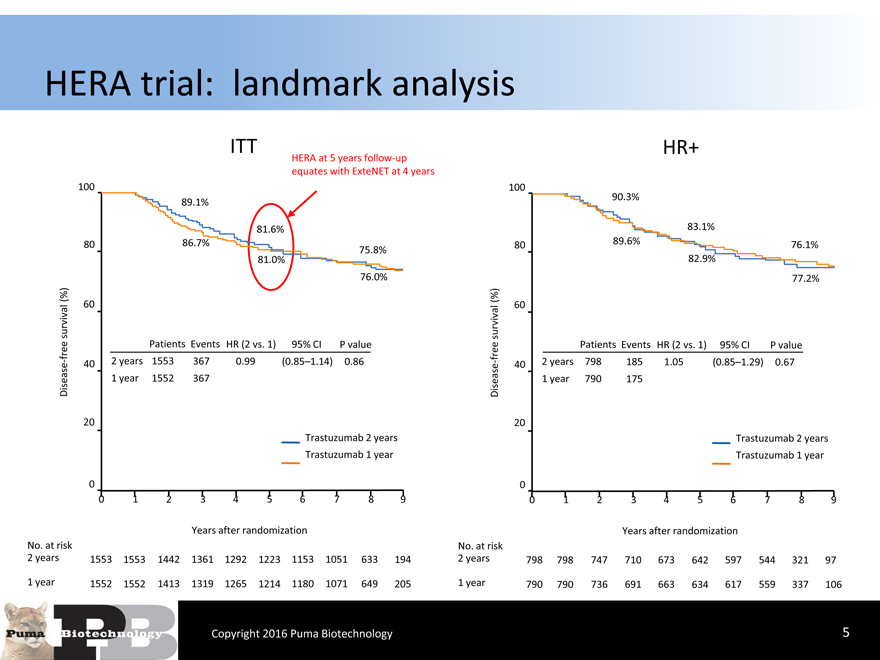
HERA trial: landmark analysis
ITTHR+
HERA at 5 years follow-up
equates with ExteNET at 4 years
100 100
89.1%90.3%
81.6%83.1%
80 86.7%75.8%8089.6%76.1%
81.0%82.9%
76.0%77.2%
(%) (%)
60 60
survival survival
free Patients Events HR (2 vs. 1)95% CIP valuefreePatients Events HR (2 vs. 1)95% CIP value
- 40 2 years 15533670.99(0.85–1.14) 0.86- 402 years7981851.05(0.85–1.29) 0.67
Disease 1 year 1552367Disease1 year790175
20 20
Trastuzumab 2 yearsTrastuzumab 2 years
Trastuzumab 1 yearTrastuzumab 1 year
0 0
0 1234567890123456789
Years after randomizationYears after randomization
No. at risk No. at risk
2 years 1553 15531442136112921223115310516331942 years79879874771067364259754432197
1 year 1552 15521413131912651214118010716492051 year790790736691663634617559337106
Copyright 2016 Puma Biotechnology5
|
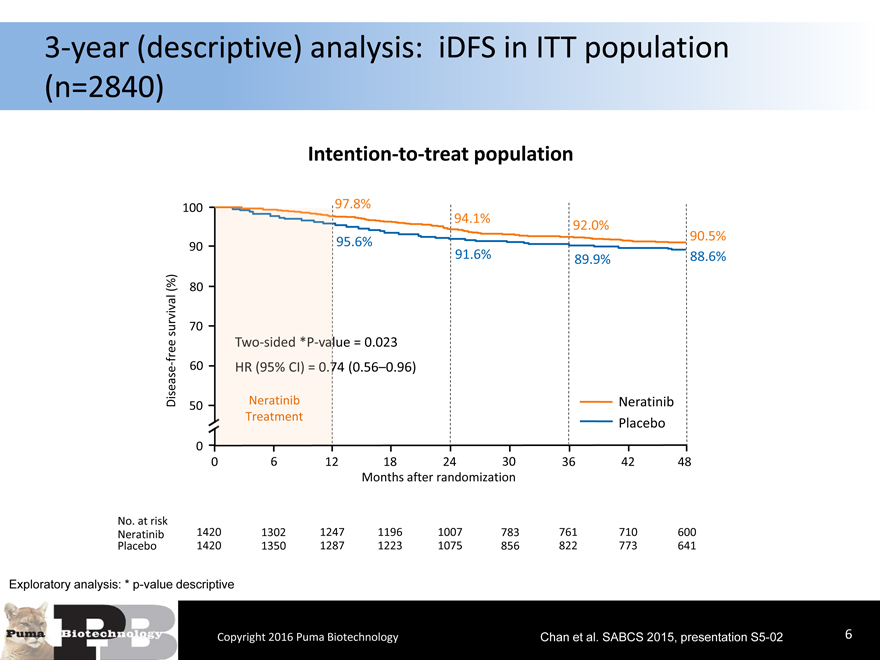
3-year (descriptive) analysis: iDFS in ITT population
(n=2840)
Intention-to-treat population
100 97.8%
94.1%92.0%
90.5%
90 95.6%91.6%89.9%88.6%
(%) 80
survival 70
free lue = 0.023
- 60 74 (0.56–0.96)
Disease 50 NeratinibNeratinib
TreatmentPlacebo
0
0 612182430364248
Months after randomization
No. at risk
Neratinib 1420 1302124711961007783761710600
Placebo 1420 1350128712231075856822773641
Exploratory analysis: * p-value descriptive
Copyright 2016 Puma Biotechnology Chan et al. SABCS 2015, presentation S5-026
|
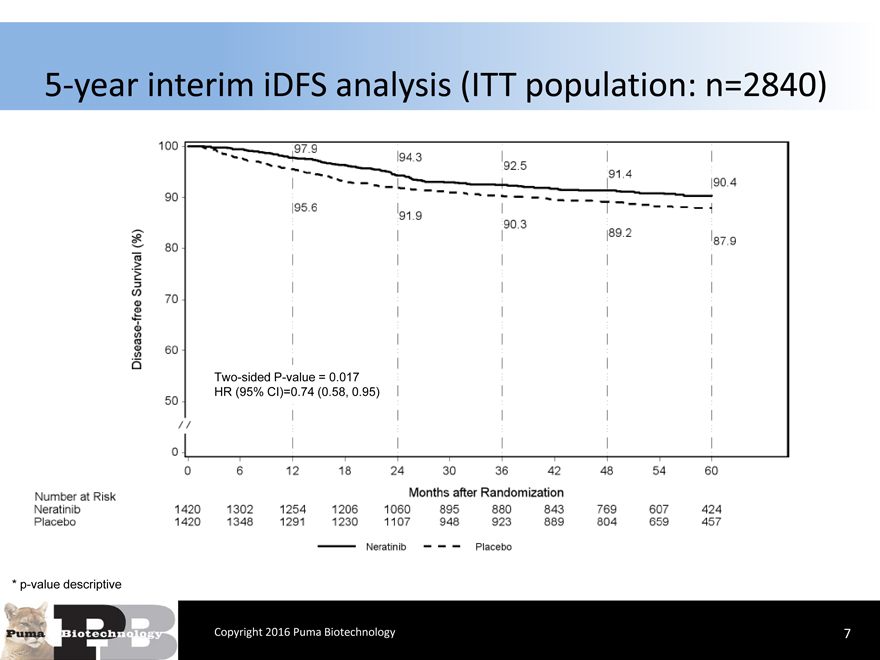
5-year interim iDFS analysis (ITT population: n=2840)
Two-sided P-value = 0.017 HR (95% CI)=0.74 (0.58, 0.95)
* p-value descriptive
Copyright 2016 Puma Biotechnology
7
|
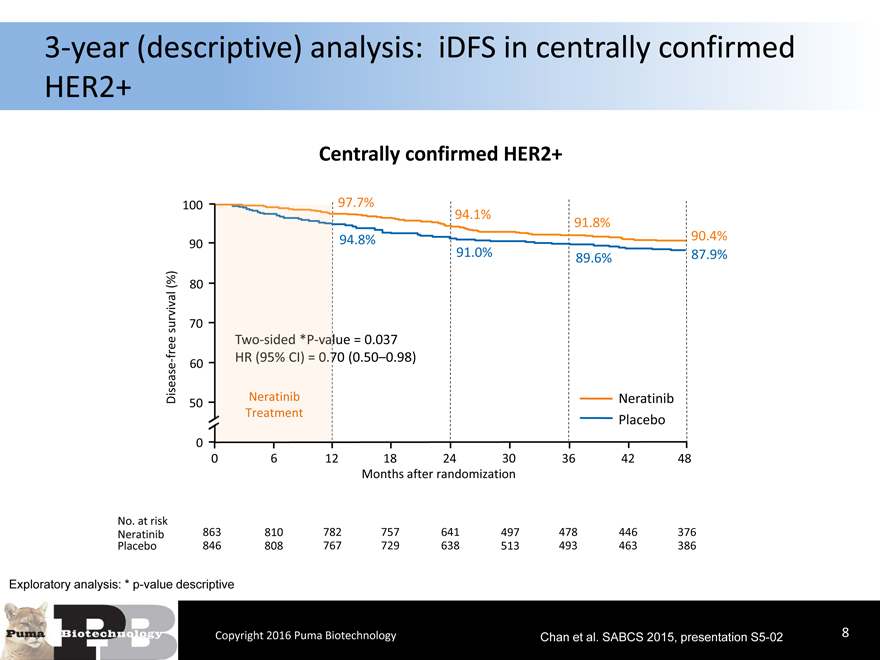
3-year (descriptive) analysis: iDFS in centrally confirmed
HER2+
Centrally confirmed HER2+
100 97.7%
94.1%91.8%
90 94.8%90.4%
91.0%89.6%87.9%
(%) 80
survival 70
free 70 lue (0.50–0.98) = 0.037
- 60
Disease 50 NeratinibNeratinib
TreatmentPlacebo
0
0 612182430364248
Months after randomization
No. at risk
Neratinib 863 810782757641497478446376
Placebo 846 808767729638513493463386
Exploratory analysis: * p-value descriptive
Copyright 2016 Puma Biotechnology Chan et al. SABCS 2015, presentation S5-028
|
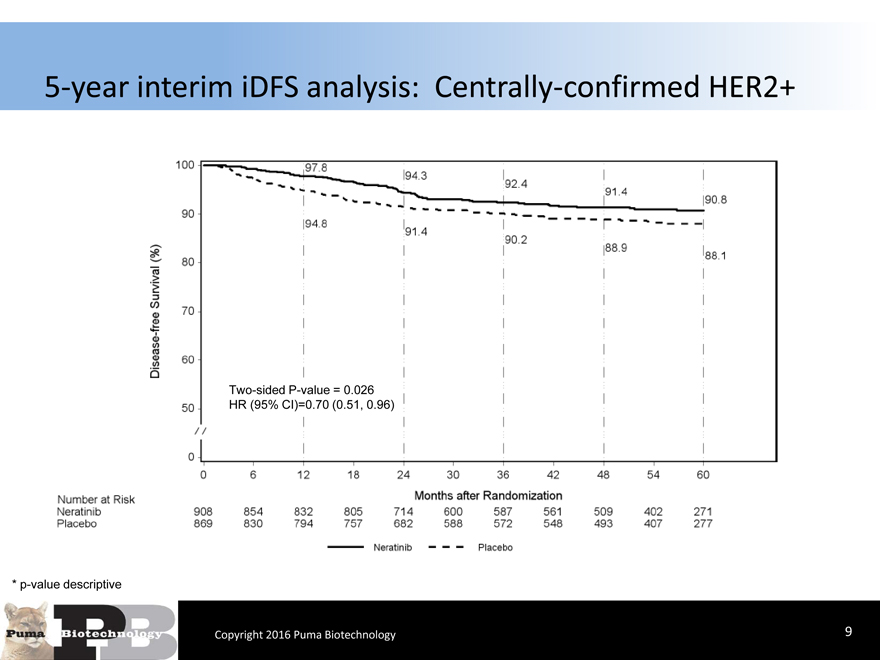
5-year interim iDFS analysis: Centrally-confirmed HER2+
Two-sided P-value = 0.026 HR (95% CI)=0.70 (0.51, 0.96)
* p-value descriptive
Copyright 2016 Puma Biotechnology 9
|
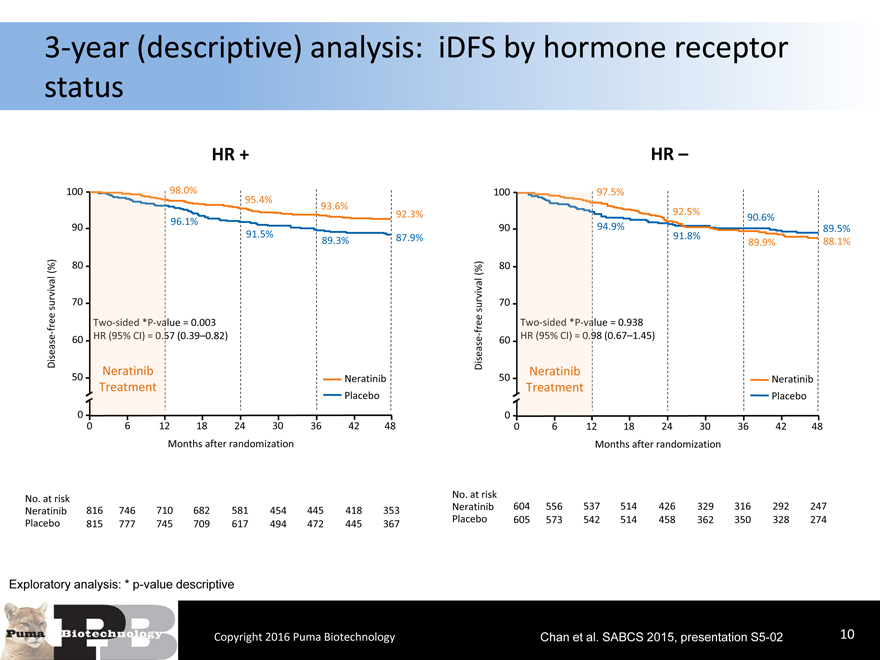
3-year (descriptive) analysis: iDFS by hormone receptor status
HR +
100 98.0%
95.4%93.6%
92.3%
90 96.1%
91.5%89.3%87.9%
(%) 80
survival 70
free lue = 0.003
-
Disease 60 57 (0.39–0.82)
Neratinib
50 Neratinib
TreatmentPlacebo
0
0 612182430364248
Months after randomization
No. at risk
Neratinib 816 746 710682581454445418353
Placebo 815 777 745709617494472445367
Exploratory analysis: * p-value descriptive
Copyright 2016 Puma Biotechnology
HR –
100 97.5%
92.5%90.6%
90 94.9%89.5%
91.8%89.9%88.1%
(%) 80
survival 70
free lue = 0.938
- 60 98 (0.67–1.45)
Disease Neratinib
50 Neratinib
Treatment
Placebo
0
0 612182430364248
Months after randomization
No. at risk
Neratinib 604 556 537514426329316292247
Placebo 605 573 542514458362350328274
Chan et al. SABCS 2015, presentation S5-02 10
|
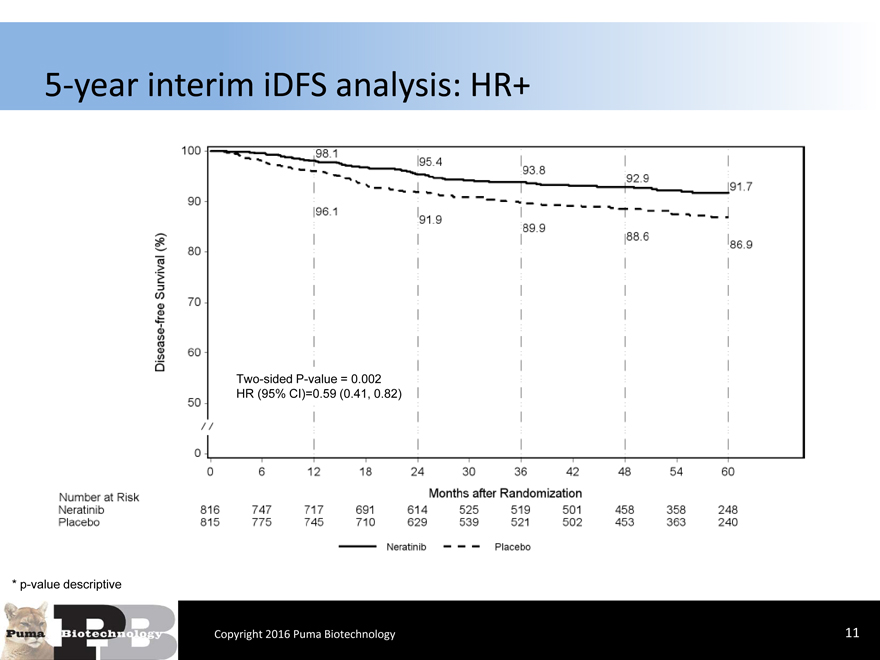
5-year interim iDFS analysis: HR+
Two-sided P-value = 0.002 HR (95% CI)=0.59 (0.41, 0.82)
* p-value descriptive
Copyright 2016 Puma Biotechnology 11
|
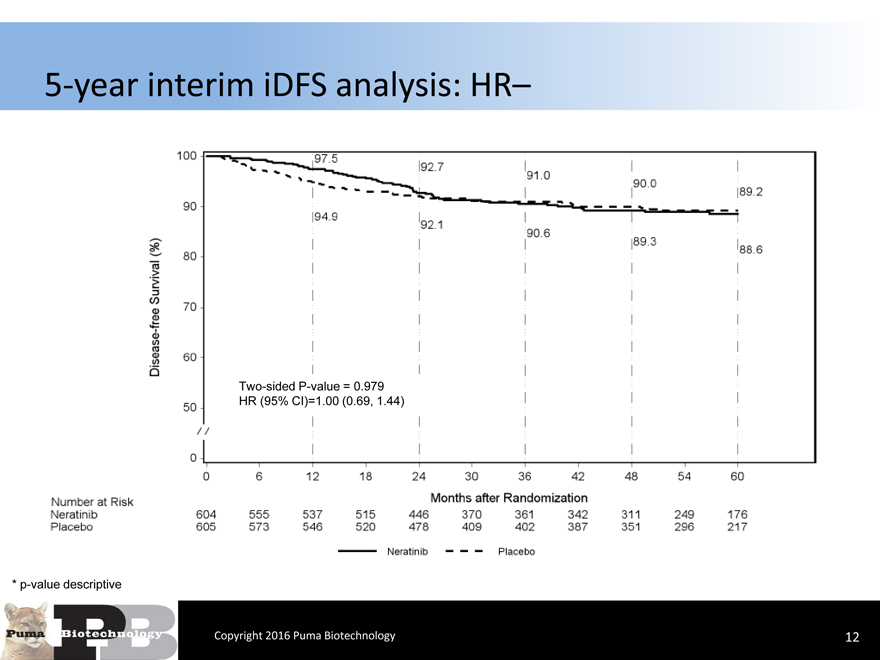
5-year interim iDFS analysis: HR–
Two-sided P-value = 0.979 HR (95% CI)=1.00 (0.69, 1.44)
* p-value descriptive
Copyright 2016 Puma Biotechnology
12
|
Updated Data and 5-Year Interim Update
Included in both MAA and NDA submissions
Included as Addendums
Full 5-year DFS data anticipated in 2017
Copyright 2016 Puma Biotechnology
13
