Shareholder Letter
Q1 FY 2019 - May 7, 2019
Dear Fellow Shareholders,
The skills divide is real. Every day we see more examples of companies struggling to find highly skilled workers, while at the same time, unskilled workers line the streets looking for jobs, creating a mountain of applications for companies to disposition.
As a global leader in learning and talent management, we believe we are extremely well-positioned to help organizations of all sizes address the skills divide. It is not surprising, therefore, that the momentum we demonstrated in 2018 has continued in Q1 2019. We experienced ongoing strength in our core learning and content offerings during the quarter and believe these products will continue to enjoy healthy growth in the coming quarters and years.
Note: a reconciliation of non-GAAP financial measures used in this shareholder letter to their nearest GAAP equivalents is provided at the end of this letter.
Over the past decade, we developed a dominant position in talent management and are widely recognized as the worldwide market leader in corporate learning. In 2018, over 520 million online course registrations and 330 million online course completions happened with Cornerstone.
Our scale provides us with an enormous amount of data which can be leveraged by our machine learning platform. This enables us to power a personalization engine which supports our new content business by dynamically delivering the most relevant and popular courses to our users. In other words, our scale, data, machine learning and content aggregation are creating a wide and deep moat that we expect will protect and strengthen our competitive position and growth opportunities for years to come.
The Market Opportunity
As the relentless pace of technological change continues to impact every industry and ultimately, every job, there's a growing global need for continuous training and development to stay competitive, both for the organization and for the individual employee. As a global leader in corporate learning, we believe that we are poised for a period of strong, sustainable growth and our mission, strategy and execution will continue to drive positive results.
We now operate in two large global markets: human capital management (HCM) and corporate learning, which together represent a $40 billion1 opportunity. With our leading position in these markets, we believe we are well-situated to leverage the tailwind created by the rising global need for lifelong learning. |
| | |
1 |
| Source: Training Industry Report (2017); Company estimates and WW HCM Apps Forecast, IDC WW Tracker, June 2018 Report |
New Client Additions & Upsells
During the first quarter of 2019, amongst many others, our new client, upsells, and renewals included:

|
|
The University of Arizona - The University of Arizona is a public research university in Tucson, Arizona. The university enrolls 44,000 students with 15,000+ employees in 19 separate colleges/schools and partnered with Cornerstone by purchasing our Recruiting Suite, which aims to automate and streamline the recruitment process, improve candidate and University communication, and reduce administrative burden.
|

|
|
CBS Corporation - CBS Corporation is a mass media company that creates and distributes industry-leading content across a variety of platforms to audiences around the world. CBS selected the Cornerstone Learning suite as part of its learning and development journey. Cornerstone won against the competition due to the depth and breadth of our Learning product, proven expertise and ability to manage multiple subsidiaries.
|

|
|
Banco Santander - Banco Santander is the largest bank in Spain and the 5th largest in Europe. Its shares are traded on both the Ibex35 and the EURO STOXX 50, and they have presences in Spain (HQ), Portugal, Poland, Brazil, Mexico, USA, Uruguay, and Chile. With over 210,000 employees, Santander has been an existing customer of Cornerstone’s Learning Suite since 2016, and in Q1 added a significant number of seats to their existing deployment.
|

|
|
Stihl Corporation - STIHL USA, which manufactures the number one selling brand of chainsaws and a full line of handheld outdoor power tools, chose the Cornerstone Extended Enterprise solution to deploy training to over 9,000 dealers across the United States. |
2019 Key Focus Areas
We plan to increase our competitive moat and distance ourselves from our competitors by focusing our efforts in 2019 on three primary areas:
| |
| 1) | LEVERAGING OUR DOMINANT POSITION IN LEARNING |
Our scale in the learning market is unparalleled. In 2018, the 330 million course completions that took place on our learning system put us in a unique category. We now deliver training to tens of millions of people in 192 countries across the public and private sector.
We are leveraging our global footprint to delve deep into industries that require complex and extremely tailored learning solutions, such as life sciences, banking, and healthcare. These solutions, which often require highly-automated and industry-specific rules, ensure the right people get the right version of the right training at the right time, with an audit trail, at scale.
Having solutions that penetrate across a wide variety of industries also gives us a unique ability to effectively target both greenfield and replacement opportunities, and we see abundant opportunities to continue replacing legacy on-premise systems with our modern SaaS solution. As our momentum has continued to build, we have found our win rates improving against our legacy learning management system competitors.
| |
| 2) | DRIVING CONTENT SUBSCRIPTIONS TO OUR LEARNING INSTALLED BASE |
The data that we receive from delivering online learning provides us with tremendous insights into our users’ behaviors and fuels our machine learning-driven strategy of providing highly personalized content to each of our users. The link between providing relevant content and increased engagement is well-proven across many industries, and we remain confident in our ability to leverage our position as the market leader in learning to drive better outcomes for our clients and our stakeholders.
Our favorable market position also provides us with access to high-quality content. Content creators are increasingly partnering with companies like us that can provide the greatest reach and distribution to their relevant audiences. Given our scale, we are well-positioned to attract and partner with the top content partners for our Content Anytime subscriptions in order to drive the greatest value to our clients.
Our installed base of learning clients presents a ripe opportunity for us to rapidly gain share in what we believe is a ~$25 billion third-party corporate learning content market. With our Content Anytime subscriptions, we provide access to unique, high-quality content our clients want to consume, while simultaneously reducing their costs to deliver highly personalized, mobile-ready, relevant content to their employees.
Our early successes with the Content Anytime subscriptions validate the market opportunity and we have increasing levels of confidence that the market opportunity is vast. We believe that within our installed base alone, there is a $250 million content revenue opportunity. Our goal is to capitalize on that opportunity.
3) DEEPENING OUR FOOTPRINT WITHIN OUR INSTALLED BASE
We will continue to extend our footprint within our client base beyond the Learning suite. Today, a significant portion of our revenue comes from our Performance, Recruiting, and HR suites. We continue to drive home the importance of training in the broader context of managing talent, whether it is to more effectively onboard a new recruit, or to remediate competency gaps to enable higher levels of productivity. As we continue to innovate and expand both our product portfolio and global client roster, our market opportunity continues to rise.
Q1 2019 Highlights
Q1 was characterized by continued high levels of sales productivity that began in early 2018 when our sales operations team instilled increased scalability into our go-to-market efforts.
Our EMEA sales team had a particularly strong Q1, with notable growth achieved in our core learning products. In this region, our average deal size and win rates ticked-up meaningfully over the prior periods including a six-figure deal in North Africa with one of the largest fertilizer exporters in the world.
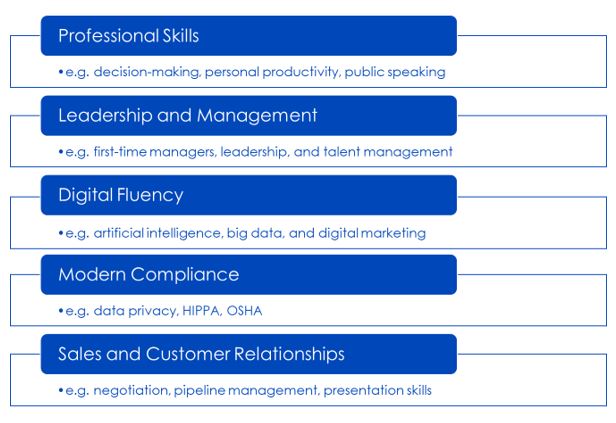
In Content, we experienced continued momentum with particularly strong growth in average deal sizes and a notable uptick in larger deals. We released several new Content Anytime subscriptions during Q1 and look forward to strong uptake of these packages during the remainder of 2019 and beyond. Our Content Anytime subscriptions will include:
In APJ, we strengthened our leadership team with the hiring of Jonathan Epstein as our new managing director of Japan. As Managing Director, Jonathan will oversee Japanese sales, marketing, client success and alliances, while also assuming responsibility for formulating and driving the overall growth strategy for Cornerstone’s business in Japan.
Continuing to Innovate
We’ve recently made meaningful enhancements and added increased functionality to several of our products. For our Learning suite, we developed the Express Class feature, which empowers organizations to more easily deploy and document just-in-time training. One relevant use case that’s driving strong interest is “Impromptu Training.” Here is an example,
Bill, a warehouse foreman, sees one of his warehouse unloaders, Zack, drop a stack of boxes onto the floor in the warehouse while operating a forklift. Bill sees an opportunity to give Zack additional training on forklift driving. After giving Zack training, Bill adds Zack to Forklift Training 101 on his tablet using Express Class and marks Zack as complete. Zack receives transcript credit for the training.
|
|
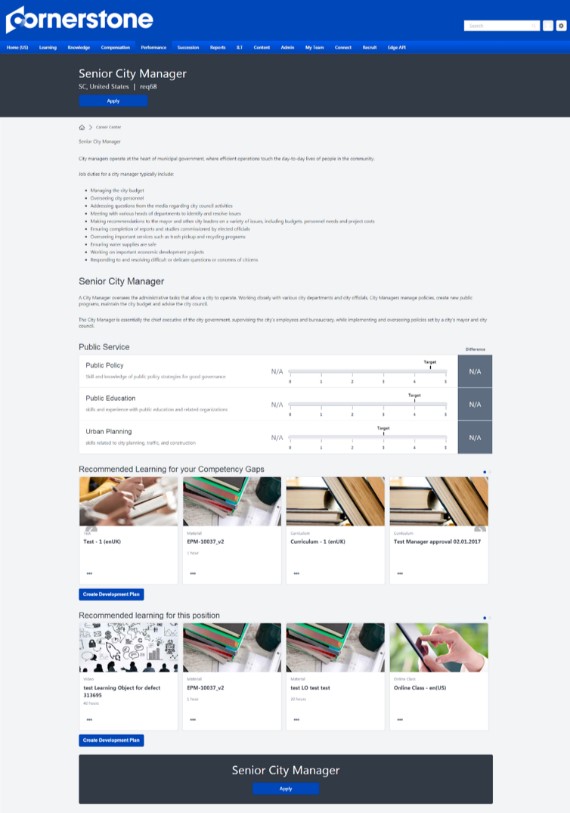
We updated our Career Center for the Recruiting suite, which delivers tools that allow employees to take more control of their own career planning and development. With a new and intuitive mobile-first user interface, employees are able to discover, learn about, and apply to open jobs within their organization. Because it seamlessly integrates with our Learning and Performance suites, we’re also able to recommend training to better prepare employees for their next move. Providing increased transparency around career opportunities within an organization tends to improve employee engagement and enables internal mobility, which ultimately increases employee retention - a common goal across our client base. We also recently launched our new Cornerstone Create tool, which enables users to quickly and seamlessly build interactive, mobile-optimized content using pre-built templates. We acquired this capability with our Grovo acquisition in 2018 and it is now being marketed to all Cornerstone Learning clients. Finally, we made meaningful strides in our ongoing initiative to integrate artificial intelligence into our Learning Experience Platform. Our tools enable our customers to benefit from insights gleaned across our network of over 40 million active users. By marrying learning consumption data with performance reviews and other employee characteristics, we believe we are creating a formidable barrier that that will distance us from our competition.
|
Investing in Client Success
As part of our commitment to maintaining industry-leading dollar retention rates, we made significant investments in our ongoing services transformation, which included strengthening our global support operations. During Q1, we opened a new support center in Salt Lake City and increased the staffing level of our tenured agents by 50%. In addition, we deployed a new interactive voice response system and upgraded our instance of Salesforce Service Cloud to optimize our clients’ experience. We have also rolled out new self-service tools, including a client-facing “knowledge base” that addresses some of the more frequently asked questions and more complex product scenarios. With these changes, we have completely overhauled our support technology stack and our case handling processes, all with the goal of delivering a world-class client experience.
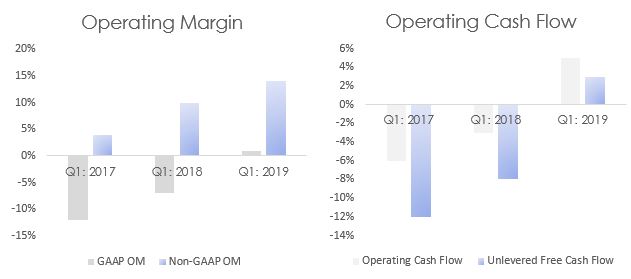
Improving Margins
Improving operating margins and unlevered free cash flow (uFCF) margins are important elements in our ongoing goal to create shareholder value.
Strengthening Our Team
In addition to bringing on Jonathan Epstein as Managing Director of Japan, we also expanded our finance leadership team with the hiring of Trish Coughlin as Vice President and Chief Accounting Officer and Jason Gold as Vice President of Finance and Corporate Development.
Jonathan comes to Cornerstone after a storied 20+ year career in Japan. His experience includes serving as Japan Country Manager at Credorax, Japan Country Manager at PayPal, Chief Product & Risk Officer at Asurion Japan, Vice President overseeing AIG’s businesses in both Japan and Korea, and Chief Financial Officer at the NASDAQ Japan. Jonathan was recruited to Japan in 1998 by SoftBank Group founder and Chief Executive Officer Masayoshi Son to serve as SoftBank’s Director of Strategy. Over the next four years he apprenticed under Masayoshi Son and led numerous investments on behalf of SoftBank.
In addition to handling her CAO duties, Trish will also lead our new Salt Lake City office. She has more than 25 years of experience in corporate finance, accounting, and operations across a broad range of industries. Prior to Cornerstone, Trish was the Corporate Controller at Workday, where she drove the scalability of the global accounting organization to support significant revenue growth and built a finance operations center in Salt Lake City. Prior to Workday, Trish was a managing director at Goldman Sachs where she held finance and operational leadership roles. Trish previously held roles at Honeywell where she was controller of a $4 billion business, and PricewaterhouseCoopers (PwC) where she provided services to multinational clients in the audit and transaction advisory practices.
Jason will be based in our Santa Monica office and his background involves spending nearly 20 years an institutional investor and most recently as an investor relations consultant to us and several other technology companies at Unity Investor Strategies. Prior to founding Unity, Jason held senior leadership positions at several investment firms starting in 1999. Jason began his investment research career as a research associate at Morgan Stanley and his area of focus has always been technology stocks. Jason received a B.S. in Commerce from The University of Virginia, where he graduated With Honors.
Financial Review
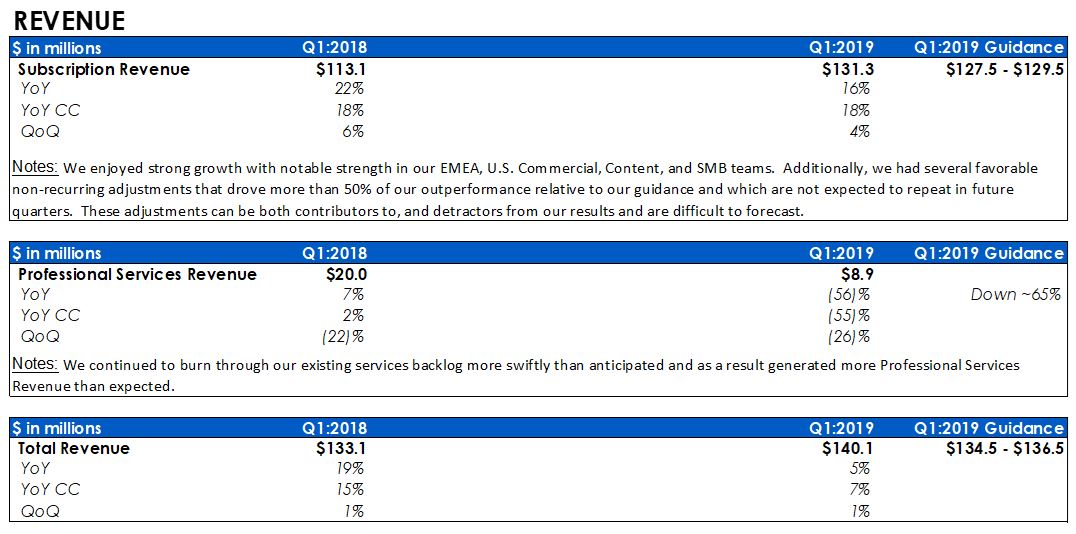
REVENUE
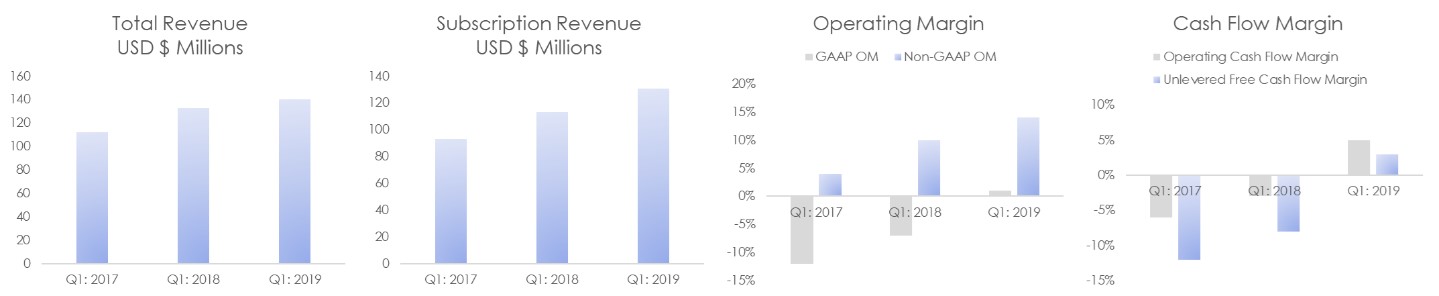
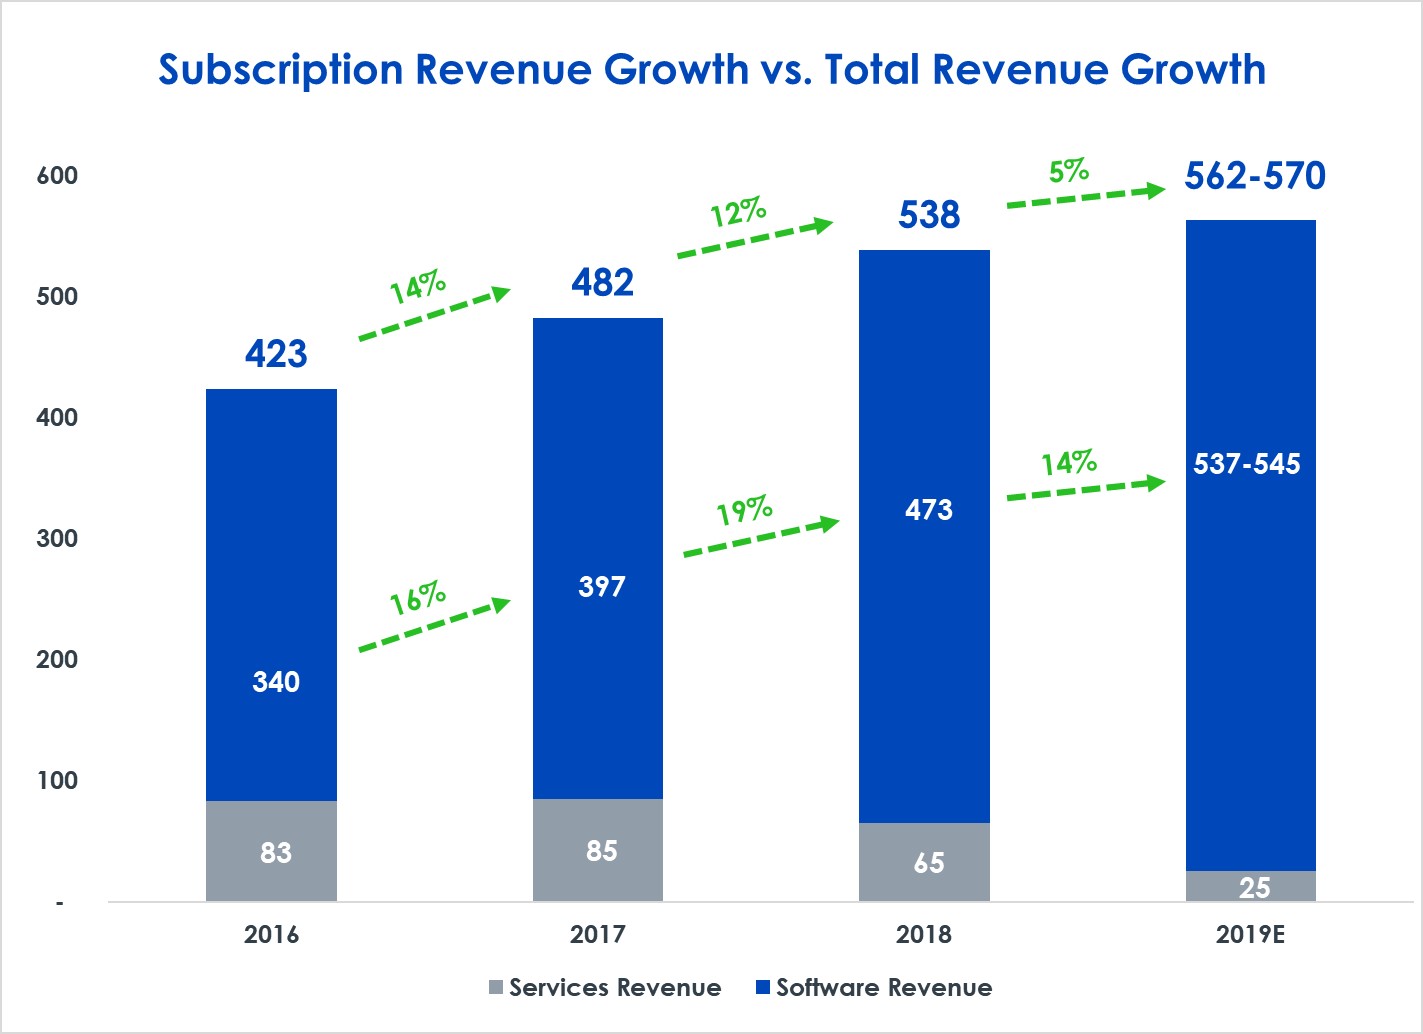
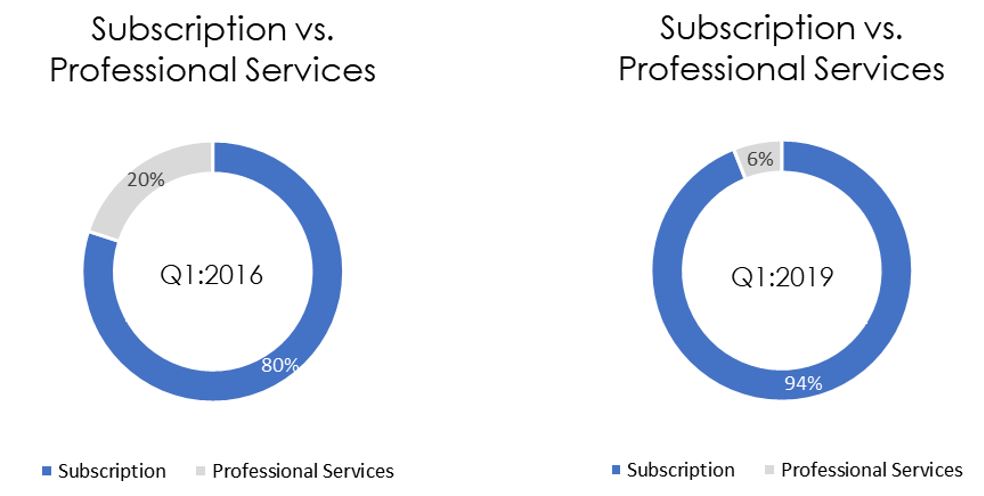
We continue to believe that properly evaluating our growth necessitates disaggregating our total revenue into its constituent parts - subscription revenue and professional service revenue - and analyzing those growth rates separately.
Our subscription revenue has shown a consistent, mid-teens growth rate. Our professional services revenue, on the other hand, has had a dampening effect on our total revenue growth since we began to intentionally exit the service delivery business in 2018. We believe that our professional services revenue has now approached a level that we think is sustainable, and as a result, our subscription revenue growth and total revenue growth should more closely align in 2020 and beyond. Going forward, we expect subscription revenue to be approximately 95% of our total revenue.
Financial Review: Q1 2019
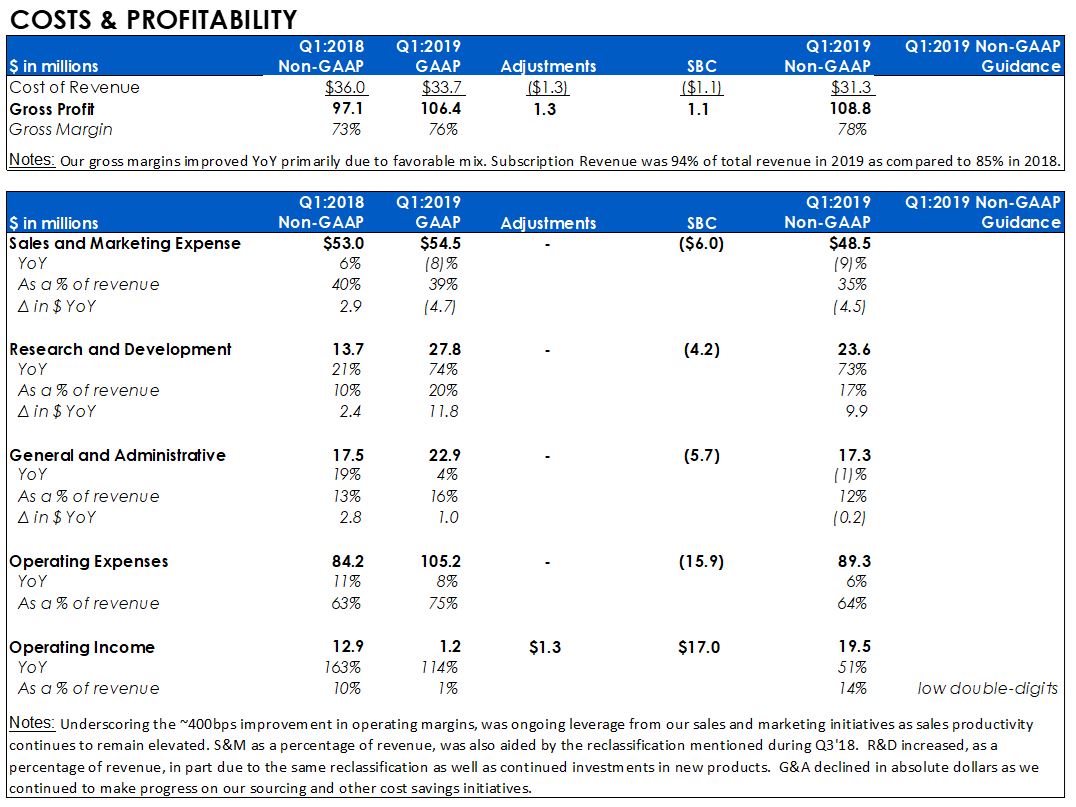 Note: a reconciliation between GAAP and non-GAAP operating expenses can be found in the tables at the end of this shareholder letter
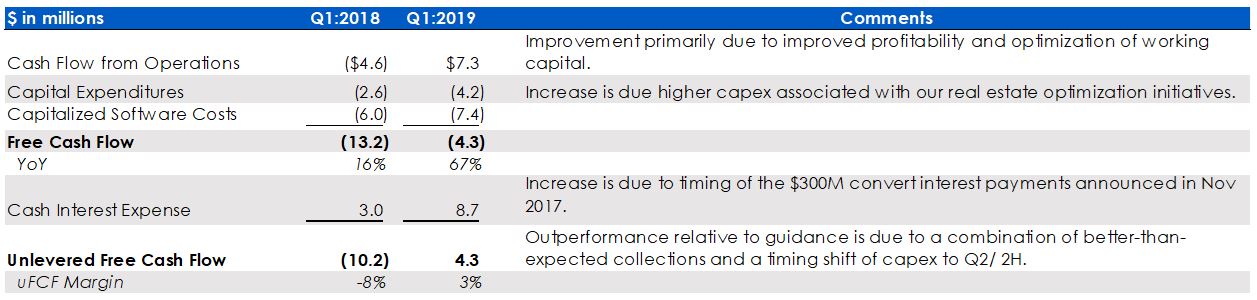
UNLEVERED FREE CASH FLOW
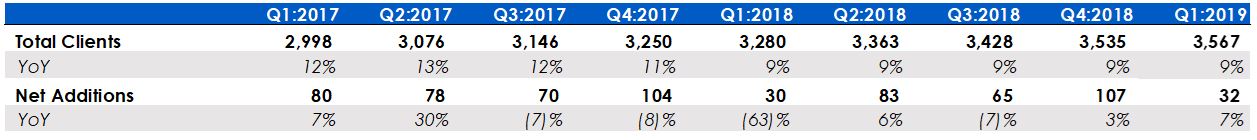
CLIENT BASE
The size of our client base increased to 3,567 at the end of the first quarter, representing 32 net new client additions during the quarter.
EMPLOYEE HEADCOUNT
We ended Q1 with 2,017 employees, representing a 3% increase from Q4 2018 and 10% increase year-over-year.
Financial Outlook
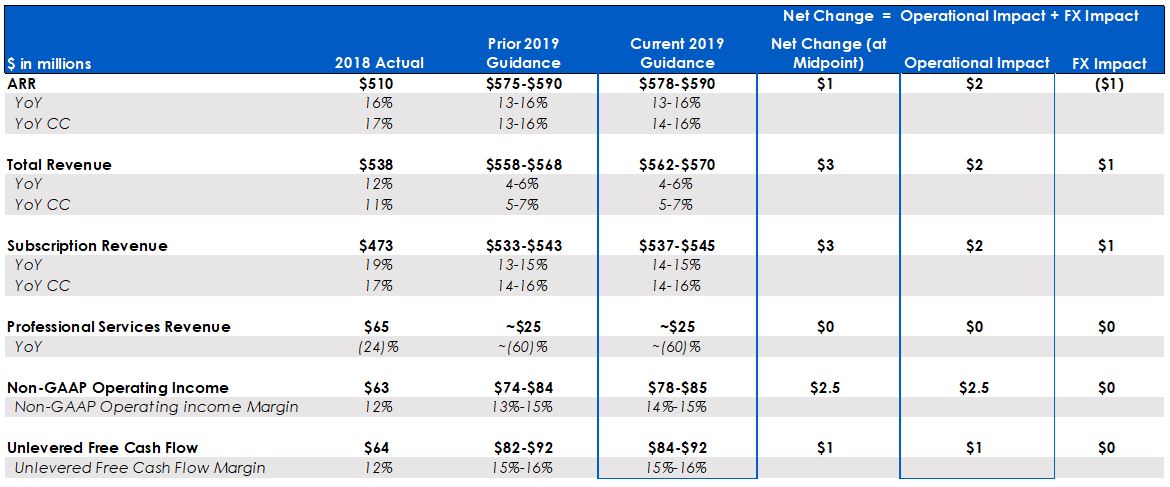
FULL YEAR GUIDANCE
As we discussed above, it’s important to highlight that our total revenue growth in 2019 will continue to be impacted by our intentional transition of our service delivery business to partners but our underlying subscription revenue growth is expected to continue to show strong growth.
Please note that non-GAAP financial measures should not be considered in isolation from, or as a substitute for, financial information prepared in accordance with GAAP. Investors are encouraged to review the reconciliation of these non-GAAP measures to their most directly comparable GAAP financial measures. These non-GAAP financial measures are not based on any standardized methodology prescribed by GAAP and are not necessarily comparable to similarly-titled measures presented by other companies. For prior periods, reconciliations of the non-GAAP financial measures to their most directly comparable GAAP measures have been provided in the tables included as part of this press release.
Our updated guidance for full year 2019 is as follows:
We have considered the ongoing macroeconomic and geopolitical events in developing our guidance. Given our favorable Q1 results, we are raising our full-year outlook for ARR, Subscription Revenue, Total Revenue, Operating Profit, and Unlevered Free Cash Flow according to the table above.
As we discussed on our prior call, we expect slightly elevated levels of capital expenditures in 2019 primarily due to optimizing our real estate footprint. These elevated levels of capital expenditures combined with the working capital headwinds related to our exiting our service delivery business reduces the spread between operating margins and unlevered free cash margins. We expect an improvement in this spread in 2020 and beyond when our capital expenditures are normalized and we fully transition the service delivery business.
Below are some other details about our full year guidance:
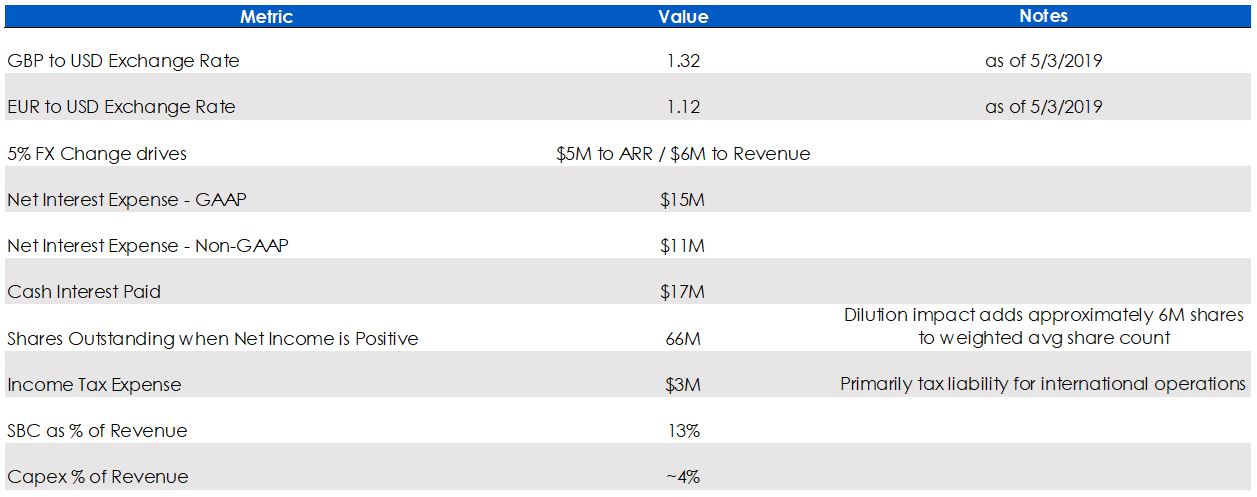 Note: Net Interest Expense - Non-GAAP is Net Interest Expense - GAAP, less Amortization of Debt Issuance Costs of $2.5 million and Accretion of Debt Discount of $1.7 million.
We continue to target achieving “The Rule of 40,” which we define as subscription revenue growth and unlevered free cash flow margin, in 2020 and expect to do that in a balanced manner.
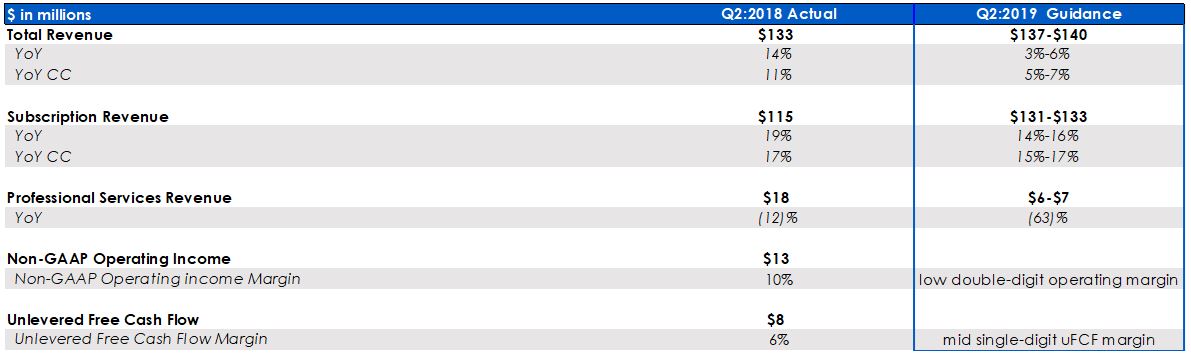
Q2 2019 GUIDANCE
Our guidance for the second quarter of 2019 is as follows:
Below are some other details about our Q2 guidance:
Note: Net Interest Expense - Non-GAAP is Net Interest Expense - GAAP, less Amortization of Debt Issuance Costs of $0.6 million and Accretion of Debt Discount of $0.4 million.
Q2 Calendar
We are hosting an investor/ analyst day on June 4th beginning at 12:30 pm PST at Convergence, our annual client conference in San Diego, California. The session will be broadcast live on our website and a transcript of the event will be posted shortly after the completion of the session. If you’d like to join us in-person for the event, please contact us via email at ir@csod.com.
We also plan to attend the following investor conferences during the second quarter:
May 9th: Jefferies Software Conference in Los Angeles
May 21st: Needham Emerging Technology Conference in New York
As a reminder, our quiet period typically begins two weeks prior to the end of our quarter, which during Q2 will be at the close of business on June 21st.
In Closing
We are devoted to earning the trust and respect of our clients, employees, and investors every day. The importance of our mission has never been stronger and we have an outstanding group of leaders helping to drive it each and every day. We are humbled and honored to work at a company with these great people and we will never lose sight of this.
Thank you for your support and for joining us on our journey to create shareholder value while empowering people to reach their full potential.
Respectfully yours,
Adam Miller Brian Swartz
Founder and Chief Executive Officer Chief Financial Officer
Forward-looking Statements
This shareholder letter contains forward-looking statements, including, but not limited to, statements regarding the expected performance of our business, our future financial and operating performance, including our GAAP and non-GAAP guidance, our strategy, long-term growth and overall future prospects, the demand for our offerings, our competitive position, our expectations regarding certain financial measures, including subscription revenue, capital expenditures and unlevered free cash flow, and general business conditions. Any forward-looking statements contained in this press release or the quarterly conference call are based upon our historical performance and our current plans, estimates and expectations and are not a representation that such plans, estimates, or expectations will be achieved. These forward-looking statements represent our expectations as of the date of this press release. Subsequent events may cause these expectations to change, and we disclaim any obligation to update the forward-looking statements in the future, except as required by law. These forward-looking statements are subject to known and unknown risks and uncertainties that may cause actual results to differ materially from our current expectations. Important factors that could cause actual results to differ materially from those anticipated in our forward-looking statements include, but are not limited to, our ability to attract new clients; the extent to which clients renew their subscriptions for our solutions; the timing of when consulting services are delivered to new and existing clients by our services organization and implementation subcontractors; the complexity of deployments and product implementations, which can impact the timing of when revenue is recognized from new and existing clients; our shift to focusing on recurring revenue streams; our ability to compete as the learning and human capital management provider for organizations of all sizes; changes in the proportion of our client base that is comprised of enterprise or mid-sized organizations; our ability to manage our growth, including additional headcount and entry into new geographies; our ability to expand our enterprise and mid-market sales opportunities; our ability to maintain stable and consistent quota attainment rates; continued strong demand for learning and human capital management in the Americas, Europe, and Asia Pacific; the timing and success of efforts to increase operational efficiency and cost containment; the timing and success of solutions offered by our competitors; unpredictable macro-economic conditions; the impact of foreign exchange rates; reductions in information technology spending; the success of our new product and service introductions; a disruption in our hosting network infrastructure; problems caused by security breaches; costs and reputational harm that could result from defects in our solutions; the success of our strategic relationships with third parties; the loss of any of our key employees and our ability to locate qualified replacements; failure to protect our intellectual property; acts of terrorism or other vandalism, war or natural disasters; changes in current tax or accounting rules; legal or political changes in local or foreign jurisdictions that decrease demand for, or restrict our ability to sell or provide, our products; and unanticipated costs or liabilities related to businesses that we acquire. Further information on factors that could cause actual results to differ materially from the results anticipated by our forward-looking statements is included in the reports we have filed with the Securities and Exchange Commission, including our Annual Report on Form 10-K for the fiscal year ended December 31, 2018.
Non-GAAP Financial Measures and Other Key Metrics
To supplement its consolidated financial statements, which are prepared and presented in accordance with U.S. generally accepted accounting principles, or GAAP, the Company has provided in this shareholder letter and the quarterly conference call held on the date hereof certain non-GAAP financial measures and other key metrics. These non-GAAP financial measures and other key metrics include:
| |
| (i) | non-GAAP cost of revenue, which is defined as cost of revenue less amortization of intangible assets and stock-based compensation, |
| |
| (ii) | annual recurring revenue, which is defined as the annualized recurring value of all active contracts at the end of a reporting period, |
| |
| (iii) | unlevered free cash flow, which is defined as net cash provided by operating activities minus capital expenditures and capitalized software costs plus cash paid for interest, |
| |
| (iv) | unlevered free cash flow margin, which is defined as unlevered free cash flow divided by revenue, |
| |
| (v) | non-GAAP net income and non-GAAP basic and diluted net income per share, which exclude, for the periods in which they are presented, stock-based compensation, amortization of intangible assets, accretion of debt discount and amortization of debt issuance costs, restructuring costs, acquisition costs and excludes the impacts of unamortized stock-based compensation expense in applying the treasury method for determining the non-GAAP weighted average number of dilutive shares outstanding, |
| |
| (vi) | non-GAAP gross profit and non-GAAP gross margin, which exclude stock-based compensation and amortization of intangible assets reflected in cost of revenue, |
| |
| (vii) | non-GAAP operating income and non-GAAP operating income margin, which exclude stock-based compensation, amortization of intangible assets, restructuring costs and acquisition costs, |
| |
| (viii) | non-GAAP operating expenses, which exclude stock-based compensation, amortization of intangible assets, restructuring costs and acquisition costs, and |
| |
| (ix) | non-GAAP sales and marketing expense, non-GAAP research and development expense, and non-GAAP general and administrative expense, each of which excludes stock-based compensation attributable to the corresponding GAAP financial measures. |
The Company’s management uses these non-GAAP financial measures and other key metrics internally in analyzing its financial results and believes they are useful to investors, as a supplement to the corresponding GAAP measures, in evaluating the Company’s ongoing operational performance and trends and in comparing its financial measures with other companies in the same industry, many of which present similar non-GAAP financial measures and other key metrics to help investors understand the operational performance of their businesses. In addition, the Company believes that the following non-GAAP adjustments are useful to management and investors for the following reasons:
| |
| • | Stock-based compensation. The Company excludes stock-based compensation expense because it is non-cash in nature, and management believes that its exclusion provides additional insight into the Company’s operational performance and also provides a useful comparison of the Company’s operating results to prior periods and its peer companies. Additionally, determining the fair value of certain stock-based awards involves a high degree of judgment and estimation and the expense recorded may bear little resemblance to the actual value realized upon the vesting or future exercise of such awards. |
| |
| • | Amortization of intangible assets. The Company excludes amortization of acquired intangible assets because the expense is a non-cash item and management believes that its exclusion provides meaningful supplemental information regarding the Company’s operational performance and allows for a useful comparison of its operating results to prior periods and its peer companies. |
| |
| • | Accretion of debt discount and amortization of debt issuance costs. For GAAP purposes, the Company is required to recognize the effective interest expense on its senior convertible notes and amortize the issuance costs over the term of the notes. The difference between the effective interest expense and the contractual interest expense and the amortization expense of issuance costs are excluded from management’s assessment of the Company’s operating performance because management believes that these non-cash expenses are not indicative of ongoing operating performance. In addition, the exclusion of these items provides a useful comparison of the Company’s operating results to prior periods and its peer companies. |
| |
| • | Restructuring. The Company excludes costs related to restructuring because the expense is not indicative of its continuing operations and believes that the exclusion of these costs provides investors with a supplemental view of the Company’s operational performance. |
| |
| • | Acquisition costs. The Company excludes costs related to acquisitions because the expense is not indicative of its continuing operations and believes that the exclusion of these costs provides investors with a supplemental view of the Company’s operational performance. |
Non-GAAP financial measures should not be considered in isolation from, or as a substitute for, financial information prepared in accordance with GAAP. Investors are encouraged to review the reconciliation of these non-GAAP measures to their most directly comparable GAAP financial measures. These non-GAAP financial measures are not based on any standardized methodology prescribed by GAAP and are not necessarily comparable to similarly-titled measures presented by other companies. For prior periods, reconciliations of the non-GAAP financial measures to their most directly comparable GAAP measures have been provided in the tables included as part of this press release.
Cornerstone OnDemand, Inc.
CONSOLIDATED BALANCE SHEETS
(in thousands)
(unaudited)
|
| | | | | | | |
| | March 31, 2019 | | December 31, 2018 |
| Assets | | | |
| Cash and cash equivalents | $ | 357,015 |
| | $ | 183,596 |
|
| Short-term investments | 34,950 |
| | 204,732 |
|
| Accounts receivable, net | 92,645 |
| | 125,300 |
|
| Deferred commissions, current | 16,013 |
| | 24,467 |
|
| Prepaid expenses and other current assets | 33,802 |
| | 34,940 |
|
| Total current assets | 534,425 |
| | 573,035 |
|
| | | | |
| Capitalized software development costs, net | 45,766 |
| | 45,416 |
|
| Property and equipment, net | 33,081 |
| | 77,254 |
|
| Operating right-of-use assets | 82,984 |
| | — |
|
| Deferred commissions, non-current | 58,755 |
| | 45,444 |
|
| Long-term investments | 750 |
| | 1,250 |
|
| Intangible assets, net | 12,581 |
| | 13,867 |
|
| Goodwill | 47,453 |
| | 47,453 |
|
| Other assets, net | 2,920 |
| | 3,437 |
|
| Total Assets | $ | 818,715 |
| | $ | 807,156 |
|
| | | | |
| Liabilities and Stockholders’ Equity | | | |
| Liabilities: | | | |
| Accounts payable | $ | 9,156 |
| | $ | 11,921 |
|
| Accrued expenses | 46,353 |
| | 68,331 |
|
| Deferred revenue, current | 290,993 |
| | 312,526 |
|
| Operating lease liabilities, current | 9,274 |
| | — |
|
| Other liabilities | 6,269 |
| | 7,645 |
|
| Total current liabilities | 362,045 |
| | 400,423 |
|
| | | | |
| Convertible notes, net | 289,994 |
| | 288,967 |
|
| Operating lease liabilities, non-current | 78,930 |
| | — |
|
| Other liabilities, non-current | 305 |
| | 2,484 |
|
| Deferred revenue, non-current | 11,876 |
| | 13,275 |
|
| Facility financing obligation | — |
| | 46,100 |
|
| Total liabilities | 743,150 |
| | 751,249 |
|
| | | | |
| Stockholders’ Equity: | | | |
| Common stock | 6 |
| | 6 |
|
| Additional paid-in capital | 608,168 |
| | 585,387 |
|
| Accumulated deficit | (533,426 | ) | | (529,962 | ) |
| Accumulated other comprehensive income | 817 |
| | 476 |
|
| Total stockholders’ equity | 75,565 |
| | 55,907 |
|
| Total Liabilities and Stockholders’ Equity | $ | 818,715 |
| | $ | 807,156 |
|
Cornerstone OnDemand, Inc.
CONSOLIDATED STATEMENTS OF OPERATIONS
(in thousands, except per share data)
(unaudited)
|
| | | | | | | |
| | Three Months Ended |
| | March 31, |
| | 2019 | | 2018 |
| Revenue | $ | 140,117 |
| | $ | 133,113 |
|
Cost of revenue 1, 2 | 33,695 |
| | 37,020 |
|
| Gross profit | 106,422 |
| | 96,093 |
|
| Operating expenses: | | | |
Sales and marketing 1 | 54,505 |
| | 59,245 |
|
Research and development 1 | 27,746 |
| | 15,984 |
|
General and administrative 1 | 22,940 |
| | 21,985 |
|
Restructuring 1 | — |
| | 7,725 |
|
| Total operating expenses | 105,191 |
| | 104,939 |
|
| Income (loss) from operations | 1,231 |
| | (8,846 | ) |
| Other income (expense): | | | |
| Interest income | 1,990 |
| | 1,819 |
|
| Interest expense | (5,366 | ) | | (8,700 | ) |
| Other, net | (597 | ) | | 44 |
|
| Other income (expense), net | (3,973 | ) | | (6,837 | ) |
| Loss before income tax provision | (2,742 | ) | | (15,683 | ) |
| Income tax provision | (722 | ) | | (533 | ) |
| Net loss | $ | (3,464 | ) | | $ | (16,216 | ) |
| Net loss per share, basic and diluted | $ | (0.06 | ) | | $ | (0.28 | ) |
| Weighted average common shares outstanding, basic and diluted | 59,141 |
| | 57,425 |
|
|
| | |
| 1 |
| Includes stock-based compensation as follows: |
|
| | | | | | | |
| | Three Months Ended |
| | March 31, |
| | 2019 | | 2018 |
| Cost of revenue | $ | 1,136 |
| | $ | 1,002 |
|
| Sales and marketing | 6,047 |
| | 6,246 |
|
| Research and development | 4,196 |
| | 2,308 |
|
| General and administrative | 5,666 |
| | 4,487 |
|
| Restructuring | — |
| | 5,436 |
|
| Total | $ | 17,045 |
| | $ | 19,479 |
|
|
| | |
| 2 |
| Cost of revenue includes amortization of intangible assets as follows: |
|
| | | | | | | |
| | Three Months Ended |
| | March 31, |
| | 2019 | | 2018 |
| Cost of revenue | $ | 1,286 |
| | $ | — |
|
Cornerstone OnDemand, Inc.
CONSOLIDATED STATEMENTS OF CASH FLOWS
(in thousands)
(unaudited)
|
| | | | | | | |
| | Three Months Ended |
| | March 31, |
| | 2019 | | 2018 |
| Cash flows from operating activities: | | | |
| Net loss | $ | (3,464 | ) | | $ | (16,216 | ) |
| Adjustments to reconcile net loss to net cash provided by operating activities: | | | |
| Depreciation and amortization | 10,858 |
| | 7,831 |
|
| Accretion of debt discount and amortization of debt issuance costs | 1,027 |
| | 3,426 |
|
| Purchased investment premium, net of amortization | (216 | ) | | (81 | ) |
| Net foreign currency (gain) loss | 294 |
| | (356 | ) |
| Stock-based compensation expense | 17,045 |
| | 19,479 |
|
| Changes in operating assets and liabilities: | | | |
| Accounts receivable | 32,955 |
| | 41,888 |
|
| Deferred commissions | (4,274 | ) | | (528 | ) |
| Prepaid expenses and other assets | 3,641 |
| | (8,841 | ) |
| Accounts payable | (2,781 | ) | | (7,605 | ) |
| Accrued expenses | (23,287 | ) | | (15,059 | ) |
| Deferred revenue | (23,959 | ) | | (23,751 | ) |
| Other liabilities | (545 | ) | | (4,767 | ) |
| Net cash provided by (used in) operating activities | $ | 7,294 |
| | $ | (4,580 | ) |
| Cash flows from investing activities: | | | |
| Maturities of investments | 170,679 |
| | 40,677 |
|
| Capital expenditures | (4,243 | ) | | (2,559 | ) |
| Capitalized software costs | (7,399 | ) | | (6,039 | ) |
| Net cash provided by investing activities | $ | 159,037 |
| | $ | 32,079 |
|
| Cash flows from financing activities: | | | |
| Proceeds from convertible notes and payments of debt issuance costs | — |
| | (152 | ) |
| Proceeds from employee stock plans | 6,840 |
| | 6,765 |
|
| Repurchases of common stock | — |
| | (14,700 | ) |
| Net cash provided by (used in) financing activities | $ | 6,840 |
| | $ | (8,087 | ) |
| Effect of exchange rate changes on cash and cash equivalents | 248 |
| | 357 |
|
| Net increase in cash and cash equivalents | 173,419 |
| | 19,769 |
|
| Cash and cash equivalents at beginning of period | 183,596 |
| | 393,576 |
|
| Cash and cash equivalents at end of period | $ | 357,015 |
| | $ | 413,345 |
|
| Supplemental cash flow information: | | | |
| Cash paid for interest | $ | 8,685 |
| | $ | 3,000 |
|
| Cash paid for income taxes | 390 |
| | 452 |
|
| Proceeds from employee stock plans received in advance of stock issuance | 1,856 |
| | 1,616 |
|
| Cash paid for operating leases | 2,601 |
| | — |
|
| Right-of-use assets obtained in exchange for lease obligations | 86,120 |
| | — |
|
| Non-cash investing and financing activities: | | | |
| Assets acquired under capital leases and other financing arrangements | $ | 485 |
| | $ | — |
|
| Capitalized assets financed by accounts payable and accrued expenses | 1,789 |
| | 5,201 |
|
| Capitalized stock-based compensation | 752 |
| | 1,253 |
|
| Unsettled share repurchase in other liabilities | — |
| | 1,325 |
|
Cornerstone OnDemand, Inc.
RECONCILIATIONS OF COST OF REVENUE TO NON-GAAP COST OF REVENUE, GROSS PROFIT AND GROSS MARGIN TO NON-GAAP GROSS PROFIT AND NON-GAAP GROSS MARGIN, LOSS FROM OPERATIONS TO NON-GAAP OPERATING INCOME AND OPERATING MARGIN TO NON-GAAP OPERATING INCOME MARGIN
(in thousands)
(unaudited)
|
| | | | | | | |
| | Three Months Ended |
| | March 31, |
| | 2019 | | 2018 |
| Reconciliation of cost of revenue, gross profit and gross margin: | | | |
| Revenue | $ | 140,117 |
| | $ | 133,113 |
|
| Cost of revenue | 33,695 |
| | 37,020 |
|
| Gross profit | $ | 106,422 |
| | $ | 96,093 |
|
| Gross margin | 76.0 | % | | 72.2 | % |
| | | | |
| Cost of revenue | $ | 33,695 |
| | $ | 37,020 |
|
| Adjustments to cost of revenue: | | | |
| Stock-based compensation | (1,136 | ) | | (1,002 | ) |
| Amortization of intangible assets | (1,286 | ) | | — |
|
| Total adjustments to cost of revenue | (2,422 | ) | | (1,002 | ) |
| Non-GAAP costs of revenue | 31,273 |
| | 36,018 |
|
| Non-GAAP gross profit | $ | 108,844 |
| | $ | 97,095 |
|
| Non-GAAP gross margin | 77.7 | % | | 72.9 | % |
| | | | |
| Reconciliation of operating loss and operating income margin: | | | |
| Loss from operations | $ | 1,231 |
| | $ | (8,846 | ) |
| Operating margin | 0.9 | % | | (6.6 | )% |
| Adjustments to loss from operations: | | | |
| Stock-based compensation | 17,045 |
| | 14,043 |
|
| Amortization of intangible assets | 1,286 |
| | — |
|
| Restructuring | — |
| | 7,725 |
|
| Total adjustments to income (loss) from operations | 18,331 |
| | 21,768 |
|
| Non-GAAP operating income | $ | 19,562 |
| | $ | 12,922 |
|
| Non-GAAP operating income margin | 14.0 | % | | 9.7 | % |
Cornerstone OnDemand, Inc.
RECONCILIATIONS OF NET LOSS TO NON-GAAP NET INCOME AND NON-GAAP NET INCOME PER SHARE
(in thousands, except per share amounts)
(unaudited)
|
| | | | | | | |
| | Three Months Ended |
| | March 31, |
| | 2019 | | 2018 |
| Net loss | $ | (3,464 | ) | | $ | (16,216 | ) |
| Adjustments to net loss | | | |
| Stock-based compensation | 17,045 |
| | 14,043 |
|
| Amortization of intangible assets | 1,286 |
| | — |
|
Accretion of debt discount and amortization of debt issuance costs1 | 1,026 |
| | 3,426 |
|
| Restructuring | — |
| | 7,725 |
|
| Total adjustments to net loss | 19,357 |
| | 25,194 |
|
| Non-GAAP net income | $ | 15,893 |
| | $ | 8,978 |
|
| Non-GAAP basic net income per share | $ | 0.27 |
| | $ | 0.16 |
|
| Non-GAAP diluted net income per share | $ | 0.25 |
| | $ | 0.14 |
|
| Weighted-average common shares outstanding, basic | 59,141 |
| | 57,425 |
|
| Non-GAAP weighted-average common shares outstanding, diluted | 64,750 |
| | 62,476 |
|
|
| | |
| 1 |
| Debt discount accretion and debt issuance cost amortization has been recorded in connection with our issuance of $253.0 million in convertible notes on June 17, 2013 and $300.0 million in convertible notes on December 8, 2017. These expenses represent non-cash charges that have been recorded in accordance with the authoritative accounting literature for such transactions. |
Cornerstone OnDemand, Inc.
RECONCILIATION OF NET CASH PROVIDED BY (USED IN) OPERATING ACTIVITIES TO UNLEVERED FREE CASH FLOW AND UNLEVERED FREE CASH FLOW MARGIN
(A Non-GAAP Financial Measure)
(in thousands)
(unaudited)
|
| | | | | | | |
| | Three Months Ended |
| | March 31, |
| | 2019 | | 2018 |
| Reconciliation of unlevered free cash flow: |
| |
|
| Net cash provided by (used in) operating activities | $ | 7,294 |
| | $ | (4,580 | ) |
| Capital expenditures | (4,243 | ) | | (2,559 | ) |
| Capitalized software costs | (7,399 | ) | | (6,039 | ) |
| Cash paid for interest | 8,685 |
| | 3,000 |
|
| Unlevered free cash flow | $ | 4,337 |
| | $ | (10,178 | ) |
| Unlevered free cash flow margin | 3.1 | % | | (7.6 | )% |
Cornerstone OnDemand, Inc.
TRENDED OPERATIONAL & FINANCIAL HIGHLIGHTS
(unaudited)
The following metrics are intended as a supplement to the financial statements found in this press release and other information furnished or filed with the SEC. In the event of discrepancies between amounts in these tables and the Company’s historical disclosures or financial statements, readers should rely on the Company’s filings with the SEC and financial statements in the Company’s most recent earnings press release.
The Company intends to periodically review and refine the definition, methodology and appropriateness of each of these supplemental metrics. As a result, metrics are subject to removal and/or change, and such changes could be material.
|
| | | | | | | | | | | | | | | | | | |
| | FY 2018 | | FY 2019 | | Full Year |
| | Q1'18 | Q2'18 | Q3'18 | Q4'18 | | Q1'19 | | FY16 | FY17 | FY18 |
| SELECTED METRICS: | | | | | | | | | | |
Number of clients 1 | 3,280 |
| 3,363 |
| 3,428 |
| 3,535 |
| | 3,567 |
| | 2,918 |
| 3,250 |
| 3,535 |
|
| % y/y | 9.4 | % | 9.3 | % | 9.0 | % | 8.8 | % | | 8.8 | % | | 12.4 | % | 11.4 | % | 8.8 | % |
| % q/q | 0.9 | % | 2.5 | % | 1.9 | % | 3.1 | % | | 0.9 | % | | n/a |
| n/a |
| n/a |
|
| Number of employees | 1,829 |
| 1,851 |
| 1,892 |
| 1,953 |
| | 2,017 |
| | 1,823 |
| 1,891 |
| 1,953 |
|
| % y/y | (1.6 | )% | (4.2 | )% | (3.5 | )% | 3.3 | % | | 10.3 | % | | 10.8 | % | 3.7 | % | 3.3 | % |
| % q/q | (3.3 | )% | 1.2 | % | 2.2 | % | 3.2 | % | | 3.3 | % | | n/a |
| n/a |
| n/a |
|
| Annual dollar retention rate | n/a |
| n/a |
| n/a |
| n/a |
| | n/a |
| | 95.1 | % | 93.5 | % | 92.8 | % |
| Annual recurring revenue (in thousands) | n/a |
| n/a |
| n/a |
| n/a |
| | n/a |
| | n/a |
| 439,000 |
| 510,000 |
|
| Unlevered free cash flow (in thousands) | (10,178 | ) | 7,900 |
| 32,067 |
| 33,681 |
| | 4.337 |
| | 16,411 |
| 43,680 |
| 63,471 |
|
| Unlevered free cash flow margin | (7.6 | )% | 6.0 | % | 23.9 | % | 24.4 | % | | 3.1 | % | | 3.9 | % | 9.1 | % | 11.8 | % |
| FINANCIAL DATA - ASC 606 (in thousands, except percentages): | | | | | | | | | | |
| Revenue | 133,113 |
| 132,517 |
| 134,014 |
| 138,247 |
| | 140,117 |
| | — |
| — |
| 537,891 |
|
| Subscription revenue | 113,134 |
| 114,771 |
| 118,844 |
| 126,303 |
| | 131,256 |
| | — |
| — |
| 473,052 |
|
| Subscription revenue % of total revenue | 85.0 | % | 86.6 | % | 88.7 | % | 91.4 | % | | 93.7 | % | | — |
| — |
| 87.9 | % |
| (Loss) income from operations | (8,846 | ) | (3,095 | ) | 1,574 |
| 2,598 |
| | 1,231 |
| | — |
| — |
| (7,769 | ) |
| MARGIN DATA - ASC 606: | | | | | | | | | | |
| Gross margin | 72.2 | % | 72.6 | % | 73.0 | % | 74.8 | % | �� | 76.0 | % | | — |
| — |
| 73.2 | % |
| Sales and marketing % of revenue | 44.5 | % | 45.1 | % | 39.7 | % | 37.9 | % | | 38.9 | % | | — |
| — |
| 41.8 | % |
| Research and development % of revenue | 12.0 | % | 12.3 | % | 14.7 | % | 18.1 | % | | 19.8 | % | | — |
| — |
| 14.3 | % |
| General and administrative % of revenue | 16.5 | % | 16.7 | % | 17.3 | % | 17.0 | % | | 16.4 | % | | — |
| — |
| 16.9 | % |
| Restructuring % of revenue | 5.8 | % | 0.8 | % | 0.2 | % | — | % | | — | % | | — |
| — |
| 1.7 | % |
| Operating margin | (6.6 | )% | (2.3 | )% | 1.2 | % | 1.9 | % | | 0.9 | % | | — |
| — |
| (1.4 | )% |
| NON-GAAP MARGIN DATA - ASC 606: | | | | | | | | | | |
| Non-GAAP gross margin | 72.9 | % | 73.3 | % | 74.0 | % | 76.1 | % | | 77.7 | % | | — |
| — |
| 74.1 | % |
| Non-GAAP sales and marketing % of revenue | 39.8 | % | 40.2 | % | 35.3 | % | 33.7 | % | | 34.6 | % | | — |
| — |
| 37.2 | % |
| Non-GAAP research and development % of revenue | 10.3 | % | 10.5 | % | 12.3 | % | 15.3 | % | | 16.8 | % | | — |
| — |
| 12.1 | % |
| Non-GAAP general and administrative % of revenue | 13.1 | % | 12.7 | % | 13.1 | % | 13.0 | % | | 12.3 | % | | — |
| — |
| 13.0 | % |
| Non-GAAP operating margin | 9.7 | % | 10.0 | % | 13.3 | % | 14.1 | % | | 14.0 | % | | — |
| — |
| 11.8 | % |
| Non-GAAP research and development plus capitalized software % of revenue | 14.8 | % | 15.2 | % | 17.3 | % | 20.0 | % | | 22.1 | % | | — |
| — |
| 19.1 | % |
| FOREIGN EXCHANGE RATES: | | | | | | | | | | |
| GBP to USD average period rate | 1.39 |
| 1.36 |
| 1.30 |
| 1.29 |
| | 1.30 |
| | 1.36 |
| 1.29 |
| 1.34 |
|
| GBP to USD end of period spot rate | 1.40 |
| 1.32 |
| 1.30 |
| 1.27 |
| | 1.30 |
| | 1.23 |
| 1.35 |
| 1.27 |
|
| EUR to USD average period rate | 1.23 |
| 1.19 |
| 1.16 |
| 1.14 |
| | 1.14 |
| | n/a |
| 1.14 |
| 1.18 |
|
| EUR to USD end of period spot rate | 1.23 |
| 1.17 |
| 1.16 |
| 1.14 |
| | 1.12 |
| | n/a |
| 1.20 |
| 1.14 |
|
|
| |
1 | Includes contracted clients of our enterprise human capital management platform and excludes clients and users of Cornerstone for Salesforce, PiiQ, Workpop Inc. and Grovo Learning, Inc.
|