August 5, 2019
Dear Fellow Shareholders,
The skills divide is real. The skills companies require today - and will need tomorrow - are shifting ever further from the skills their employees currently have, creating profound implications for the futures of both these companies and their employees. As a global leader in learning and talent management, we believe we are extremely well-positioned to help organizations of all sizes address the skills divide.
Think about how prevalent things like AI, machine learning, and cloud computing have become in today’s world and compare that to the number of workers that possess the requisite skills in these areas. Coupled with a historically tight labor market, the impact of digitization on the skills divide is causing companies around the globe to undertake significant retraining programs to reskill their workers. Our leading market position puts us in a prime position to capitalize on this multi-year macro trend.
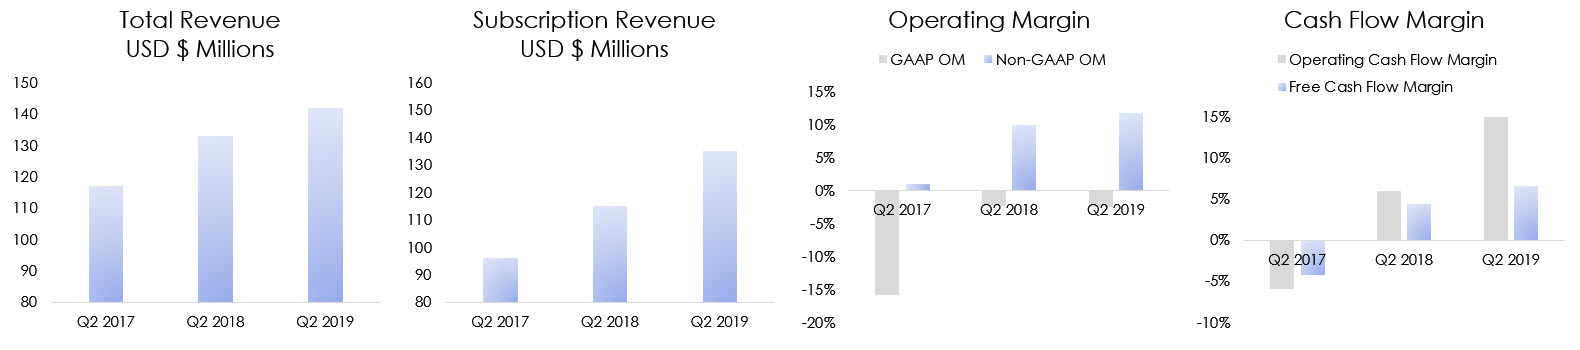
The positive momentum we demonstrated in 2018 has continued in the first half of 2019, and Q2 2019 marked the best second quarter for new sales in the company's history. Once again, we experienced strength in our core learning and content offerings during the quarter, and we believe these products will continue to enjoy healthy growth in the coming quarters and years ahead. Due to the combination of our continued momentum and the efficiency initiatives currently underway, we are now increasingly confident that we will achieve the Rule of 40 in 2020, which we discuss in greater detail below.
Note: a reconciliation of non-GAAP financial measures used in this shareholder letter to their nearest GAAP equivalents is provided at the end of this letter. Free Cash Flow Margin includes cash interest, which amounted to $2m in Q2 2018 and $0m for Q2 2017 and Q2 2019.
Over the past decade, we have developed a leadership position in talent management and are widely recognized as the worldwide market leader in corporate learning. In the past twelve months, over 550 million online course registrations and over 350 million online course completions occurred on the Cornerstone platform.
The sense of urgency from our clients to reskill and redeploy their workers is demonstrated in the scale of these activities. This scale provides us with an enormous amount of data which can be leveraged by our machine learning platform, and during the second quarter we continued to make meaningful investments in our machine learning systems. These investments drive the personalization engine that supports our content business by dynamically delivering the most relevant and popular courses to our users. As we've pointed out in prior quarters, we believe that the scale of our data, machine learning, and content aggregation capabilities are creating a wide and deep moat that we expect will protect and strengthen our competitive position and growth opportunities for years to come.
Q2 2019 Highlights
Driven by continued benefits from our ongoing sales productivity initiatives and a focus on content, Q2 2019 was another strong quarter, making 1H 2019 the best first half of the year for new sales in company history. The success of this first half was shared across all global regions.
In the Americas, the U.S. Commercial team closed the first six months of 2019 well ahead of 2018's first half, which at the time, was the best first half in the company's history by a wide margin. Public Sector closed its second largest deal ever and the Client Sales teams, which sell into our installed base, performed well across all segments. During the quarter, the U.S. Enterprise business returned to strength, where we closed several large deals. Enterprise sales drove average deal price during the quarter to their highest level in history and bolsters our confidence that the team is on its way back to being one of our key contributors.
Building on the momentum from Q1, EMEA also had its best first half in company history.
In Q2 2019, the strength of our global Content business was demonstrated by our first multimillion-dollar Content Anytime deal. Not surprisingly, Content has been an influential contributor to the solid improvement we've seen in our deal sizes.
New Client Additions & Upsells
During the second quarter of 2019, amongst many others, our new client wins and existing client upsells and renewals included:
|
| |
| The U.S. Postal Service is a self-supporting, independent federal agency, and is the only delivery service that reaches every address in the nation: 155 million residences, businesses and P.O. boxes. In 2018, USPS acquired our Learning Suite to provide training to over 600,000 employees. In June 2019, we signed a contract for our Performance Suite to facilitate the self-management of their work teams.
|
|
| |
| CBRE Group Inc. is a Fortune 500 company and the world's largest commercial real estate services and investment firm. CBRE employs over 90,000 people in 480 offices in over 100 countries. Cornerstone won against the competition due to our world-class talent management system that is expected to give CBRE the ability to better view their talent, better develop their talent, create better retention of their talent, and ultimately provide better promotion of their talent from within their firm by using our Learning and Performance suites.
|
|
| |
|
Lockton Companies Inc. is the world's largest privately-held insurance brokerage firm, providing insurance, risk management, employee benefits and retirement services. Lockton selected Cornerstone's Learning and Performance suites as they align with management's desire to grow and nurture its 7,000 employees and uphold its reputation for high-quality client services.
|
Our Approach to Driving Long-term Shareholder Value
As the relentless pace of technological change continues to impact every industry and ultimately every job, there's a growing need for continuous training and development to stay competitive-both for the organization and for the individual employee. As a global leader in corporate learning, we believe that we are poised for a period of strong, sustainable growth and our mission, strategy, and execution will continue to drive positive results.
We operate in two large global markets: human capital management (HCM) and corporate learning, which together represent a $40 billion Source: Training Industry Report (2017); Company estimates and WW HCM Apps Forecast, IDC WW Tracker, June 2018 Report opportunity. With our leading position in these markets, we believe we are well-situated to leverage the tailwind created by the rising need for lifelong learning.
At the same time, we consistently seek to drive efficiency in our business. As we have discussed in the past, we believe there are many opportunities for us to drive margin improvement through operational excellence.
As a management team, we believe we can maximize shareholder value by simultaneously improving margins and growing the business. This requires careful analysis of the various opportunities available to us and the costs associated with capturing those opportunities, enabling us to drive a balance between growth and profitability in a sustainable fashion.
Below we highlight some examples of our ability to grow our margins without unduly impacting our growth opportunities.
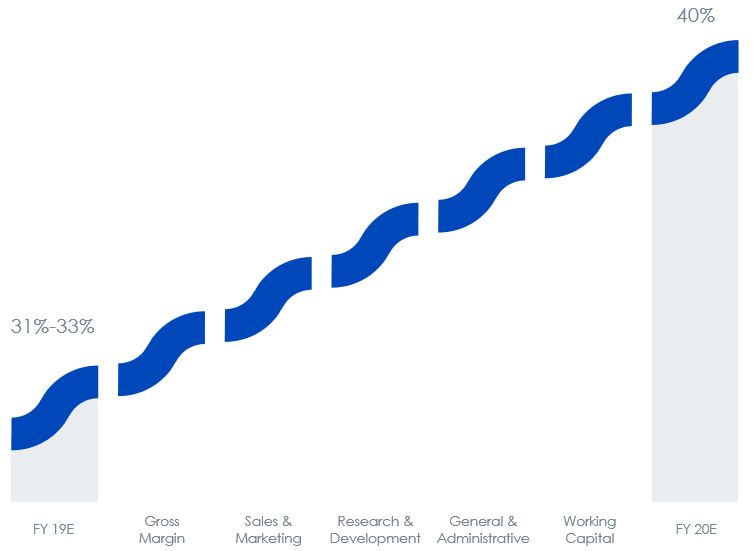
ACHIEVING THE RULE OF 40
Establishing trust and transparency with our stakeholders is of paramount importance, and to that end, we have been spending time with investors over the last 18 months discussing our aspiration to achieve the Rule of 40, which we define as the sum of constant currency subscription revenue growth and unlevered free cash flow margin. While there are risks and uncertainties in any prediction, we are increasingly confident in our ability to achieve this target, and we no longer consider it an aspiration, but rather our expectation for 2020.
We view our achievement of the Rule of 40 in 2020 as an important demonstration of our ability and willingness to instill financial discipline to create a long-term efficient business model while also taking advantage of the growth opportunities available to us. Our Rule of 40 model predicts that in 2020, unlevered free cash
flow margins will be a somewhat larger contributor to this metric than constant-currency subscription revenue growth.
Our commitment to driving long-term shareholder value doesn’t end with delivering the Rule of 40. Rather, we plan to continue our journey to achieve a balanced mix of growth and profitability and expect the decisions and trade-offs we make will continue to drive shareholder value over the long term.
We see clear opportunities to drive margin improvement over the next 18 months and beyond. As we operationalize several efficiency projects, we wanted to share a few of the key elements in our plan to achieve the Rule of 40.
1) IMPROVING PRODUCTIVITY AND EFFICIENCY IN PRODUCT DEVELOPMENT
In past quarters, we've talked about the considerable data advantage we believe we have from our massive reach, particularly in the learning space. Since the start of the year, we took steps to leverage that data with meaningful product analytics investments to generate billions of anonymized data points related to how our customers are using our products. The insights developed from these datapoints are enabling us to drive operating leverage as we reallocate our development dollars away from underutilized product functionality towards areas where customers are engaging the most on our platform. These investments are also driving efficiencies in our new product and feature development processes.
To best utilize these new measurement capabilities, we've also advanced how we deploy software in a way that allows us to deploy new releases more frequently to customers. This shortened feedback loop is sometimes referred to as CI/CD, or “continuous integration, continuous deployment” and is a method to frequently deliver apps to customers by introducing automation into the stages of app development. We’re leveraging CI/CD to highlight successful features faster while better leveraging our existing resources.
We've also invested in tools to drive increased productivity from our existing development resources. As an example, we've recently built exhaustive front-end libraries of frequently used components to expedite their reuse in the development of our products and features. Another example is our success in increasing automated testing which has nearly eliminated manual QA testing.
We believe the efficiencies we gain in these areas can be meaningful contributors towards margin expansion over time while simultaneously increasing our pace of innovation.
2) DRIVING EFFICIENCY IN OUR CLIENT SUCCESS ORGANIZATION
Last year we transitioned the bulk of our professional services delivery business to our partner ecosystem. As part of that process, we introduced new roles in our Client Success organization to ensure that partners were effectively delivering for our clients.
A year later, with many successful partner-led implementations completed, we are now able to further optimize our partner oversight process, regarding both our service delivery advisory work and our delivery assurance work. Moving forward, we are more efficiently tailoring our services to provide the optimum level of oversight based on the relative risk of each project. Client scale, project complexity and partner experience will be the primary factors reviewed to ensure proper assignment of resources.
This approach simultaneously optimizes resource allocation for individual client implementations and lowers our aggregate costs in this area.
3) STREAMLINING PARTNER OPERATIONS
During 2018, in order to enable our Cornerstone 2.0 model, we made significant investments to grow and support our global partner ecosystem. We were intentionally conservative to ensure we had the right partners in our ecosystem, which is now the case. During Q2 2019, we undertook a best-practices evaluation and are now making several enhancements to streamline our Partner Operating Model, which we believe will result in deeper and more effective partner relationships.
We are streamlining our Alliances organization and establishing single points of contact for each partner. With the establishment of a Global Partner Operations Center of Excellence function, we further expect to strengthen our relationships with our existing partners, therefore driving efficiencies in our back-office operations.
Multiple Levers for Achieving the Rule of 40
Note: Illustrative of one potential scenario. Not drawn to scale.
Continuing to Innovate
We continue to meaningfully enhance our product suites, and in the second quarter we released several new features.
For our Learning Suite, we continue to develop the Learn Anywhere concept, which provides flexibility to manage where and when learners engage in content, including offline learning capabilities. Within the Cornerstone Learn App, learners can now complete courses anywhere, whether they have an Internet connection or not.
Similarly, Cornerstone for Salesforce clients can now allow learners to leverage content within their everyday workflow by seamlessly surfacing our Learner Home interface in Salesforce. This feature surfaces content directly in Salesforce, enabling users to learn without leaving their primary system of sales productivity. With this feature, training becomes available when it's most valuable, and content can be distributed to a wider audience through Salesforce communities.
Within our Performance Suite, we launched Cornerstone Conversations, which supports the concept of agile performance management and provides employees with just-in-time feedback. This addresses the issues inherent in typical once-a-year performance appraisals, including recency effect, which biases recent performance; the fact that they’re backward-looking; and the lack of real-time alignment between managers and employees. Conversations drives alignment, coaching, and continuous performance development with a meeting facilitation tool to drive frequent and effective conversations between management and teams.
In addition, we added flexibility in configuring and reporting on performance reviews, competencies, and observations checklists, as well as deepened some of our industry-specific capabilities.
Strengthening Our Team
During Q2 2019, we announced that Heidi Spirgi joined Cornerstone as the company’s Chief Marketing and Strategy Officer and reports directly to Adam Miller.
Heidi joined Cornerstone with more than 20 years of experience helping organizations unleash the power of their workforce by reimagining their approach to talent and leveraging technology to drive innovation, productivity and engagement. She is widely respected within the HR technology industry for her deep knowledge of the talent management ecosystem, her recognition of new and emerging technologies, and her ability to strategically advise Chief Human Resources Officers at some of the world’s largest organizations. Over the course of her career, Heidi has worked with over 50 Fortune 500 companies, helping them build their digital talent strategies based on innovative workplace practices and technologies.
Heidi brings deep relationships with the HCM analyst and influencer community having known and worked with many of them over the course of the past two decades. She brings a unique combination of market, product and services experience and is known for driving innovation into the market. At Cornerstone, Heidi will employ her vast industry expertise to lead the company’s global marketing functions and will drive strategy and innovation for the business. Heidi will help define the vision for the next generation of Cornerstone’s solutions focused on talent experience, creating value for both employees and managers.
Prior to Cornerstone, Heidi served as Senior Vice President of Product and Services for The Marcus Buckingham Company, a talent experience company acquired by ADP, where she was responsible for the direction, strategy and deployment of the company’s technology products. Before that, Heidi co-founded her own strategic HCM management consulting firm, Knowledge Infusion, which supported HR transformations at
many leading global brands. Knowledge Infusion was acquired by Appirio in 2012, and Heidi joined Appirio as the Senior Vice President of HCM and Strategy. Earlier in her career, Heidi spent seven years at PeopleSoft, Inc., and held positions at Seagate Technology and Swiss Bank Corporation.
As a prominent voice in the HCM industry, Heidi regularly shares her expertise with media and analysts, and has been invited to speak at top industry events like UNLEASH (formerly HR Tech World), the HR Technology Conference and various talent management symposiums and conferences worldwide.
Financial Review
REVENUE
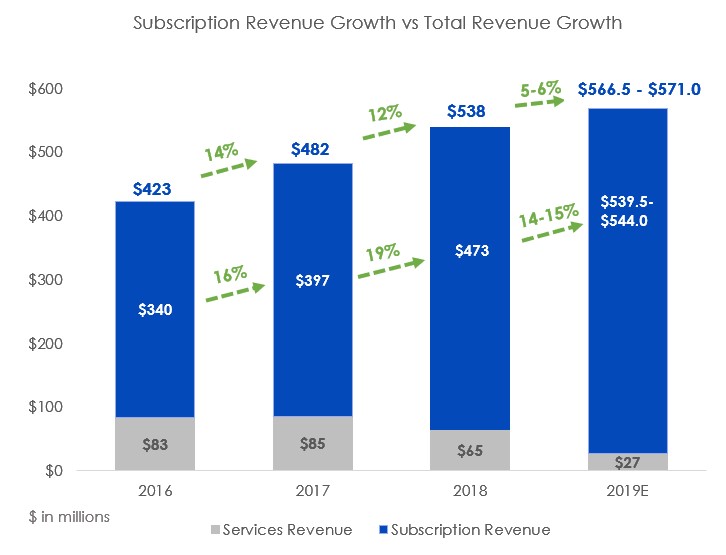
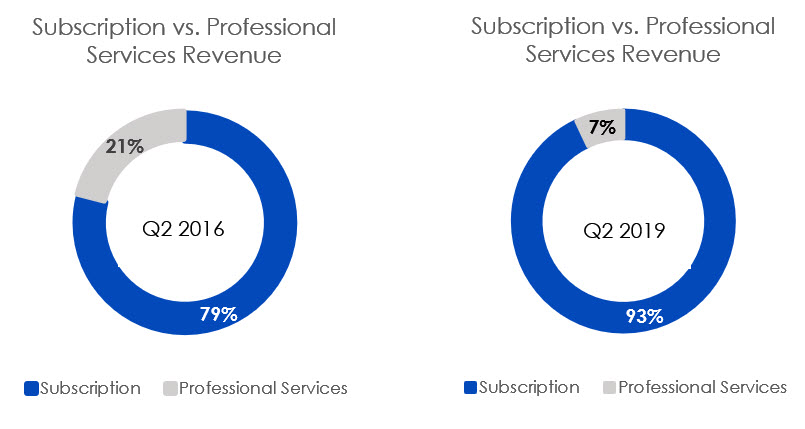
As we have said numerous times throughout our recent transformation, we believe that properly evaluating our growth during this time necessitates disaggregating our total revenue into its constituent parts - subscription revenue and professional service revenue - and analyzing those growth rates separately.
Our subscription revenue has shown a consistent, mid-teens growth rate. Our professional services revenue on the other hand, has had a dampening effect on our total revenue growth since we began to intentionally exit the service delivery business in 2018. Starting with the levels we achieved during Q1, we now believe that our professional services revenue has approached a level that we think is sustainable, and as a result, our subscription revenue growth and total revenue growth should more closely align as we approach 2020 and beyond. Going forward, we expect subscription revenue to be approximately 95% of our total revenue.
Financial Review: Q2 2019
REVENUE |
| | | | | | | |
| $ in millions | Q2:2018 |
| | Q2:2019 |
| Q2:2019 Guidance |
| Subscription Revenue | $114.8 | | $132.6 | $131.0 - $133.0 |
| YoY | 19 | % | | 16 | % |
| YoY CC | 17 | % | | 17 | % |
| QoQ | 1 | % | | 1 | % |
| |
| Notes: We enjoyed strong growth with notable strength in our U.S. Commercial, Public Sector, and Content teams. Subscription revenue was in-line with the high end of our guidance. Absent the effect of currency changes since we gave Q2 guidance, our revenue would have been about $0.5M higher, slightly above the high end of the guidance. |
|
| | | | | | | | |
| $ in millions | Q2:2018 |
| | Q2:2019 |
| Q2:2019 Guidance |
| Professional Services Revenue | $17.7 | | $9.3 | |
| YoY | (12 | )% | | (48 | )% | Down ~60% |
| QoQ | (11 | )% | | 5 | % | |
| |
| Notes: We continued to burn through our existing services backlog more swiftly than anticipated, and we had strong attendance at our Convergence event this year. As a result, we generated more Professional Services Revenue than we expected. |
|
| | | | | | | | |
| $ in millions | Q2:2018 |
| | Q2:2019 |
| Q2:2019 Guidance |
| Total Revenue | $132.5 | | $141.9 | $137.0 - $140.0 |
| YoY | 14 | % | | 7 | % | |
| YoY CC | 11 | % | | 9 | % | |
| QoQ | — | % | | 1 | % | |
COSTS & PROFITABILITY |
| | | | | | | | | |
| $ in millions | Q2:2018 Non-GAAP |
| Q2:2019 GAAP | Adjustments | SBC | Q2:2019 Non-GAAP |
| Q2:2019 Non-GAAP Guidance |
| Cost of Revenue | $35.3 | $40.2 | ($1.0) | ($1.8) | $37.4 | |
| Gross Profit | $97.2 | $101.7 | $1.0 | $1.8 | $104.5 | |
| Gross Margin | 73.3 | % | 71.7 | % | | | 73.7 | % | |
| |
| Notes: Gross margins improved by 40 bps year-over-year largely due to our subscription revenue representing a larger share of our total revenue. |
|
| | | | | | | | | | |
| $ in millions | Q2:2018 Non-GAAP |
| Q2:2019 GAAP | Adjustments | SBC | Q2:2019 Non-GAAP |
| Q2:2019 Non-GAAP Guidance |
| Sales and Marketing Expense | $53.3 | $58.7 | $0.0 | ($6.8) | $51.9 | |
| YoY | (4 | )% | (2 | )% | | | (3 | )% | |
| As a % of revenue | 40.2 | % | 41.4 | % | | | 36.6 | % | |
| Δ in $ YoY | ($2.0) | ($1.1) | | | $ | (1.4 | ) | |
| Research and Development | $13.9 | $24.3 | $0.0 | ($4.3) | $ | 20.0 |
| |
| YoY | 13 | % | 49 | % | | | 44 | % | |
| As a % of revenue | 10.5 | % | 17.2 | % | | | 14.1 | % | |
| Δ in $ YoY | $1.6 | $8.0 | | | $ | 6.1 |
| |
| General and Administrative | $16.8 | $22.2 | $0.0 | ($6.2) | $ | 16.0 |
| |
| YoY | 5 | % | 1 | % | | | (5 | )% | |
| As a % of revenue | 12.7 | % | 15.7 | % | | | 11.3 | % | |
| Δ in $ YoY | $0.9 | $0.1 | | | $ | (0.8 | ) | |
| | | | | | | |
| Operating Expenses | $84.0 | $105.3 | $0.0 | ($17.4) | 87.9 |
| |
| YoY | 1 | % | 7 | % | | | 5 | % | |
| As a % of revenue | 63.4 | % | 74.2 | % | | | 62.0 | % | |
| | | | | | | |
| Operating Income | $13.2 | ($3.6) | $1.0 | $19.2 | 16.6 |
| |
| YoY | 958 | % | 16 | % | | | 26 | % | |
| As a % of revenue | 10.0 | % | (2.5 | )% | | | 11.7 | % | low double-digits |
| | | | | | | |
| Notes: There were a few timing-related operating expense items that fell into Q2 that we’d previously budgeted to come in during the second-half of our fiscal year. S&M benefited from the Q3 2018 reclassification of expenses from S&M to R&D by approximately 150bps, as a percentage of revenue, as well as continued improved sales productivity. R&D increased as a percentage of revenue, largely due to the Q3 2018 reclassification and continued investment in the development of our product. G&A declined as a percentage of revenue, as our operational and sourcing initiatives yielded additional efficiencies. |
Note: a reconciliation between GAAP and non-GAAP operating expenses can be found in the tables at the end of this shareholder letter
UNLEVERED FREE CASH FLOW |
| | | | | |
| $ in millions | Q2:2018 | Q2:2019 | Comments |
| Cash Flow from Operations | $17.2 | $21.2 | Increase primarily due to improved profitability and optimization of working capital. |
| Capital Expenditures | ($5.1) | ($5.0) | In line with prior year, while we continue to make investments in real estate projects in FY19 to drive our operational effiencies. |
| Capitalized Software Costs | ($6.3) | ($6.7) | |
| Free Cash Flow | $5.9 | $9.5 | |
| YoY | 128 | % | 61 | % | |
| Cash Interest Expense | $2.0 | $0.0 | Decrease due to the paying off of our $250M convertible note in Q3 2018. |
| Unlevered Free Cash Flow | $7.9 | $9.5 | Outperformance compared to guidance (which was mid single-digit uFCF margin) is due to the timing of payments related to data center capital expenditures, which are now expected to occur in Q3 2019. |
| uFCF Margin | 6 | % | 7 | % | |
CLIENT BASE
The size of our client base increased to 3,604 at the end of the first quarter, representing 37 net new client additions during the quarter.
|
| | | | | | | | | | | | | | | | | | | | |
| | Q1:2017 | Q2:2017 | Q3:2017 | Q4:2017 | Q1:2018 | Q2:2018 | Q3:2018 | Q4:2018 | Q1:2019 | Q2: 2019 |
| Total Clients | 2,998 |
| 3,076 |
| 3,146 |
| 3,250 |
| 3,280 |
| 3,363 |
| 3,428 |
| 3,535 |
| 3,567 |
| 3,604 |
|
| YoY | 12 | % | 13 | % | 12 | % | 11 | % | 9 | % | 9 | % | 9 | % | 9 | % | 9 | % | 7 | % |
| Net Additions | 80 |
| 78 |
| 70 |
| 104 |
| 30 |
| 83 |
| 65 |
| 107 |
| 32 |
| 37 |
|
| YoY | 7 | % | 30 | % | (7 | )% | (8 | )% | (63 | )% | 6 | % | (7 | )% | 3 | % | 7 | % | (55 | )% |
EMPLOYEE HEADCOUNT
We ended Q2 with 2,034 employees, representing a 1% increase from Q1 2019 and 10% increase year-over-year.
|
| | | | | | | | | | | | | | | | | | | | |
| | Q1:2017 | Q2:2017 | Q3:2017 | Q4:2017 | Q1:2018 | Q2:2018 | Q3:2018 | Q4:2018 | Q1:2019 | Q2: 2019 |
| Employees | 1,859 |
| 1,933 |
| 1,960 |
| 1,891 |
| 1,829 |
| 1,851 |
| 1,892 |
| 1,953 |
| 2,017 |
| 2,034 |
|
| YoY | 11 | % | 12 | % | 10 | % | 4 | % | (2 | )% | (4 | )% | (3 | )% | 3 | % | 10 | % | 10 | % |
| QoQ | 2 | % | 4 | % | 1 | % | (4 | )% | (3 | )% | 1 | % | 2 | % | 3 | % | 3 | % | 1 | % |
Financial Outlook
FULL YEAR GUIDANCE
As we've discussed in recent communications with investors, it’s important to highlight that our total revenue growth in 2019 will continue to be impacted by our intentional transition of our service delivery business to partners, but our underlying subscription revenue growth is expected to continue to show strong growth.
Please note that non-GAAP financial measures should not be considered in isolation from, or as a substitute for, financial information prepared in accordance with GAAP. Investors are encouraged to review the reconciliation of these non-GAAP measures to their most directly comparable GAAP financial measures. These non-GAAP financial measures are not based on any standardized methodology prescribed by GAAP and are not necessarily comparable to similarly-titled measures presented by other companies. For prior periods, reconciliations of the non-GAAP financial measures to their most directly comparable GAAP measures have been provided in the tables included as part of this press release.
Our updated guidance for full year 2019 is as follows:
|
| | | | | | |
| | | | | Net Change = Operational Impact + FX Impact |
| $ in millions | 2018 Actual | Prior 2019 Guidance | Current 2019 Guidance | Net Change | Operational Impact | Fx Impact |
| ARR | $510 | $578-$590 | $579.5-$589.5 | $0.5 | $2 | $(1.5) |
| YoY | 16% | 13-16% | 14-16% | | | |
| YoY CC | 17% | 14-16% | 14-16% | | | |
| | | | | | | |
| Total Revenue | $538 | $562-$570 | $566.5-$571.0 | $2.8 | $6.3 | $(3.5) |
| YoY | 12% | 4-6% | 5-6% | | | |
| YoY CC | 11% | 5-7% | 7-8% | | | |
| | | | | | | |
| Subscription Revenue | $473 | $537-$545 | $539.5-$544.0 | $0.8 | $3.8 | $(3.0) |
| YoY | 19% | 14-15% | 14-15% | | | |
| YoY CC | 17% | 14-16% | 16-17% | | | |
| | | | | | | |
| Professional Consulting Services | $65 | ~$25 | ~$27.0 | $2 | $2.5 | $(0.5) |
| YoY | (24)% | ~(60)% | ~(58)% | | | |
| | | | | | | |
| Non-GAAP Operating Income | $63 | $78-$85 | $79.0-$85.0 | $0.5 | $1.2 | $(0.7) |
| Non-GAAP Operating Income Margin | 12% | 14%-15% | 14%-15% | | | |
| | | | | | | |
| Unlevered Free Cash Flow | $64 | $84-$92 | $85.0-$92.0 | $0.5 | $1.2 | $(0.7) |
| Unlevered Free Cash Flow Margin | 12% | 15%-16% | 15%-16% | | | |
We have considered the ongoing macroeconomic and geopolitical events in developing our guidance. Given our favorable Q2 results, we are raising our full-year outlook for ARR, Subscription Revenue, Total Revenue, Operating Profit, and Unlevered Free Cash Flow according to the table above.
As we discussed on our prior two calls, we expect slightly elevated levels of capital expenditures in 2019, primarily due to optimizing our real estate footprint. These elevated levels of capital expenditures
combined with the working capital headwinds related to our exiting our service delivery business reduces the spread between operating margins and unlevered free cash margins. We expect an improvement in this spread in 2020 and beyond when our capital expenditures are normalized and we fully anniversary the transition our service delivery business.
Below are some other details about our full year guidance: |
| | |
| Metric | Value | Notes |
| GBP to USD Exchange Rate | 1.22 | as of 7/30/2019 |
| 5% FX Change in GBP drives | $1M to ARR /
$2M to Revenue | |
| EUR to USD Exchange Rate | 1.12 | as of 7/30/2019 |
| 5% FX Change in EUR drives | $4M to ARR /
$1M to Revenue | |
| Net Interest Expense - GAAP | $14M | |
| Net Interest Expense - Non-GAAP | $10M | |
| Cash Interest Paid | $17M | |
| Shares Outstanding when Net Income is Positive | 66M | Dilution impact adds ~6M shares to weighted avg share count |
| Income Tax Expense | $3M | Primarily tax liability for international operations |
| SBC as % of Revenue | 13% | |
| Capex % of Revenue | ~3% | |
As noted above, we expect to achieve “The Rule of 40,” (which we define as the sum of constant-currency subscription revenue growth and unlevered free cash flow margin) in 2020 and expect to do so in a reasonably balanced approach that slightly favors unlevered free cash flow margins over constant-currency subscription revenue growth.
Q3 2019 GUIDANCE
Our guidance for the third quarter of 2019 is as follows: |
| | |
| $ in millions | Q3:2018 Actual | Q3:2019 Guidance |
| Total Revenue | $134 | $141.0-$143.0 |
| YoY | 10% | 5%-7% |
| YoY CC | 10% | 7%-8% |
| | | |
| Subscription Revenue | $119 | $135.0-$137.0 |
| YoY | 18% | 14%-15% |
| YoY CC | 18% | 15%-17% |
| | | |
| Professional Services Revenue | $15 | 6 |
| YoY | (27)% | (60)% |
| | | |
| Non-GAAP Operating Income | $18 | |
| Non-GAAP Operating Income Margin | 13% | Mid-teens operating margin |
| | | |
| Unlevered Free Cash Flow | $32 | |
| Unlevered Free Cash Flow Margin | 24% | High single-digit uFCF margin |
Below are some other details about our Q3 guidance:
|
| | |
| Metric | Value | Notes |
| GBP to USD Exchange Rate | 1.22 | as of 7/30/2019 |
| 5% FX Change in GBP drives | $1M to ARR /
$1M to Revenue | |
| EUR to USD Exchange Rate | 1.12 | as of 7/30/2019 |
| 5% FX Change in EUR drives | $4M to ARR /
$0.5M to Revenue | |
| Net Interest Expense - GAAP | $4M | |
| Net Interest Expense - Non-GAAP | $3M | |
| Cash Interest Paid | 0 | |
| Shares Outstanding when Net Income is Positive | 66M | Dilution impact adds 6M shares to weighted avg share count |
| Income Tax Expense | $1M | Primarily tax liability for international operations |
| SBC as % of Revenue | 14% | |
| Capex % of Revenue | ~4% | Expected to comprise data center and real estate capital expenditures |
Note: Net Interest Expense - Non-GAAP is Net Interest Expense - GAAP, less Amortization of Debt Issuance Costs of $0.6 million and Accretion of Debt Discount of $0.4 million.
Q3 Calendar
We plan to attend the following investor conferences during the third quarter:
| |
| • | August 13, 2019: The KeyBanc Capital Markets 21st Annual Technology Leadership Forum in Vail, Colorado |
| |
| • | September 4, 2019: The DA Davidson 18th Annual Technology Conference in New York, NY |
| |
| • | September 11, 2019: The Deutsche Bank Technology Conference in Las Vegas, NV |
As a reminder, our quiet period typically begins two weeks prior to the end of our quarter, which during Q3 will be at the close of business on September 16th.
In Closing
We remain devoted to earning the trust and respect of our clients, employees, and investors every day. The importance of our mission is as strong as ever, as is the clarity we have in our ability to achieve our near-term goals. We have an outstanding group of leaders helping to drive these achievements each and every day, and we are humbled and honored to work at a company with these great people.
Thank you for your support and for joining us on our journey to create shareholder value while empowering people to reach their full potential.
Respectfully yours,
Adam Miller Brian Swartz
Founder and Chief Executive Officer Chief Financial Officer
Forward-looking Statements
This shareholder letter contains forward-looking statements, including, but not limited to, statements regarding the expected performance of our business, our future financial and operating performance, including our GAAP and non-GAAP guidance, our strategy, long-term growth and overall future
prospects, the demand for our offerings, our competitive position, our expectations regarding certain financial measures, including subscription revenue, capital expenditures and unlevered free cash flow, and general business conditions. Any forward-looking statements contained in this press release or the quarterly conference call are based upon our historical performance and our current plans, estimates and expectations and are not a representation that such plans, estimates, or expectations will be achieved. These forward-looking statements represent our expectations as of the date of this press release. Subsequent events may cause these expectations to change, and we disclaim any obligation to update the forward-looking statements in the future, except as required by law. These forward-looking statements are subject to known and unknown risks and uncertainties that may cause actual results to differ materially from our current expectations. Important factors that could cause actual results to differ materially from those anticipated in our forward-looking statements include, but are not limited to, our ability to attract new clients; the extent to which clients renew their subscriptions for our solutions; the timing of when consulting services are delivered to new and existing clients by our services organization and implementation subcontractors; the complexity of deployments and product implementations, which can impact the timing of when revenue is recognized from new and existing clients; our shift to focusing on recurring revenue streams; our ability to compete as the learning and human capital management provider for organizations of all sizes; changes in the proportion of our client base that is comprised of enterprise or mid-sized organizations; our ability to manage our growth, including additional headcount and entry into new geographies; our ability to expand our enterprise and mid-market sales opportunities; our ability to maintain stable and consistent quota attainment rates; continued strong demand for learning and human capital management in the Americas, Europe, and Asia Pacific; the timing and success of efforts to increase operational efficiency and cost containment; the timing and success of solutions offered by our competitors; unpredictable macro-economic conditions; the impact of foreign exchange rates; reductions in information technology spending; the success of our new product and service introductions; a disruption in our hosting network infrastructure; problems caused by security breaches; costs and reputational harm that could result from defects in our solutions; the success of our strategic relationships with third parties; the loss of any of our key employees and our ability to locate qualified replacements; failure to protect our intellectual property; acts of terrorism or other vandalism, war or natural disasters; changes in current tax or accounting rules; legal or political changes in local or foreign jurisdictions that decrease demand for, or restrict our ability to sell or provide, our products; and unanticipated costs or liabilities related to businesses that we acquire. Further information on factors that could cause actual results to differ materially from the results anticipated by our forward-looking statements is included in the reports we have filed with the Securities and Exchange Commission, including our Annual Report on Form 10-K for the fiscal year ended December 31, 2018.
Non-GAAP Financial Measures and Other Key Metrics
To supplement its consolidated financial statements, which are prepared and presented in accordance with U.S. generally accepted accounting principles, or GAAP, the Company has provided in this shareholder letter and the quarterly conference call held on the date hereof certain non-GAAP financial measures and other key metrics. These non-GAAP financial measures and other key metrics include:
| |
| (i) | non-GAAP cost of revenue, which is defined as cost of revenue less amortization of intangible assets and stock-based compensation, |
| |
| (ii) | annual recurring revenue, which is defined as the annualized recurring value of all active contracts at the end of a reporting period, |
| |
| (iii) | unlevered free cash flow, which is defined as net cash provided by operating activities minus capital expenditures and capitalized software costs plus cash paid for interest, |
| |
| (iv) | unlevered free cash flow margin, which is defined as unlevered free cash flow divided by revenue, |
| |
| (v) | non-GAAP net income and non-GAAP basic and diluted net income per share, which exclude, for the periods in which they are presented, stock-based compensation, amortization of intangible assets, accretion of debt discount and amortization of debt issuance costs, restructuring costs, acquisition costs and excludes the impacts of unamortized stock-based compensation expense in applying the treasury method for determining the non-GAAP weighted average number of dilutive shares outstanding, |
| |
| (vi) | non-GAAP gross profit and non-GAAP gross margin, which exclude stock-based compensation and amortization of intangible assets reflected in cost of revenue, |
| |
| (vii) | non-GAAP operating income and non-GAAP operating income margin, which exclude stock-based compensation, amortization of intangible assets, restructuring costs and acquisition costs, |
| |
| (viii) | non-GAAP operating expenses, which exclude stock-based compensation, amortization of intangible assets, restructuring costs and acquisition costs, and |
| |
| (ix) | non-GAAP sales and marketing expense, non-GAAP research and development expense, and non-GAAP general and administrative expense, each of which excludes stock-based compensation attributable to the corresponding GAAP financial measures. |
The Company’s management uses these non-GAAP financial measures and other key metrics internally in analyzing its financial results and believes they are useful to investors, as a supplement to the corresponding GAAP measures, in evaluating the Company’s ongoing operational performance and trends and in comparing its financial measures with other companies in the same industry, many of which present similar non-GAAP financial measures and other key metrics to help investors understand the operational performance of their businesses. In addition, the Company believes that the following non-GAAP adjustments are useful to management and investors for the following reasons:
| |
| • | Stock-based compensation. The Company excludes stock-based compensation expense because it is non-cash in nature, and management believes that its exclusion provides additional insight into the Company’s operational performance and also provides a useful comparison of the Company’s operating results to prior periods and its peer companies. Additionally, determining the fair value of certain stock-based awards involves a high degree of judgment and estimation and the expense recorded may bear little resemblance to the actual value realized upon the vesting or future exercise of such awards. |
| |
| • | Amortization of intangible assets. The Company excludes amortization of acquired intangible assets because the expense is a non-cash item and management believes that its exclusion provides meaningful supplemental information regarding the Company’s operational performance and allows for a useful comparison of its operating results to prior periods and its peer companies. |
| |
| • | Accretion of debt discount and amortization of debt issuance costs. For GAAP purposes, the Company is required to recognize the effective interest expense on its senior convertible notes and amortize the issuance costs over the term of the notes. The difference between the effective interest expense and the contractual interest expense and the amortization expense of issuance costs are excluded from management’s assessment of the Company’s operating performance because management believes that these non-cash expenses are not indicative of ongoing operating performance. In addition, the exclusion of these items provides a useful comparison of the Company’s operating results to prior periods and its peer companies. |
| |
| • | Restructuring. The Company excludes costs related to restructuring because the expense is not indicative of its continuing operations and believes that the exclusion of these costs provides investors with a supplemental view of the Company’s operational performance. |
| |
| • | Acquisition costs. The Company excludes costs related to acquisitions because the expense is not indicative of its continuing operations and believes that the exclusion of these costs provides investors with a supplemental view of the Company’s operational performance. |
Non-GAAP financial measures should not be considered in isolation from, or as a substitute for, financial information prepared in accordance with GAAP. Investors are encouraged to review the reconciliation of these non-GAAP measures to their most directly comparable GAAP financial measures. These non-GAAP financial measures are not based on any standardized methodology prescribed by GAAP and are not necessarily comparable to similarly-titled measures presented by other companies. For prior periods, reconciliations of the non-GAAP financial measures to their most directly comparable GAAP measures have been provided in the tables included as part of this press release.
Cornerstone OnDemand, Inc.
CONSOLIDATED BALANCE SHEETS
(in thousands)
(unaudited)
|
| | | | | | | |
| | June 30, 2019 | | December 31,
2018 |
| Assets | | | |
| Cash and cash equivalents | $ | 395,106 |
| | $ | 183,596 |
|
| Short-term investments | 7,998 |
| | 204,732 |
|
| Accounts receivable, net | 103,609 |
| | 125,300 |
|
| Deferred commissions, current | 17,962 |
| | 24,467 |
|
| Prepaid expenses and other current assets | 38,872 |
| | 34,940 |
|
| Total current assets | 563,547 |
| | 573,035 |
|
| | | | |
| Capitalized software development costs, net | 49,341 |
| | 45,416 |
|
| Property and equipment, net | 35,740 |
| | 77,254 |
|
| Operating right-of-use assets | 79,838 |
| | — |
|
| Deferred commissions, non-current | 60,500 |
| | 45,444 |
|
| Long-term investments | 750 |
| | 1,250 |
|
| Intangible assets, net | 11,534 |
| | 13,867 |
|
| Goodwill | 47,453 |
| | 47,453 |
|
| Other assets, net | 1,991 |
| | 3,437 |
|
| Total Assets | $ | 850,694 |
| | $ | 807,156 |
|
| | | | |
| Liabilities and Stockholders’ Equity | | | |
| Liabilities: | | | |
| Accounts payable | $ | 15,843 |
| | $ | 11,921 |
|
| Accrued expenses | 57,685 |
| | 68,331 |
|
| Deferred revenue, current | 283,878 |
| | 312,526 |
|
| Operating lease liabilities, current | 11,160 |
| | — |
|
| Other liabilities | 8,178 |
| | 7,645 |
|
| Total current liabilities | 376,744 |
| | 400,423 |
|
| | | | |
| Convertible notes, net | 291,038 |
| | 288,967 |
|
| Operating lease liabilities, non-current | 75,150 |
| | — |
|
| Other liabilities, non-current | 960 |
| | 2,484 |
|
| Deferred revenue, non-current | 9,405 |
| | 13,275 |
|
| Facility financing obligation | — |
| | 46,100 |
|
| Total liabilities | 753,297 |
| | 751,249 |
|
| | | | |
| Stockholders’ Equity: | | | |
| Common stock | 6 |
| | 6 |
|
| Additional paid-in capital | 637,770 |
| | 585,387 |
|
| Accumulated deficit | (542,231 | ) | | (529,962 | ) |
| Accumulated other comprehensive income | 1,852 |
| | 476 |
|
| Total stockholders’ equity | 97,397 |
| | 55,907 |
|
| Total Liabilities and Stockholders’ Equity | $ | 850,694 |
| | $ | 807,156 |
|
Cornerstone OnDemand, Inc.
CONSOLIDATED STATEMENTS OF OPERATIONS
(in thousands, except per share data)
(unaudited)
|
| | | | | | | | | | | | | | | |
| | Three Months Ended | | Six Months Ended |
| | June 30, | | June 30, |
| | 2019 | | 2018 | | 2019 | | 2018 |
| Revenue | $ | 141,860 |
| | $ | 132,517 |
| | $ | 281,977 |
| | $ | 265,630 |
|
Cost of revenue 1, 2 | 40,187 |
| | 36,365 |
| | 73,882 |
| | 73,385 |
|
| Gross profit | 101,673 |
| | 96,152 |
| | 208,095 |
| | 192,245 |
|
| Operating expenses: | | | | | | | |
Sales and marketing 1 | 58,691 |
| | 59,821 |
| | 113,196 |
| | 119,066 |
|
Research and development 1 | 24,337 |
| | 16,325 |
| | 52,083 |
| | 32,309 |
|
General and administrative 1 | 22,239 |
| | 22,101 |
| | 45,179 |
| | 44,086 |
|
Restructuring 1 | — |
| | 1,000 |
| | — |
| | 8,725 |
|
| Total operating expenses | 105,267 |
| | 99,247 |
| | 210,458 |
| | 204,186 |
|
| Income (loss) from operations | (3,594 | ) | | (3,095 | ) | | (2,363 | ) | | (11,941 | ) |
| Other income (expense): | | | | | | | |
| Interest income | 2,186 |
| | 2,665 |
| | 4,176 |
| | 4,484 |
|
| Interest expense | (5,378 | ) | | (8,791 | ) | | (10,744 | ) | | (17,491 | ) |
| Other, net | (1,105 | ) | | (2,250 | ) | | (1,702 | ) | | (2,206 | ) |
| Other income (expense), net | (4,297 | ) | | (8,376 | ) | | (8,270 | ) | | (15,213 | ) |
| Loss before income tax provision | (7,891 | ) | | (11,471 | ) | | (10,633 | ) | | (27,154 | ) |
| Income tax provision | (914 | ) | | (536 | ) | | (1,636 | ) | | (1,069 | ) |
| Net loss | $ | (8,805 | ) | | $ | (12,007 | ) | | $ | (12,269 | ) | | $ | (28,223 | ) |
| Net loss per share, basic and diluted | $ | (0.15 | ) | | $ | (0.21 | ) | | $ | (0.21 | ) | | $ | (0.49 | ) |
| Weighted average common shares outstanding, basic and diluted | 59,715 |
| | 57,844 |
| | 59,430 |
| | 57,635 |
|
|
| | |
| 1 |
| Includes stock-based compensation as follows: |
|
| | | | | | | | | | | | | | | |
| | Three Months Ended | | Six Months Ended |
| | June 30, | | June 30, |
| | 2019 | | 2018 | | 2019 | | 2018 |
| Cost of revenue | $ | 1,786 |
| | $ | 1,021 |
| | $ | 2,922 |
| | $ | 2,023 |
|
| Sales and marketing | 6,809 |
| | 6,545 |
| | 12,856 |
| | 12,791 |
|
| Research and development | 4,319 |
| | 2,417 |
| | 8,515 |
| | 4,725 |
|
| General and administrative | 6,237 |
| | 5,300 |
| | 11,903 |
| | 9,787 |
|
| Restructuring | — |
| | 749 |
| | — |
| | 6,185 |
|
| Total | $ | 19,151 |
| | $ | 16,032 |
| | $ | 36,196 |
| | $ | 35,511 |
|
|
| | |
| 2 |
| Cost of revenue includes amortization of intangible assets as follows: |
|
| | | | | | | | | | | | | | | |
| | Three Months Ended | | Six Months Ended |
| | June 30, | | June 30, |
| | 2019 | | 2018 | | 2019 | | 2018 |
| Cost of revenue | $ | 1,047 |
| | $ | — |
| | $ | 2,333 |
| | $ | — |
|
Cornerstone OnDemand, Inc.
CONSOLIDATED STATEMENTS OF CASH FLOWS
(in thousands)
(unaudited)
|
| | | | | | | | | | | | | | | |
| | Three Months Ended | | Six Months Ended |
| | June 30, | | June 30, |
| | 2019 | | 2018 | | 2019 | | 2018 |
| Cash flows from operating activities: | | | | | | | |
| Net loss | (8,805 | ) | | (12,007 | ) | | (12,269 | ) | | (28,223 | ) |
| Adjustments to reconcile net loss to net cash provided by operating activities: | | | | | | | |
| Depreciation and amortization | 9,176 |
| | 8,388 |
| | 20,034 |
| | 16,219 |
|
| Accretion of debt discount and amortization of debt issuance costs | 1,516 |
| | 3,496 |
| | 2,543 |
| | 6,922 |
|
| Purchased investment premium, net of amortization | (509 | ) | | (106 | ) | | (725 | ) | | (187 | ) |
| Net foreign currency (gain) loss | 821 |
| | (1,329 | ) | | 1,115 |
| | (1,685 | ) |
| Stock-based compensation expense | 19,151 |
| | 16,032 |
| | 36,196 |
| | 35,511 |
|
| Changes in operating assets and liabilities: | | | | | | | |
| Accounts receivable | (11,081 | ) | | 1,207 |
| | 21,874 |
| | 43,095 |
|
| Deferred commissions | (4,456 | ) | | (2,212 | ) | | (8,730 | ) | | (2,740 | ) |
| Prepaid expenses and other assets | 3,313 |
| | (7,982 | ) | | 6,954 |
| | (16,823 | ) |
| Accounts payable | 4,387 |
| | (250 | ) | | 1,606 |
| | (7,855 | ) |
| Accrued expenses | 13,568 |
| | 13,693 |
| | (9,719 | ) | | (1,366 | ) |
| Deferred revenue | (8,615 | ) | | (4,132 | ) | | (32,574 | ) | | (27,883 | ) |
| Other liabilities | 2,717 |
| | 2,430 |
| | 2,172 |
| | (2,337 | ) |
| Net cash provided by operating activities | 21,183 |
| | 17,228 |
| | 28,477 |
| | 12,648 |
|
| Cash flows from investing activities: | | | | | | | |
| Purchases of investments | (82 | ) | | 484 |
| | (82 | ) | | 484 |
|
| Maturities of investments | 27,095 |
| | 32,012 |
| | 197,774 |
| | 72,689 |
|
| Capital expenditures | (5,031 | ) | | (5,068 | ) | | (9,274 | ) | | (7,627 | ) |
| Capitalized software costs | (6,728 | ) | | (6,263 | ) | | (14,127 | ) | | (12,302 | ) |
| Net cash provided by investing activities | 15,254 |
| | 21,165 |
| | 174,291 |
| | 53,244 |
|
| Cash flows from financing activities: | | | | | | | |
| Payments of debt issuance costs | — |
| | — |
| | — |
| | (152 | ) |
| Proceeds from employee stock plans | 7,371 |
| | 23,282 |
| | 14,211 |
| | 30,047 |
|
| Payment of tax withholdings for employee stock plans | (5,469 | ) | | — |
| | (5,469 | ) | | — |
|
| Repurchases of common stock | — |
| | (23,908 | ) | | — |
| | (38,608 | ) |
| Net cash provided by (used in) financing activities | 1,902 |
| | (626 | ) | | 8,742 |
| | (8,713 | ) |
| Effect of exchange rate changes on cash and cash equivalents | (248 | ) | | (181 | ) | | — |
| | 176 |
|
| Net increase in cash and cash equivalents | 38,091 |
| | 37,586 |
| | 211,510 |
| | 57,355 |
|
| Cash and cash equivalents at beginning of period | 357,015 |
| | 413,345 |
| | 183,596 |
| | 393,576 |
|
| Cash and cash equivalents at end of period | $ | 395,106 |
| | $ | 450,931 |
| | $ | 395,106 |
| | $ | 450,931 |
|
| Supplemental cash flow information: | | | | | | | |
| Cash paid for interest | $ | 46 |
| | $ | 2,003 |
| | $ | 8,731 |
| | $ | 5,003 |
|
| Cash paid for income taxes | 580 |
| | 422 |
| | 970 |
| | 874 |
|
| Proceeds from employee stock plans received in advance of stock issuance | 720 |
| | 499 |
| | 720 |
| | 499 |
|
| Cash paid for operating leases | 3,099 |
| | — |
| | 5,700 |
| | — |
|
| Right-of-use assets obtained in exchange for lease obligations | — |
| | — |
| | 86,120 |
| | — |
|
| Non-cash investing and financing activities: | | | | | | | |
| Assets acquired under capital leases and other financing arrangements | $ | 1,702 |
| | $ | — |
| | $ | 1,702 |
| | $ | — |
|
| Capitalized assets financed by accounts payable and accrued expenses | 2,728 |
| | 3,577 |
| | 2,728 |
| | 3,577 |
|
| Capitalized stock-based compensation | 1,361 |
| | 1,198 |
| | 2,113 |
| | 2,451 |
|
Cornerstone OnDemand, Inc.
RECONCILIATIONS OF COST OF REVENUE TO NON-GAAP COST OF REVENUE, GROSS PROFIT AND GROSS MARGIN TO NON-GAAP GROSS PROFIT AND NON-GAAP GROSS MARGIN, LOSS FROM OPERATIONS TO NON-GAAP OPERATING INCOME AND OPERATING MARGIN TO NON-GAAP OPERATING INCOME MARGIN
(in thousands)
(unaudited)
|
| | | | | | | | | | | | | | | |
| | Three Months Ended | | Six Months Ended |
| | June 30, | | June 30, |
| | 2019 | | 2018 | | 2019 | | 2018 |
| Reconciliation of cost of revenue, gross profit and gross margin: | | | | | | | |
| Revenue | $ | 141,860 |
| | $ | 132,517 |
| | $ | 281,977 |
| | $ | 265,630 |
|
| Cost of revenue | 40,187 |
| | 36,365 |
| | 73,882 |
| | 73,385 |
|
| Gross profit | $ | 101,673 |
| | $ | 96,152 |
| | $ | 208,095 |
| | $ | 192,245 |
|
| Gross margin | 71.7 | % | | 72.6 | % | | 73.8 | % | | 72.4 | % |
| | | | | | | | |
| Cost of revenue | $ | 40,187 |
| | $ | 36,365 |
| | $ | 73,882 |
| | $ | 73,385 |
|
| Adjustments to cost of revenue: | | | | | | | |
| Stock-based compensation | (1,786 | ) | | (1,021 | ) | | (2,922 | ) | | (2,023 | ) |
| Amortization of intangible assets | (1,047 | ) | | — |
| | (2,333 | ) | | — |
|
| Total adjustments to cost of revenue | (2,833 | ) | | (1,021 | ) | | (5,255 | ) | | (2,023 | ) |
| Non-GAAP costs of revenue | 37,354 |
| | 35,344 |
| | 68,627 |
| | 71,362 |
|
| Non-GAAP gross profit | $ | 104,506 |
| | $ | 97,173 |
| | $ | 213,350 |
| | $ | 194,268 |
|
| Non-GAAP gross margin | 73.7 | % | | 73.3 | % | | 75.7 | % | | 73.1 | % |
| | | | | | | | |
| Reconciliation of operating loss and operating income margin: | | | | | | | |
| Loss from operations | $ | (3,594 | ) | | $ | (3,095 | ) | | $ | (2,363 | ) | | $ | (11,941 | ) |
| Operating margin | (2.5 | )% | | (2.3 | )% | | (0.8 | )% | | (4.5 | )% |
| Adjustments to loss from operations: | | | | | | | |
| Stock-based compensation | 19,151 |
| | 15,283 |
| | 36,196 |
| | 29,326 |
|
| Amortization of intangible assets | 1,047 |
| | — |
| | 2,333 |
| | — |
|
| Restructuring | — |
| | 1,000 |
| | — |
| | 8,725 |
|
| Total adjustments to income (loss) from operations | 20,198 |
| | 16,283 |
| | 38,529 |
| | 38,051 |
|
| Non-GAAP operating income | $ | 16,604 |
| | $ | 13,188 |
| | $ | 36,166 |
| | $ | 26,110 |
|
| Non-GAAP operating income margin | 11.7 | % | | 10.0 | % | | 12.8 | % | | 9.8 | % |
Cornerstone OnDemand, Inc.
RECONCILIATIONS OF NET LOSS TO NON-GAAP NET INCOME AND NON-GAAP NET INCOME PER SHARE
(in thousands, except per share amounts)
(unaudited)
|
| | | | | | | | | | | | | | | |
| | Three Months Ended | | Six Months Ended |
| | June 30, | | June 30, |
| | 2019 | | 2018 | | 2019 | | 2018 |
| Net loss | $ | (8,805 | ) | | $ | (12,007 | ) | | $ | (12,269 | ) | | $ | (28,223 | ) |
| Adjustments to net loss | | | | | | | |
| Stock-based compensation | 19,151 |
| | 15,283 |
| | 36,196 |
| | 29,326 |
|
| Amortization of intangible assets | 1,047 |
| | — |
| | 2,333 |
| | — |
|
Accretion of debt discount and amortization of debt issuance costs1 | 1,043 |
| | 3,496 |
| | 2,069 |
| | 6,922 |
|
| Restructuring | — |
| | 1,000 |
| | — |
| | 8,725 |
|
| Total adjustments to net loss | 21,241 |
| | 19,779 |
| | 40,598 |
| | 44,973 |
|
| Non-GAAP net income | $ | 12,436 |
| | $ | 7,772 |
| | $ | 28,329 |
| | $ | 16,750 |
|
| Non-GAAP basic net income per share | $ | 0.21 |
| | $ | 0.13 |
| | $ | 0.48 |
| | $ | 0.29 |
|
| Non-GAAP diluted net income per share | $ | 0.19 |
| | $ | 0.12 |
| | $ | 0.43 |
| | $ | 0.27 |
|
| Weighted-average common shares outstanding, basic | 59,715 |
| | 57,844 |
| | 59,430 |
| | 57,635 |
|
| Non-GAAP weighted-average common shares outstanding, diluted | 65,767 |
| | 63,733 |
| | 65,297 |
| | 63,163 |
|
|
| | |
| 1 |
| Debt discount accretion and debt issuance cost amortization has been recorded in connection with our issuance of $253.0 million in convertible notes on June 17, 2013 and $300.0 million in convertible notes on December 8, 2017. These expenses represent non-cash charges that have been recorded in accordance with the authoritative accounting literature for such transactions. |
Cornerstone OnDemand, Inc.
RECONCILIATION OF NET CASH PROVIDED BY (USED IN) OPERATING ACTIVITIES TO UNLEVERED FREE CASH FLOW AND UNLEVERED FREE CASH FLOW MARGIN
(A Non-GAAP Financial Measure)
(in thousands)
(unaudited)
|
| | | | | | | | | | | | | | | |
| | Three Months Ended | | Six Months Ended |
| | June 30, | | June 30, |
| Reconciliation of unlevered free cash flow: | | | | | | | |
| Net cash provided by (used in) operating activities | $ | 21,183 |
| | $ | 17,228 |
| | $ | 28,477 |
| | $ | 12,648 |
|
| Capital expenditures | (5,031 | ) | | (5,068 | ) | | (9,274 | ) | | (7,627 | ) |
| Capitalized software costs | (6,728 | ) | | (6,263 | ) | | (14,127 | ) | | (12,302 | ) |
| Cash paid for interest | 46 |
| | 2,003 |
| | 8,731 |
| | 5,003 |
|
| Unlevered free cash flow | $ | 9,470 |
| | $ | 7,900 |
| | $ | 13,807 |
| | $ | (2,278 | ) |
| Unlevered free cash flow margin | 6.7 | % | | 6.0 | % | | 4.9 | % | | (0.9 | )% |
Cornerstone OnDemand, Inc.
TRENDED OPERATIONAL & FINANCIAL HIGHLIGHTS
(unaudited)
The following metrics are intended as a supplement to the financial statements found in this press release and other information furnished or filed with the SEC. In the event of discrepancies between amounts in these tables and the Company’s historical disclosures or financial statements, readers should rely on the Company’s filings with the SEC and financial statements in the Company’s most recent earnings press release.
The Company intends to periodically review and refine the definition, methodology and appropriateness of each of these supplemental metrics. As a result, metrics are subject to removal and/or change, and such changes could be material.
|
| | | | | | | | | | | | | | | | | | | | |
| | FY 2018 | | FY 2019 | | Full Year |
| | Q1'18 | Q2'18 | Q3'18 | Q4'18 | | Q1'19 | Q2'19 | | FY16 | FY17 | FY18 |
| SELECTED METRICS: | | | | | | | | | | | |
Number of clients 1 | 3,280 |
| 3,363 |
| 3,428 |
| 3,535 |
| | 3,567 |
| 3,604 |
| | 2,918 |
| 3,250 |
| 3,535 |
|
| % y/y | 9.4 | % | 9.3 | % | 9.0 | % | 8.8 | % | | 8.8 | % | 7.2 | % | | 12.4 | % | 11.4 | % | 8.8 | % |
| % q/q | 0.9 | % | 2.5 | % | 1.9 | % | 3.1 | % | | 0.9 | % | 1.0 | % | | n/a |
| n/a |
| n/a |
|
| Number of employees | 1,829 |
| 1,851 |
| 1,892 |
| 1,953 |
| | 2,017 |
| 2,034 |
| | 1,823 |
| 1,891 |
| 1,953 |
|
| % y/y | (1.6 | )% | (4.2 | )% | (3.5 | )% | 3.3 | % | | 10.3 | % | 9.9 | % | | 10.8 | % | 3.7 | % | 3.3 | % |
| % q/q | (3.3 | )% | 1.2 | % | 2.2 | % | 3.2 | % | | 3.3 | % | 0.8 | % | | n/a |
| n/a |
| n/a |
|
| Annual dollar retention rate | n/a |
| n/a |
| n/a |
| n/a |
| | n/a |
| n/a |
| | 95.1 | % | 93.5 | % | 92.8 | % |
| Annual recurring revenue (in thousands) | n/a |
| n/a |
| n/a |
| n/a |
| | n/a |
| n/a |
| | n/a |
| 439,000 |
| 510,000 |
|
| Net cash (used in) provided by operating activities (in thousands) | (4,580 | ) | 17,228 |
| 32,617 |
| 44,988 |
| | 7,294 |
| 21,183 |
| | 35,252 |
| 67,510 |
| 90,253 |
|
| Unlevered free cash flow (in thousands) | (10,178 | ) | 7,900 |
| 32,067 |
| 33,681 |
| | 4,337 |
| 9,470 |
| | 16,411 |
| 43,680 |
| 63,471 |
|
| Unlevered free cash flow margin | (7.6 | )% | 6.0 | % | 23.9 | % | 24.4 | % | | 3.1 | % | 6.7 | % | | 3.9 | % | 9.1 | % | 11.8 | % |
| FINANCIAL DATA - ASC 606 (in thousands, except percentages): | | | | | | | | | | | |
| Revenue | 133,113 |
| 132,517 |
| 134,014 |
| 138,247 |
| | 140,117 |
| 141,860 |
| | — |
| — |
| 537,891 |
|
| Subscription revenue | 113,134 |
| 114,771 |
| 118,844 |
| 126,303 |
| | 131,256 |
| 132,562 |
| | — |
| — |
| 473,052 |
|
| Subscription revenue % of total revenue | 85.0 | % | 86.6 | % | 88.7 | % | 91.4 | % | | 93.7 | % | 93.5 | % | | — |
| — |
| 87.9 | % |
| (Loss) income from operations | (8,846 | ) | (3,095 | ) | 1,574 |
| 2,598 |
| | 1,231 |
| (3,594 | ) | | — |
| — |
| (7,769 | ) |
| MARGIN DATA - ASC 606: | | | | | | | | | | | |
| Gross margin | 72.2 | % | 72.6 | % | 73.0 | % | 74.8 | % | | 76.0 | % | 71.7 | % | | — |
| — |
| 73.2 | % |
| Sales and marketing % of revenue | 44.5 | % | 45.1 | % | 39.7 | % | 37.9 | % | | 38.9 | % | 41.4 | % | | — |
| — |
| 41.8 | % |
| Research and development % of revenue | 12.0 | % | 12.3 | % | 14.7 | % | 18.1 | % | | 19.8 | % | 17.2 | % | | — |
| — |
| 14.3 | % |
| General and administrative % of revenue | 16.5 | % | 16.7 | % | 17.3 | % | 17.0 | % | | 16.4 | % | 15.7 | % | | — |
| — |
| 16.9 | % |
| Restructuring % of revenue | 5.8 | % | 0.8 | % | 0.2 | % | — | % | | — | % | — | % | | — |
| — |
| 1.7 | % |
| Operating margin | (6.6 | )% | (2.3 | )% | 1.2 | % | 1.9 | % | | 0.9 | % | (2.5 | )% | | — |
| — |
| (1.4 | )% |
| NON-GAAP MARGIN DATA - ASC 606: | | | | | | | | | | | |
| Non-GAAP gross margin | 72.9 | % | 73.3 | % | 74.0 | % | 76.1 | % | | 77.7 | % | 73.7 | % | | — |
| — |
| 74.1 | % |
| Non-GAAP sales and marketing % of revenue | 39.8 | % | 40.2 | % | 35.3 | % | 33.7 | % | | 34.6 | % | 36.6 | % | | — |
| — |
| 37.2 | % |
| Non-GAAP research and development % of revenue | 10.3 | % | 10.5 | % | 12.3 | % | 15.3 | % | | 16.8 | % | 14.1 | % | | — |
| — |
| 12.1 | % |
| Non-GAAP general and administrative % of revenue | 13.1 | % | 12.7 | % | 13.1 | % | 13.0 | % | | 12.3 | % | 11.3 | % | | — |
| — |
| 13.0 | % |
| Non-GAAP operating margin | 9.7 | % | 10.0 | % | 13.3 | % | 14.1 | % | | 14.0 | % | 11.7 | % | | — |
| — |
| 11.8 | % |
| Non-GAAP research and development plus capitalized software % of revenue | 14.8 | % | 15.2 | % | 17.3 | % | 20.0 | % | | 22.1 | % | 18.9 | % | | — |
| — |
| 19.1 | % |
| FOREIGN EXCHANGE RATES: | | | | | | | | | | | |
| GBP to USD average period rate | 1.39 |
| 1.36 |
| 1.30 |
| 1.29 |
| | 1.30 |
| 1.29 |
| | 1.36 |
| 1.29 |
| 1.34 |
|
| GBP to USD end of period spot rate | 1.40 |
| 1.32 |
| 1.30 |
| 1.27 |
| | 1.30 |
| 1.27 |
| | 1.23 |
| 1.35 |
| 1.27 |
|
| EUR to USD average period rate | 1.23 |
| 1.19 |
| 1.16 |
| 1.14 |
| | 1.14 |
| 1.12 |
| | n/a |
| 1.14 |
| 1.18 |
|
| EUR to USD end of period spot rate | 1.23 |
| 1.17 |
| 1.16 |
| 1.14 |
| | 1.12 |
| 1.14 |
| | n/a |
| 1.20 |
| 1.14 |
|
|
| | |
| 1 |
| Includes contracted clients of our enterprise human capital management platform and excludes clients and users of Cornerstone for Salesforce, PiiQ, Workpop Inc. and Grovo Learning, Inc.
|
Investor Relations Contact:
Jason Gold
Phone: +1 (310) 526-2531
jgold@csod.com
Media Contact:
Deaira Irons
Phone: +1 (310) 752-0164
dirons@csod.com