Wachovia Bank Commercial Mortgage Trust, Series 2007-C32 Inactive
Filed: 27 Jun 07, 12:00am
Prospectus Supplement
Filed Pursuant to Rule 424B5
Registration Statement No.: 333-131262
PROSPECTUS SUPPLEMENT
(To accompany prospectus dated October 19, 2006)
$2,866,441,000 (Approximate)
(Offered Certificates)
Wachovia Bank Commercial Mortgage Trust
Commercial Mortgage Pass-Through Certificates
Series 2007-C32
(Issuing Entity)
Wachovia Commercial Mortgage Securities, Inc.
(Depositor)
Wachovia Bank, National Association
Artesia Mortgage Capital Corporation
(Sponsors)
| You should carefully consider the risk factors beginning on page S-54 of this prospectus supplement and on page 14 of the accompanying prospectus. Neither the offered certificates nor the underlying mortgage loans are insured or guaranteed by any government agency or instrumentality. The offered certificates will represent interests in the issuing entity only. They will not represent obligations of the sponsors, the depositor, any of their respective affiliates or any other party. The offered certificates will not be listed on any national securities exchange or any automated quotation system of any registered securities association. This prospectus supplement may be used to offer and sell the offered certificates only if it is accompanied by the prospectus dated October 19, 2006. |
| The trust fund: |
| • | As of June 11, 2007, the mortgage loans included in the trust fund will have an aggregate principal balance of approximately $3,823,853,069. |
| • | The trust fund will consist of a pool of 142 fixed rate mortgage loans. |
| • | The mortgage loans are secured by first liens on commercial and multifamily properties. |
| • | All of the mortgage loans were originated or acquired by Wachovia Bank, National Association and Artesia Mortgage Capital Corporation. |
| The certificates: |
| • | The trust fund will issue 30 classes of certificates. |
| • | Only the 12 classes of offered certificates described in the following table are being offered by this prospectus supplement and the accompanying prospectus. Distributions on the certificates will occur on a monthly basis, commencing in July 2007. |
| • | The only credit support for any class of offered certificates will consist of the subordination of the classes of certificates, if any, having a lower payment priority. |
| Class | Original Certificate Balance or Notional Amount(1) | Percentage of Cut-Off Date Pool Balance | Pass-Through Rate | Assumed Final Distribution Dates(2) | CUSIP No. | Expected Moody’s/S&P Rating(3) | |||||||||||||||||||||
| Class A-1 | $ | 25,707,000 | 0.672 | % | 5.686% | March 15, 2012 | 92978YAA8 | Aaa/AAA | |||||||||||||||||||
| Class A-2 | $ | 946,379,000 | 24.749 | % | 5.736%(4) | June 15, 2012 | 92978YAB6 | Aaa/AAA | |||||||||||||||||||
| Class A-PB | $ | 62,827,000 | 1.643 | % | 5.741%(5) | February 15, 2017 | 92978YAC4 | Aaa/AAA | |||||||||||||||||||
| Class A-3(6) | $ | 948,589,000 | 24.807 | % | 5.741%(5) | May 15, 2017 | 92978YAD2 | Aaa/AAA | |||||||||||||||||||
| Class A-1A | $ | 443,196,000 | 11.590 | % | 5.741%(5) | May 15, 2017 | 92978YAF7 | Aaa/AAA | |||||||||||||||||||
| Class IO(7) | $ | 3,823,853,068 | N/A | 0.011% | N/A | 92978YBR0 | Aaa/AAA | ||||||||||||||||||||
| Class A-J | $ | 253,330,000 | 6.625 | % | 5.741%(5) | June 15, 2017 | 92978YAH3 | Aaa/AAA | |||||||||||||||||||
| Class B | $ | 43,019,000 | 1.125 | % | 5.741%(5) | June 15, 2017 | 92978YAJ9 | Aa1/AA+ | |||||||||||||||||||
| Class C | $ | 47,798,000 | 1.250 | % | 5.741%(5) | June 15, 2017 | 92978YAK6 | Aa2/AA | |||||||||||||||||||
| Class D | $ | 28,679,000 | 0.750 | % | 5.741%(5) | July 15, 2017 | 92978YAL4 | Aa3/AA- | |||||||||||||||||||
| Class E | $ | 28,679,000 | 0.750 | % | 5.741%(5) | July 15, 2017 | 92978YAM2 | A1/A+ | |||||||||||||||||||
| Class F | $ | 38,238,000 | 1.000 | % | 5.741%(5) | July 15, 2017 | 92978YAN0 | A2/A | |||||||||||||||||||
(Footnotes explaining the table are on page S-3)
Neither the SEC nor any state securities commission has approved or disapproved the offered certificates or has determined that this prospectus supplement or the accompanying prospectus is accurate or complete. Any representation to the contrary is unlawful.
Wachovia Capital Markets, LLC is acting as lead manager and sole bookrunner for this offering. Barclays Capital Inc. and Goldman, Sachs & Co. are acting as co-managers for this offering. Wachovia Capital Markets, LLC, Barclays Capital Inc. and Goldman, Sachs & Co. are required to purchase the offered certificates from us, subject to certain conditions. The underwriters will offer the offered certificates to the public from time to time in negotiated transactions or otherwise at varying prices to be determined at the time of sale. It is intended that Wachovia Securities International Limited will act as a member of the selling group on behalf of Wachovia Capital Markets, LLC and may sell offered certificates on behalf of Wachovia Capital Markets, LLC in certain jurisdictions. We expect to receive from this offering approximately % of the initial certificate balance of the offered certificates, plus accrued interest fr om June 1, 2007, before deducting expenses.
We expect that delivery of the offered certificates will be made in book-entry form on or about June 28, 2007.
WACHOVIA SECURITIES
| Barclays Capital | Goldman, Sachs & Co. |
June 22, 2007

IMPORTANT NOTICE ABOUT INFORMATION PRESENTED IN THIS
PROSPECTUS SUPPLEMENT AND THE ACCOMPANYING PROSPECTUS
We provide information to you about the offered certificates in two separate documents that progressively provide more detail: (a) the accompanying prospectus, which provides general information, some of which may not apply to the offered certificates and (b) this prospectus supplement, which describes the specific terms of the offered certificates. You should read both this prospectus supplement and the prospectus before investing in any of the offered certificates.
You should rely only on the information contained in this prospectus supplement and the accompanying prospectus. We have not authorized anyone to provide you with information that is different. The information in this document may only be accurate as of the date of this document. If the descriptions of the offered certificates vary between the accompanying prospectus and this prospectus supplement, you should rely on the information in this prospectus supplement.
This prospectus supplement begins with several introductory sections describing the offered certificates and the trust fund in abbreviated form:
| • | SUMMARY OF PROSPECTUS SUPPLEMENT, commencing on page S-6 of this prospectus supplement, which gives a brief introduction of the key features of the offered certificates and a description of the mortgage loans included in the trust fund; and |
| • | RISK FACTORS, commencing on page S-54 of this prospectus supplement, which describes risks that apply to the offered certificates which are in addition to those described in the accompanying prospectus. |
This prospectus supplement and the accompanying prospectus include cross references to sections in these materials where you can find further related discussions. The Table of Contents in this prospectus supplement and the accompanying prospectus identify the pages where these sections are located.
You can find a listing of the pages where capitalized terms used in this prospectus supplement are defined under the caption ‘‘INDEX OF DEFINED TERMS’’ beginning on page S-218 in this prospectus supplement.
In this prospectus supplement, the terms ‘‘depositor,’’ ‘‘we,’’ ‘‘us’’ and ‘‘our’’ refer to Wachovia Commercial Mortgage Securities, Inc.
We do not intend this prospectus supplement and the accompanying prospectus to be an offer or solicitation:
| • | if used in a jurisdiction in which such offer or solicitation is not authorized; |
| • | if the person making such offer or solicitation is not qualified to do so; or |
| • | if such offer or solicitation is made to anyone to whom it is unlawful to make such offer or solicitation. |
This prospectus supplement and the accompanying prospectus may be used by us, Wachovia Capital Markets, LLC, our affiliate, and any other of our affiliates when required under the federal securities laws in connection with offers and sales of offered certificates in furtherance of market-making activities in offered certificates. Wachovia Capital Markets, LLC or any such other affiliate may act as principal or agent in these transactions. Sales will be made at prices related to prevailing market prices at the time of sale or otherwise.
S-1
EUROPEAN ECONOMIC AREA
In relation to each Member State of the European Economic Area which has implemented the Prospectus Directive (as defined below) (each, a ‘‘Relevant Member State’’), each underwriter has represented and agreed that with effect from and including the date on which the Prospectus Directive is implemented in that Relevant Member State (the ‘‘Relevant Implementation Date’’) it has not made and will not make an offer of certificates to the public in that Relevant Member State prior to the publication of a prospectus in relation to the certificates which has been approved by the competent authority in that Relevant Member State or, where appropriate, approved in another Relevant Member State and notified to the competent authority in that Relevant Member State, all in accordance with the Prospectus Directive, except that it may, with effect from and including the Relevant Implementation Date, make an offer of certificates to the public in that Relevant Member State at any time:
(a) to legal entities which are authorized or regulated to operate in the financial markets or, if not so authorized or regulated, whose corporate purpose is solely to invest in securities;
(b) to any legal entity which has two or more of (1) an average of at least 250 employees during the last financial year; (2) a total balance sheet of more than €43,000,000; and (3) an annual net turnover of more than €50,000,000, as shown in its last annual or consolidated accounts; or
(c) in any other circumstances which do not require the publication by the issuer of a prospectus pursuant to Article 3 of the Prospectus Directive.
For the purposes of this provision, the expression an ‘‘offer of certificates to the public’’ in relation to any certificates in any Relevant Member State means the communication in any form and by any means of sufficient information on the terms of the offer and the certificates to be offered so as to enable an investor to decide to purchase or subscribe the certificates, as the same may be varied in that Member State by any measure implementing the Prospectus Directive in that Member State and the expression ‘‘Prospectus Directive’’ means Directive 2003/71/EC and includes any relevant implementing measure in each Relevant Member State.
UNITED KINGDOM
Each underwriter has represented and agreed that:
(a) it has only communicated or caused to be communicated and will only communicate or cause to be communicated an invitation or inducement to engage in investment activity (within the meaning of Section 21 of the Financial Services and Markets Act 2000 (the ‘‘FSMA’’)) received by it in connection with the issue or sale of the certificates in circumstances in which Section 21(1) of the FSMA does not apply to the issuer; and
(b) it has complied and will comply with all applicable provisions of the FSMA with respect to anything done by it in relation to the certificates in, from or otherwise involving the United Kingdom.
NOTICE TO UNITED KINGDOM INVESTORS
The distribution of this prospectus if made by a person who is not an authorized person under the FSMA, is being made only to, or directed only at persons who (1) are outside the United Kingdom, or (2) have professional experience in matters relating to investments, or (3) are persons falling within Article 49(2)(a) through (d) (‘‘high net worth companies, unincorporated associations, etc.’’) or 19 (Investment Professionals) of the Financial Services and Market Act 2000 (Financial Promotion) Order 2005 (all such persons together being referred to as the ‘‘Relevant Persons’’). This prospectus must not be acted on or relied on by persons who are not Relevant Persons. Any investment or investment activity to which this prospectus relates, including the offered certificates, i s available only to Relevant Persons and will be engaged in only with Relevant Persons.
Potential investors in the United Kingdom are advised that all, or most, of the protections afforded by the United Kingdom regulatory system will not apply to an investment in the offered certificates and that compensation will not be available under the United Kingdom Financial Services Compensation Scheme.
S-2
(Footnotes to table on the front cover)
| (1) | Subject to a permitted variance of plus or minus 5.0%. |
| (2) | The ‘‘Assumed Final Distribution Date’’ has been determined on the basis of the assumptions set forth in ‘‘DESCRIPTION OF THE CERTIFICATES—Assumed Final Distribution Date: Rated Final Distribution Date’’ in this prospectus supplement and a 0% CPR (as defined in ‘‘YIELD AND MATURITY CONSIDERATIONS—Weighted Average Life’’ in this prospectus supplement). The ‘‘Rated Final Distribution Date’’ is the distribution date to occur in June 2049. See ‘‘DESCRIPTION OF THE CERTIFICATES—Assumed Final Distribution Date: Rated Final Distribution Date’’ and ‘‘RATINGS’’ in this prospectus supplement. |
| (3) | By each of Standard & Poor’s Ratings Services, a division of The McGraw-Hill Companies Inc. and Moody’s Investors Service, Inc. See ‘‘RATINGS’’ in this prospectus supplement. |
| (4) | The Class A-2 certificate pass-through rate for any distribution date will be equal to the applicable weighted average net mortgage rate minus 0.005%. |
| (5) | The pass-through rate applicable to each of the Class A-PB, Class A-3, Class A-1A, Class A-J, Class B, Class C, Class D, Class E and Class F certificates for any distribution date will be equal to the applicable weighted average net mortgage rate calculated as described in this prospectus supplement for the related date. |
| (6) | It is expected that approximately $375 million of the initial Certificate Balance of the Class A-3 Certificates will be sold on the Closing Date to Wachovia Capital Markets, LLC or an affiliate. Wachovia Capital Markets, LLC is one of the underwriters and also an affiliate of the Depositor. It is anticipated such Class A-3 Certificates will thereafter be sold for inclusion in a collateralized debt obligation transaction. |
| (7) | The Class IO certificates will not have certificate balances and their holders will not receive distributions of principal, but such holders are entitled to receive payments of the aggregate interest accrued on the notional amount of the Class IO certificates, as described in this prospectus supplement. The interest rate applicable to the Class IO certificates for each distribution date will be as described in this prospectus supplement. See ‘‘DESCRIPTION OF THE CERTIFICATES—Pass-Through Rates’’ in this prospectus supplement. |
S-3
TABLE OF CONTENTS
S-4
| ANNEX A-1 | Certain Characteristics of the Mortgage Loans and Mortgaged Properties | A-1 | |||||||
| ANNEX A-2 | Certain Information Regarding Multifamily Mortgaged Properties | A-2 | |||||||
| ANNEX A-3 | Reserve Account Information | A-3 | |||||||
| ANNEX A-4 | Commercial Tenant Schedule | A-4 | |||||||
| ANNEX A-5 | Certain Characteristics of the Mortgage Loans and Mortgaged Properties (Crossed and Portfolios) | A-5 | |||||||
| ANNEX A-6 | Debt Service Payment Schedule for the Siena Office Park Mortgage Loan | A-6 | |||||||
| ANNEX B | Certain Mortgage Pool Information | B-1 | |||||||
| ANNEX C | Form of Distribution Date Statement | C-1 | |||||||
| ANNEX D | Top Twenty Large Loan Summaries | D-1 | |||||||
| ANNEX E | Loan Group 1 Short-Term Collateral Summary | E-1 | |||||||
| ANNEX F | Class A-PB Planned Principal Balance Schedule | F-1 |
S-5
Summary of Prospectus Supplement
| • | This summary highlights selected information from this prospectus supplement and does not contain all of the information that you need to consider in making your investment decision. To understand the terms of the offered certificates, you must carefully read this entire prospectus supplement and the accompanying prospectus. |
| • | This summary provides an overview of certain calculations, cash flows and other information to aid your understanding and is qualified by the full description of these calculations, cash flows and other information in this prospectus supplement and the accompanying prospectus. |
| • | We provide information in this prospectus supplement on the certificates that are not offered by this prospectus supplement only to enhance your understanding of the offered certificates. We are not offering the non-offered certificates pursuant to this prospectus supplement. |
| • | For purposes of making distributions to the Class A-1, Class A-2, Class A-PB, Class A-3 and Class A-1A certificates and the A-4FL regular interest, the pool of mortgage loans will be deemed to consist of 2 distinct loan groups, loan group 1 and loan group 2. |
| • | Unless otherwise stated, all percentages of the mortgage loans included in the trust fund, or of any specified group of mortgage loans included in the trust fund, referred to in this prospectus supplement are calculated using the aggregate principal balance of the mortgage loans included in the trust fund as of the cut-off date (which is June 1, 2007, with respect to 2 mortgage loans, June 7, 2007, with respect to 1 mortgage loan, June 7, 2007, the origination date for 1 mortgage loan and June 11, 2007, with respect to 138 mortgage loans), after giving effect to payments due on or before such date whether or not received. The cut-off date balance of each mortgage loan included in the trust fund and each cut-off date ce rtificate balance in this prospectus supplement assumes the timely receipt of principal scheduled to be paid (if any) on each mortgage loan and no defaults, delinquencies or prepayments on any mortgage loan on or before the related cut-off date. Percentages of mortgaged properties are references to the percentages of the aggregate principal balance of all the mortgage loans included in the trust fund, or of any specified group of mortgage loans included in the trust fund, as of the cut-off date represented by the aggregate principal balance of the related mortgage loans as of the cut-off date. |
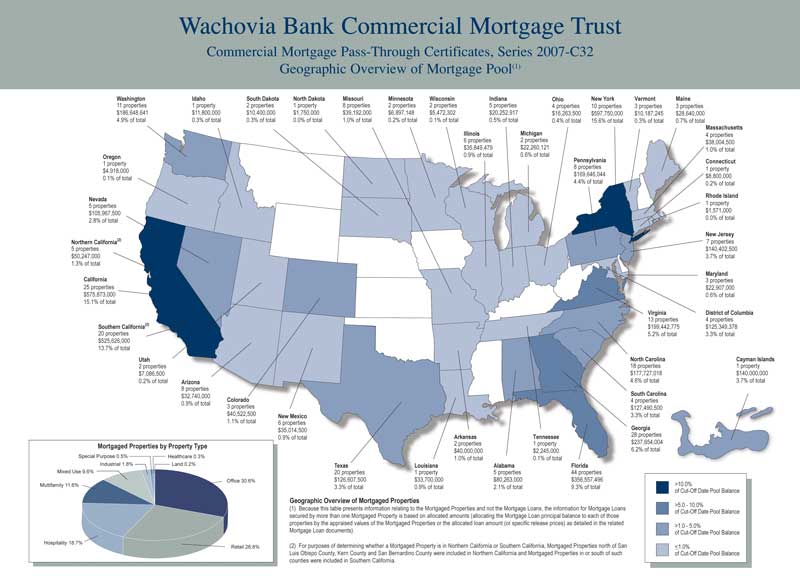
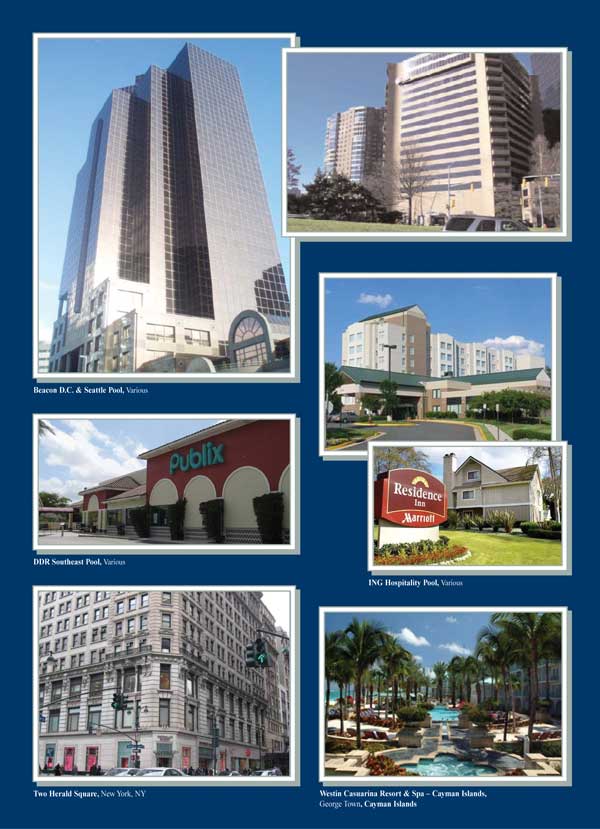
| • | Three (3) mortgage loans, the Beacon D.C. & Seattle Pool mortgage loan, the ING Hospitality Pool mortgage loan and the DDR Southeast Pool mortgage loan, are part of a split loan structure where the companion loan(s) that are part of the split loan structure are pari passu in right of entitlement to payment with the mortgage loan. Certain other mortgage loans are each part of a split loan structure in which the related companion loan(s) are subordinate to the related mortgage loa n. Amounts attributable to any companion loan will not be assets of the trust fund and will be beneficially owned by the holder of such companion loan. |
| • | All numerical or statistical information concerning the mortgage loans included in the trust fund is provided on an approximate basis and excludes information on the subordinate companion loans. |
S-6
Overview of the Certificates
The table below lists certain summary information concerning the Wachovia Bank Commercial Mortgage Trust, Commercial Mortgage Pass-Through Certificates, Series 2007-C32, which we are offering pursuant to the accompanying prospectus and this prospectus supplement. Each certificate represents an interest in the mortgage loans included in the trust fund and the other assets of the trust fund. The table also describes the certificates that are not offered by this prospectus supplement (other than the Class Z, Class R-I and Class R-II certificates) which have not been registered under the Securities Act of 1933, as amended, and which will be sold to investors in private transactions.
| Class | Closing Date Certificate Balance or Notional Amount(1) | Percentage of Cut-Off Date Pool Balance | Credit Support | Pass-Through Rate Description | Initial Pass- Through Rate | Weighted Average Life (years)(2) | Cash Flow or Principal Window (Mon./Yr.)(2) | Expected Moody’s/S&P Rating(3) | ||||||||||||||||||||||||||||
| Class A-1 | $ | 25,707,000 | 0.672 | % | 30.000 | % | Fixed | 5.686 | % | 3.04 | 07/07 - 03/12 | Aaa/AAA | ||||||||||||||||||||||||
| Class A-2 | $ | 946,379,000 | 24.749 | % | 30.000 | % | WAC(4) | 5.736 | % | 4.90 | 03/12 - 06/12 | Aaa/AAA | ||||||||||||||||||||||||
| Class A-PB | $ | 62,827,000 | 1.643 | % | 30.000 | % | WAC(5) | 5.741 | % | 7.29 | 06/12 - 02/17 | Aaa/AAA | ||||||||||||||||||||||||
| Class A-3(6) | $ | 948,589,000 | 24.807 | % | 30.000 | % | WAC(5) | 5.741 | % | 9.83 | 02/17 - 05/17 | Aaa/AAA | ||||||||||||||||||||||||
| Class A-1A | $ | 443,196,000 | 11.590 | % | 30.000 | % | WAC(5) | 5.741 | % | 8.59 | 07/07 - 05/17 | Aaa/AAA | ||||||||||||||||||||||||
| Class IO | $ | 3,823,853,068 | N/A | N/A | Variable IO(7) | 0.011 | % | (7) | (7) | Aaa/AAA | ||||||||||||||||||||||||||
| Class A-J | $ | 253,330,000 | 6.625 | % | 13.375 | % | WAC(5) | 5.741 | % | 9.96 | 06/17 - 06/17 | Aaa/AAA | ||||||||||||||||||||||||
| Class B | $ | 43,019,000 | 1.125 | % | 12.250 | % | WAC(5) | 5.741 | % | 9.96 | 06/17 - 06/17 | Aa1/AA+ | ||||||||||||||||||||||||
| Class C | $ | 47,798,000 | 1.250 | % | 11.000 | % | WAC(5) | 5.741 | % | 9.96 | 06/17 - 06/17 | Aa2/AA | ||||||||||||||||||||||||
| Class D | $ | 28,679,000 | 0.750 | % | 10.250 | % | WAC(5) | 5.741 | % | 10.04 | 06/17 - 07/17 | Aa3/AA− | ||||||||||||||||||||||||
| Class E | $ | 28,679,000 | 0.750 | % | 9.500 | % | WAC(5) | 5.741 | % | 10.05 | 07/17 - 07/17 | A1/A+ | ||||||||||||||||||||||||
| Class F | $ | 38,238,000 | 1.000 | % | 8.500 | % | WAC(5) | 5.741 | % | 10.05 | 07/17 - 07/17 | A2/A | ||||||||||||||||||||||||
| Class A-4FL(8) | $ | 250,000,000 | 6.538% | 30.000 | % | Floating | LIBOR + 0.175% | (9) | (9) | Aaa/AAA | ||||||||||||||||||||||||||
| Class A-MFL(8) | $ | 382,385,000 | 10.000% | 20.000 | % | Floating | LIBOR + 0.220% | (9) | (9) | Aaa/AAA | ||||||||||||||||||||||||||
| Class G | $ | 43,018,000 | 1.125 | % | 7.375 | % | WAC(5) | 5.741 | % | (9) | (9) | A3/A− | ||||||||||||||||||||||||
| Class H | $ | 47,799,000 | 1.250 | % | 6.125 | % | WAC(5) | 5.741 | % | (9) | (9) | Baa1/BBB+ | ||||||||||||||||||||||||
| Class J | $ | 52,578,000 | 1.375 | % | 4.750 | % | WAC(5) | 5.741 | % | (9) | (9) | Baa2/BBB | ||||||||||||||||||||||||
| Class K | $ | 33,458,000 | 0.875 | % | 3.875 | % | WAC(5) | 5.741 | % | (9) | (9) | Baa3/BBB− | ||||||||||||||||||||||||
| Class L | $ | 19,120,000 | 0.500 | % | 3.375 | % | Fixed(10) | 5.666 | % | (9) | (9) | Ba1/BB+ | ||||||||||||||||||||||||
| Class M | $ | 9,559,000 | 0.250 | % | 3.125 | % | Fixed(10) | 5.666 | % | (9) | (9) | Ba2/BB | ||||||||||||||||||||||||
| Class N | $ | 14,340,000 | 0.375 | % | 2.750 | % | Fixed(10) | 5.666 | % | (9) | (9) | Ba3/BB− | ||||||||||||||||||||||||
| Class O | $ | 9,559,000 | 0.250 | % | 2.500 | % | Fixed(10) | 5.666 | % | (9) | (9) | B1/B+ | ||||||||||||||||||||||||
| Class P | $ | 9,560,000 | 0.250 | % | 2.250 | % | Fixed(10) | 5.666 | % | (9) | (9) | B2/B | ||||||||||||||||||||||||
| Class Q | $ | 9,560,000 | 0.250 | % | 2.000 | % | Fixed(10) | 5.666 | % | (9) | (9) | B3/B− | ||||||||||||||||||||||||
| Class S | $ | 76,476,068 | 2.000 | % | 0.000 | % | Fixed(10) | 5.666 | % | (9) | (9) | NR/NR | ||||||||||||||||||||||||
| (1) | Subject to a permitted variance of plus or minus 5.0%. |
| (2) | Based on no prepayments and the other assumptions set forth under ‘‘YIELD AND MATURITY CONSIDERATIONS—Weighted Average Life’’ in this prospectus supplement. |
| (3) | By each of Moody’s Investors Service, Inc. and Standard & Poor’s Ratings Services, a division of The McGraw-Hill Companies, Inc. See ‘‘RATINGS’’ in this prospectus supplement. |
| (4) | The Class A-2 certificate pass-through rate for any distribution date will be equal to the applicable weighted average net mortgage rate minus 0.005%. |
| (5) | The pass-through rate applicable to each of the Class A-PB, Class A-3, Class A-1A, Class A-J, Class B, Class C, Class D, Class E, Class F, Class G, Class H, Class J and Class K certificates for any distribution date will be equal to the applicable weighted average net mortgage rate (calculated as described in this prospectus supplement) for the related date. |
| (6) | It is expected that approximately $375 million of the initial certificate balance of the Class A-3 certificates will be sold on the closing date to Wachovia Capital Markets, LLC or an affiliate. Wachovia Capital Securities, LLC is one of the underwriters and also an affiliate of the depositor. It is anticipated such Class A-3 certificates will thereafter be sold for inclusion in a collateralized debt obligation transaction. |
S-7
| (7) | The Class IO certificates will not have certificate balances and their holders will not receive distributions of principal, but such holders are entitled to receive payments of the aggregate interest accrued on the notional amount of the Class IO certificates, as described in this prospectus supplement. The interest rate applicable to the Class IO certificates for each distribution date will be as described in this prospectus supplement. See ‘‘DESCRIPTION OF THE CERTIFICATES—Pass-Through Rates’’ in this prospectus supplement. |
| (8) | Not offered by this prospectus supplement. The Issuer is separately offering to private investors in a private offering one or more component certificates or other interests based on the Class A-4FL regular interest and the Class A-MFL regular interest, respectively. |
| (9) | Not offered by this prospectus supplement. Any information we provide herein regarding the terms of these certificates is provided only to enhance your understanding of the offered certificates. |
| (10) | The pass-through rate applicable to each of the Class L, Class M, Class N, Class O, Class P, Class Q and Class S certificates for any distribution date will be subject to a maximum rate equal to the applicable weighted average net mortgage rate (calculated as described in this prospectus supplement) for the related date. |
S-8
The Parties
| The Trust Fund | The trust fund will be created on or about the closing date pursuant to a pooling and servicing agreement, dated as of June 1, 2007, by and among the depositor, the master servicer, the special servicer and the trustee. | |
| The Depositor | Wachovia Commercial Mortgage Securities, Inc. We are a wholly owned subsidiary of Wachovia Bank, National Association, which is one of the mortgage loan sellers, a sponsor, the master servicer, the swap counterparty and an affiliate of one of the underwriters. Our principal executive office is located at 301 South College Street, Charlotte, North Carolina 28288-0166 and our telephone number is (704) 374-6161. Neither we nor any of our affiliates have insured or guaranteed the offered certificates. For more detailed information, see ‘‘THE DEPOSITOR’’ in the accompanying prospectus. | |
| On the closing date, we will sell the mortgage loans and related assets to be included in the trust fund to the trustee to create the trust fund. | ||
| The Issuing Entity | A common law trust, created under the laws of the State of New York, to be established on the closing date under the pooling and servicing agreement. The issuing entity is also sometimes referred to herein as the trust fund. For more detailed information, see ‘‘DESCRIPTION OF THE CERTIFICATES—The Issuing Entity’’ in this prospectus supplement and the accompanying prospectus. | |
| The Sponsors | Each of Wachovia Bank, National Association and Artesia Mortgage Capital Corporation is a sponsor for this transaction. For more information, see ‘‘DESCRIPTION OF THE MORTGAGE POOL—The Sponsors’’ in this prospectus supplement and ‘‘THE SPONSOR’’ in the accompanying prospectus. | |
| The Mortgage Loan Sellers | Each of the sponsors will be a mortgage loan seller for this transaction. For more information, see ‘‘DESCRIPTION OF THE MORTGAGE POOL—The Mortgage Loan Sellers’’ in this prospectus supplement. Wachovia Bank, National Association is the master servicer, a sponsor, the swap counterparty and is an affiliate of the depositor and one of the underwriters. The mortgage loan sellers will sell and assign to us on the closing date the mortgage loans to be included in the trust fund. See ‘‘DESCRIPTION OF THE MORTGAGE POOL—Representations and Warranties: Repurchases and Substitutions’’ in this prospectus supplement. | |
S-9
Mortgage Loans by Mortgage Loan Seller
| Mortgage Loan Seller | Number of Mortgage Loans | Aggregate Cut-Off Date Balance | Percentage of Cut-Off Date Pool Balance | Percentage of Cut-Off Date Group 1 Balance | Percentage of Cut-Off Date Group 2 Balance | |||||||||||||||||||||||||
| Wachovia Bank, National Association | 125 | $ | 3,742,335,069 | 97.9 | % | 98.2 | % | 95.3 | % | |||||||||||||||||||||
| Artesia Mortgage Capital Corporation | 17 | 81,518,000 | 2.1 | 1.8 | 4.7 | |||||||||||||||||||||||||
| Total | 142 | $ | 3,823,853,069 | 100.0 | % | 100.0 | % | 100.0 | % | |||||||||||||||||||||
| The Master Servicer | Wachovia Bank, National Association. Wachovia Bank, National Association is one of the mortgage loan sellers, a sponsor, the swap counterparty and an affiliate of the depositor and one of the underwriters. The master servicer will be primarily responsible for collecting payments and gathering information with respect to the mortgage loans included in the trust fund and the companion loans which are not part of the trust fund; provided, however, the Beacon D.C. & Seattle Pool whole loan will be serviced under the pooling and servicing agreement entered into in connection with the issuance of the Morgan Stanley Capital I Trust, Commercial Mortgage Pass-Through Certificates, Series 2007-IQ14. The master servicer under the Morgan Stanley Capital I Trust, Commercial Mortgage Pass-Through Certificates, Series 2007-IQ14 pooling and servicing agreement is Wells Fargo Bank, N.A.; provided, further, that upon the securitization of the DDR Southeast Pool pari passu Note A-1 companion loan, the DDR Southeast Pool whole loan will be serviced under the pooling and servicing agreement governing such securitization. The securitization of the DDR Southeast Pool pari passu Note A-1 companion loan is expected to occur in co nnection with the Citigroup Commercial Mortgage Trust, Commercial Mortgage Pass-Through Certificates, and the pooling and servicing agreement governing such securitization is anticipated to have terms substantially similar to the pooling and servicing agreement entered into in connection with the issuance of the CD 2007-CD4 Commercial Mortgage Trust Commercial Mortgage Pass-Through Certificates, Series 2007-CD4. The master servicer with respect to the DDR Southeast Pool mortgage loan under the Citigroup Commercial Mortgage Trust, Commercial Mortgage Pass-Through Certificates, Series 2007-C6 pooling and servicing agreement is expected to be Wachovia Bank, National Association. | |
| See ‘‘SERVICING OF THE MORTGAGE LOANS—The Master Servicer’’ in this prospectus supplement. | ||
| The Special Servicer | Initially, CWCapital Asset Management LLC. The special servicer will be responsible for performing certain servicing functions with respect to the mortgage loans included in the | |
S-10
| trust fund and the companion loans which are not part of the trust fund that, in general, are in default or as to which default is imminent; provided, however, the Beacon D.C. & Seattle Pool whole loan will be specially serviced (during those periods where special servicing is required) under the pooling and servicing agreement entered into in connection with the issuance of the Morgan Stanley Capital I Trust, Commercial Mortgage Pass-Through Certificates, Series 2007-IQ14. The special servicer under the Morgan Stanley Capital I Trust, Commercial Mortgage Pass-Through Certificates, Series 2007-IQ14 pooling and servicing agreement is ARCap Special Servicing Inc.; provided, further, that upon the settlement of the Citigroup Commercial Mortgage Trust, Commercial Mortgage Pass-Through Certificates, Series 2007-C6, it is expected that the DDR Southeast Pool whole loan will be specially serviced (during those periods where special servicing is required) under the pooling and servicing agreement entered into in connection with the issuance of those certificates. The special servicer under the Citigroup Commercial Mortgage Trust, Commercial Mortgage Pass-Through Certificates, Series 2007-C6 pooling and servicing agreement is expected to be LNR Partners, Inc. | ||
| Some holders of certificates (initially the holder of the Class S certificates with respect to each mortgage loan other than the Beacon D.C. & Seattle Pool mortgage loan and the DDR Southeast Pool mortgage loan) will have the right to replace the special servicer and to select a representative who may advise and direct the special servicer and whose approval is required for certain actions by the special servicer under certain circumstances. With respect to the Beacon D.C. & Seattle Pool mortgage loan, the special servicer may be removed at any time, with or without cause, but only with the consent of the holders of the Beacon D.C. & Seattle Pool mortgage loan and the related pari passu companion loans that collectively represent a majority of the aggregate unpaid principal balance of the Beacon D.C. & Seattle Pool whole loan, subject to certain conditions as set forth in the related intercreditor agreement. With respect to the DDR Southeast Pool mortgage loan, the special servicer may be removed at any time, with or without cause, by the holder of the DDR Southeast Pool pari passu Note A-1 companion loan, or the controlling class representative of the securitization in which such pari passu note is included, after consultation with the holders of the DDR Southeast Pool mortgage loan and the other related pari passu companion loan, subject to certain conditions as set forth in the related intercreditor agreement. See ‘‘SERVICING OF THE MORTGAGE LOANS—The Special Servicer’’ and ‘‘—The Controlling Class Representative’’ in this prospectus supplement. | ||
S-11
| The Trustee | Wells Fargo Bank, N.A. The trustee will be responsible for (among other things) distributing payments to certificateholders and delivering to certificateholders certain reports on the mortgage loans included in the trust fund and the certificates. See ‘‘DESCRIPTION OF THE CERTIFICATES—The Trustee’’ in this prospectus supplement. The trustee under the Morgan Stanley Capital I Trust, Commercial Mortgage Pass-Through Certificates, Series 2007-IQ14 pooling and servicing agreement is the Bank of New York. The trustee under the Citigroup Commercial Mortgage Trust, Commercial Mortgage Pass-Through Certificates, Series 2007-C6 pooling and servicing agreement is expected to be Wells Fargo Bank, N.A. | |
| The Swap Counterparty | Wachovia Bank, National Association. Wachovia Bank, National Association is one of the mortgage loan sellers, a sponsor, the master servicer, an affiliate of one of the underwriters and an affiliate of the depositor. | |
| The Underwriters | Wachovia Capital Markets, LLC, Barclays Capital Inc. and Goldman, Sachs & Co. It is intended that Wachovia Securities International Limited will act as a member of the selling group on behalf of Wachovia Capital Markets, LLC and may sell offered certificates on behalf of Wachovia Capital Markets, LLC in certain jurisdictions. Wachovia Capital Markets, LLC is an affiliate of the depositor and of Wachovia Bank, National Association, which is the master servicer, a sponsor, the swap counterparty and one of the mortgage loan sellers. See ‘‘RISK FACTORS—The Offered Certificates—Potential Conflicts of Interest’’ in this prospectus supplement. Wachovia Capital Markets, LLC is acting as sole lead manager for this offering. Wachovia Capital Markets, LLC, Barclays Capital Inc. and Goldman, Sachs & Co. are acting as co-managers for this offering. Wachovia Capital Markets, LLC is acting as sole bookrunner with respect to the offered certificates. It is expected that approximately $375 million of the initial certificate balance of the Class A-3 Certificates will be sold on the closing date to Wachovia Capital Markets, LLC or an affiliate. Wachovia Capital Markets, LLC is one of the underwriters and also an affiliate of the Depositor. It is anticipated such Class A-3 Certificates will thereafter be sold for inclusion in a collateralized debt obligation transaction. | |
| Certain Affiliations | Wachovia Bank, National Association and its affiliates are playing several roles in this transaction. Wachovia Bank, National Association is a mortgage loan seller, the master servicer, the swap counterparty and a sponsor. Wachovia Commercial Mortgage Securities, Inc. is the depositor and a wholly owned subsidiary of Wachovia Bank, National Association. Wachovia Bank, National Association and Artesia Mortgage Capital Corporation originated or acquired the mortgage loans and will be selling them to the depositor. | |
S-12
| Wachovia Bank, National Association is also an affiliate of Wachovia Capital Markets, LLC, an underwriter for the offering of the certificates. These roles and other potential relationships may give rise to conflicts of interest as further described under ‘‘RISK FACTORS—The Offered Certificates —Potential Conflicts of Interest’’ in this prospectus supplement. | ||
| Significant Obligor | The mortgaged property described in Annex D and in ‘‘DESCRIPTION OF THE MORTGAGE POOL—Twenty Largest Mortgage Loans’’ securing the Beacon D.C. & Seattle Pool mortgage loan, representing 10.8% of the mortgage pool (12.2% of loan group 1) is a ‘‘significant obligor’’ with respect to this offering. The borrowers under the Beacon D.C. & Seattle Pool mortgage loan are Liberty Place Property LLC, 1627 Eye Street Property LLC, Lafayette Centre Property LLC, Market Square Associates, Cornerstone Market Square LLC, Cornerstone Market Square II LLC, Market Square Lender LLC, 11111 Sunset Hills Property LLC, 1616 North Fort Myer Drive Property LLC, American Center Property LLC, 8251 Greensboro Drive Property LLC, Marshall Property LLC, Polk And Taylor Property LLC, City Center Bellevue Property LLC, Eastgate Office Park Property LLC, Lincoln Executive Center Property LLC, Plaza Center Property LLC, Plaza East Property LLC, Sunset North Corporate Campus Property LLC, 999 Third Avenue Property LLC, WA-Three Bellevue Center, L.L.C., WA-1201 Third Avenue, L.L.C., 1300 North Seventeenth Street Holding LLC and Reston Town Center Holding LLC. See ‘‘DESCRIPTION OF THE MORTGAGE POOL—Significant Obligors’’, ‘‘—Twenty Largest Mortgage Loans’’ in this prospectus supplement and the description of the Beacon D.C. & Seattle Pool mortgage loan in Annex D to this prospectus supplement. | |
S-13
Transaction Overview
On the closing date, the mortgage loan sellers will sell the mortgage loans to the depositor, which will in turn deposit them into a common law trust created on the closing date. The trust fund, which will be the issuing entity, will be formed by a pooling and servicing agreement, to be dated as of June 1, 2007, among the depositor, the master servicer, the special servicer and the trustee. The master servicer will service the mortgage loans (other than the specially serviced mortgage loans and the Beacon D.C. & Seattle Pool whole loan (which will be serviced pursuant to the Morgan Stanley Capital I Trust Commercial Mortgage Pass-Through Certificates, Series 2007-IQ14 pooling and servicing agreement) and, after the securitization of the DDR Southeast Pool pari passu Note A-1 companion loan, the DDR Southeast Pool loan (which is expected to be serviced pursuant to the pooling and servicing agreement entered into in connection with the securitization of t he DDR Southeast Pool pari passu Note A-1 companion loan, which is expected to be substantially similar to the CD 2007-CD4 Commercial Mortgage Trust pooling and servicing agreement)) in accordance with the pooling and servicing agreement and provide the information to the trustee necessary for the trustee to calculate distributions and other information regarding the certificates.
The transfers of the mortgage loans from the sponsors/mortgage loan sellers to the depositor and from the depositor to the issuing entity in exchange for the certificates are illustrated below:
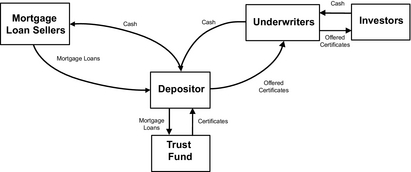
S-14
Important Dates and Periods
| Closing Date | On or about June 28, 2007. | |
| Cut-Off Date | For 138 mortgage loans, representing 80.7% of the mortgage pool (109 mortgage loans in loan group 1 or 78.2% and all of the mortgage loans in loan group 2), June 11, 2007, for 2 mortgage loans, representing 2.7% of the mortgage pool (3.0% of loan group 1), June 1, 2007, for 1 mortgage loan, representing 10.8% of the mortgage pool (12.2% of loan group 1), June 7, 2007 and for 1 mortgage loan, representing 5.8% of the mortgage pool (6.5% of loan group 1), its origination date of June 7, 2007. The cut-off date balance of each mortgage loan included in the trust fund and each cut-off date certificate balance in this prospectus supplement assumes the timely receipt of principal scheduled to be paid (if any) on each mortgage loan and no defaults, delinquencies or prep ayments on any mortgage loan on or before the related cut-off date. | |
| Distribution Date | The fourth business day following the related determination date, commencing in July 2007. | |
| Determination Date | The 11th day of each month, or if such 11th day is not a business day, the next succeeding business day, commencing in July 2007. | |
| Collection Period | For any distribution date, the period beginning on the 12th day in the immediately preceding month (or the day after the applicable cut-off date in the case of the first collection period) through and including the 11th day of the month in which the distribution date occurs. Notwithstanding the foregoing, in the event that the last day of a collection period is not a business day, any payments with respect to the mortgage loans which relate to such collection period and are received on the business day immediately following such last day will be deemed to have been received during such collection period and not during any other collection period, and in the event that the payment date (after giving effect to any grace period) related to any distribution date occurs after the related col lection period, any amounts received on that payment date (after giving effect to any grace period) will be deemed to have been received during the related collection period and not during any other collection period. | |
S-15
The Certificates
| Offered Certificates | We are offering to you the following 12 classes of certificates of our Commercial Mortgage Pass-Through Certificates, Series 2007-C32 pursuant to this prospectus supplement: | |
| Class A-1 Class A-2 Class A-PB Class A-3 Class A-1A Class IO Class A-J Class B Class C Class D Class E Class F | |||
| Priority of Distributions | On each distribution date, the owners of the certificates will be entitled to distributions of payments or other collections on the mortgage loans that the master servicer collected or that the master servicer and/or the trustee advanced during or with respect to the related collection period after deducting certain fees and expenses. For purposes of making certain distributions to the Class A-1, Class A-2, Class A-PB, Class A-3 and Class A-1A certificates and the Class A-4FL regular interest, the mortgage pool will be deemed to consist of 2 loan groups: | |
| • | Loan group 1 will consist of all of the mortgage loans that are not secured by multifamily properties. | ||
| • | Loan group 2 will consist of all the mortgage loans that are secured by multifamily properties. | ||
| Annex A-1 to this prospectus supplement sets forth the loan group designation for each mortgage loan. | ||
| The trustee will distribute amounts to the extent that the money is available after the payment of fees and expenses of the master servicer, the special servicer, the trustee, the Morgan Stanley Capital I Trust, Commercial Mortgage Pass-Through Certificates, Series 2007-IQ14 master servicer and the master servicer with respect to the DDR Southeast Pool mortgage loan for the securitization of the DDR Southeast Pool pari passu Note A-1 companion loan, in the following order of priority: | ||
S-16
Interest, concurrently (i) pro rata, on the Class A-1, Class A-2, Class A-PB and Class A-3 certificates and the Class A-4FL regular interest from the portion of money available attributable to mortgage loans in loan group 1, (ii) on the Class A-1A certificates from the portion of money available attributable to mortgage loans in loan group 2, and (iii) on the Class IO certificates from any and all money attributable to the mortgage pool; provided, however, if on any distri bution date, the money available on such distribution date is insufficient to pay in full the total amount of interest to be paid to any of the classes as described above, money available with respect to the entire mortgage pool will be allocated among all those classes pro rata.
Principal on the Class A-PB certificates, up to the principal distribution amount related to loan group 1, until the certificate balance of the Class A-PB certificates is reduced to the planned principal balance set forth in the table on Annex F to this prospectus supplement, and, after the Class A-1A certificate balance has been reduced to zero, the principal distribution amount relating to loan group 2 remaining after payments to the Class A-1A certificates have been made, until the certificate balance of the Class A-PB certificates is reduced to the planned principal balance set forth in the table on Annex F to this prospectus supplement.
After distributions of principal have been made from the principal distribution amount relating to loan group 1 to the Class A-PB certificates as set forth in the priority immediately preceding, principal on the Class A-1 certificates, up to the remaining principal distribution amount relating to loan group 1 and, after the Class A-1A certificate balance has been reduced to zero, the principal distribution amount relating to loan group 2 remaining after payments to the Class A-1A and Class A-PB certificates have been made, until their certificate balance is reduced to zero.
S-17
After distributions of principal have been made from the principal distribution amount relating to loan group 1 to the Class A-PB and Class A-1 certificates as set forth in the immediately preceding priorities, principal on the Class A-2 certificates, up to the remaining principal distribution amount relating to loan group 1 and, after the Class A-1A certificate balance has been reduced to zero, the principal distribution amount relating to loan group 2 remaining after payments to the Class A-1A, Class A-PB and Class A-1 certificates have been made, until their certificate balance is reduced to zero.
After distributions of principal have been made from the principal distribution amount relating to loan group 1 to the Class A-PB, Class A-1 and Class A-2 certificates as set forth in the immediately preceding priorities, principal on the Class A-PB certificates, up to the remaining principal distribution amount relating to loan group 1 and, after the Class A-1A certificate balance has been reduced to zero, the principal distribution amount relating to loan group 2 remaining after payments to the Class A-1A, Class A-PB, Class A-1 and Class A-2 certificates have been made, until their certificate balance is reduced to zero.
After distributions of principal have been made from the principal distribution amount relating to loan group 1 to the Class A-PB, Class A-1 and Class A-2 certificates as set forth in the immediately preceding priorities, principal on the Class A-3 certificates, up to the remaining principal distribution amount relating to loan group 1 and, after the Class A-1A certificate balance has been reduced to zero, the principal distribution amount relating to loan group 2 remaining after payments to the Class A-1A, Class A-PB, Class A-1 and Class A-2 certificates have been made, until their certificate balance is reduced to zero.
S-18
After distributions of principal have been made from the principal distribution amount relating to loan group 1 to the Class A-PB, Class A-1, Class A-2 and Class A-3 certificates as set forth in the immediately preceding priorities, principal on the Class A-4FL regular interest, up to the remaining principal distribution amount relating to loan group 1 and, after the Class A-1A certificate balance has been reduced to zero, the principal distribution amount relating to loan group 2 remaining after payments to the Class A-1A, Class A-PB, Class A-1, Class A-2 and Class A-3 certificates have been made, until their certificate balance is reduced to zero.
Principal on the Class A-1A certificates, up to the principal distribution amount relating to loan group 2 and, after the certificate balances of the Class A-PB, Class A-1, Class A-2 and Class A-3 certificates and the Class A-4FL regular interest have been reduced to zero, the principal distribution amount relating to loan group 1 remaining after payments to the Class A-PB, Class A-1, Class A-2 and Class A-3 certificates and the Class A-4FL regular interest have been made, until their certificate balance is reduced to zero.
Reimbursement to the Class A-1, Class A-2, Class A-PB, Class A-3 and Class A-1A certificates and the Class A-4FL regular interest, pro rata, for any realized loss and trust fund expenses borne by such certificates or regular interest.
Interest on the Class A-MFL regular interest.
Principal on the Class A-MFL regular interest, up to the principal distribution amount, until its certificate balance is reduced to zero.
S-19
Reimbursement to the Class A-MFL regular interest for any realized losses and trust fund expenses borne by such regular interest.
Interest on the Class A-J certificates.
Principal on the Class A-J certificates, up to the principal distribution amount, until their certificate balance is reduced to zero.
Reimbursement to the Class A-J certificates for any realized losses and trust fund expenses borne by such class.
Interest on the Class B certificates.
Principal on the Class B certificates, up to the principal distribution amount, until their certificate balance is reduced to zero.
Reimbursement to the Class B certificates for any realized losses and trust fund expenses borne by such class.
Interest on the Class C certificates.
Principal on the Class C certificates, up to the principal distribution amount, until their certificate balance is reduced to zero.
Reimbursement to the Class C certificates for any realized losses and trust fund expenses borne by such class.
S-20
Interest on the Class D certificates.
Principal on the Class D certificates, up to the principal distribution amount, until their certificate balance is reduced to zero.
Reimbursement to the Class D certificates for any realized losses and trust fund expenses borne by such class.
Interest on the Class E certificates.
Principal on the Class E certificates, up to the principal distribution amount, until their certificate balance is reduced to zero.
Reimbursement to the Class E certificates for any realized losses and trust fund expenses borne by such class.
Interest on the Class F certificates.
Principal on the Class F certificates, up to the principal distribution amount, until their certificate balance is reduced to zero.
Reimbursement to the Class F certificates for any realized losses and trust fund expenses borne by such class.
| If, on any distribution date, the certificate balances of the Class A-J through Class S certificates and the Class A-MFL regular interest have been reduced to zero, but any two or more of the Class A-1, Class A-2, Class A-PB, Class A-3 and Class A-1A certificates and the Class A-4FL regular interest remain outstanding, distributions of principal (other than distributions of principal otherwise allocable to reduce the certificate balance of the Class A-PB certificates to the planned principal amount set forth in the table on Annex F to this prospectus supplement) and interest will be made, pro rata, to the o utstanding Class A-1, Class A-2, Class A-PB, | ||
S-21
| Class A-3 and Class A-1A certificates and the Class A-4FL regular interest. See ‘‘DESCRIPTION OF THE CERTIFICATES—Distributions’’ in this prospectus supplement. | ||
| No companion loan will be part of the trust fund, and amounts received with respect to any companion loan will not be available for distributions to holders of any certificates. | ||
| Interest | On each distribution date, each class of certificates (other than the Class Z, Class R-I and Class R-II certificates) and the Class A-4FL regular interest and the Class A-MFL regular interest will be entitled to receive: | |
| • | for each class of these certificates and the Class A-4FL regular interest and the Class A-MFL regular interest, one month’s interest at the applicable pass-through rate accrued during the applicable interest period, on the certificate balance or notional amount, as applicable, of each class of these certificates and the Class A-4FL regular interest and the Class A-MFL regular interest immediately prior to that distribution date; | ||
| • | plus any interest that this class of certificates or the Class A-4FL regular interest or the Class A-MFL regular interest was entitled to receive on all prior distribution dates to the extent not received; | ||
| • | minus (other than in the case of the Class IO certificates) that class’ share of any shortfalls in interest collections due to prepayments on mortgage loans included in the trust fund that are not offset by certain payments made by the master servicer; and | ||
| • | minus (other than in the case of the Class IO certificates) that class’ allocable share of any reduction in interest accrued on any mortgage loan as a result of a modification that reduces the related mortgage rate and allows the reduction in accrued interest to be added to the stated principal balance of the mortgage loan. | ||
| As reflected in the chart under ‘‘—Priority of Distributions’’ above, so long as funds are sufficient on any distribution date to make distributions of all interest on that distribution date to the Class A-1, Class A-2, Class A-PB and Class A-3 certificates and the Class A-4FL regular interest, interest distributions on the Class A-1, Class A-2, ClassA-PB and Class A-3 certificates and the Class A-4FL regular interest will be based upon amounts available relating to mortgage loans in loan group 1 and interest distributions on the Class A-1A certificates will be based upon amounts available relating to mortgage loans in loan group 2. | ||
S-22
| See ‘‘DESCRIPTION OF THE CERTIFICATES— Certificate Balances and Notional Amounts’’ and ‘‘—Distributions’’ in this prospectus supplement. | ||
| The Class IO certificates will be entitled to distributions of interest-only on their respective notional amounts. The notional amounts of each of these classes of certificates are calculated as described under ‘‘DESCRIPTION OF THE CERTIFICATES—Certificate Balances and Notional Amounts’’ in this prospectus supplement. | ||
| The Class IO certificates will accrue interest at a rate as described under ‘‘DESCRIPTION OF THE CERTIFICATES—Pass-Through Rates’’ in this prospectus supplement. | ||
| The certificates (other than the Class Z, Class R-I and Class R-II certificates) and the Class A-4FL regular interest and the Class A-MFL regular interest will accrue interest on the basis of a 360-day year consisting of twelve 30-day months. | ||
| The interest accrual period with respect to any distribution date and any class of certificates (other than the Class Z, Class R-I and Class R-II certificates) and the Class A-4FL regular interest and the Class A-MFL regular interest is the calendar month preceding the month in which such distribution date occurs. | ||
| As reflected in the chart under ‘‘—Priority of Distributions’’ beginning on page S-16 above, on each distribution date, the trustee will distribute interest to the holders of the offered certificates, the Class A-4FL regular interest and the Class A-MFL regular interest: | ||
| • | first, pro rata, to the Class IO, Class A-1, Class A-2, Class A-PB, Class A-3 and Class A-1A certificates and the Class A-4FL regular interest as described above under ‘‘—Priority of Distributions’’, and then to each other class of offered certificates and the Class A-MFL regular interest in order of priority of payment; and | ||
| • | only to the extent funds remain after the trustee makes all distributions of interest and principal required to be made on such date to each class of certificates or the Class A-4FL regular interest or the A-MFL regular interest with a higher priority of distribution. | ||
| Holders of offered certificates may, in certain circumstances, also receive distributions of prepayment premiums and yield maintenance charges collected on the mortgage loans included in the trust fund. These distributions are in addition to the distributions of principal and interest described above. See ‘‘DESCRIPTION OF THE CERTIFICATES— Distributions’’ in this prospectus supplement. | ||
S-23
| Pass-Through Rates | The pass-through rate for each class of certificates (other than the Class IO, Class Z, Class R-I and Class R-II certificates) on each distribution date is set forth above under ‘‘OVERVIEW OF THE CERTIFICATES’’ in this prospectus supplement. The pass-through rate of the Class A-4FL regular interest and Class A-MFL regular interest on each distribution date will be a per annum rate equal to 5.703%, subject to the applicable weighted average net mortgage rate. | |
| The pass-through rate applicable to the Class IO certificates for the initial distribution date will equal approximately 0.011% per annum. | ||
| The pass-through rate applicable to the Class IO certificates for each distribution date will, in general, equal the weighted average of the interest rates for the components for such distribution date (weighted on the basis of the respective component balances of such components outstanding immediately prior to such distribution date). The interest rate in respect of any component for any distribution date will, in general, equal the weighted average net mortgage rate for such distribution date, minus the pass-through rate applicable to the corresponding class of certificates or the Class A-4FL regular interest or Class A-MFL regular interest, as applicable (but in no event will any interest rate applicable to a component be less than zero). | ||
| The weighted average net mortgage rate for each distribution date is the weighted average of the net mortgage rates for the mortgage loans included in the trust fund as of the beginning of the related collection period, weighted on the basis of their respective stated principal balances immediately following the preceding distribution date; provided that, for the purpose of determining the weighted average net mortgage rate only, if the mortgage rate for any mortgage loan included in the trust fund has been modified in connection with a bankruptcy or similar proceeding involving the related borrower or a modification, waiver or amendment granted or ag reed to by the special servicer, the weighted average net mortgage rate for that mortgage loan will be calculated without regard to that event. The net mortgage rate for each mortgage loan included in the trust fund will generally equal: | ||
| • | the mortgage interest rate in effect for that mortgage loan as of the closing date; minus | ||
| • | the applicable administrative cost rate, as described in this prospectus supplement. | ||
| Any increase in the interest rate of a mortgage loan as a result of not repaying the outstanding principal amount of such mortgage loan by the related anticipated repayment date will be disregarded for purposes of calculating the net mortgage rate. | ||
S-24
| For the purpose of calculating the weighted average net mortgage rate, the mortgage rate of each mortgage loan will be deemed adjusted as described under ‘‘DESCRIPTION OF THE CERTIFICATES—Pass-Through Rates’’ in this prospectus supplement. | ||
| The stated principal balance of each mortgage loan included in the trust fund will generally equal the principal balance of that mortgage loan as of the cut-off date, reduced as of any date of determination (to not less than zero) by: | ||
| • | the portion of the principal distribution amount for the related distribution date that is attributable to that mortgage loan; and | ||
| • | the principal portion of any realized loss incurred in respect of that mortgage loan during the related collection period. | ||
| The stated principal balance of any mortgage loan as to which the mortgage rate is reduced through a modification may be increased in certain circumstances by the amount of the resulting interest reduction. See ‘‘DESCRIPTION OF THE CERTIFICATES—Pass-Through Rates’’ in this prospectus supplement. | ||
| Principal Distributions | On the closing date, each class of certificates (other than the Class IO, Class Z, Class R-I and Class R-II certificates) will have the certificate balance set forth above under ‘‘OVERVIEW OF THE CERTIFICATES’’. The certificate balance for each class of certificates and the Class A-4FL regular interest and the Class A-MFL regular interest entitled to receive principal may be reduced by: | |
| • | distributions of principal; and | ||
| • | allocations of realized losses and trust fund expenses. | ||
| The certificate balance or notional amount of a class of certificates and the Class A-4FL regular interest and the Class A-MFL regular interest may be increased in certain circumstances by the allocation of any increase in the stated principal balance of any mortgage loan resulting from the reduction of the related mortgage rate through modification. See ‘‘DESCRIPTION OF THE CERTIFICATES—Certificate Balances and Notional Amounts’’ in this prospectus supplement. | ||
| The Class IO certificates do not have a principal balance and will not receive distributions of principal. | ||
| As reflected in the chart under ‘‘—Priority of Distributions’’ above: | ||
| • | generally, the Class A-1, Class A-2, Class A-PB and Class A-3 certificates and Class A-4FL regular interest will only be entitled to receive distributions of principal | ||
S-25
| collected or advanced in respect of mortgage loans in loan group 1 until the certificate principal balance of the Class A-1A certificates has been reduced to zero, and the Class A-1A certificates will only be entitled to receive distributions of principal collected or advanced in respect of mortgage loans in loan group 2 until the certificate principal balances of the Class A-1, Class A-2, Class A-PB and Class A-3 certificates and the Class A-4FL regular interest have been reduced to zero; provided, however, the Class A-1 , Class A-2 and Class A-3 certificates and the Class A-4FL regular interest will not be entitled to distributions of principal from either loan group 1 or loan group 2 until the certificate principal balance of the Class A-PB certificates is reduced to the planned principal balance set forth on Annex F to this prospectus supplement; | |||
| • | principal is distributed to each class of certificates or the Class A-4FL regular interest or the Class A-MFL regular interest entitled to receive distributions of principal in the order described under ‘‘DESCRIPTION OF THE CERTIFICATES— Distributions’’ in this prospectus supplement; | ||
| • | principal is only distributed on a related class of certificates or the Class A-4FL regular interest or the Class A-MFL regular interest to the extent funds remain after the trustee makes all distributions of principal and interest on those classes of certificates or the Class A-4FL regular interest or the Class A-MFL regular interest with a higher priority of distribution as described under ‘‘DESCRIPTION OF THE CERTIFICATES— Distributions’’ in this prospectus supplement; | ||
| • | generally, no class of certificates or the Class A-4FL regular interest or the Class A-MFL regular interest is entitled to distributions of principal until the certificate balance of each class of certificates and the Class A-4FL regular interest and the Class A-MFL regular interest with a higher priority of distribution as described under ‘‘DESCRIPTION OF THE CERTIFICATES— Distributions’’ in this prospectus supplement has been reduced to zero; and | ||
| • | in no event will the holders of the Class A-J, Class B, Class C, Class D, Class E or Class F certificates, the Class A-MFL regular interest or the classes of non-offered certificates be entitled to receive any distributions of principal until the certificate balances of the Class A-1, Class A-2, Class A-PB, Class A-3 and Class A-1A certificates and the Class A-4FL regular interest have all been reduced to zero. | ||
S-26
| The amount of principal to be distributed for each distribution date generally will be an amount equal to: | ||
| • | the scheduled principal payments (other than balloon payments) due on the mortgage loans included in the trust fund during the related collection period whether or not those scheduled payments are actually received; | ||
| • | balloon payments actually received with respect to mortgage loans included in the trust fund during the related collection period; | ||
| • | prepayments received with respect to the mortgage loans included in the trust fund during the related collection period; and | ||
| • | all liquidation proceeds, insurance proceeds, condemnation awards and repurchase and substitution amounts received during the related collection period that are allocable to principal. | ||
| For purposes of making distributions to the Class A-1, Class A-2, Class A-PB, Class A-3 and Class A-1A certificates and the Class A-4FL regular interest, the principal distribution amount for each loan group on any distribution date will be equal to the sum of the collections specified above but only to the extent such amounts relate to the mortgage loans comprising the specified loan group. | ||
| However, if the master servicer or the trustee reimburses itself out of general collections on the mortgage pool for any advance that it or the special servicer has determined is not recoverable out of collections on the related mortgage loan and certain advances that are determined not to be reimbursed currently in connection with the work-out of a mortgage loan, then those advances (together with accrued interest thereon) will be deemed, to the fullest extent permitted pursuant to the terms of the pooling and servicing agreement, to be reimbursed first out of payments and other collections of principal otherwise distributable on the principal balance certificates, prior to, in the case of nonrecoverable advances only, being deemed reimbursed out of payments and other collections of interest oth erwise distributable on the offered certificates. | ||
| Subordination; Allocation of Losses and Certain Expenses | Credit support for any class of certificates (other than the Class IO, Class Z, Class R-I and Class R-II certificates) and the A-4FL regular interest and A-MFL regular interest is provided by the subordination of payments and allocation of any losses to such classes that have a later priority of distribution other than the Class IO certificates. However, none of the Class A-1, Class A-2, Class A-PB, Class A-3 or Class A-1A certificates or the Class A-4FL regular interest will be subordinate to any other class of Class A-1, Class A-2, | |
S-27
| Class A-PB, Class A-3 or Class A-1A certificates or the Class A-4FL regular interest. The certificate balance of a class of certificates (other than the Class IO, Class Z, Class R-I and Class R-II certificates) or the Class A-4FL regular interest or Class A-MFL regular interest will be reduced on each distribution date by any losses on the mortgage loans that have been realized and certain additional trust fund expenses actually allocated to that class of certificates or the Class A-4FL regular interest or Class A-MFL regular interest on that distribution date. In addition, while mortgage loan losses will not be directly allocated to certain classes of certificates issued privately based on the Class A-4FL regular interest and Class A-MFL regular interest, mortgage loan losses may be allocated to the Class A-4FL or Class A-MFL regular interest in reduction of the certificate balance of the Class A-4FL regular interest or Class A-MFL regular interest and the amount of its interest entitlement. | ||
| Losses on the mortgage loans that have been realized and additional trust fund expenses will be allocated without regard to loan group and will first be allocated to the certificates (other than the Class IO, Class Z, Class R-I and Class R-II certificates) and the Class A-4FL regular interest and Class A-MFL regular interest that are not offered by this prospectus supplement and then to the offered certificates as indicated on the following table: | ||
| Class Designation | Original Certificate Balance | Percentage of Cut-Off Date Pool Balance | Order of Application of Losses and Expenses | ||||||||||||||||||
| Class A-1 | $ | 25,707,000 | 0.672 | % | 9 | ||||||||||||||||
| Class A-2 | $ | 946,379,000 | 24.749 | % | 9 | ||||||||||||||||
| Class A-PB | $ | 62,827,000 | 1.643 | % | 9 | ||||||||||||||||
| Class A-3 | $ | 948,589,000 | 24.807 | % | 9 | ||||||||||||||||
| Class A-4FL* | $ | 250,000,000 | 6.538 | % | 9 | ||||||||||||||||
| Class A-1A | $ | 443,196,000 | 11.590 | % | 9 | ||||||||||||||||
| Class A-MFL* | $ | 382,385,000 | 10.000 | % | 8 | ||||||||||||||||
| Class A-J | $ | 253,330,000 | 6.625 | % | 7 | ||||||||||||||||
| Class B | $ | 43,019,000 | 1.125 | % | 6 | ||||||||||||||||
| Class C | $ | 47,798,000 | 1.250 | % | 5 | ||||||||||||||||
| Class D | $ | 28,679,000 | 0.750 | % | 4 | ||||||||||||||||
| Class E | $ | 28,679,000 | 0.750 | % | 3 | ||||||||||||||||
| Class F | $ | 38,238,000 | 1.000 | % | 2 | ||||||||||||||||
| Non-offered certificates (excluding the Class IO, Class R-I, Class R-II and Class Z certificates and the Class A-4FL regular interest and Class A-MFL regular interest) | $ | 325,027,068 | 8.500 | % | 1 | ||||||||||||||||
| * | The Class A-4FL regular interest and Class A-MFL regular interest are not offered hereby. | ||
| Any losses realized on the mortgage loans included in the trust fund or additional trust fund expenses allocated in reduction of the certificate balance of any class of sequential pay certificates or the Class A-4FL regular interest and | ||
S-28
| Class A-MFL regular interest will result in a corresponding reduction in the notional amount of the Class IO certificates. | ||
| Any losses and expenses that are associated with each co-lender loan will be allocated in accordance with the related intercreditor agreement. Specifically, with respect to the mortgage loans with one or more pari passu companion loans, any losses and expenses that are associated with the applicable whole loan will be allocated in accordance with the terms of the related intercreditor agreement, generally, pro rata between each related mortgage loan (and, therefore, to the certificates, other than the Clas s IO, Class Z, Class R-I and Class R-II certificates and the Class A-4FL regular interest and the Class A-MFL regular interest) and the related pari passu companion loan(s). Further, with regard to the mortgage loans with subordinate companion loans, any losses and expenses that are associated with the applicable whole loan will be allocated, in accordance with the terms of the related intercreditor agreement, generally, first, to the subordinate companion loan, and second, to the related mortgage loan (and the related pari passu companion loan, if applicable). The portions of those losses and expenses that are allocated to the mortgage loans that are included in the trust fund will be allocated among the Series 2007-C32 certificates in the manner described above. | ||
| See ‘‘DESCRIPTION OF THE CERTIFICATES— Subordination; Allocation of Losses and Certain Expenses’’ in this prospectus supplement. | ||
| Fees and Expenses | Certain fees and expenses are payable from amounts received on the mortgage loans in the trust fund and are generally distributed prior to any amounts being paid to the holders of the offered certificates. | |
| The master servicer is entitled to the master servicing fee which is payable monthly on a loan-by-loan basis from amounts received in respect of interest on each mortgage loan and each specially serviced mortgage loan (and from revenue with respect to each REO mortgage loan). The master servicing fee accrues at the related master servicing fee rate and is computed on the basis of the same principal amount respecting which any related interest payment due on the mortgage loan is computed. The weighted average master servicing fee rate will be approximately 0.02099% per annum as of the cut-off date. | ||
| The special servicer is entitled to the special servicing fee which is payable monthly on each mortgage loan that is a specially serviced mortgage loan and each REO mortgage loan from general collections on the mortgage loans. The special servicing fee accrues at a rate equal to 0.25% per annum and is computed on the basis of the same principal amount respecting which any related interest payment due | ||
S-29
| on such specially serviced mortgage loan or REO mortgage loan, as the case may be, is paid. | ||
| The special servicer is also entitled to a liquidation fee with respect to each specially serviced mortgage loan that is generally an amount equal to 1.00% of any whole or partial cash payments of liquidation proceeds received in respect thereof; provided, however, in no event will the liquidation fee be payable to the extent a workout fee is payable concerning the related cash payments. | ||
| The special servicer also is entitled to a workout fee with respect to each mortgage loan that is no longer a specially serviced mortgage loan that is generally equal to 1.00% of all payments of interest and principal received on such mortgage loan for so long as it remains a corrected mortgage loan. | ||
| The trustee is entitled to a trustee fee for each mortgage loan and each REO mortgage loan for any distribution date equal to one-twelfth of the product of the trustee fee rate calculated on the outstanding principal amount of the pool of mortgage loans in the trust fund. The trustee fee accrues at a per annum rate equal to 0.00058% on the stated principal balance of such mortgage loan or REO mortgage loan, as the case may be, outstanding immediately following the prior distribution date. | ||
| The master servicer, special servicer and trustee are entitled to certain other additional fees and reimbursement of expenses. All fees and expenses will generally be payable prior to distribution on the certificates. | ||
| Further information with respect to the fees and expenses payable from distributions to certificateholders, including information regarding the general purpose of and the source of payment for the fees and expenses, is set forth under ‘‘SERVICING OF THE MORTGAGE LOANS— Compensation and Payment of Expenses’’ in this prospectus supplement. With respect to the Beacon D.C. & Seattle Pool mortgage loan, the master servicer and the special servicer under the pooling and servicing agreement entered into in connection with the issuance of the Morgan Stanley Capital I Trust Commercial Mortgage Pass-Through Certificates, Series 2007-IQ14. With respect to the DDR Southeast Pool mortgage loan, the master servicer and the special servicer under the pooling and servicing agree ment to be entered into in connection with the securitization of the DDR Southeast Pool pari passu Note A-1 companion loan, which is expected to be substantially similar to the pooling and servicing agreement entered into in connection with the issuance of the CD 2007-CD4 Commercial Mortgage Trust Commercial Mortgage Pass-Through Certificates, Series 2007-CD4, are each generally entitled to payment of similar fees and expenses described in this section. | ||
S-30
| Prepayment Premiums; Yield Maintenance Charges | On each distribution date, any prepayment premium or yield maintenance charge actually collected during the related collection period on a mortgage loan included in the trust fund will be distributed to the holders of each class of offered certificates, the Class A-4FL regular interest and Class A-MFL regular interest and the Class G, Class H, Class J and Class K certificates then entitled to distributions as follows: | |
| The holders of each class of offered certificates, the Class A-4FL regular interest and the Class A-MFL regular interest and the Class G, Class H, Class J and Class K certificates then entitled to distributions of principal with respect to the related loan group on that distribution date will generally be entitled to a portion of prepayment premiums or yield maintenance charges equal to the product of: | ||
| • | the amount of those prepayment premiums or yield maintenance charges; | ||
| • | a fraction (in no event greater than one), the numerator of which is equal to the excess, if any, of the pass-through rate of that class of certificates or the Class A-4FL regular interest or Class A-MFL regular interest over the relevant discount rate, and the denominator of which is equal to the excess, if any, of the mortgage interest rate of the prepaid mortgage loan over the relevant discount rate; and | ||
| • | a fraction, the numerator of which is equal to the amount of principal distributable on that class of certificates or the Class A-4FL regular interest or Class A-MFL regular interest on that distribution date, and the denominator of which is the principal distribution amount for that distribution date. | ||
| If there is more than one class of certificates (or the Class A-4FL regular interest or Class A-MFL regular interest) entitled to distributions of principal with respect to the related loan group on any particular distribution date on which a prepayment premium or yield maintenance charge is distributable, the aggregate amount of that prepayment premium or yield maintenance charge will be allocated among all such classes up to, and on a pro rata basis in accordance with, the foregoing entitlements. | ||
| For so long as the swap contract is in effect and there is no continuing payment default under the swap contract, any prepayment premium or yield maintenance charge distributable in respect of the Class A-4FL regular interest or Class A-MFL regular interest will be payable to the swap counterparty pursuant to the terms of the swap contract. If the swap contract is no longer in effect or if there is a continuing payment default related to the swap contract, any prepayment premium and yield maintenance charges | ||
S-31
| allocable to the Class A-4FL regular interest or Class A-MFL regular interest will be paid to the holders of certain beneficial interests in the Class A-4FL regular interest and Class A-MFL regular interest, respectively. | ||
| The portion, if any, of the prepayment premiums or yield maintenance charges remaining after any payments described above will be distributed to the holders of the Class IO certificates. | ||
| The ‘‘discount rate’’ applicable to any class of offered certificates, the Class A-4FL regular interest and Class A-MFL regular interest and the Class G, Class H, Class J and Class K certificates will be equal to the discount rate stated in the related mortgage loan documents used in calculating the yield maintenance charge with respect to such principal prepayment. To the extent that a discount rate is not stated therein, the discount rate will equal the yield (when compounded monthly) on the U.S. Treasury issue with a maturity date closest to the maturity date for the prepaid mortgage loan or mortgage loan for which title to the related mortgaged property was acquired by the trust fund. | ||
| • | In the event that there are two or more such U.S. Treasury issues with the same coupon, the issue with the lowest yield will be utilized; and | ||
| • | In the event that there are two or more such U.S. Treasury issues with maturity dates equally close to the maturity date for the prepaid mortgage loan, the issue with the earliest maturity date will be utilized. | ||
| Examples of Allocation of Prepayment Premiums or Yield Maintenance Charges | ||
| Mortgage interest rate | 8% | ||
| Pass-through rate for applicable class | 6% | ||
| Discount rate | 5% |
| Allocation Percentage for Applicable Class | Allocation Percentage for Class IO | |||||
| 6% − 5% | = 331/3% | (100% − 331/3%) = 662/3% | ||||
| 8% − 5% | ||||||
| See ‘‘DESCRIPTION OF THE CERTIFICATES— Distributions—Allocation of Prepayment Premiums and Yield Maintenance Charges’’ in this prospectus supplement. | ||
| Allocation of Additional Interest | On each distribution date, any additional interest collected in respect of a mortgage loan in the trust fund with an anticipated repayment date during the related collection period will be distributed to the holders of the Class Z certificates. In each case, this interest will not be available to provide credit support for other classes of certificates or offset any interest shortfalls. | |
S-32
| Advancing of Principal and Interest | The master servicer is required to advance delinquent scheduled payments of principal and interest with respect to any mortgage loan included in the trust fund unless the master servicer or the special servicer determines that the advance would not be recoverable from proceeds of the related mortgage loan. The master servicer will not be required to advance balloon payments due at maturity in excess of regular periodic payments, interest in excess of the mortgage loan’s regular interest rate or prepayment premiums or yield maintenance charges. The amount of the interest portion of any advance will be subject to reduction to the extent that an appraisal reduction of the related mortgage loan has occurred. If the master servicer fails to make a required advance, the trustee will be required t o make that advance, unless the trustee determines that the advance would not be recoverable from proceeds of the related mortgage loan. See ‘‘DESCRIPTION OF THE CERTIFICATES—P&I Advances’’ in this prospectus supplement. | |
| These cash advances are only intended to maintain a regular flow of scheduled principal and interest payments on the certificates and are not intended to guarantee or insure against losses. In other words, the advances are intended to provide liquidity (rather than credit enhancement) to certificateholders. To the extent described in this prospectus supplement, the trust fund will pay interest to the master servicer or the trustee, as the case may be, on the amount of any principal and interest cash advance calculated at the prime rate (provided, that no principal and/or interest cash advance shall accrue interest until after the expiration of any app licable grace or cure period for the related scheduled payment) and will reimburse the master servicer or the trustee for any principal and interest cash advances that are later determined to be not recoverable. To the extent set forth in the pooling and servicing agreement, any principal and/or interest advance on any pari passu companion loan will not be recoverable by the master servicer from the trust fund. Neither the master servicer nor the trustee will be required to make a principal and/or interest advance with respect to any subordinate companion loan. Additionally, the trustee will not be required to make a principal and interest advance with respect to any companion loan. Neither the master servicer nor the trustee will be required to advance any amounts due to be paid by the swap counterparty for a distribution to the holders of certain beneficial int erests in the Class A-4FL regular interest or Class A-MFL regular interest or advance for any breakage, termination or other costs owed by the trust fund to the swap counterparty. See ‘‘DESCRIPTION OF THE CERTIFICATES—P&I Advances’’ in this prospectus supplement. | ||
S-33
| Required Repurchases or Substitutions of Mortgage Loans | Under certain circumstances, a mortgage loan seller may be obligated to repurchase an affected mortgage loan from the trust fund as a result of a material document defect or a material breach of the representations and warranties given by such mortgage loan seller with respect to the mortgage loan in the related mortgage loan purchase agreement. In addition, the mortgage loan seller may be permitted, within 2 years of the closing date, to substitute another mortgage loan for the affected mortgage loan rather than repurchasing it. See ‘‘DESCRIPTION OF THE MORTGAGE POOL— Assignment of the Mortgage Loans; Repurchases and Substitutions’’ and ‘‘—Representations and Warranties; Repurchases and Substitutions’’ in this prospectus supplement . | |
| Sale of Defaulted Loans | In the event a mortgage loan (other than the Beacon D.C. & Seattle Pool mortgage loan and, after the securitization of the DDR Southeast Pool pari passu Note A-1 companion loan, the DDR Southeast Pool mortgage loan) becomes a defaulted mortgage loan, the certificateholder that is entitled to greater than 50% of the voting rights allocated to the class of sequential pay certificates with the lowest payment priority then outstanding (or if no certificateholder is entitled to greater than 50% of the voting rights of such class, the certificateholder with the largest percentage of voting rights allocated to such class) and, in certain circumstances, the special servicer (in each case, subject to, in certain instances, the rights of the subordinated secured creditors or mezzanine lenders to purcha se the related mortgage loan), shall have, except as described below, the option to purchase from the trust fund such defaulted mortgage loan with respect to which certain defaults have occurred. See ‘‘SERVICING OF THE MORTGAGE LOANS—Defaulted Mortgage Loans; REO Properties; Purchase Option’’ in this prospectus supplement. | |
| In addition, with respect to 7 mortgage loans (loan numbers 4, 8, 10, 15, 18, 26 and 100), representing approximately 13.9% of the mortgage pool (15.7% of loan group 1) that are part of split loan structures that include one or more subordinate companion loans, the related intercreditor agreement entitles the holder(s) of the related companion loan to purchase the mortgage loan from the trust fund following a default under the related whole loan. SEE ‘‘DESCRIPTION OF THE MORTGAGE POOL—Co-Lender Loans’’. | ||
| Reimbursement Entitlement of Servicer of the Morgan Stanley 2007-IQ14 Trust Fund | The master servicer and, in certain circumstances, the special servicer under the Morgan Stanley Capital Trust I Commercial Mortgage Pass-Through Certificates, Series 2007-IQ14 trust | |
S-34
| fund are each entitled to reimbursement of a pro rata share of servicing advances made with respect to the Beacon D.C. & Seattle Pool whole loan (based on the principal balance of the Beacon D.C. & Seattle Pool mortgage loan to the aggregate principal balance of the Beacon D.C. & Seattle Pool whole loan). In the event collections related to the Beacon D.C. & Seattle Pool mortgage loan are insufficient to reimburse the master servicer or special servicer, reimbursement may be obtained from the other mortgage loans in the trust fund. | ||
| Reimbursement Entitlement of Servicer of the Citigroup 2007-C6 Trust Fund | The securitization of the DDR Southeast Pool pari passu Note A-1 companion loan is expected to occur in connection with the Citigroup Commercial Mortgage Trust, Commercial Mortgage Pass-Through Certificates, Series 2007-C6. Upon the settlement of such trust, the master servicer for the DDR Southeast Pool pari passu Note A-1 companion loan and, in certain circumstances, the special servicer under the Citigroup Commercial Mortgage Trust, Commercial Mortgage Pass-Through Certificates, Series 2007-C6 trust fund will each be entitled to reimbursement of a pro rata share of servicing advances made with respect to the DDR Southeast Pool whole loan (based on the principal balance of the DDR Southeast Pool mortgage loan to the aggregate principal balance of the DDR Southeast Pool whole loan). After the settlement described above, in the event collections related to the DDR Southeast Pool mortgage loan are insufficient to reimburse the master servicer or special servicer under that securitization, reimbursement may be obtained from the other mortgage loans in the trust fund. | |
| Optional Termination of the Trust Fund | The trust fund may be terminated when the aggregate principal balance of the mortgage loans included in the trust fund is less than 1.0% of the aggregate principal balance of the pool of mortgage loans included in the trust fund as of the cut-off date. See ‘‘DESCRIPTION OF THE CERTIFICATES—Termination’’ in this prospectus supplement and in the accompanying prospectus. | |
| The trust fund may also be terminated when the Class A-1, Class A-2, Class A-PB, Class A-3, Class A-1A, Class A-J, Class B, Class C, Class D, Class E and Class F certificates and the Class A-4FL regular interest and the Class A-MFL regular interest have been paid in full and all of the remaining certificates (other than the Class Z, Class R-I and Class R-II certificates) are held by a single certificateholder. See ‘‘DESCRIPTION OF THE CERTIFICATES—Termination’’ in this prospectus supplement. | ||
S-35
| Registration and Denomination | The offered certificates will initially be registered in the name of Cede & Co., as nominee for The Depository Trust Company in the United States, or in Europe through Clearstream Banking société anonyme or Euroclear Bank S.A./N.V., as operator of the Euroclear System. You will not receive a definitive certificate representing your interest in the trust fund, except in the limited circumstances described in the accompanying prospectus. See ‘‘DESCRIPTION OF THE CERTIFICATES—Book-Entry Registration and Definitive Certificates’’ in the accompanying prospectus. | |
| Beneficial interests in the Class A-1, Class A-2, Class A-PB, Class A-3, Class A-1A, Class A-J, Class B, Class C, Class D, Class E and Class F certificates will be offered in minimum denominations of $10,000 actual principal amounts and in integral multiples of $1 in excess of those amounts. Beneficial interests in the Class IO certificates will be offered in minimum notional amounts of $1,000,000 actual notional amounts and in integral multiples of $1 in excess of those amounts. | ||
| Material Federal Income Tax Consequences | Two separate real estate mortgage investment conduit elections will be made with respect to the trust fund (‘‘REMIC I’’ and ‘‘REMIC II’’, each, a ‘‘REMIC’’). The offered certificates will evidence regular interests in a REMIC and generally will be treated as debt instruments of that REMIC. The Class R-I certificates will represent the residual interests in REMIC I and the Class R-II certificates will represent the residual interests in REMIC II. The respective portions of the trust fund consisting of the Class A-4FL regular interest and Class A-MFL regular interest, the related floating rate account and the related swap contract will be treated as grantor trusts for federal income tax purposes. | |
| In addition, the Class Z certificateholders’ entitlement to any additional interest that has accrued on a related mortgage loan that provides for the accrual of that additional interest if the unamortized principal amount of that mortgage loan is not repaid on the anticipated repayment date set forth in the related mortgage note will be treated as a grantor trust for federal income tax purposes. | ||
| The offered certificates will be treated as newly originated debt instruments for federal income tax purposes. You will be required to report income with respect to the offered certificates using the accrual method of accounting, even if you otherwise use the cash method of accounting. It is anticipated that the offered certificates will be treated as having been issued at a premium for federal income tax reporting purposes. | ||
| For further information regarding the federal income tax consequences of investing in the offered certificates, see | ||
S-36
| ‘‘MATERIAL FEDERAL INCOME TAX CONSEQUENCES’’ in this prospectus supplement and in the accompanying prospectus. | ||
| ERISA Considerations | Subject to important considerations described under ‘‘ERISA CONSIDERATIONS’’ in this prospectus supplement and the accompanying prospectus, the following classes of offered certificates may be eligible for purchase by persons investing assets of employee benefit plans, individual retirement accounts, or other retirement plans and accounts: | |
| Class A-1 Class A-2 Class A-PB Class A-3 Class A-1A Class IO Class A-J Class B Class C Class D Class E Class F | |||
| This is based on individual prohibited transaction exemptions granted to each of Wachovia Capital Markets, LLC, Barclays Capital Inc. and Goldman, Sachs & Co. by the U.S. Department of Labor. See ‘‘ERISA CONSIDERATIONS’’ in this prospectus supplement and in the accompanying prospectus. | ||
| Legal Investment | The offered certificates will not constitute ‘‘mortgage related securities’’ for purposes of the Secondary Mortgage Market Enhancement Act of 1984, as amended (‘‘SMMEA’’). If your investment activities are subject to legal investment laws and regulations, regulatory capital requirements, or review by regulatory authorities, then you may be subject to restrictions on investment in the offered certificates. You should consult your own legal advisers for assistance in determining the suitability of and consequences to you of the purchase, ownership and sale of the offered certificates. See ‘‘LEGAL INVESTMENT’’ in th is prospectus supplement and in the accompanying prospectus. | |
| Ratings | The offered certificates will not be issued unless they have received the following ratings from Moody’s Investors Service, Inc. and Standard & Poor’s Ratings Services, Inc., a division of The McGraw-Hill Companies, Inc. | |
S-37
| Class | Expected Rating from Moody’s/S&P | ||
| Class A-1 | Aaa/AAA | ||
| Class A-2 | Aaa/AAA | ||
| Class A-PB | Aaa/AAA | ||
| Class A-3 | Aaa/AAA | ||
| Class A-1A | Aaa/AAA | ||
| Class IO | Aaa/AAA | ||
| Class A-J | Aaa/AAA | ||
| Class B | Aa1/AA+ | ||
| Class C | Aa2/AA | ||
| Class D | Aa3/AA− | ||
| Class E | A1/A+ | ||
| Class F | A2/A |
| The ratings on the offered certificates address the likelihood of timely receipt of interest and (except with respect to the Class IO certificates) ultimate receipt of principal by the rated final distribution date by the holders of offered certificates. They do not address the likely actual rate of prepayments. The rate of prepayments, if different than originally anticipated, could adversely affect the yield realized by holders of the offered certificates. See ‘‘RATINGS’’ in this prospectus supplement and in the accompanying prospectus for a discussion of the basis upon which ratings are given, the limitations and restrictions on the ratings, and conclusions that should not be drawn from a rating. | ||
S-38
The Mortgage Loans
| General | It is expected that the mortgage loans to be included in the trust fund will have the following approximate characteristics as of the cut-off date. The information contained in this prospectus supplement assumes the timely delivery of all scheduled payments of interest and principal and no prepayments on or before the cut-off date. All information presented in this prospectus supplement (including cut-off date balance per square foot/unit/room/bed, loan-to-value ratios and debt service coverage ratios) with respect to the 7 mortgage loans with subordinate companion loans is calculated without regard to the related subordinate companion loans. Unless otherwise specified, in the case of the mortgage loans with one or more pari passu companion loans, the calculations of loan balance per square foot/room/ unit, loan-to-value ratios and debt service coverage ratios were based on the aggregate indebtedness of these mortgage loans and the related pari passu companion loans, if any (but not any subordinate companion loan or future pari passu companion loan). All percentages of the mortgage loans, or any specified group of mortgage loans, referred to in this prospectus supplement are approximate percentages. | |
| The totals in the following tables may not add up to 100% due to rounding. | ||
| GENERAL CHARACTERISTICS | All Mortgage Loans | Loan Group 1 | Loan Group 2 | |||||||||||||||
| Number of Mortgage Loans | 142 | 113 | 29 | |||||||||||||||
| Number of Crossed Loan Pools | 3 | 2 | 1 | |||||||||||||||
| Number of Mortgaged Properties | 275 | 245 | 30 | |||||||||||||||
| Aggregate Balance of all Mortgage Loans | $ | 3,823,853,069 | $ | 3,380,656,275 | $ | 443,196,794 | ||||||||||||
| Number of Mortgage Loans with Balloon Payments(1) | 56 | 49 | 7 | |||||||||||||||
| Aggregate Balance of Mortgage Loans with Balloon Payments(1) | $ | 779,384,569 | $ | 717,506,275 | $ | 61,878,294 | ||||||||||||
| Number of Interest-Only Mortgage Loans(2) | 86 | 64 | 22 | |||||||||||||||
| Aggregate Balance of Interest-Only Mortgage Loans(2) | $ | 3,044,468,500 | $ | 2,663,150,000 | $ | 381,318,500 | ||||||||||||
| Average Balance of Mortgage Loans | $ | 26,928,543 | $ | 29,917,312 | $ | 15,282,648 | ||||||||||||
| Minimum Balance of Mortgage Loans | $ | 1,000,000 | $ | 1,000,000 | $ | 3,100,000 | ||||||||||||
| Maximum Balance of Mortgage Loans | $ | 414,000,000 | $ | 414,000,000 | $ | 40,000,000 | ||||||||||||
| Maximum Balance for a group of cross-collateralized and cross-defaulted Mortgage Loans | $ | 27,000,000 | (3) | $ | 5,863,424 | (4) | $ | 27,000,000 | (3) | |||||||||
| Weighted Average LTV at Maturity or Anticipated Repayment Date(5)(6) | 69.9 | % | 69.0 | % | 76.3 | % | ||||||||||||
| Weighted Average LTV ratio(5)(6) | 71.4 | % | 70.7 | % | 77.3 | % | ||||||||||||
| Minimum LTV ratio(5)(6) | 24.8 | % | 24.8 | % | 53.7 | % | ||||||||||||
| Maximum LTV ratio(5)(6) | 88.0 | % | 88.0 | % | 80.1 | % | ||||||||||||
S-39
| GENERAL CHARACTERISTICS | All Mortgage Loans | Loan Group 1 | Loan Group 2 | |||||||||||||||
| Weighted Average DSCR(6) | 1.45x | 1.47x | 1.32x | |||||||||||||||
| Minimum DSCR(6) | 1.08x | 1.08x | 1.15x | |||||||||||||||
| Maximum DSCR(6) | 2.60x | 2.60x | 1.73x | |||||||||||||||
| Weighted Average Mortgage Loan interest rate(7) | 5.765 | % | 5.772 | % | 5.710 | % | ||||||||||||
| Minimum Mortgage Loan interest rate(7) | 5.180 | % | 5.310 | % | 5.180 | % | ||||||||||||
| Maximum Mortgage Loan interest rate(7) | 7.130 | % | 7.130 | % | 6.150 | % | ||||||||||||
| Weighted Average Remaining Term to Maturity or Anticipated Repayment Date (months) | 103 | 102 | 104 | |||||||||||||||
| Minimum Remaining Term to Maturity or Anticipated Repayment Date (months) | 53 | 53 | 59 | |||||||||||||||
| Maximum Remaining Term to Maturity or Anticipated Repayment Date (months) | 124 | 124 | 120 | |||||||||||||||
| Weighted Average Occupany Rate(8) | 94.7 | % | 95.1 | % | 92.9 | % | ||||||||||||
| (1) | Does not include mortgage loans with anticipated repayment dates or mortgage loans that are interest-only for their entire term. |
| (2) | Includes mortgage loans with anticipated repayment dates that are interest-only for the entire period until the anticipated repayment date. |
| (3) | Consists of a group of 2 individual mortgage loans (loan numbers 52 and 75). |
| (4) | Consists of a group of 2 individual mortgage loans (loan numbers 123 and 131). |
| (5) | For a description of how the loan-to-value ratios for the mortgage loans are determined, see ‘‘DESCRIPTION OF THE MORTGAGE POOL—Additional Mortgage Loan Information’’ in this prospectus supplement. |
| (6) | Certain of the mortgage loans reflect LTV Ratios that have been calculated on an ‘‘as-stabilized’’ basis, or that have DSCRs that have been adjusted to take into account certain cash reserves or letters of credit. See ‘‘DESCRIPTION OF THE MORTGAGE POOL—Additional Mortgage Loan Information’’ and ‘‘RISK FACTORS—The Mortgage Loans—Risks Relating to Net Cash Flow’’ and ‘‘—Inspections and Appraisals May Not Accurately Reflect Value or Condition of Mortgaged Property’’ in this prospectus supplement. |
| (7) | The interest rate with respect to 1 mortgage loan (loan number 35), representing 0.7% of the mortgage pool (0.8% of loan group 1) may vary during the term of the related mortgage loan. For purposes of the table above as well as calculations throughout this prospectus supplement, the mortgage rate was assumed to be the average mortgage rate over the term of the related mortgage loan. See ‘‘DESCRIPTION OF THE MORTGAGE POOL—Additional Mortgage Loan Information’’ in this prospectus supplement. |
| (8) | Does not include 61 hospitality properties, representing, by allocated loan amount, 18.7% of the mortgage pool (21.2% of the loan group 1 ). In certain cases, occupancy includes space for which leases have been executed, but the tenant has not taken occupancy and/or commenced paying rent. |
| Security for the Mortgage Loans in the Trust Fund | Generally, all of the mortgage loans included in the trust fund are non-recourse obligations of the related borrowers. | |
| • | No mortgage loan included in the trust fund is insured or guaranteed by any government agency or private insurer. | ||
| • | All of the mortgage loans included in the trust fund are secured by first lien fee mortgages and/or leasehold mortgages on commercial properties or multifamily properties. | ||
| Property Types | The following table describes the mortgaged properties securing the mortgage loans expected to be included in the trust fund as of the cut-off date: | |
S-40
Mortgaged Properties by Property Type(1)
| Property Type | Number of Mortgaged Properties | Aggregate Cut-Off Date Balance | % of Initial Pool Balance | % of Group 1 Pool Balance | % of Group 2 Pool Balance | |||||||||||||||||||||||||
| Office | 56 | $ | 1,169,790,500 | 30.6 | % | 34.6 | % | 0.0 | % | |||||||||||||||||||||
| Retail | 99 | 1,026,196,690 | 26.8 | 30.4 | 0.0 | |||||||||||||||||||||||||
| Retail – Anchored | 76 | 801,889,645 | 21.0 | 23.7 | 0.0 | |||||||||||||||||||||||||
| Retail – Outlet | 1 | 92,400,000 | 2.4 | 2.7 | 0.0 | |||||||||||||||||||||||||
| Retail – Single Tenant | 11 | 56,317,045 | 1.5 | 1.7 | 0.0 | |||||||||||||||||||||||||
| Retail – Unanchored | 7 | 49,190,000 | 1.3 | 1.5 | 0.0 | |||||||||||||||||||||||||
| Retail – Shadow Anchored(2) | 4 | 26,400,000 | 0.7 | 0.8 | 0.0 | |||||||||||||||||||||||||
| Hospitality | 61 | 715,271,335 | 18.7 | 21.2 | 0.0 | |||||||||||||||||||||||||
| Multifamily | 30 | 443,196,794 | 11.6 | 0.0 | 100.0 | |||||||||||||||||||||||||
| Mixed Use | 11 | 365,700,000 | 9.6 | 10.8 | 0.0 | |||||||||||||||||||||||||
| Industrial | 10 | 67,297,750 | 1.8 | 2.0 | 0.0 | |||||||||||||||||||||||||
| Special Purpose | 2 | 17,500,000 | 0.5 | 0.5 | 0.0 | |||||||||||||||||||||||||
| Healthcare | 1 | 13,000,000 | 0.3 | 0.4 | 0.0 | |||||||||||||||||||||||||
| Land(3) | 5 | 5,900,000 | 0.2 | 0.2 | 0.0 | |||||||||||||||||||||||||
| 275 | $ | 3,823,853,069 | 100.0 | % | 100.0 | % | 100.0 | % | ||||||||||||||||||||||
| (1) | Because this table presents information relating to the mortgaged properties and not the mortgage loans, the information for mortgage loans secured by more than one mortgaged property is based on allocated loan amounts (allocating the mortgage loan principal balance to each of those properties by the appraised values of the mortgaged properties or the allocated loan amount (or specific release prices) as described in the related mortgage loan documents). |
| (2) | A mortgaged property is classified as ‘‘shadow anchored’’ if it is located in close proximity to an anchored retail property that is not part of the mortgaged property. |
| (3) | As of the origination of the related mortgage loan, one mortgaged property was improved with a mixed use office/retail building, one mortgaged property was improved with an apartment complex, one mortgaged property was improved with multifamily condominium complex, one mortgaged property was improved with a high rise office building and a seven-story parking garage and the other mortgaged property was improved with a mixed use project that includes an office tower, retail arcade, underground parking facilities, meeting space and a 395-room luxury hotel; however, in all cases, the improvements are not part of the collateral for the related mortgaged property. |
Mortgaged Properties by Property Type
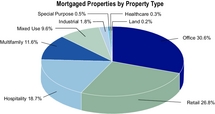
S-41
| Geographic Concentrations | The mortgaged properties are located throughout 37 states, the District of Columbia and the Cayman Islands. The following tables describe the number and percentage of mortgaged properties in states which have concentrations of mortgaged properties above 5.0%: | |
| Mortgaged Properties by Geographic Concentration(1) | ||
| State | Number of Mortgaged Properties | Aggregate Cut-Off Date Balance | % of Initial Pool Balance | |||||||||||||||
| NY | 10 | $ | 597,750,000 | 15.6 | % | |||||||||||||
| CA | 25 | 575,873,000 | 15.1 | |||||||||||||||
| Southern(2) | 20 | 525,626,000 | 13.7 | |||||||||||||||
| Northern(2) | 5 | 50,247,000 | 1.3 | |||||||||||||||
| FL | 44 | 356,557,496 | 9.3 | |||||||||||||||
| GA | 28 | 237,654,004 | 6.2 | |||||||||||||||
| VA | 13 | 199,442,775 | 5.2 | |||||||||||||||
| Other | 155 | 1,856,575,794 | 48.6 | |||||||||||||||
| 275 | $ | 3,823,853,069 | 100.0 | % | ||||||||||||||
| (1) | Because this table presents information relating to the mortgaged properties and not the mortgage loans, the information for mortgage loans secured by more than one mortgaged property is based on allocated loan amounts (allocating the mortgage loan principal balance to each of those properties by the appraised values of the mortgaged properties or the allocated loan amount (or specific release prices) as described in the related mortgage loan documents). |
| (2) | For purposes of determining whether a mortgaged property is located in Northern California or Southern California, mortgaged properties located north of San Luis Obispo County, Kern County and San Bernardino County were included in Northern California and mortgaged properties located in and south of such counties were included in Southern California. |
| Loan Group 1 Mortgaged Properties by Geographic Concentration(1) | ||
| State | Number of Mortgage Properties | Aggregate Cut-Off Date Balance | % of Cut-Off Date Group 1 Balance | |||||||||||||||
| NY | 10 | $ | 597,750,000 | 17.7 | % | |||||||||||||
| CA | 23 | 545,023,000 | 16.1 | |||||||||||||||
| Southern(2) | 18 | 494,776,000 | 14.6 | |||||||||||||||
| Northern(2) | 5 | 50,247,000 | 1.5 | |||||||||||||||
| FL | 44 | 356,557,496 | 10.5 | |||||||||||||||
| GA | 27 | 211,654,004 | 6.3 | |||||||||||||||
| WA | 11 | 186,648,641 | 5.5 | |||||||||||||||
| VA | 11 | 177,914,481 | 5.3 | |||||||||||||||
| Other | 119 | 1,305,108,653 | 38.6 | |||||||||||||||
| 245 | $ | 3,380,656,275 | 100.0 | % | ||||||||||||||
| (1) | Because this table presents information relating to the mortgaged properties and not the mortgage loans, the information for mortgage loans secured by more than one mortgaged property is based on allocated loan amounts (allocating the mortgage loan principal balance to each of those properties by the appraised values of the mortgaged |
S-42
| properties or the allocated loan amount (or specific release prices) as described in the related mortgage loan documents). |
| (2) | For purposes of determining whether a mortgaged property is located in Northern California or Southern California, mortgaged properties located north of San Luis Obispo County, Kern County and San Bernardino County were included in Northern California and mortgaged properties located in and south of such counties were included in Southern California. |
Loan Group 2
Mortgaged Properties by Geographic Concentration(1)
| State | Number of Mortgage Properties | Aggregate Cut-Off Date Balance | % of Cut-Off Date Group 2 Balance | |||||||||||||||
| NV | 2 | $ | 65,747,500 | 14.8 | % | |||||||||||||
| TX | 3 | 53,150,000 | 12.0 | |||||||||||||||
| AR | 2 | 40,000,000 | 9.0 | |||||||||||||||
| LA | 1 | 33,700,000 | 7.6 | |||||||||||||||
| CO | 1 | 31,000,000 | 7.0 | |||||||||||||||
| CA | 2 | 30,850,000 | 7.0 | |||||||||||||||
| Southern(2) | 2 | 30,850,000 | 7.0 | |||||||||||||||
| Other | 19 | 188,749,294 | 42.6 | |||||||||||||||
| 30 | $ | 443,196,794 | 100.0 | % | ||||||||||||||
| (1) | Because this table presents information relating to the mortgaged properties and not the mortgage loans, the information for mortgage loans secured by more than one mortgaged property is based on allocated loan amounts (allocating the mortgage loan principal balance to each of those properties by the appraised values of the mortgaged properties or the allocated loan amount (or specific release prices) as described in the related mortgage loan documents). |
| (2) | For purposes of determining whether a mortgaged property is located in Northern California or Southern California, mortgaged properties located north of San Luis Obispo County, Kern County and San Bernardino County were included in Northern California and mortgaged properties located in and south of such counties were included in Southern California. |
| Payment Terms | All of the mortgage loans included in the trust fund accrue interest at a fixed rate, other than mortgage loans providing for an anticipated repayment date, which provide for an increase of fixed interest after a certain date. | |
| • | Payments on the mortgage loans included in the trust fund are due on the 11th day of the month, except payments on 2 mortgage loans, representing 2.7% of the mortgage pool (3.0% of loan group 1), which are due on the 1st day of the month, payments on 1 mortgage loan representing 5.8% of the mortgage pool (6.5% of loan group 1), which are due of the 5th day of the month and payments on 1 mortgage loan representing 10.8% of the mortgage pool (12.2% of loan group 1), which are due on the 7th day of the month. No mortgage loan has a grace period that extends payment beyond the 11th day of any calendar month other than 1 mortgage loan representing 2.0% of the mortgage pool (2.2% of loan group 1), which has a twice-per-year grace period (maximum five times | ||
S-43
| during loan term) that may extend payment until the 13th day of any calendar month. | |||
| • | As of the cut-off date, 141 of the mortgage loans, representing 98.0% of the mortgage pool (112 mortgage loans in loan group 1 or 97.8% and all of the mortgage loans in loan group 2), accrue interest on an actual/360 basis, and 1 mortgage loan, representing 2.0% of the mortgage pool (2.2% of loan group 1) accrues interest on a 30/360 basis. Thirty-three (33) of the mortgage loans, representing 15.7% of the mortgage pool (29 mortgage loans in loan group 1 or 16.5% and 4 mortgage loans in loan group 2 or 9.1%), have periods during which only interest is due and periods in which principal and interest are due. Eighty-six (86) of the mortgage loans, representing 79.6% of the mortgage pool (64 mortgage loans in loan group 1 or 78.8% and 22 mortgage loans in loan group 2 or 86.0%), provide that only interest is due until maturity or the anticipated repayment date. Twenty-three (23) mortgage loans, representing 4.7% of the mortgage pool (20 mortgage loans in loan group 1 or 4.7% and 3 mortgage loans in loan group 2 or 4.9%), provide that principal and interest are due prior to and until maturity. | ||
S-44
The following tables set forth additional characteristics of the mortgage loans that we anticipate to be included in the trust fund as of the cut-off date:
Range of Cut-Off Date Balances
| Range of Cut-Off Date Balances | Number of Mortgage Loans | Aggregate Cut-Off Date Balance | % of Initial Pool Balance | % of Group 1 Balance | % of Group 2 Balance | |||||||||||||||||||||||||
| $1,000,000 – $2,000,000 | 10 | $ | 14,287,326 | 0.4 | % | 0.4 | % | 0.0 | % | |||||||||||||||||||||
| $2,000,001 – $3,000,000 | 6 | 14,474,539 | 0.4 | 0.4 | 0.0 | |||||||||||||||||||||||||
| $3,000,001 – $4,000,000 | 9 | 31,137,951 | 0.8 | 0.7 | 1.5 | |||||||||||||||||||||||||
| $4,000,001 – $5,000,000 | 8 | 35,540,000 | 0.9 | 0.6 | 3.1 | |||||||||||||||||||||||||
| $5,000,001 – $6,000,000 | 9 | 51,310,000 | 1.3 | 1.4 | 1.3 | |||||||||||||||||||||||||
| $6,000,001 – $7,000,000 | 5 | 32,784,335 | 0.9 | 0.8 | 1.5 | |||||||||||||||||||||||||
| $7,000,001 – $8,000,000 | 5 | 38,420,000 | 1.0 | 0.7 | 3.3 | |||||||||||||||||||||||||
| $8,000,001 – $9,000,000 | 4 | 34,680,000 | 0.9 | 0.8 | 1.8 | |||||||||||||||||||||||||
| $9,000,001 – $10,000,000 | 3 | 28,450,000 | 0.7 | 0.8 | 0.0 | |||||||||||||||||||||||||
| $10,000,001 – $15,000,000 | 31 | 368,879,919 | 9.6 | 7.8 | 23.4 | |||||||||||||||||||||||||
| $15,000,001 – $20,000,000 | 9 | 157,475,000 | 4.1 | 3.1 | 12.1 | |||||||||||||||||||||||||
| $20,000,001 – $25,000,000 | 5 | 119,350,000 | 3.1 | 3.5 | 0.0 | |||||||||||||||||||||||||
| $25,000,001 – $30,000,000 | 8 | 224,520,000 | 5.9 | 5.9 | 5.9 | |||||||||||||||||||||||||
| $30,000,001 – $35,000,000 | 5 | 163,875,000 | 4.3 | 1.0 | 29.1 | |||||||||||||||||||||||||
| $35,000,001 – $40,000,000 | 5 | 186,422,500 | 4.9 | 3.3 | 17.1 | |||||||||||||||||||||||||
| $40,000,001 – $45,000,000 | 1 | 44,000,000 | 1.2 | 1.3 | 0.0 | |||||||||||||||||||||||||
| $45,000,001 – $50,000,000 | 3 | 139,000,000 | 3.6 | 4.1 | 0.0 | |||||||||||||||||||||||||
| $50,000,001 – $55,000,000 | 1 | 54,000,000 | 1.4 | 1.6 | 0.0 | |||||||||||||||||||||||||
| $55,000,001 – $60,000,000 | 1 | 60,000,000 | 1.6 | 1.8 | 0.0 | |||||||||||||||||||||||||
| $60,000,001 – $65,000,000 | 1 | 64,000,000 | 1.7 | 1.9 | 0.0 | |||||||||||||||||||||||||
| $65,000,001 – $70,000,000 | 2 | 136,500,000 | 3.6 | 4.0 | 0.0 | |||||||||||||||||||||||||
| $75,000,001 – $80,000,000 | 1 | 75,040,500 | 2.0 | 2.2 | 0.0 | |||||||||||||||||||||||||
| $80,000,001 – $90,000,000 | 1 | 89,300,000 | 2.3 | 2.6 | 0.0 | |||||||||||||||||||||||||
| $90,000,001 – $100,000,000 | 2 | 187,400,000 | 4.9 | 5.5 | 0.0 | |||||||||||||||||||||||||
| $100,000,001 – $150,000,000 | 3 | 353,906,000 | 9.3 | 10.5 | 0.0 | |||||||||||||||||||||||||
| $150,000,001 – $200,000,000 | 1 | 200,000,000 | 5.2 | 5.9 | 0.0 | |||||||||||||||||||||||||
| $200,000,001 – $300,000,000 | 2 | 505,100,000 | 13.2 | 14.9 | 0.0 | |||||||||||||||||||||||||
| $400,000,001 – $414,000,000 | 1 | 414,000,000 | 10.8 | 12.2 | 0.0 | |||||||||||||||||||||||||
| 142 | $ | 3,823,853,069 | 100.0 | % | 100.0 | % | 100.0 | % | ||||||||||||||||||||||
S-45
Range of Mortgage Rates*
| Range of Mortgage Rates (%) | Number of Mortgage Loans | Aggregate Cut-Off Date Balance | % of Initial Pool Balance | % of Group 1 Balance | % of Group 2 Balance | |||||||||||||||||||||||||
| 5.180 – 5.250 | 1 | $ | 12,450,000 | 0.3 | % | 0.0 | % | 2.8 | % | |||||||||||||||||||||
| 5.251 – 5.500 | 4 | 118,661,000 | 3.1 | 2.3 | 9.0 | |||||||||||||||||||||||||
| 5.501 – 5.750 | 60 | 1,796,448,027 | 47.0 | 47.3 | 44.9 | |||||||||||||||||||||||||
| 5.751 – 6.000 | 58 | 1,608,842,227 | 42.1 | 42.6 | 38.4 | |||||||||||||||||||||||||
| 6.001 – 6.250 | 12 | 111,115,335 | 2.9 | 2.7 | 4.8 | |||||||||||||||||||||||||
| 6.251 – 6.500 | 4 | 145,550,000 | 3.8 | 4.3 | 0.0 | |||||||||||||||||||||||||
| 6.501 – 6.750 | 2 | 17,850,000 | 0.5 | 0.5 | 0.0 | |||||||||||||||||||||||||
| 7.001 – 7.130 | 1 | 12,936,479 | 0.3 | 0.4 | 0.0 | |||||||||||||||||||||||||
| 142 | $ | 3,823,853,069 | 100.0 | % | 100.0 | % | 100.0 | % | ||||||||||||||||||||||
| * | The interest rate with respect to 1 mortgage loan (loan number 35), representing 0.7% of the mortgage pool (0.8% of loan group 1), may vary during the term of the related mortgage loan. For purposes of the table above, as well as calculations throughout this prospectus supplement, the mortgage rate was assumed to be the average mortgage rate over the term of the related mortgage loan. See ‘‘DESCRIPTION OF THE MORTGAGE POOL—Additional Mortgage Loan Information’’ in this prospectus supplement. |
Range of Underwritten DSC Ratios*
| Range of Underwritten DSCRs (x) | Number of Mortgage Loans | Aggregate Cut-Off Date Balance | % of Initial Pool Balance | % of Group 1 Balance | % of Group 2 Balance | |||||||||||||||||||||||||
| 1.08 – 1.09 | 1 | $ | 25,000,000 | 0.7 | % | 0.7 | % | 0.0 | % | |||||||||||||||||||||
| 1.10 – 1.14 | 1 | 27,000,000 | 0.7 | 0.8 | 0.0 | |||||||||||||||||||||||||
| 1.15 – 1.19 | 11 | 100,110,379 | 2.6 | 2.4 | 4.7 | |||||||||||||||||||||||||
| 1.20 – 1.24 | 25 | 473,820,266 | 12.4 | 11.9 | 16.2 | |||||||||||||||||||||||||
| 1.25 – 1.29 | 29 | 1,123,659,813 | 29.4 | 28.9 | 33.4 | |||||||||||||||||||||||||
| 1.30 – 1.34 | 14 | 192,677,770 | 5.0 | 4.9 | 6.3 | |||||||||||||||||||||||||
| 1.35 – 1.39 | 12 | 352,112,212 | 9.2 | 9.5 | 7.2 | |||||||||||||||||||||||||
| 1.40 – 1.44 | 12 | 241,428,294 | 6.3 | 4.3 | 21.7 | |||||||||||||||||||||||||
| 1.45 – 1.49 | 8 | 100,120,000 | 2.6 | 2.8 | 1.3 | |||||||||||||||||||||||||
| 1.50 – 1.54 | 5 | 473,050,000 | 12.4 | 13.0 | 7.6 | |||||||||||||||||||||||||
| 1.55 – 1.59 | 3 | 41,894,335 | 1.1 | 1.2 | 0.0 | |||||||||||||||||||||||||
| 1.60 – 1.64 | 2 | 20,500,000 | 0.5 | 0.6 | 0.0 | |||||||||||||||||||||||||
| 1.65 – 1.69 | 2 | 103,300,000 | 2.7 | 3.1 | 0.0 | |||||||||||||||||||||||||
| 1.70 – 1.74 | 3 | 80,930,000 | 2.1 | 2.2 | 1.7 | |||||||||||||||||||||||||
| 1.75 – 1.79 | 1 | 3,500,000 | 0.1 | 0.1 | 0.0 | |||||||||||||||||||||||||
| 1.85 – 1.89 | 4 | 20,211,000 | 0.5 | 0.6 | 0.0 | |||||||||||||||||||||||||
| 1.95 – 1.99 | 2 | 4,500,000 | 0.1 | 0.1 | 0.0 | |||||||||||||||||||||||||
| 2.05 – 2.09 | 1 | 1,994,000 | 0.1 | 0.1 | 0.0 | |||||||||||||||||||||||||
| 2.10 – 2.14 | 2 | 329,850,000 | 8.6 | 9.8 | 0.0 | |||||||||||||||||||||||||
| 2.15 – 2.19 | 1 | 2,095,000 | 0.1 | 0.1 | 0.0 | |||||||||||||||||||||||||
| 2.30 – 2.60 | 3 | 106,100,000 | 2.8 | 3.1 | 0.0 | |||||||||||||||||||||||||
| 142 | $ | 3,823,853,069 | 100.0 | % | 100.0 | % | 100.0 | % | ||||||||||||||||||||||
| * | Certain of the mortgage loans reflect LTV Ratios that have been calculated on an ‘‘as-stabilized’’ basis, or that have DSCRs that have been adjusted to take into account certain cash reserves or letters of credit. See ‘‘DESCRIPTION OF THE MORTGAGE POOL—Additional Mortgage Loan Information’’ and ‘‘RISK FACTORS—The Mortgage Loans—Risks Relating to Net Cash Flow’’ and ‘‘—Inspections and Appraisals May Not Accurately Reflect Value or Condition of Mortgaged Property’’ in this Prospectus Supplement. |
S-46
Range of Cut-Off Date LTV Ratios*
| Range of Cut-Off Date LTV Ratios (%) | Number of Mortgage Loans | Aggregate Cut-Off Date Balance | % of Initial Pool Balance | % of Group 1 Balance | % of Group 2 Balance | |||||||||||||||||||||||||
| 24.77 – 40.00 | 3 | $ | 47,100,000 | 1.2 | % | 1.4 | % | 0.0 | % | |||||||||||||||||||||
| 40.01 – 50.00 | 5 | 57,500,000 | 1.5 | 1.7 | 0.0 | |||||||||||||||||||||||||
| 50.01 – 55.00 | 5 | 87,222,294 | 2.3 | 2.2 | 2.5 | |||||||||||||||||||||||||
| 55.01 – 60.00 | 10 | 239,743,000 | 6.3 | 7.1 | 0.0 | |||||||||||||||||||||||||
| 60.01 – 65.00 | 11 | 595,491,000 | 15.6 | 17.2 | 3.5 | |||||||||||||||||||||||||
| 65.01 – 70.00 | 10 | 357,563,424 | 9.4 | 10.6 | 0.0 | |||||||||||||||||||||||||
| 70.01 – 75.00 | 24 | 590,415,732 | 15.4 | 16.1 | 10.1 | |||||||||||||||||||||||||
| 75.01 – 80.00 | 68 | 1,708,597,620 | 44.7 | 40.6 | 75.5 | |||||||||||||||||||||||||
| 80.01 – 85.00 | 5 | 104,120,000 | 2.7 | 2.0 | 8.3 | |||||||||||||||||||||||||
| 85.01 – 88.05 | 1 | 36,100,000 | 0.9 | 1.1 | 0.0 | |||||||||||||||||||||||||
| 142 | $ | 3,823,853,069 | 100.0 | % | 100.0 | % | 100.0 | % | ||||||||||||||||||||||
| * | Certain of the mortgage loans reflect LTV Ratios that have been calculated on an ‘‘as-stabilized’’ basis, or that have DSCRs that have been adjusted to take into account certain cash reserves or letters of credit. See ‘‘DESCRIPTION OF THE MORTGAGE POOL—Additional Mortgage Loan Information’’ and ‘‘RISK FACTORS—The Mortgage Loans—Risks Relating to Net Cash flow’’ and ‘‘—Inspections and Appraisals May Not Accurately Reflect Value or Condition of Mortgaged Property’’ in this prospectus supplement. |
Range of Remaining Terms to Maturity or Anticipated Repayment Date*
| Range of Remaining Terms To Maturity | Number of Mortgage Loans | Aggregate Cut-Off Date Balance | % of Cut-Off Date Pool Balance | % of Group 1 Balance | % of Group 2 Balance | |||||||||||||||||||||||||
| 53 – 60 | 18 | $ | 1,059,697,500 | 27.7 | % | 28.1 | % | 24.9 | % | |||||||||||||||||||||
| 61 – 84 | 1 | 14,750,000 | 0.4 | 0.4 | 0.0 | |||||||||||||||||||||||||
| 109 – 120 | 120 | 2,554,105,569 | 66.8 | 65.7 | 75.1 | |||||||||||||||||||||||||
| 121 – 124 | 3 | 195,300,000 | 5.1 | 5.8 | 0.0 | |||||||||||||||||||||||||
| 142 | $ | 3,823,853,069 | 100.0 | % | 100.0 | % | 100.0 | % | ||||||||||||||||||||||
| * | With respect to the mortgage loans with anticipated repayment dates, the remaining term to maturity was calculated as of the related anticipated repayment date. |
Amortization Types
| Amortization Type | Number of Mortgage Loans | Aggregate Cut-Off Date Balance | % of Cut-Off Date Pool Balance | % of Cut-Off Date Group 1 Balance | % of Cut-Off Date Group 2 Balance | |||||||||||||||||||||||||
| Non-Amortizing | 81 | $ | 3,020,668,500 | 79.0 | % | 78.1 | % | 86.0 | % | |||||||||||||||||||||
| Interest Only, Amortizing Balloon* | 33 | 599,077,500 | 15.7 | 16.5 | 9.1 | |||||||||||||||||||||||||
| Amortizing Balloon | 23 | 180,307,069 | 4.7 | 4.7 | 4.9 | |||||||||||||||||||||||||
| Interest Only, ARD | 5 | 23,800,000 | 0.6 | 0.7 | 0.0 | |||||||||||||||||||||||||
| 142 | $ | 3,823,853,069 | 100.0 | % | 100.0 | % | 100.0 | % | ||||||||||||||||||||||
| * | These mortgage loans require payments of interest-only for a period of 12 to 84 months from origination prior to the commencement of payments of principal and interest with respect to the mortgage pool (a period of 12 to 84 months with respect to loan group 1 and a period of 60 months with respect to loan group 2). |
S-47
Types of IO Period
| Type of IO Period | Number of Mortgage Loans | Aggregate Cut-Off Date Balance | % of Initial Pool Balance | % of Group 1 Balance | % of Group 2 Balance | |||||||||||||||||||||||||
| Non-Amortizing | 86 | $ | 3,044,468,500 | 79.6 | % | 78.8 | % | 86.0 | % | |||||||||||||||||||||
| Partial Interest Only Amortizing | 33 | 599,077,500 | 15.7 | 16.5 | 9.1 | |||||||||||||||||||||||||
| 1 – 12 | 6 | 46,950,000 | 1.2 | 1.4 | 0.0 | |||||||||||||||||||||||||
| 13 – 24 | 6 | 212,912,500 | 5.6 | 6.3 | 0.0 | |||||||||||||||||||||||||
| 25 – 36 | 3 | 23,780,000 | 0.6 | 0.7 | 0.0 | |||||||||||||||||||||||||
| 49 – 60 | 16 | 281,707,000 | 7.4 | 7.1 | 9.1 | |||||||||||||||||||||||||
| 61 – 72 | 1 | 6,728,000 | 0.2 | 0.2 | 0.0 | |||||||||||||||||||||||||
| 73 – 84 | 1 | 27,000,000 | 0.7 | 0.8 | 0.0 | |||||||||||||||||||||||||
| Amortizing – No Partial Interest Only Period | 23 | 180,307,069 | 4.7 | 4.7 | 4.9 | |||||||||||||||||||||||||
| 142 | $ | 3,823,853,069 | 100.0 | % | 100.0 | % | 100.0 | % | ||||||||||||||||||||||
| Balloon loans have amortization schedules significantly longer than their terms to maturity and have substantial principal payments due on their maturity dates, unless prepaid earlier. | ||
| Mortgage loans providing for anticipated repayment dates generally fully or substantially amortize through their terms to maturity. However, if this type of mortgage loan is not prepaid by a date specified in its related mortgage note, interest will accrue at a higher rate and the related borrower will be required to apply all cash flow generated by the mortgaged property in excess of its regular debt service payments and certain other permitted expenses and reserves to repay principal on the mortgage loan. | ||
| In addition, the fixed periodic payment on the mortgage loans is generally determined assuming interest is calculated on a ‘‘30/360 basis,’’ but since interest actually accrues and is applied on the majority of the mortgage loans on an ‘‘actual/360 basis,’’ there will be less amortization, absent prepayments, of the principal balance during the term of the related mortgage loan, resulting in a higher final payment on such mortgage loan. This will occur even if a mortgage loan is a ‘‘fully amortizing’’ mortgage loan. | ||
| See ‘‘DESCRIPTION OF THE MORTGAGE POOL—Certain Terms and Conditions of the Mortgage Loans’’ in this prospectus supplement. | ||
| Prepayment Restrictions | All of the mortgage loans included in the trust fund restrict or prohibit voluntary prepayments of principal in some manner for some period of time. | |
S-48
Types of Prepayment Restrictions*
| Prepayment Provisions | Number of Mortgage Loans | Aggregate Cut-Off Date Balance | % of Initial Pool Balance | % of Group 1 Balance | % of Group 2 Balance | |||||||||||||||||||||||||
| Lockout/Defeasance/Open | 87 | $ | 1,804,141,590 | 47.2 | % | 45.0 | % | 63.9 | % | |||||||||||||||||||||
| Yield Maintenance/Open | 17 | 564,633,979 | 14.8 | 13.0 | 28.2 | |||||||||||||||||||||||||
| Lockout/Yield Maintenance/Open | 21 | 543,927,000 | 14.2 | 15.1 | 7.9 | |||||||||||||||||||||||||
| Lockout/Defeasance or Yield Maintenance/Open | 14 | 468,300,500 | 12.2 | 13.9 | 0 | |||||||||||||||||||||||||
| Yield Maintenance/Yield Maintenance or Defeasance/Open | 2 | 439,000,000 | 11.5 | 13.0 | 0 | |||||||||||||||||||||||||
| Lockout/Open | 1 | 3,850,000 | 0.1 | 0.1 | 0 | |||||||||||||||||||||||||
| 142 | $ | 3,823,853,069 | 100.0 | % | 100.0 | % | 100.0 | % | ||||||||||||||||||||||
| * | See ‘‘RISK FACTORS—The Offered Certificates—Prepayments Will Affect Your Yield—Performance Escrows’’ in this prospectus supplement. |
| See ‘‘DESCRIPTION OF THE MORTGAGE POOL—Additional Mortgage Loan Information’’ in this prospectus supplement. The ability of the master servicer or special servicer to waive or modify the terms of any mortgage loan relating to the payment of a prepayment premium or yield maintenance charge will be limited as described in this prospectus supplement. See ‘‘SERVICING OF THE MORTGAGE LOANS—Modifications, Waivers and Amendments’’ in this prospectus supplement. We make no representations as to the enforceability of the provisions of any mortgage notes requiring the payment of a prepayment premium or yield maintenance charge or limiting prepayments to defeasance or the ability of the master servicer or special servicer to collect any prepay ment premium or yield maintenance charge. | ||
| Defeasance | One hundred three (103) of the mortgage loans included in the trust fund as of the cut-off date, representing 70.9% of the mortgage pool (83 mortgage loans in loan group 1 or 71.8% and 20 mortgage loans in loan group 2 or 63.9%), permit the borrower, under certain conditions, to substitute United States government obligations as collateral for the related mortgage loans (or a portion thereof) following their respective lock-out or yield-maintenance periods. Upon substitution, the related mortgaged property (or, in the case of a mortgage loan secured by multiple mortgaged properties, one or more of such mortgaged properties) will no longer secure the related mortgage loan. The payments on the defeasance collateral are required to be at least equal to an amount sufficient to make, when du e, all payments on the related mortgage loan or allocated to the related mortgaged property; provided that in the case of certain mortgage loans, these defeasance payments may cease at the beginning of the open prepayment period with respect to that mortgage loan | |
S-49
| (or on a prepayment date thereafter that is prior to the scheduled maturity date), and the final payment on the defeasance collateral on that prepayment date would be required to fully prepay the mortgage loan. Defeasance may not occur prior to the second anniversary of the issuance of the certificates. See ‘‘DESCRIPTION OF THE MORTGAGE POOL—Certain Terms and Conditions of the Mortgage Loans—Prepayment Provisions’’ in this prospectus supplement. | ||
| Twenty Largest Mortgage Loans | The following table describes certain characteristics of the twenty largest mortgage loans or groups of cross collateralized mortgage loans in the trust fund by aggregate principal balance as of the cut-off date. With respect to the mortgage loans referred to as the Beacon D.C. & Seattle Pool mortgage loan, the ING Hospitality Pool mortgage loan and the DDR Southeast Pool mortgage loan in the immediately following table, the loan balance per square foot/room, the debt service coverage ratio and the loan-to-value ratio set forth in such table is based on the aggregate combined principal balance or combined debt service, as the case may be, and the pari passu companion loans (but not any related subordinate companion loan) and with respect to each mortgage loan with a related subordinate companion loan, the loan balance per square foot/room, the debt service coverage ratio and the loan-to-value ratio set forth in such table excludes any such subordinate companion loans. No companion loans are included in the trust fund. | |
| For more information on the twenty largest mortgage loans in the trust fund, see ‘‘DESCRIPTION OF THE MORTGAGE POOL—Twenty Largest Mortgage Loans’’ in this prospectus supplement and Annex D to this prospectus supplement. | ||
S-50
| Loan Name | Mortgage Loan Seller | Number of Mortgage Loans / Mortgaged Properties | Loan Group | Cut-Off Date Balance | % of Initial Pool Balance | % of Initial Group Balance | Property Type | Cut-Off Date Balance Per SF/ Room(1) | Weighted Average DSCR(1)(2) | Weighted Average Cut-Off Date LTV Ratio(1)(2) | Weighted Average LTV Ratio at Maturity or ARD(1)(2) | Weighted Average Mortgage Rate | |||||||||||||||||||||||||||||||||||||||||||||||||||
| Beacon D.C. & Seattle Pool(3) | Wachovia | 1/ 20 | 1 | $ | 414,000,000 | 10.8 | % | 12.2 | % | Office – Various | $ | 274 | 1.27 | x | 78.7 | % | 78.7 | % | 5.797 | % | |||||||||||||||||||||||||||||||||||||||||||
| ING Hospitality Pool | Wachovia | 1/ 46 | 1 | 283,850,000 | 7.4 | 8.4 | % | Hospitality – Extended Stay | $ | 97,947 | 2.14 | x | 63.8 | % | 63.8 | % | 5.663 | % | |||||||||||||||||||||||||||||||||||||||||||||
| DDR Southeast Pool | Wachovia | 1/ 52 | 1 | 221,250,000 | 5.8 | 6.5 | % | Retail – Anchored | $ | 121 | 1.51 | x | 63.5 | % | 63.5 | % | 5.600 | % | |||||||||||||||||||||||||||||||||||||||||||||
| Two Herald Square | Wachovia | 1/ 1 | 1 | 200,000,000 | 5.2 | 5.9 | % | Mixed Use – Office/Retail | $ | 564 | 1.25 | x | 66.7 | % | 66.7 | % | 5.920 | % | |||||||||||||||||||||||||||||||||||||||||||||
| Westin Casuarina Resort & Spa – Cayman Islands | Wachovia | 1/ 1 | 1 | 140,000,000 | 3.7 | 4.1 | % | Hospitality – Full Service | $ | 408,163 | 1.25 | x | 71.4 | % | 63.2 | % | 6.380 | % | |||||||||||||||||||||||||||||||||||||||||||||
| DDR-TRT Pool | Wachovia | 1/ 3 | 1 | 110,000,000 | 2.9 | 3.3 | % | Retail – Anchored | $ | 162 | 1.50 | x | 67.0 | % | 67.0 | % | 5.510 | % | |||||||||||||||||||||||||||||||||||||||||||||
| Ashford Hospitality Pool 4 | Wachovia | 1/ 5 | 1 | 103,906,000 | 2.7 | 3.1 | % | Hospitality – Various | $ | 74,431 | 1.36 | x | 74.3 | % | 69.4 | % | 5.952 | % | |||||||||||||||||||||||||||||||||||||||||||||
| 17 Battery Place South | Wachovia | 1/ 1 | 1 | 95,000,000 | 2.5 | 2.8 | % | Office – CBD | $ | 230 | 1.54 | x | 70.4 | % | 70.4 | % | 5.681 | % | |||||||||||||||||||||||||||||||||||||||||||||
| Rockvale Square | Wachovia | 1/ 1 | 1 | 92,400,000 | 2.4 | 2.7 | % | Retail – Outlet | $ | 171 | 1.38 | x | 80.0 | % | 80.0 | % | 5.755 | % | |||||||||||||||||||||||||||||||||||||||||||||
| Centerside II | Wachovia | 1/ 1 | 1 | 89,300,000 | 2.3 | 2.6 | % | Office – Suburban | $ | 311 | 1.66 | x | 56.1 | % | 56.1 | % | 5.645 | % | |||||||||||||||||||||||||||||||||||||||||||||
| 10/ 131 | $ | 1,749,706,000 | 45.8 | % | 1.50 | x | 69.9 | % | 68.9 | % | 5.786 | % | |||||||||||||||||||||||||||||||||||||||||||||||||||
| Citadel Mall | Wachovia | 1/ 1 | 1 | $ | 75,040,500 | 2.0 | % | 2.2 | % | Retail – Anchored | $ | 253 | 1.22 | x | 79.8 | % | 66.4 | % | 5.680 | % | |||||||||||||||||||||||||||||||||||||||||||
| Port Chester Shopping Center | Wachovia | 1/ 1 | 1 | 70,000,000 | 1.8 | 2.1 | % | Retail – Anchored | $ | 133 | 2.46 | x | 56.0 | % | 56.0 | % | 5.310 | % | |||||||||||||||||||||||||||||||||||||||||||||
| 60 Madison Avenue | Wachovia | 1/ 1 | 1 | 66,500,000 | 1.7 | 2.0 | % | Office – CBD | $ | 356 | 1.27 | x | 79.2 | % | 79.2 | % | 5.753 | % | |||||||||||||||||||||||||||||||||||||||||||||
| 3600 Wilshire Boulevard | Wachovia | 1/ 1 | 1 | 64,000,000 | 1.7 | 1.9 | % | Office – CBD | $ | 155 | 1.20 | x | 74.7 | % | 74.7 | % | 5.980 | % | |||||||||||||||||||||||||||||||||||||||||||||
| La Jolla Centre I | Wachovia | 1/ 1 | 1 | 60,000,000 | 1.6 | 1.8 | % | Office – Suburban | $ | 363 | 1.74 | x | 52.8 | % | 52.8 | % | 5.645 | % | |||||||||||||||||||||||||||||||||||||||||||||
| 450-460 Park Avenue South | Wachovia | 1/ 1 | 1 | 54,000,000 | 1.4 | 1.6 | % | Office – CBD | $ | 324 | 1.35 | x | 77.1 | % | 77.1 | % | 5.695 | % | |||||||||||||||||||||||||||||||||||||||||||||
| Stadium Crossings | Wachovia | 1/ 1 | 1 | 47,000,000 | 1.2 | 1.4 | % | Mixed Use – Office/Retail | $ | 284 | 1.30 | x | 76.1 | % | 76.1 | % | 5.590 | % | |||||||||||||||||||||||||||||||||||||||||||||
| La Jolla Centre II | Wachovia | 1/ 1 | 1 | 46,000,000 | 1.2 | 1.4 | % | Office – Suburban | $ | 313 | 2.11 | x | 45.7 | % | 45.7 | % | 5.645 | % | |||||||||||||||||||||||||||||||||||||||||||||
| Roosevelt Square | Wachovia | 1/ 1 | 1 | 46,000,000 | 1.2 | 1.4 | % | Retail – Anchored | $ | 149 | 1.20 | x | 78.0 | % | 78.0 | % | 5.550 | % | |||||||||||||||||||||||||||||||||||||||||||||
| Marriott – Mobile, AL | Wachovia | 1/ 1 | 1 | 44,000,000 | 1.2 | 1.3 | % | Hospitality – Full Service | $ | 175,299 | 1.31 | x | 75.2 | % | 65.8 | % | 5.890 | % | |||||||||||||||||||||||||||||||||||||||||||||
| 10/ 10 | $ | 572,540,500 | 15.0 | % | 1.53 | x | 69.6 | % | 67.1 | % | 5.670 | % | |||||||||||||||||||||||||||||||||||||||||||||||||||
| 20/ 141 | $ | 2,322,246,500 | 60.7 | % | 1.50 | x | 69.8 | % | 68.5 | % | 5.757 | % | |||||||||||||||||||||||||||||||||||||||||||||||||||
| (1) | The Beacon D.C. & Seattle Pool mortgage loan, the ING Hospitality Pool mortgage loan and the DDR Southeast Pool mortgage loan are part of split loan structures that include one or more pari passu companion loans that are not included in the trust fund. With respect to each mortgage loan, unless otherwise specified, the calculations of LTV Ratios, DSC Ratio and Cut-Off Date Balance per square foot/room are based on the aggregate indebtedness of or debt service on, as applicable, the mortgage loan and the related pari passu companio n loan, but not any related subordinate companion loan or future pari passu companion loan. |
| (2) | Certain of the mortgage loans reflect LTV Ratios that have been calculated on an ‘‘as-stabilized’’ basis, or have DSC Ratios that have been adjusted to take into account certain cash reserves, holdbacks or letters of credit or was calculated based on assumptions regarding the future financial performance of the related mortgaged property. See ‘‘Additional Mortgage Loan Information’’ herein. Also, see ‘‘DESCRIPTION OF THE MORTGAGE POOL—Additional Mortgage Loan Information’’ and ‘‘RISK FACTORS—The Mortgage Loans—Risks Relating to Net Cash Flow’’ and ‘‘—Inspections and Appraisals May Not Accurately Reflect Value or Condition of Mortgaged Property’’ in this Prospectus Supplement. |
| (3) | The Beacon D.C. & Seattle Pool mortgage loan includes 17 collateral properties and 3 cash flow assets. Collateral properties consist of office properties. |
| Co-Lender Loans | Ten (10) mortgage loans (loan numbers 1, 2, 3, 4, 8, 10, 15, 18, 26 and 100) to be included in the trust fund, representing approximately 37.9% of the mortgage pool as of the cut-off date (42.9% of loan group 1) are, in each case, evidenced by one of two or more notes or sets of notes which are secured by one or more mortgaged properties. In each case, the related companion loan or companion loans will not be part of the trust fund. | |
| Three (3) mortgage loans, the Beacon D.C. & Seattle Pool mortgage loan, the ING Hospitality Pool mortgage loan and the DDR Southeast Pool mortgage loan (loan numbers 1, 2 and 3), are part of split loan structures where one or more companion loans are part of the applicable split loan structure | ||
S-51
| and are pari passu in right of entitlement to payment with the related mortgage loan. The remaining co-lender loans (loan numbers 4, 8, 10, 15, 18, 26 and 100) are part of split loan structures in which the related companion loan(s) is subordinate to the related mortgage loan. In each case, the related companion loan or companion loans will not be part of the trust fund. Each of these mortgage loans and its related companion loans are subject to intercreditor agreements. | ||
| The intercreditor agreement for each of the Beacon D.C. & Seattle Pool mortgage loan, the ING Hospitality Pool mortgage loan, and the DDR Southeast Pool mortgage loan generally allocates collections in respect of each whole loan to the related mortgage loan and its related pari passu companion loan(s), on a pro rata basis. The intercreditor agreements for each of the remaining mortgage loans that are part of a split loan structure that includes one or more subordinate companion loans generally allocate collections in respect of that mortgage loan and its related subordinate companion loan(s) first, to the related mortgage loan, up to amounts due and payable thereon and then to the related subordinate companion loan(s) up to amounts due and payable thereon. However, prepayments will generally be allocated on a pro rata basis prior to default. No companion loan is included in the trust fund. No subordinate companion loan will bear losses or provide credit support in respect of unrelated mortgage loans. | ||
| The master servicer and special servicer will service and administer each of these mortgage loans and its related companion loans (other than the Beacon D.C. & Seattle Pool mortgage loan and its pari passu companion loans and, after the securitization of the DDR Southeast Pool pari passu Note A-1 companion loan, the DDR Southeast Pool mortgage loan and its related pari passu companion loans) pursuant to the pooling and servicing agreement and the related intercreditor agreement, for so long as the rela ted mortgage loan is part of the trust fund. | ||
| The Beacon D.C. & Seattle Pool mortgage loan and its companion loan is being serviced pursuant to the pooling and servicing agreement entered into in connection with the issuance of the Morgan Stanley Capital I Trust Commercial Mortgage Pass-Through Certificates, Series 2007-IQ14. The master servicer under the Morgan Stanley 2007-IQ14 pooling and servicing agreement is Wells Fargo Bank, N.A., the special servicer under the Morgan Stanley 2007-IQ14 pooling and servicing agreement is ARCap Special Servicing Inc. and the trustee under the Morgan Stanley 2007-IQ14 pooling and servicing agreement is The Bank of New York. The terms of the Morgan Stanley 2007-IQ14 pooling and servicing agreement are generally similar (but are not identical) to the terms of the pooling and servicing agreement for thi s | ||
S-52
| transaction. See ‘‘SERVICING OF THE MORTGAGE LOANS—Servicing of the Beacon D.C. & Seattle Pool Loan’’ in this prospectus supplement. | ||
| Upon the settlement of the Citigroup Commercial Mortgage Trust, Commercial Mortgage Pass-Through Certificates, Series 2007-C6, the DDR Southeast Pool mortgage loan and its companion loan are expected to be serviced pursuant to the pooling and servicing agreement entered into in connection with the issuance of the Citigroup Commercial Mortgage Trust, Commercial Mortgage Pass-Through Certificates, Series 2007-C6. The master servicer for the DDR Southeast Pool pari passu Note A-1 companion loan under the CGCMT 2007-C6 pooling and servicing agreement is expected to be Wachovia Bank, National Association, the special servicer under the CGCMT 2007-C6 pooling and servicing agreement is expected to be LNR Partners, Inc. and the trustee under the CGCMT 2007-C6 pooling and servicing agreement is expected t o be Wells Fargo Bank, N.A. The terms of the CGCMT 2007-C6 pooling and servicing agreement are generally similar (but are not identical) to the terms of the pooling and servicing agreement for this transaction. See ‘‘SERVICING OF THE MORTGAGE LOANS—Servicing of the DDR Southeast Pool Loan’’ in this prospectus supplement. | ||
| Amounts attributable to any companion loan will not be assets of the trust fund and will be beneficially owned by the holder of such companion loan. See ‘‘DESCRIPTION OF THE MORTGAGE POOL—Co-Lender Loans’’ in this prospectus supplement. | ||
| See ‘‘DESCRIPTION OF THE MORTGAGE POOL—Co-Lender Loans’’ and ‘‘SERVICING OF THE MORTGAGE LOANS’’ in this prospectus supplement for a description of certain rights of the holders of these companion loans to direct or consent to the servicing of the related mortgage loans. | ||
| In addition to the mortgage loans described above, certain of the mortgaged properties or the equity interests in the related borrowers are subject to, or are permitted to become subject to, additional debt. In certain cases, this additional debt is secured by the related mortgaged properties. See ‘‘RISK FACTORS—The Mortgage Loans—Additional Debt on Some Mortgage Loans Creates Additional Risks’’ in this prospectus supplement. | ||
S-53
Risk Factors
| • | You should carefully consider, among other things, the following risk factors (as well as the risk factors set forth under ‘‘RISK FACTORS’’ in the accompanying prospectus) before making your investment decision. Additional risks are described elsewhere in this prospectus supplement under separate headings in connection with discussions regarding particular aspects of the mortgage loans included in the trust fund or the certificates. |
| • | The risks and uncertainties described below are not the only ones relating to your certificates. Additional risks and uncertainties not presently known to us or that we currently deem immaterial may also impair your investment. |
| • | This prospectus supplement contains forward-looking statements that involve risk and uncertainties. Actual results could differ materially from those anticipated in these forward-looking statements as a result of certain factors, including risks described below and elsewhere in this prospectus supplement. |
| • | If any of the following risks are realized, your investment could be materially and adversely affected. |
| • | In connection with the risks and uncertainties described below which may relate to certain of the mortgage loans, or the mortgage pool in general, examples are given with respect to particular risks and particular mortgage loans. The fact that examples are given should not be interpreted to mean that the examples reflect all of the mortgage loans in the trust fund to which the risk is applicable. |
The Offered Certificates
Only Mortgage Loans Are Available to Pay You
Neither the offered certificates nor the mortgage loans will be guaranteed or insured by us or any of our affiliates, by any governmental agency or instrumentality or by any other person. If the assets of the trust fund, primarily the mortgage loans, are insufficient to make payments on the offered certificates, no other assets will be available for payment of the deficiency. See ‘‘RISK FACTORS—The Assets of the Trust Fund May Not Be Sufficient to Pay Your Certificates’’ in the accompanying prospectus.
In addition, with respect to 1 mortgage loan (loan number 1, representing 10.8% of the mortgage pool (12.2% of loan group 1), the collateral for the mortgage loan includes both real property secured by mortgage instruments and certain other non-mortgage assets (including a covenant to deposit certain cash flow interests in certain real properties into a lockbox and pledges of equity interests in entities that own certain real property). In the event of a default by the underlying borrowers, the trust fund will only be permitted to foreclose on the mortgaged assets and will not be permitted to foreclose on the non-mortgage assets. This limitation reduces the potential for realization on the value of the underlying collateral for the mortgage loan and may result in an insufficiency of collateral to satisfy the outstanding loan amount. See ‘‘Beacon D.C. & Seattle Pool’’ in Annex D to this prospectus supplement.
Prepayments Will Affect Your Yield
Prepayments. The yield to maturity on the offered certificates will depend on the rate and timing of principal payments (including both voluntary prepayments, in the case of mortgage loans that permit voluntary prepayment, and involuntary prepayments, such as prepayments resulting from casualty or condemnation, defaults, liquidations or repurchases for breaches of representations or warranties or other sales of defaulted mortgage loans which, in either case, may not require any accompanying prepayment premium or yield maintenance charge) on the mortgage loans included in the trust fund and how such payments are allocated among the offered certificates entitled to distributions of principal.
In addition, upon the occurrence of certain limited events, a party may be required or permitted to repurchase or purchase a mortgage loan from the trust fund and the money paid would be passed through to the holders of the certificates with the same effect as if such mortgage loan had been prepaid in full
S-54
(except that no prepayment premium or yield maintenance charge would be payable with respect to a purchase or repurchase). In addition, certain mortgage loans may permit prepayment without an accompanying prepayment premium or yield maintenance charge if the mortgagee elects to apply casualty or condemnation proceeds to the mortgage loan. We cannot make any representation as to the anticipated rate of prepayments (voluntary or involuntary) on the mortgage loans or as to the anticipated yield to maturity of any certificate.
With respect to 9 mortgage loans (loan numbers 1, 2, 3, 6, 7, 30, 36, 58 and 105), representing 31.7% of the mortgage pool (8 mortgage loans in loan group 1 or 34.9% and 1 mortgage loan in loan group 2 or 7.0%), under certain circumstances, including satisfaction of debt service reserve and loan-to-value tests, the related borrower is permitted to release a portion or portions of the mortgaged property in connection with a development rights release. In such an event, amounts paid by the related borrower will be applied pro rata among the mortgage loan and related mezzanine loans.
With respect to one mortgage loan (loan number 3), representing 5.8% of the mortgage pool (6.5% of loan group 1), the borrower may voluntarily prepay up to 10% of the initial principal balance of such loan at any time without any obligation to pay any yield maintenance charge or prepayment premium in connection with such prepayment.
With respect to 1 mortgage loan (loan number 106), representing 0.1% of the mortgage pool (0.2% of loan group 1), the mortgagee may, in the event the related mortgaged property fails to achieve certain debt service coverage or occupancy thresholds, require the balance of the mortgage loan to be prepaid.
In addition, because the amount of principal that will be distributed to the Class A-1, Class A-2, Class A-PB, Class A-3 and Class A-1A certificates and the Class A-4FL regular interest will generally be based upon the particular loan group in which the related mortgage loan is deemed to be a part, the yield on the Class A-1, Class A-2, Class A-PB and Class A-3 certificates and the Class A-4FL regular interest will be particularly sensitive to prepayments on mortgage loans in loan group 1 and the yield on the Class A-1A certificates will be particularly sensitive to prepayments on mortgage loans in loan group 2.
See ‘‘YIELD AND MATURITY CONSIDERATIONS’’ in this prospectus supplement and ‘‘YIELD CONSIDERATIONS’’ in the accompanying prospectus.
Yield. In general, if you purchase an offered certificate at a premium and principal distributions on that offered certificate occur at a rate faster than you anticipated at the time of purchase, and no prepayment premiums or yield maintenance charges are collected, your actual yield to maturity may be lower than you had predicted at the time of purchase. Conversely, if you purchase an offered certificate at a discount and principal distributions on that offered certificate occur at a rate slower than you anticipated at the time of purchase, your actual yield to maturity may be lower than you had predicted at the time of purchase.
The yield on the Class A-2, Class A-PB, Class A-3, Class A-1A, Class A-J, Class B, Class C, Class D, Class E and Class F certificates could be adversely affected if mortgage loans with higher mortgage interest rates pay faster than mortgage loans with lower mortgage interest rates, since those classes bear interest at a rate equal to, based upon or limited by the weighted average net mortgage rate of the mortgage loans. In addition, because there can be no assurances with respect to losses, prepayments and performance of the mortgage loans, there can be no assurance that distributions of principal on the Class A-PB certificates will be made in conformity with the schedule attached on Annex F to this prospectus supplement.
The yield on the Class IO certificates is particularly sensitive to the rate and timing of principal payments made in reduction of the component balance of components of the Class IO. Investors in Class IO certificates should consider the risk that a rapid rate of prepayments on the mortgage loans could result in the failure to fully recoup your initial investment. Any payment in reduction of the certificate balance of any class of the certificates (other than the Class IO, Class Z, Class R-I and Class R-II certificates) and the Class A-4FL regular interest and the Class A-MFL regular interest and any losses allocated in reduction of the certificate balance of any class of the certificates (other than the Class IO, Class Z, Class R-I and Class R-II certificates) and the Class A-4FL regular interest and the Class A-MFL regular interest will also result in a corresponding reduction in the notional amount of the Class IO
S-55
certificates. Thus, the yield on the Class IO certificates will be extremely sensitive to the rate and timing of principal payments on the mortgage loans, and the more quickly the component of the Class IO certificates is reduced, the greater will be the negative effect on the yield of the Class IO certificates, to the extent such effect is not offset by distributions to you of a portion of any applicable prepayment premiums or yield maintenance charges as described in ‘‘DESCRIPTION OF THE CERTIFICATES—Distributions—Allocation of Prepayment Premiums and Yield Maintenance Charges’’ in this prospectus supplement.
Interest Rate Environment. Mortgagors generally are less likely to prepay if prevailing interest rates are at or above the rates borne by their mortgage loans. On the other hand, mortgagors are generally more likely to prepay if prevailing interest rates fall significantly below the mortgage interest rates of their mortgage loans. Mortgagors are generally less likely to prepay mortgage loans with a lockout period, yield maintenance charge or prepayment premium provision, to the extent enforceable, than similar mortgage loans without such provisions, with shorter lockout periods or with lower yield maintenance charges or prepayment premiums.
Performance Escrows. In connection with the origination of some of the mortgage loans, the related borrowers were required to escrow funds or post a letter of credit related to obtaining certain performance objectives. In general, such funds will be released to the related borrower upon the satisfaction of certain conditions. If the conditions are not satisfied, although the master servicer will be directed in the pooling and servicing agreement (in accordance with the servicing standard) to hold the escrows, letters of credit or proceeds of such letters of credit as additional collateral and not use the funds to reduce the principal balance of the related mortgage loan, in the event such funds are required to be used to reduce the principal balance of such mortgage loans, such amounts will be passed through to the holders of the certificates as p rincipal prepayments.
See ‘‘YIELD AND MATURITY CONSIDERATIONS—Yield Considerations’’ and the modeling assumptions described in ‘‘YIELD AND MATURITY CONSIDERATIONS—Weighted Average Life’’ in this prospectus supplement.
Premiums. Provisions requiring prepayment premiums and yield maintenance charges may not be enforceable in some states and under federal bankruptcy law, and may constitute interest for usury purposes. Accordingly, we cannot provide assurance that the obligation to pay that premium or charge will be enforceable or, if enforceable, that the foreclosure proceeds will be sufficient to pay such prepayment premium or yield maintenance charge. Additionally, although the collateral substitution provisions related to defeasance are not intended to be, and do not have the same effect on the certificateholders as a prepayment, we cannot provide assurance that a court would not interpret such provisions as requiring a prepayment premium or yield maintenance charge and possibly determine that such provisions are unenforceable or usurious under applicable law. Prepayment premiums and yield maintenance charges are generally not charged for prepayments resulting from casualty or condemnation and would not be paid in connection with repurchases of mortgage loans for breaches of representations or warranties or a material document defect. No prepayment premium or yield maintenance charge will be required for prepayments in connection with a casualty or condemnation unless, in the case of certain of the mortgage loans, an event of default has occurred and is continuing.
Pool Concentrations. Principal payments (including prepayments) on the mortgage loans included in the trust fund or in a particular group will occur at different rates. In addition, mortgaged properties can be released from the trust fund as a result of prepayments, defeasance, repurchases, casualties or condemnations. As a result, the aggregate balance of the mortgage loans concentrated in various property types in the trust fund or in a particular loan group changes over time. You therefore may be exposed to varying concentration risks as the mixture of property types and relative principal balance of the mortgage loans associated with certain property types changes. See the table entitled ‘‘Range of Remaining Terms to Maturity or Anticipated Repayment Date for all Mortgage Loans as of the Cut-Off Date’’ in Annex B to this prospectus supplement for a description of the respective maturity dates of the mortgage loans included in the trust fund and in each loan group. Because principal on the certificates (other than the Class IO, Class Z, Class R-I and Class R-II certificates) and the Class A-4FL regular interest and Class A-MFL regular interest is payable in sequential order to the extent described under ‘‘DESCRIPTION
S-56
OF THE CERTIFICATES—Distributions’’ in this prospectus supplement, classes that have a lower priority of distributions are more likely to be exposed to the risk of changing concentrations discussed under ‘‘—The Mortgage Loans—Special Risks Associated With High Balance Mortgage Loans’’ below than classes with a higher sequential priority.
Optional Early Termination of the Trust Fund May Result in an Adverse Impact on Your Yield or May Result in a Loss
The offered certificates will be subject to optional early termination by means of the purchase of the mortgage loans in the trust fund. We cannot assure you that the proceeds from a sale of the mortgage loans will be sufficient to distribute the outstanding certificate balance plus accrued interest and any undistributed shortfalls in interest accrued on the certificates that are subject to the termination. Accordingly, the holders of offered certificates affected by such a termination may suffer an adverse impact on the overall yield on their certificates, may experience repayment of their investment at an unpredictable and inopportune time or may even incur a loss on their investment. See ‘‘DESCRIPTION OF THE CERTIFICATES—Termination’’ in this prospectus supplement.
Borrower Defaults May Adversely Affect Your Yield
The aggregate amount of distributions on the offered certificates, the yield to maturity of the offered certificates, the rate of principal payments on the offered certificates and the weighted average life of the offered certificates will be affected by the rate and timing of delinquencies and defaults on the mortgage loans included in the trust fund. Delinquencies on the mortgage loans included in the trust fund, if the delinquent amounts are not advanced, may result in shortfalls in distributions of interest and/or principal to the offered certificates for the current month. Any late payments received on or in respect of the mortgage loans will be distributed to the certificates in the priorities described more fully in this prospectus supplement, but no interest will accrue on such shortfall during the period of time such payment is delinquent.
If you calculate your anticipated yield based on an assumed default rate and an assumed amount of losses on the mortgage pool that are lower than the default rate and the amount of losses actually experienced, and if such losses are allocated to your class of certificates, your actual yield to maturity will be lower than the yield so calculated and could, under certain scenarios, be negative. The timing of any loss on a liquidated mortgage loan also will affect the actual yield to maturity of the offered certificates to which all or a portion of such loss is allocable, even if the rate of defaults and severity of losses are consistent with your expectations. In general, the earlier you bear a loss, the greater the effect on your yield to maturity. See ‘‘YIELD AND MATURITY CONSIDERATIONS’’ in this prospectus supplement and ‘‘YIELD CONSIDERATIONS’’ in the accompanying prospectus.
Even if losses on the mortgage loans included in the trust fund are allocated to a particular class of offered certificates, such losses may affect the weighted average life and yield to maturity of other certificates. Losses on the mortgage loans, to the extent not allocated to such class of offered certificates, may result in a higher percentage ownership interest evidenced by such certificates than would otherwise have resulted absent such loss. The consequent effect on the weighted average life and yield to maturity of the offered certificates will depend upon the characteristics of the remaining mortgage loans.
Additional Compensation and Certain Reimbursements to the Servicer Will Affect Your Right to Receive Distributions
To the extent described in this prospectus supplement, the master servicer, the special servicer or the trustee, as applicable, will be entitled to receive interest on unreimbursed advances and unreimbursed servicing expenses. See ‘‘RISK FACTORS—The Offered Certificates—Additional Compensation and Certain Reimbursements to the Servicer Will Affect Your Right to Receive Distributions’’ in the accompanying prospectus.
Subordination of Subordinate Offered Certificates
As described in this prospectus supplement, unless your certificates are Class A-1, Class A-2, Class A-PB, Class A-3, Class A-1A or Class IO certificates or the Class A-4FL regular interest or the
S-57
Class A-MFL regular interest, your rights to receive distributions of amounts collected or advanced on or in respect of the mortgage loans will be subordinated to those of the holders of the offered certificates with an earlier payment priority. See ‘‘DESCRIPTION OF THE CERTIFICATES—Distributions—Application of the Available Distribution Amount’’ and ‘‘DESCRIPTION OF THE CERTIFICATES—Subordination; Allocation of Losses and Certain Expenses’’ in this prospectus supplement.
Your Lack of Control Over the Trust Fund Can Create Risks
You and other certificateholders generally do not have a right to vote and do not have the right to make decisions with respect to the administration of the trust fund. See ‘‘SERVICING OF THE MORTGAGE LOANS—General’’ in this prospectus supplement. Those decisions are generally made, subject to the express terms of the pooling and servicing agreement, by the master servicer, the trustee or the special servicer, as applicable. Any decision made by one of those parties in respect of the trust fund, even if that decision is determined to be in your best interests by that party, may be contrary to the decision that you or other certificateholders would have made and may negatively affect your interests.
Under certain circumstances, the consent or approval of less than all certificateholders will be required to take, and will bind all certificateholders to, certain actions relating to the trust fund. The interests of those certificateholders may be in conflict with those of the other certificateholders. For example, certificateholders of certain classes that are subordinate in right of payment may direct the actions of the special servicer with respect to troubled mortgage loans and related mortgaged properties. In certain circumstances, the holder of a companion loan, mezzanine loan or subordinate debt may direct the actions of the special servicer with respect to the related mortgage loan and the holder of a companion loan, mezzanine loan or subordinate debt will have certain consent rights relating to foreclosure or modification of the related loans. The interests of such holder of a companion loan, mezzanine loan or subordinate debt may be in conflict with t hose of the certificateholders.
Ten (10) of the mortgage loans (loan numbers 1, 2, 3, 4, 8, 10, 15, 18, 26 and 100), representing 37.9% of the mortgage pool (42.9% of loan group 1), are each part of a split loan structure in which the related whole loan is evidenced by multiple promissory notes. With respect to 3 of these mortgage loans, the Beacon D.C. & Seattle Pool mortgage loan, the ING Hospitality Pool mortgage loan and the DDR Southeast Pool mortgage loans (loan numbers 1, 2 and 3), representing 24.0% of the mortgage pool (27.2% of loan group 1), the related mortgage loan is part of a split loan structure where the related companion loan(s) that is part of the split loan structure is pari passu in right of payment with the related mortgage loan, and the holder of the related pari passu companion note has certain control, consultation and/or consent rights with respect to the servicing and/or administration of the related mortgage loan. Only one of the pari passu notes is included in the trust fund. With respect to mortgage loans (not including the 3 mortgage loans discussed above) evidenced by multiple promissory notes, the related mortgage loans are each part of a split loan structure where one or more promissory notes are subordinate in right of payment to the other promissory note. In each case, the trust fund does not include the subordinate companion note(s). In addition, such holders of the pari passu companion note or the subordinate companion notes may have been granted various rights and powers pursuant to the related intercreditor agreement or other similar agreement, including cure rights and purchase options with respect to the related mortgage loans and, in the case of certain subordinate companion loans, the right to direct, approve or disapprove servicing actions involving the related whole loan and to replace the special servicer for the related whole loan. In some cases, the foregoing rights and powers may be assignable or may be exercised through a representative or designee. Accordingly, these rights may potentially conflict with the interests of the certificateholders.
Additionally, less than all of the certificateholders may amend the pooling and servicing agreement in certain circumstances.
See ‘‘SERVICING OF THE MORTGAGE LOANS—The Controlling Class Representative’’ in this prospectus supplement and ‘‘DESCRIPTION OF THE CERTIFICATES—Voting Rights’’ in this prospectus supplement and the accompanying prospectus.
S-58
The Mortgage Loan Sellers, the Depositor and the Issuing Entity Are Subject to Bankruptcy or Insolvency Laws That May Affect the Trust Fund’s Ownership of the Mortgage Loans
In the event of the bankruptcy or insolvency of any mortgage loan seller or the depositor, it is possible the trust fund’s right to payment from or ownership of the mortgage loans could be challenged, and if such challenge were successful, delays or reductions in payments on your certificates could occur.
Based upon opinions of counsel that the conveyance of the mortgage loans would generally be respected in the event of a bankruptcy or insolvency of a mortgage loan seller or the depositor, which opinions are subject to various assumptions and qualifications, the depositor and the issuing entity believe that such a challenge will be unsuccessful, but there can be no assurance that a bankruptcy trustee, if applicable, or other interested party will not attempt to assert such a position. Even if actions seeking such results were not successful, it is possible that payments on the certificates would be delayed while a court resolves the claim.
In addition, since the issuing entity is a common law trust, it may not be eligible for relief under the federal bankruptcy laws, unless it can be characterized as a ‘‘business trust’’ for purposes of the federal bankruptcy laws. Bankruptcy courts look at various considerations in making this determination, so it is not possible to predict with any certainty whether or not the issuing entity would be characterized as a ‘‘business trust.’’ Even if a bankruptcy court were to determine that the issuing entity was a ‘‘business trust,’’ it is possible that payments on the certificates would be delayed while the court resolved the issue.
Liquidity for Certificates May Be Limited
There is currently no secondary market for the offered certificates. While each underwriter has advised us that it intends to make a secondary market in one or more classes of the offered certificates, none of them are under any obligation to do so. No secondary market for your certificates may develop. If a secondary market does develop, there can be no assurance that it will be available for the offered certificates or, if it is available, that it will provide holders of the offered certificates with liquidity of investment or continue for the life of your certificates.
Lack of liquidity could result in a substantial decrease in the market value of your certificates. Your certificates will not be listed on any securities exchange at the time of closing and may never be listed on any securities exchange or traded in any automated quotation system of any registered securities association such as NASDAQ.
Potential Conflicts of Interest
The master servicer is one of the mortgage loan sellers, a sponsor, the swap counterparty and an affiliate of the depositor and one of the underwriters. These affiliations could cause conflicts with the master servicer’s duties to the trust fund under the pooling and servicing agreement. However, the pooling and servicing agreement provides that the mortgage loans shall be administered in accordance with the servicing standard described in this prospectus supplement without regard to an affiliation with a mortgage loan seller, any other party to the pooling and servicing agreement or any of their affiliates. See ‘‘SERVICING OF THE MORTGAGE LOANS—General’’ in this prospectus supplement.
It is expected that approximately $375 million of the initial Certificate Balance of the Class A-3 Certificates will be sold on the closing date to Wachovia Capital Markets, LLC or an affiliate. Wachovia Securities is one of the underwriters and also an affiliate of the Depositor. It is anticipated such Class A-3 Certificates will thereafter be sold for inclusion in a collateralized debt obligation transaction.
Wachovia Bank, National Association, the master servicer, a sponsor and one of the mortgage loan sellers, may finance the acquisition of certain of the certificates by one or more investors from time to time.
The trustee is also the master servicer under the Morgan Stanley Capital I Trust, Commercial Mortgage Pass-Through Certificates, Series 2007-IQ14 pooling and servicing agreement. This affiliation could cause conflicts with the trustee’s duties to the trust fund under the pooling and servicing agreement.
Wachovia Bank, National Association (which is the master servicer, a mortgage loan seller and a sponsor) or one of its affiliates is also the initial holder of certain companion loans with respect to 6
S-59
mortgage loans (loan numbers 2, 4, 8, 10, 15 and 18), representing 20.2% of the mortgage pool (22.9% of loan group 1). In addition, Wachovia Bank, National Association is also an equity owner of Capital Lease, LP, the holder of the companion loans with respect to 1 mortgage loan (loan number 100, representing 0.2% of the mortgage pool (0.2% of loan group 1). In addition, Wachovia Bank, National Association is the initial holder of the mezzanine loans related to 2 mortgage loans (loan numbers 1 and 72), representing 11.1% of the mortgage pool (12.6% of loan group 1). Accordingly, a conflict may arise between Wachovia Bank, National Association’s duties to the trust fund under the pooling and servicing agreement and its or its affiliate’s interest as a holder of a companion loan, mezzanine loan or the holder of certain certificates. See ‘‘DESCRIPTION OF THE MORTGAGE POOL—Co-Lender Loans’’ in this prospectus supplement. In addition, Wachovia Bank, National Associat ion is a partial equity owner of Triple Net Properties, LLC, which is an affiliate of the borrower with respect to 4 mortgage loans (loan numbers 35, 57, 66 and 85), representing 1.7% of the mortgage pool (3 mortgage loans in loan group 1 or 1.5% and 1 mortgage loan in loan group 2 or 2.8%). Accordingly, a conflict may arise between Wachovia Bank, National Association’s duties to the trust fund under the pooling and servicing agreement and its or its affiliate’s interest as a holder of a companion loan, the holder of mezzanine indebtedness or the holder of certain other indebtedness secured by the related mortgaged property. See ‘‘DESCRIPTION OF THE MORTGAGE POOL—Certain Terms and Conditions of the Mortgage Loans—Other Financing’’ in this prospectus supplement.
In addition, with respect to 4 mortgage loans (loan numbers 25, 31, 80 and 96), representing 2.2% of the mortgage pool (18.8% of loan group 2), Wachovia Development Corporation, an affiliate of Wachovia Bank, National Association, owns a preferred equity interest in the related borrower. As a result, a conflict could have arisen during the origination process as a result of Wachovia Bank, National Association being the originator of the related mortgage loan as well as the owner of the equity interests in the related borrower. In addition, a conflict may arise between Wachovia Bank, National Association’s duties to the trust fund under the pooling and servicing agreement and its affiliate’s equity interest in the related borrower. However, the pooling and servicing agreement provides that the mortgage loans shall be administered in accordance with the servicing standard described in this prospectus supplement without regard to any relationship that t he master servicer or any affiliate thereof may have with the related borrower. In addition, the special servicer (and any related sub-servicer) will be involved in determining whether to modify or foreclose a defaulted mortgage loan. The special servicer is not affiliated with the master servicer or the related borrower.
Each of the master servicer, special servicer or any of their respective affiliates may, especially if it holds the non-offered certificates or subordinate companion loan(s) related to a mortgage loan, or has financial interests in, or other financial dealings with, a borrower or mortgage loan seller under any of the mortgage loans, have interests when dealing with the mortgage loans that are in conflict with the interests of holders of the offered certificates. For instance, if the special servicer or an affiliate holds non-offered certificates or subordinate companion loan(s) related to a mortgage loan, the special servicer could seek to reduce the potential for losses allocable to those certificates or subordinated companion loans from a troubled mortgage loan by deferring acceleration in the hope of maximizing future proceeds. The special servicer might also seek to reduce the potential for such losses by accelerating the mortgage loan earlier than necessary to avoid advance interest or additional trust fund expenses. Either action could result in less proceeds to the trust fund than would be realized if alternate action had been taken. In general, the master servicer, special servicer or any of their respective affiliates is not required to act in a manner more favorable to the holders of the offered certificates or any particular class of offered certificates than to the holders of the non-offered certificates or subordinated companion loans.
The special servicer will (and any related sub-servicer may) be involved in determining whether to modify or foreclose a defaulted mortgage loan. An affiliate of the special servicer may purchase certain other non-offered certificates. The special servicer or its affiliates may acquire non-performing loans or interests in non-performing loans, which may include REO properties that compete with the mortgaged properties securing mortgage loans in the trust fund. The special servicer or its affiliates own and are in the business of acquiring assets similar in type to the assets of the trust fund. The special servicer or its affiliates may also make loans on properties that may compete with the mortgaged properties and may also advise other clients that own or are in the business of owning properties that compete with the
S-60
mortgaged properties or that own loans like the mortgage loans included in the trust fund. Accordingly, the assets of the special servicer and its affiliates may, depending upon the particular circumstances including the nature and location of such assets, compete with the mortgaged properties for tenants, purchasers, financing and so forth. See ‘‘SERVICING OF THE MORTGAGE LOANS—Modifications, Waivers and Amendments’’ in this prospectus supplement.
If the holder of a subordinate companion loan exercises its right (if any) to replace the special servicer for purposes of the special servicing of the related whole loan, the circumstances described above would generally apply to the replacement special servicer.
The circumstances described above could cause a conflict between the special servicer’s duties to the trust fund under the pooling and servicing agreement and its interest as a holder of a certificate. However, the pooling and servicing agreement provides that the mortgage loans shall be administered in accordance with the servicing standard without regard to ownership of any certificate by the master servicer, the special servicer or any affiliate of the special servicer. See ‘‘SERVICING OF THE MORTGAGE LOANS—General’’ in this prospectus supplement.
In addition, the related property managers and borrowers may experience conflicts of interest in the management and/or ownership of the mortgaged properties securing the mortgage loans because:
| • | a substantial number of the mortgaged properties are managed by property managers affiliated with the respective borrowers; or |
| • | these property managers also may manage and/or franchise additional properties, including properties that may compete with the mortgaged properties: or |
| • | affiliates of the property manager and/or the borrowers or the property managers and/or the borrowers themselves also may own other properties, including competing properties; or |
| • | the mortgaged property is self-managed. |
For example, with respect to 9 mortgage loans (loan numbers 3, 4, 6, 9, 10, 12, 15, 18 and 19), representing 24.5% of the mortgage pool (27.7% of loan group 1), the property manager for each of the 62 mortgaged properties securing the mortgage loans is an affiliate of the sponsor. See ‘‘DESCRIPTION OF THE MORTGAGE POOL—Twenty Largest Mortgage Loans’’ and Annex D to this prospectus supplement.
Moreover, with respect to certain of the mortgage loans, no lockbox has been established and the property manager has access to the proceeds from the related mortgaged property prior to such amounts being required to be deposited in the related escrow accounts or being paid to the mortgagee as debt service payments. Accordingly, since certain of these mortgage loans are managed by, or in the future may be managed by an affiliate of the related borrower, a potential conflict of interest could arise when such affiliated property manager receives proceeds from the related mortgaged property in a borrower-controlled account.
In addition, certain mortgage loans included in the trust fund may have been refinancings of debt previously held by (or by an affiliate of) one of the mortgage loan sellers.
The activities of the mortgage loan sellers and their affiliates may involve properties which are in the same markets as the mortgaged properties underlying the certificates. In such case, the interests of each of the mortgage loan sellers or such affiliates may differ from, and compete with, the interests of the trust fund, and decisions made with respect to those assets may adversely affect the amount and timing of distributions with respect to the certificates.
The Mortgage Loans
Future Cash Flow and Property Values Are Not Predictable
A number of factors, many beyond the control of the property owner, may affect the ability of an income-producing real estate project to generate sufficient net operating income to pay debt service and/or to maintain its value.
S-61
Certain of the mortgaged properties securing mortgage loans included in the trust fund have leases that expire or may be subject to tenant termination rights prior to the maturity date of the related mortgage loan. In addition, certain of the mortgaged properties securing mortgage loans included in the trust fund are leased to a single tenant which subjects the related borrower to increased risks in the event the tenant vacates and a replacement tenant is not readily available. See ‘‘—Single Tenants and Concentration of Tenants Subject the Trust Fund to Increased Risk’’ in this prospectus supplement.
In addition, with respect to 6 mortgage loans (loan numbers 20, 100, 104, 129, 136 and 141), representing 1.6% of the mortgage pool (1.8% of loan group 1), certain of the major tenants at the related mortgaged property or other persons have rights of first refusal and/or purchase options on the related mortgaged property in accordance with the terms of the related mortgage loan documents. There can be no assurance that if such options are not waived, the mortgagee’s ability to sell the related mortgaged property at or after foreclosure may be impaired or may adversely affect the foreclosure proceeds or sale proceeds in a post-foreclosure sale.
If leases are not renewed or replaced, if tenants default, if rental rates fall, if tenants vacate the related mortgaged property during the terms of their respective leases and/or if operating expenses increase, the borrower’s ability to repay the loan may be impaired and the resale value of the property, which is substantially dependent upon the property’s ability to generate income, may decline. Even if borrowers successfully renew leases or relet vacated space, the costs associated with reletting, including tenant improvements, leasing commissions and free rent, can exceed the amount of any reserves maintained for that purpose and reduce cash from the mortgaged properties. Although some of the mortgage loans included in the trust fund require the borrower to maintain escrows for leasing expenses, there is no guarantee that these reserves will be sufficient. For example, with respect to 1 mortgage loan (loan number 4), representing 5.2% of the mor tgage pool (5.9% of loan group 1), the mortgagee required the related borrower to maintain a debt service reserve in the amount of $11,000,000 to offset a projected shortfall in cashflow at the mortgaged property. Although the related borrower anticipates this will be sufficient, there can be no assurances that it will be or that the mortgaged property will improve so that it supports the debt service on the mortgaged property without regard to the debt service reserve. See the description of ‘‘Two Herald Square’’ in Annex D hereto. In addition, with respect to 1 mortgage loan (loan number 15), representing 1.6% of the mortgage pool (1.8% of loan group 1), the mortgagee required the related borrower to maintain a debt service reserve in the amount of $2,155,760 to offset a shortfall in current cashflow at the mortgaged property. Although the related borrower anticipates this will be sufficient, there can be no assurances that it will be or that the mortgaged property will improve so t hat it supports the debt service on the mortgaged property without regard to the debt service reserve. See the description of ‘‘La Jolla Centre I’’ in Annex D hereto.
In addition, there are other factors, including changes in zoning or tax laws, restrictive covenants, tenant exclusives and rights of first refusal to lease or purchase, the availability of credit for refinancing and changes in interest-rate levels that may adversely affect the value of a project and/or the borrower’s ability to sell or refinance without necessarily affecting the ability to generate current income. In addition, certain of the mortgaged properties may be leased in whole or in part by government-sponsored tenants who may have certain rights to cancel their leases or reduce the rent payable with respect to such leases at any time for, among other reasons, lack of appropriations. For example, with respect to 5 mortgaged properties (loan numbers 1.02, 1.10, 1.11, 1.13 and 48), representing, by allocated loan amount, 2.8% of the mortgage pool (3.2% of loan group 1), all or a material portion of the rentable area at the related mortgaged pro perties is occupied by one or more U.S. government or state government agencies. Certain U.S. government or state government leases generally may permit the related tenant to terminate its lease due to any lack of appropriations, and state government leases may permit the related tenant to terminate its lease after a specified date contained in the respective lease, some of which may be prior to the maturity date of the related mortgage loan, subject to certain terms and conditions contained therein.
Some Mortgaged Properties May Not Be Readily Convertible to Alternative Uses
Some of the mortgaged properties securing the mortgage loans included in the trust fund may not be readily convertible (or convertible at all) to alternative uses if those properties were to become unprofitable for any reason. For example, a mortgaged property may not be readily convertible (or
S-62
convertible at all) due to restrictive covenants related to such mortgaged property including, in the case of mortgaged properties that are part of a condominium regime, the use and other restrictions imposed by the condominium declaration and other related documents, especially in a situation where a mortgaged property does not represent the entire condominium regime. In addition, mortgaged properties that have been designated as historic sites, may be difficult to convert to alternative uses and may also require certain governmental approvals to make alterations or modifications to the related mortgaged property. In addition, converting commercial properties to alternate uses generally requires substantial capital expenditures. The liquidation value of any mortgaged property, subject to limitations of the kind described above or other limitations on convertibility of use, may be substantially less than would be the case if the property were readily adaptable to other uses.
See ‘‘—Special Risks Associated with Industrial and Mixed-Use Facilities’’ below.
Borrowers’ Recent Acquisition of the Mortgaged Properties.
The related borrowers under 61 mortgage loans, representing 59.3% of the mortgage pool (47 mortgage loans in loan group 1 or 58.2% and 14 mortgage loans in loan group 2 or 67.9%), acquired all or part of their related mortgaged property contemporaneously with the origination of the related mortgage loan or within the prior 12 months of origination. Accordingly, these borrowers may have limited experience operating the particular mortgaged properties and, therefore, there is a risk that the net operating income and cash flow of such mortgaged properties may vary significantly from the operations, net operating income and cash flow generated by the related mortgaged properties under prior ownership and management.
Risks Relating to Certain Property Types
Particular types of income properties are exposed to particular risks. For instance:
Special Risks Associated with Office Properties
Office properties secure, in whole or in part, 31 of the mortgage loans included in the trust fund as of the cut-off date, representing 30.6% of the mortgage pool (34.6% of loan group 1). See ‘‘RISK FACTORS—The Mortgage Loans—Special Risks of Mortgage Loans Secured by Office Properties’’ in the accompanying prospectus.
Included in the mortgage loans secured by office properties are 5 mortgage loans (loan numbers 57, 85, 93, 98 and 124), representing approximately 1.1% of the mortgage pool (1.2% of loan group 1) that are secured by medical office properties. The performance of a medical office property may depend on (i) the proximity of such property to a hospital or other health care establishment and (ii) reimbursements for patient fees from private or government-sponsored insurers. Issues related to reimbursements (ranging from non-payment to delays in payment) from such insurers could adversely impact cash flow at such mortgaged properties.
Although the Barchester Pool mortgage loan is not secured by the office building improving the mortgaged property, the borrower’s ability to make its debt service payments will be solely dependent on the ground lessee’s ability to make its obligations under the ground lease, which is in turn dependent on the underlying tenants occupying the office building (as well as the 2 mixed use buildings and 2 multifamily buildings) meeting their obligations under their individual leases.
Special Risks Associated with Multifamily Properties
Multifamily properties secure, in whole or in part, 29 of the mortgage loans included in the trust fund as of the cut-off date, representing 11.6% of the mortgage pool and all of the mortgage loans in loan group 2. See ‘‘RISK FACTORS—Special Risks of Mortgage Loans Secured by Multifamily Properties’’ in the accompanying prospectus.
Special Risks Associated with Retail Properties
Retail properties, including shopping centers, secure, in whole or in part, 46 of the mortgage loans included in the trust fund as of the cut-off date, representing 26.8% of the mortgage pool (30.4% of loan
S-63
group 1). See ‘‘RISK FACTORS—Special Risks of Mortgage Loans Secured by Retail Properties’’ and ‘‘Special Risks Associated with Shopping Center and Other Retail Properties’’ in the accompanying prospectus.
In addition, 2 mortgaged properties (loan numbers 3.01 and 32), representing by allocated loan amount 1.0% of the mortgage pool (1.2% of loan group 1), have a movie theater as one of the significant tenants. These mortgaged properties are exposed to certain unique risks. In recent years, the theater industry has experienced a high level of construction of new theaters and an increase in competition among theater operators. These developments have caused some operators to experience financial difficulties, resulting in downgrades in their credit ratings and, in certain cases, bankruptcy filings. In addition, because of the unique construction requirements of theaters, any vacant theater space would not easily be converted to other uses.
Special Risks Associated with Industrial and Mixed-Use Facilities
Industrial properties secure, in whole or in part, 10 of the mortgage loans included in the trust fund as of the cut-off date, representing 1.8% of the mortgage pool (2.0% of loan group 1).
Mixed use properties secure, in whole or in part, 11 of the mortgage loans included in the trust fund as of the cut-off date, representing 9.6% of the mortgage pool (10.8% of loan group 1). See ‘‘RISK FACTORS—Special Risks of Mortgage Loans Secured by Industrial and Mixed-Use Facilities’’ in the accompanying prospectus.
Mixed use mortgaged properties consist of either (i) office and retail components, (ii) office, retail and multifamily components, (iii) retail, industrial and parking garage components or (iv) office and warehouse components and as such, mortgage loans secured by mixed-use properties will share the risks associated with such underlying components. See ‘‘—Special Risks Associated with Office Properties’’,
‘‘—Special Risks Associated with Multifamily Properties’’ and ‘‘—Special Risks Associated with Retail Properties’’ in this prospectus supplement and ‘‘RISK FACTORS—Special Risks of Mortgage Loans Secured by Office Properties’’, ‘‘—Special Risks of Mortgage Loans Secured by Retail Properties’’, ‘‘—Special Risks of Mortgage Loans Secured by Multifamily Properties’’ and ‘‘—Special Risks of Mortgage Loans Secured by Industrial and Mixed-Use Facilities’’ in the accompanying prospectus.
Special Risks Associated with Hospitality Properties
Hospitality properties secure, in whole or in part, 12 of the mortgage loans included in the trust fund as of the cut-off date, representing 18.7% of the mortgage pool (21.2% of loan group 1). See ‘‘RISK FACTORS—Special Risks of Mortgage Loans Secured by Hospitality Properties’’ in the accompanying prospectus. Certain mortgage loans included in the trust fund are secured by hospitality properties that are not affiliated with a hotel chain. The lack of a franchise affiliation, or of a nationally known franchise affiliation, may adversely affect the performance of a hotel property.
With respect to mortgage loans included in the trust fund that are secured by hospitality properties that are affiliated with a hotel chain by means of management agreements or franchise or licensing agreements, such agreements generally impose affirmative obligations on the owners, franchisees or licensees with respect to hotel operations. If the owner, franchisee or licensee does not comply with such obligations, it may lose its management agreement, franchise or license. Any provision in a franchise agreement or management agreement providing for termination because of a bankruptcy of a franchisor or manager generally will not be enforceable. Replacement franchise licenses may require significantly higher fees.
The transferability of franchise license agreements is restricted. In the event of a foreclosure, the mortgagee or its agent would not have the right to use the franchise license without the franchisor’s consent. Conversely, in the case of certain mortgage loans, the mortgagee may be unable to terminate a franchise license or remove a hotel management company that it desires to replace following a foreclosure.
Furthermore, the ability of a hotel to attract customers, and some of such hotel’s revenues, may depend in large part on its having a liquor license. Such a license may have restrictions or prohibitions on transfers to third parties, including, for example, in connection with a foreclosure.
S-64
Moreover, the hotel and lodging industry is generally seasonal in nature; different seasons affect different hotels depending on type and location. This seasonality can be expected to cause periodic fluctuations in a hospitality property’s room and restaurant revenues, occupancy levels, room rates and operating expenses. With respect to 1 mortgage loan (loan number 5), representing 3.7% of the mortgage pool (4.1% of loan group 1), the related borrower has established a seasonality reserve with respect to which it is obligated to deposit a total of $5,000,000 during January to April of each year and to withdraw amounts from that reserve during July to November. There can be no assurance that the amounts held in reserve will be sufficient to offset any shortfall that occur at the mortgaged property during slower periods.
Special Risks Associated with Credit Tenant Leases
Income from and the market value of retail, office and industrial Mortgaged Properties would be adversely affected if space in the Mortgaged Properties could not be leased, if tenants were unable to meet their lease obligations, if a significant tenant were to become a debtor in a bankruptcy case under the United States Bankruptcy Code or if for any other reason rental payments could not be collected. If tenant sales in the Mortgaged Properties that contain retail space were to decline, rents based upon such sales would decline and tenants may be unable to pay their rent or other occupancy costs. Upon the occurrence of an event of default by a tenant, delays and costs in enforcing the lessor’s rights could be experienced. Repayment of the Mortgage Loans will be affected by the expirations of space leases and the ability of the respective borrowers to renew the leases or relet the space on comparable terms even if vacated Space is successfully relet, the co sts associated with reletting, including tenant improvements, leasing commissions and free rent, could be substantial and could reduce cash flow from the Mortgaged Properties.
In the case of retail properties, the failure of an anchor tenant to renew its lease, the termination of an anchor tenant’s lease, the bankruptcy or economic decline of an anchor tenant, or the cessation of the business of an anchor (notwithstanding its continued payment of rent) can have a particularly negative effect on the economic performance of a shopping center property given the importance of anchor tenants in attracting traffic to other stores. In addition, the failure of any anchor tenant to operate from its premises may given certain tenants the right to terminate or reduce rents under their leases.
With respect to each Mortgage Loan (a ‘‘Credit Lease Loan’’) that is backed by net lease obligations (a ‘‘Credit Lease’’), 3 mortgage loans (loan numbers 130, 133 and 134), representing 0.2% of the mortgage pool (0.2% of loan group 1), interest and principal payments are dependent principally on the payment by each tenant or guarantor, if any, under such Credit Lease, of monthly rent paid under the related Credit Lease by or on behalf the tenant (the ‘‘Monthly Rental Payment’’) and other payments due under the terms of its Credit Lease. A downgrade in t he credit rating of any of the tenants and/or the guarantors may have a related adverse effect on the rating of the Offered Certificates.
If a tenant or guarantor defaults on its obligations to make Monthly Rental payments under a Credit Lease or the related guarantee, as the case may be, the related Borrower under a Credit Lease Loan may not have the ability to make required payments on such Credit Lease Loan. If a payment default on the Mortgaged Property related to such Credit Lease Loan occurs, the Special Servicer may be entitled to foreclose upon or otherwise realize upon such Mortgaged Property to recover amounts due under the Credit Lease Loan, and may also be entitled to pursue any available remedies against the defaulting tenant and any guarantor, which may include rights to all future Monthly Rental Payments. If the default occurs before significant amortization of the Credit Lease Loan has occurred and no recovery is available from the related Borrower, the tenant or any guarantor, it is unlikely in most cases that the Special Servicer will be able to recover in full the amounts then d ue under the Credit Lease Loan.
Environmental Laws May Adversely Affect the Value of and Cash Flow from a Mortgaged Property
If an adverse environmental condition exists with respect to a mortgaged property securing a mortgage loan included in the trust fund, the trust fund may be subject to certain risks including the following:
| • | a reduction in the value of such mortgaged property which may make it impractical or imprudent to foreclose against such mortgaged property; |
S-65
| • | the potential that the related borrower may default on the related mortgage loan due to such borrower’s inability to pay high remediation costs or costs of defending lawsuits due to an environmental impairment or difficulty in bringing its operations into compliance with environmental laws; |
| • | liability for clean-up costs or other remedial actions, which could exceed the value of such mortgaged property or the unpaid balance of the related mortgage loan; and |
| • | the inability to sell the related mortgage loan in the secondary market or to lease such mortgaged property to potential tenants. |
Under certain federal, state and local laws, federal, state and local agencies may impose a statutory lien over affected property to secure the reimbursement of remedial costs incurred by these agencies to correct adverse environmental conditions. This lien may be superior to the lien of an existing mortgage. Any such lien arising with respect to a mortgaged property securing a mortgage loan included in the trust fund would adversely affect the value of such mortgaged property and could make impracticable the foreclosure by the special servicer on such mortgaged property in the event of a default by the related borrower.
Under various federal, state and local laws, ordinances and regulations, a current or previous owner or operator of real property, as well as certain other types of parties, may be liable for the costs of investigation, removal or remediation of hazardous or toxic substances on, under, adjacent to or in such property. The cost of any required investigation, delineation and/or remediation and the owner’s liability is generally not limited under applicable laws. Such liability could exceed the value of the property and/or the aggregate assets of the owner. Under some environmental laws, a secured lender (such as the trust fund) may be found to be an ‘‘owner’’ or ‘‘operator’’ of the related mortgaged property if it is determined that such secured lender actually participated in the hazardous waste management of the borrower, regardless of whether the borrower actually caused the environmental damage. In such cas es, a secured lender may be liable for the costs of any required investigation, removal or remediation of hazardous substances. The trust fund’s potential exposure to liability for environmental costs will increase if the trust fund, or an agent of the trust fund, actually takes possession of a mortgaged property or control of its day-to-day operations. See ‘‘DESCRIPTION OF THE MORTGAGE POOL—Assessments of Property Condition—Environmental Assessments’’ in this prospectus supplement, and ‘‘CERTAIN LEGAL ASPECTS OF MORTGAGE LOANS AND LEASES—Environmental Considerations’’ in the accompanying prospectus.
A third-party environmental consultant conducted an environmental site assessment (or updated a previously conducted environmental site assessment) with respect to each mortgaged property securing a mortgage loan included in the trust fund related to a particular series of certificates. Such assessments do not generally include invasive environmental testing. In each case where the environmental site assessment or update revealed a material adverse environmental condition or circumstance at any mortgaged property, then (depending on the nature of the condition or circumstance) one or more of the following actions has been or is expected to be taken:
| • | an environmental consultant investigated those conditions and recommended no further investigations or remediation; |
| • | an environmental insurance policy was obtained from a third-party insurer; |
| • | either (i) an operations and maintenance program, including, in several cases, with respect to asbestos containing materials, lead-based paint, microbial matter and/or radon, or periodic monitoring of nearby properties, has been or is expected to be implemented in the manner and within the time frames specified in the related loan documents, or (ii) remediation in accordance with applicable law or regulations has been performed, is currently being performed or is expected to be performed either by the borrower or by the party responsible for the contamination; |
| • | an escrow or reserve was established to cover the estimated cost of remediation, with each remediation required to be completed within a reasonable time frame in accordance with the related mortgage loan documents; or |
S-66
| • | the related borrower or other responsible party having financial resources reasonably estimated to be adequate address the related condition or circumstance is required to take (or is liable for the failure to take) actions, if any, with respect to those circumstances or conditions that have been required by the applicable governmental regulatory authority or any environmental law or regulation. |
We cannot provide assurance, however, that the environmental assessments identified all environmental conditions and risks, that the related borrowers will implement all recommended operations and maintenance plans, that such plans will adequately remediate the environmental condition, or that any environmental indemnity, insurance or escrow will fully cover all potential environmental conditions and risks. In addition, the environmental condition of the underlying real properties could be adversely affected by tenants or by the condition of land or operations in the vicinity of the properties, such as underground storage tanks.
Problems associated with mold, fungi or decay may pose risks to the mortgaged properties that are part of the trust fund and may also be the basis for personal injury claims against a borrower. Although the mortgaged properties are required to be inspected periodically, there is no generally accepted standard for the assessment of mold, fungi or decay problems. If left unchecked, the growth of such problems could result in the interruption of cash flow, litigation and remediation expenses that could adversely impact collections from a mortgaged property.
We cannot provide assurance, however, that should environmental insurance coverage be needed, such coverage would be available or uncontested, that the terms and conditions of such coverage would be met, that coverage would be sufficient for the claims at issue or that coverage would not be subject to certain deductibles.
The pooling and servicing agreement will require that the special servicer obtain an environmental site assessment of a mortgaged property securing a mortgage loan included in the trust fund prior to taking possession of the property through foreclosure or otherwise assuming control of its operation. Such requirement effectively precludes enforcement of the security for the related mortgage note until a satisfactory environmental site assessment is obtained (or until any required remedial action is thereafter taken), but will decrease the likelihood that the trust fund will become liable for a material adverse environmental condition at the mortgaged property. However, we cannot give assurance that the requirements of the pooling and servicing agreement will effectively insulate the trust fund from potential liability for a materially adverse environmental condition at any mortgaged property. See ‘‘DESCRIPTION OF THE POOLING AND SERVICING AGREEMENTS& mdash;Realization Upon Defaulted Mortgage Loans’’, ‘‘RISK FACTORS—Environmental Liability May Affect the Lien on a Mortgaged Property and Expose the Lender to Costs’’ and ‘‘CERTAIN LEGAL ASPECTS OF MORTGAGE LOANS AND LEASES—Environmental Considerations’’ in the accompanying prospectus.
Special Risks Associated with Balloon Loans and Anticipated Repayment Date Loans
All of the mortgage loans provide for scheduled payments of principal and/or interest based on amortization schedules significantly longer than their respective remaining terms to maturity or provide for payments of interest only until their respective maturity date and, in each case, a balloon payment on their respective maturity date. Five (5) of these mortgage loans, representing 0.6% of the mortgage pool (0.7% of loan group 1), are anticipated repayment date loans, which provide that if the principal balance of the loan is not repaid on a date specified in the related mortgage note, the loan will accrue interest at an increased rate.
| • | A borrower’s ability to make a balloon payment or repay its anticipated repayment date loan on the anticipated repayment date typically will depend upon its ability either to refinance fully the loan or to sell the related mortgaged property at a price sufficient to permit the borrower to make such payment. |
| • | Whether or not losses are ultimately sustained, any delay in the collection of a balloon payment on the maturity date or repayment on the anticipated repayment date that would otherwise be distributable on your certificates will likely extend the weighted average life of your certificates. |
S-67
| • | The ability of a borrower to effect a refinancing or sale will be affected by a number of factors, including (but not limited to) the value of the related mortgaged property, the level of available mortgage rates at the time of sale or refinancing, the borrower’s equity in the mortgaged property, the financial condition and operating history of the borrower and the mortgaged property, rent rolling status, rent control laws with respect to certain residential properties, tax laws, prevailing general and regional economic conditions and the availability of credit for loans secured by multifamily or commercial properties, as the case may be. |
We cannot assure you that each borrower under a balloon loan or an anticipated repayment date loan will have the ability to repay the principal balance of such mortgage loan on the related maturity date or anticipated repayment date, as applicable. Generally, even fully amortizing mortgage loans which pay interest on an ‘‘actual/360’’ basis but have fixed monthly payments may, in fact, have a small ‘‘balloon payment’’ due at maturity. For additional description of risks associated with balloon loans, see ‘‘RISK FACTORS—Balloon Payments on Mortgage Loans Result in Heightened Risk of Borrower Default’’ in the accompanying prospectus.
In order to maximize recoveries on defaulted mortgage loans, the pooling and servicing agreement permits the special servicer to extend and modify mortgage loans that are in material default or as to which a payment default (including the failure to make a balloon payment) is imminent; subject, however, to the limitations described under ‘‘SERVICING OF THE MORTGAGE LOANS—Modifications, Waivers and Amendments’’ in this prospectus supplement. We cannot provide assurance, however, that any such extension or modification will increase the present value of recoveries in a given case. Any delay in collection of a balloon payment that would otherwise be distributable on your certificates, whether such delay is due to borrower default or to modification of the related mortgage loan, will likely extend the weighted average life of your certificates. See ‘‘YIELD AND MATURITY CONSIDERATIONS’’ in this prospectus suppleme nt and ‘‘YIELD CONSIDERATIONS’’ in the accompanying prospectus.
Adverse Consequences Associated with Borrower Concentration, Borrowers under Common Control and Related Borrowers
Certain borrowers under the mortgage loans included in the trust fund are affiliated or under common control with one another. In such circumstances, any adverse circumstances relating to a borrower or an affiliate thereof and affecting one of the related mortgage loans or mortgaged properties could also affect other mortgage loans or mortgaged properties of the related borrower. In particular, the bankruptcy or insolvency of any such borrower or affiliate could have an adverse effect on the operation of all of the mortgaged properties of that borrower and its affiliates and on the ability of such related mortgaged properties to produce sufficient cash flow to make required payments on the mortgage loans. For example, if a person that owns or directly or indirectly controls several mortgaged properties experiences financial difficulty at one mortgaged property, they could defer maintenance at one or more other mortgaged properties in order to satisfy current exp enses with respect to the mortgaged property experiencing financial difficulty, or they could attempt to avert foreclosure by filing a bankruptcy petition that might have the effect of interrupting payments for an indefinite period on all the related mortgage loans. In particular, such person experiencing financial difficulty or becoming subject to a bankruptcy proceeding may have an adverse effect on the funds available to make distributions on the certificates and may lead to a downgrade, withdrawal or qualification (if applicable) of the ratings of the certificates.
Mortgaged properties owned by related borrowers are likely to:
| • | have common management, increasing the risk that financial or other difficulties experienced by the property manager could have a greater impact on the pool of mortgage loans included in the trust fund; and |
| • | have common general partners or managing members which would increase the risk that a financial failure or bankruptcy filing would have a greater impact on the pool of mortgage loans included in the trust fund. |
For example, 3 groups of mortgage loans consisting of (a) 2 cross-collateralized and cross-defaulted mortgage loans (loan numbers 52 and 75), representing in the aggregate 0.7% of the mortgage pool (6.1% of loan group 2), (b) 3 cross-collateralized and cross-defaulted mortgage loans ((loan numbers 135, 139
S-68
and 142), representing in the aggregate 0.1% of the mortgage pool (0.1% of loan group 1)) and (c) 2 cross-collateralized and cross-defaulted mortgage loans ((loan numbers 123 and 131), representing in the aggregate 0.2% of the mortgage pool (0.2% of loan group 1)), respectively, have sponsors that are affiliated. Although the mortgage loans within each group are cross-collateralized and cross-defaulted, the groups of mortgage loans are not cross-collateralized or cross-defaulted with each other.
In addition, 2 mortgage loans (loan numbers 3 and 6), representing 8.7% of the mortgage pool (9.8% of loan group 1), are not cross-collateralized or cross-defaulted but the sponsors of two or more of the related borrowers under two or more of such mortgage loans are affiliated.
No group, individual borrower, sponsor or borrower concentration represents more than 10.8% of the mortgage pool (12.2% of loan group 1).
Mortgaged Properties Leased to Borrowers & Borrower Affiliated Entities Also Have Risks
If a mortgaged property is leased in whole or substantial part to the borrower under the mortgage loan or to an affiliate of the borrower, a deterioration in the financial condition of the borrower or its affiliates can be particularly significant to the borrower’s ability to perform under the mortgage loan as it can directly interrupt the cash flow from the mortgaged property if the borrower’s or its affiliate’s financial condition worsens. Certain mortgaged properties or portions thereof are master leased to affiliates of the borrower under arrangements whereby the affiliate tenant operates and/or leases the mortgaged property or the master leased premises. For example, 1 mortgage loan (loan number 6), representing 2.9% of the mortgage pool (3.3% of loan group 1), the borrower leased 31,104 square feet of space at the mortgaged property. In some cases, this affiliated lessee is physically occupying space related to its business; in other case s, the affiliated lessee is a tenant under a master lease with the borrower, under which the tenant is obligated to make rent payments but does not occupy any space at the mortgaged property. These master leases are typically used to bring occupancy to a ‘‘stabilized’’ level but may not provide additional economic support for the mortgage loan. Such master lease arrangements present additional risks, such as the potential limitations on the ability of a lender upon default to obtain a receiver to obtain control of, and collect the underlying revenues from, the mortgaged property unless and until the master lease is terminated and the affiliate tenant evicted from the mortgaged property or master leased premises (which may not be possible if the master lease is not in default or may be limited by an affiliate tenant bankruptcy or by requirements of local laws pertaining to the dispossession of defaulted tenants under the leases) and the risk that a master lease termination may result i n a termination or interruption of rent payments under the underlying subleases between the subtenants and the affiliated master tenant. These risks may be mitigated when mortgaged properties are leased to unrelated third parties.
S-69
The Geographic Concentration of Mortgaged Properties Subjects the Trust Fund to a Greater Extent to State and Regional Conditions
Except as indicated in the following tables, less than 5.0% of the mortgage loans, by cut-off date pool or loan group balance, are secured by mortgaged properties in any one state, the Cayman Islands and the District of Columbia.
Mortgaged Properties by Geographic Concentration(1)
| State | Number of Mortgaged Properties | Aggregate Cut-Off Date Balance | Percentage of Cut-Off Date Pool Balance | |||||||||||||||
| NY | 10 | $ | 597,750,000 | 15.6 | % | |||||||||||||
| CA | 25 | 575,873,000 | 15.1 | |||||||||||||||
| Southern(2) | 20 | 525,626,000 | 13.7 | |||||||||||||||
| Northern(2) | 5 | 50,247,000 | 1.3 | |||||||||||||||
| FL | 44 | 356,557,496 | 9.3 | |||||||||||||||
| GA | 28 | 237,654,004 | 6.2 | |||||||||||||||
| VA | 13 | 199,442,775 | 5.2 | |||||||||||||||
| Other | 155 | 1,856,575,794 | 48.6 | |||||||||||||||
| 275 | $ | 3,823,853,069 | 100.0 | % | ||||||||||||||
| (1) | Because this table presents information relating to the mortgaged properties and not the mortgage loans, the information for mortgage loans secured by more than one mortgaged property is based on allocated loan amounts (allocating the mortgage loan principal balance to each of those properties by the appraised values of the mortgaged properties or the allocated loan amount (or specific release prices) as described in the related mortgage loan documents). |
| (2) | For purposes of determining whether a mortgaged property is located in Northern California or Southern California, mortgaged properties located north of San Luis Obispo County, Kern Count and San Bernardino County were included in Northern California and mortgaged properties located in and south of such counties were included in Southern California. |
Loan Group 1
Mortgaged Properties by Geographic Concentration(1)
| State | Number of Mortgaged Properties | Aggregate Cut-Off Date Balance | Percentage of Cut-Off Date Group 1 Balance | |||||||||||||||
| NY | 10 | $ | 597,750,000 | 17.7 | % | |||||||||||||
| CA | 23 | 545,023,000 | 16.1 | |||||||||||||||
| Southern(2) | 18 | 494,776,000 | 14.6 | |||||||||||||||
| Northern(2) | 5 | 50,247,000 | 1.5 | |||||||||||||||
| FL | 44 | 356,557,496 | 10.5 | |||||||||||||||
| GA | 27 | 211,654,004 | 6.3 | |||||||||||||||
| WA | 11 | 186,648,641 | 5.5 | |||||||||||||||
| VA | 11 | 177,914,481 | 5.3 | |||||||||||||||
| Other | 119 | 1,305,108,653 | 38.6 | |||||||||||||||
| 245 | $ | 3,380,656,275 | 100.0 | % | ||||||||||||||
| (1) | Because this table presents information relating to the mortgaged properties and not the mortgage loans, the information for mortgage loans secured by more than one mortgaged property is based on allocated loan amounts (allocating the mortgage loan principal balance to each of those properties by the appraised values of the mortgaged properties or the allocated loan amount (or specific release prices) as described in the related mortgage loan documents). |
| (2) | For purposes of determining whether a mortgaged property is located in Northern California or Southern California, mortgaged properties located north of San Luis Obispo County, Kern County and San Bernardino County were included in Northern California and mortgaged properties located in and south of such counties were included in Southern California. |
S-70
Loan Group 2
Mortgaged Properties by Geographic Concentration(1)
| State | Number of Mortgaged Properties | Aggregate Cut-Off Date Balance | Percentage of Cut-Off Date Group 2 Balance | |||||||||||||||
| NV | 2 | $ | 65,747,500 | 14.8 | % | |||||||||||||
| TX | 3 | 53,150,000 | 12.0 | |||||||||||||||
| AR | 2 | 40,000,000 | 9.0 | |||||||||||||||
| LA | 1 | 33,700,000 | 7.6 | |||||||||||||||
| CO | 1 | 31,000,000 | 7.0 | |||||||||||||||
| CA | 2 | 30,850,000 | 7.0 | |||||||||||||||
| Southern(2) | 2 | 30,850,000 | 7.0 | |||||||||||||||
| Other | 19 | 188,749,294 | 42.6 | |||||||||||||||
| 30 | $ | 443,196,794 | 100.0 | % | ||||||||||||||
| (1) | Because this table presents information relating to the mortgaged properties and not the mortgage loans, the information for mortgage loans secured by more than one mortgaged property is based on allocated loan amounts (allocating the mortgage loan principal balance to each of those properties by the appraised values of the mortgaged properties or the allocated loan amount (or specific release prices) as described in the related mortgage loan documents). |
| (2) | For purposes of determining whether a mortgaged property is located in Northern California or Southern California, mortgaged properties located north of San Luis Obispo County, Kern County and San Bernardino County were included in Northern California and mortgaged properties located in and south of such counties were included in Southern California. |
The concentration of mortgaged properties in a specific state or region will make the performance of the trust fund as a whole more sensitive to the following in the state or region where the mortgagors and mortgaged properties are located:
| • | economic conditions; |
| • | conditions in the real estate market; |
| • | changes in governmental rules and fiscal policies; |
| • | acts of God or terrorism (which may result in uninsured losses); and |
| • | other factors which are beyond the control of the mortgagors. |
For example, 10 of the mortgaged properties, representing 15.6% of the mortgage pool (17.7% of loan group 1) are located in the State of New York. As a result of this concentration, any adverse economic impact on the New York area may have a more pronounced effect on certificateholders as compared with a similar economic impact on other geographical areas.
In addition, 25 of the mortgaged properties, representing, by allocated loan amount, approximately 15.1% of the mortgage pool (23 mortgaged properties in loan group 1 or 16.1% and 2 mortgaged properties in loan group 2 or 7.0%), are located in the State of California. Twenty (20) of these mortgaged properties, representing, by allocated loan amount, approximately 13.7% of the mortgage pool (18 mortgaged properties in loan group 1 or 14.6% and 2 mortgaged properties in loan group 2 or 7.0%), are located in southern California. During the past several years, California’s economy has benefited from a continued rise in residential home prices, increased investment in technology and software equipment and a strong office leasing market. There can be no assurances, however, that such economic growth will continue. Additionally, rising energy prices, increasing consumer debt and decreasing prices of residential homes could slow the growth of t he southern California economy. Further, a weakening of the southern California office leasing market in particular, may adversely affect the related mortgaged properties’ operation and could lessen their market value. Conversely, a strong market could lead to increased building and increased competition for tenants. In either case, there could be an adverse effect on the operation of the mortgage loans and consequently the amount and timing of distributions on the certificates.
S-71
Special Risks Associated with High Balance Mortgage Loans
Several of the mortgage loans included in the trust fund, individually or together with other such mortgage loans with which they are cross-collateralized, have principal balances as of the cut-off date that are substantially higher than the average principal balance of the mortgage loans in the trust fund as of the cut-off date.
In general, concentrations in a mortgage pool of loans with larger-than-average balances can result in losses that are more severe, relative to the size of the pool, than would be the case if the aggregate balance of the pool were more evenly distributed.
| • | The largest single mortgage loan included in the trust fund as of the cut-off date represents 10.8% of the mortgage pool (12.2% of loan group 1). |
| • | The largest group of cross-collateralized mortgage loans included in the trust fund as of the cut-off date represents in the aggregate 0.7% of the mortgage pool (6.1% of loan group 2). |
Concentrations of Mortgaged Property Types Subject the Trust Fund to Increased Risk of Decline in Particular Industries
A concentration of mortgaged property types can increase the risk that a decline in a particular industry or business would have a disproportionately large impact on a pool of mortgage loans. For example, if there is a decline in tourism, the hotel industry might be adversely affected, leading to increased losses on loans secured by hospitality properties as compared to the mortgage loans secured by other property types.
In that regard, by allocated loan amount:
| • | mortgage loans included in the trust fund and secured by office properties represent, as of the cut-off date, 30.6% of the mortgage pool (34.6% of loan group 1); |
| • | mortgage loans included in the trust fund and secured by retail properties represent, as of the cut-off date, 26.8% of the mortgage pool (30.4% of loan group 1); |
| • | mortgage loans included in the trust fund and secured by hospitality properties represent, as of the cut-off date, 18.7% of the mortgage pool (21.2% of loan group 1); |
| • | mortgage loans included in the trust fund and secured by multifamily properties represent, as of the cut-off date, 11.6% of the mortgage pool (100.0% of loan group 2); and |
| • | mortgage loans included in the trust fund and secured by industrial and mixed-use facilities represent, as of the cut-off date, 11.3% of the mortgage pool (12.8% of loan group 1). |
Insurance Coverage on Mortgaged Properties May Not Cover Special Hazard Losses
In light of the September 11, 2001 terrorist attacks in New York City, the Washington, D.C. area and Pennsylvania, the comprehensive general liability and business interruption or rent loss insurance policies required by typical mortgage loans (which are generally subject to periodic renewals during the term of the related mortgage loans) have been affected. To give time for private markets to develop a pricing mechanism and to build capacity to absorb future losses that may occur due to terrorism, on November 26, 2002 the Terrorism Risk Insurance Act of 2002 was enacted, which established the Terrorism Insurance Program. Under the Terrorism Insurance Program, the federal government shares in the risk of loss associated with certain future terrorist acts. See ‘‘RISK FACTORS—Insurance Coverage on Mortgaged Properties May Not Cover Special Hazard Losses’’ in the accompanying prospectus.
The Terrorism Insurance Program was originally scheduled to expire on December 31, 2005. However, on December 22, 2005, the Terrorism Risk Insurance Extension Act of 2005 was enacted, which extended the duration of the Terrorism Insurance Program until December 31, 2007.
The Terrorism Insurance Program is administered by the Secretary of the Treasury and, through December 31, 2007, will provide some financial assistance from the United States government to insurers in the event of another terrorist attack that results in an insurance claim. The program applies to United
S-72
States risks only and to acts that are committed by an individual or individuals acting on behalf of a foreign person or foreign interest as an effort to influence or coerce United States civilians or the United States government.
In addition, with respect to any act of terrorism occurring after March 31, 2006, no compensation is paid under the Terrorism Insurance Program unless the aggregate industry losses relating to such act of terror exceed $50 million (or, if such insured losses occur in 2007, $100 million). As a result, unless the borrowers obtain separate coverage for events that do not meet that threshold (which coverage may not be required by the respective loan documents and may not otherwise be obtainable), such events would not be covered.
The Treasury Department has established procedures for the program under which the federal share of compensation equals 90 percent (or, in 2007, 85 percent) of that portion of insured losses that exceeds an applicable insurer deductible required to be paid during each program year. The federal share in the aggregate in any program year may not exceed $100 billion (and the insurers will not be liable for any amount that exceeds this cap).
Through December 2007, insurance carriers are required under the program to provide terrorism coverage in their basic ‘‘all-risk’’ policies. Any commercial property and casualty terrorism insurance exclusion that was in force on November 26, 2002 is automatically voided to the extent that it excludes losses that would otherwise be insured losses. Any state approval of such types of exclusions in force on November 26, 2002, is also voided.
The Terrorism Insurance Program is temporary legislation and there can be no assurance that it will create any long-term changes in the availability and cost of such insurance. Moreover, there can be no assurance that subsequent terrorism insurance legislation will be passed upon its expiration.
No assurance can be given that the mortgaged properties will continue to have the benefit of insurance against terrorist acts. In addition, no assurance can be given that the coverage for such acts, if obtained or maintained, will be broad enough to cover the particular act of terrorism that may be committed or that the amount of coverage will be sufficient to repair and restore the mortgaged property or to repay the mortgage loan in full. The insufficiency of insurance coverage in any respect could have a material and adverse affect on an investor’s certificates.
Pursuant to the terms of the pooling and servicing agreement, the master servicer or the special servicer may not be required to maintain insurance covering terrorist or similar acts, nor will it be required to call a default under a mortgage loan, if the related borrower fails to maintain such insurance (even if required to do so under the related mortgage loan documents) if the special servicer has determined, in consultation with the controlling class representative, in accordance with the servicing standard that either:
| • | such insurance is not available at commercially reasonable rates and that such hazards are not at the time commonly insured against for properties similar to the mortgaged property and located in or around the region in which such mortgaged property is located; or |
| • | such insurance is not available at any rate. |
In addition, with respect to certain mortgage loans, the mortgagee may have waived the right to require terrorism insurance or may have limited the circumstances under which terrorism insurance is required. For example, terrorism insurance is generally required only with respect to ‘‘certified acts of terrorism’’, as defined under the Terrorism Insurance Act of 2002. Further, such insurance may be required only to the extent it can be obtained for premiums less than or equal to a ‘‘cap’’ amount specified in the related mortgage loan documents, only if it can be purchased at commercially reasonable rates and/or only with a deductible at a certain threshold. There can be no assurances that the terrorism insurance maintained at these mortgaged properties, or the other mortgaged properties in the mortgage pool, will be sufficient to offset any potential losses in the event of damages due to a terrorist act.
For example, with respect to 1 mortgage loan (loan number 8), representing approximately 2.5% of the mortgage pool (2.8% of loan group 1), the related borrower is required to obtain an endorsement to its ‘‘all-risk’’ policy, or a separate policy insuring against all ‘‘certified acts of terrorism’’ as defined by TRIA and ‘‘fire following’’, each in an amount equal to 100% of the 17 Battery Park South mortgage loan
S-73
actual replacement value (exclusive of the premises, footings and foundations) with a waiver of depreciation. During any period that TRIA is not in effect, if ‘‘acts of terrorism’’ or other similar acts or events or ‘‘fire following’’ are excluded from the related borrower’s comprehensive all risk insurance policy or business interruption insurance coverage, the related borrower is required to obtain an endorsement to such policy, or a separate policy insuring against all such excluded acts or events, to the extent such policy or endorsement is available in an amount determined by lender but in no event greater than the total insurable value plus the required business interruption coverage amount.
In addition, in the case of 1 mortgage loan (loan number 10), representing 2.3% of the mortgage pool (2.6% of loan group 1), borrower’s terrorism insurance premium is capped at (i) for the first year of the mortgage loan, twice the terrorism insurance premium the borrower was paying as of the date of origination and (ii) thereafter, twice the terrorism insurance premium the borrower was paying as of the date of origination, as adjusted upward 2.54% for each year of the mortgage loan term.
As an additional example, in the case of 1 mortgage loan (loan number 11), representing 2.0% of the mortgage pool (2.2% of loan group 1), the maximum amount of terrorism coverage the borrower is required to maintain is that which can be purchased for a premium of $2,577 per year or maintain terrorism insurance under a blanket policy.
In addition, certain of the mortgaged properties may contain pad sites that are ground leased to the related tenant(s). The related borrower may not be required to obtain insurance on the related improvements.
Any losses incurred with respect to mortgage loans included in the trust fund due to uninsured risks or insufficient hazard insurance proceeds could adversely affect distributions on your certificates.
Special Risks Associated with Mortgaged Properties Located in the Cayman Islands
The right of the borrower under the Westin Casuarina Resort & Spa – Grand Cayman mortgage loan to operate the mortgaged property known as The Westin Casuarina Resort & Spa – Grand Cayman is subject to the related borrower having a current Local Companies (Control) Law License and a current Trade and Business License from the Cayman Islands Government. The related borrower currently holds a Trade & Business license which expires on June 20, 2007. The Local Companies Control Law license expired on November 21, 2006, however, the related borrower (through its registered office; International Corporation Services Ltd) applied for a new Local Companies Control License on June 9, 2006 to the Trade & Business Licensing Board; Immigration Department of the Cayman Islands. The borrower is still waiting approval for its new Local Companies Control license from the board, and the related borrower is required to renew the Trade & Business lic ense annually. If not renewed, both licenses will expire prior to the maturity date of the Westin Casuarina Resort & Spa – Grand Cayman mortgage loan.
In the event that the related borrower is unable to maintain the Local Companies Control Law license and/or the Trade & Business license with respect to the mortgaged property, it would be required to terminate operations and/or attempt to sell the mortgaged property to a local Cayman Islands company (which is a company at least 60% owned and controlled by Caymanians, which would not be required under Cayman Islands law to obtain a Local Companies Control Law license to operate the mortgaged property, although it would require a Trade & Business license) or a non-Caymanian controlled Cayman Islands company that has obtained an effective Local Companies Control Law license and a Trade & Business license.
The related borrower’s right to operate the mortgaged property is also subject to the borrower being in possession of the Tourism Law license.
The manager of the mortgaged property is currently licensed by the Hotels Licensing Board of the Cayman Islands under license number H-023 to operate the mortgaged property. The Tourism Law license will expire on October 31, 2007, and must be renewed annually. In addition to the Tourism Law license, the manager of the mortgaged property has obtained a liquor license which will expire September 30, 2007. This license must be renewed annually and is at the discretion of the Cayman Islands Liquor Licensing Board. Cayman Islands law prohibits the issuance of liquor licenses to anyone other than an
S-74
individual. The manager of the mortgaged property has obtained a music and dance license pursuant to the Music and Dancing (Control) Law which will expire on September 30, 2007, and must be renewed annually.
Under Cayman Islands law, the related borrower is required to keep and maintain all licenses necessary for the operation of the mortgaged property. No assurances can be provided that the borrower will be able to obtain a renewal of any of the above mentioned licenses. Furthermore, in the event of an exercise of a power of sale, the purchaser would be required to apply in its own right for the same licenses. There can be no assurances that any of the foregoing licenses could be obtained.
In order to keep the borrower in good standing with the registrar of companies in the Cayman Islands, it must file an annual return with the Registrar of Companies and must pay annual filing fees to the Registrar of Companies. The Registrar of Companies will strike the borrower from the register of companies after a period of 18 months if the borrower does not pay its annual fees (which are due in January of each year). Once the borrower has been struck from the register of companies, then any property vested or belonging to the borrower will vest in the Financial Secretary and shall be subject to disposition by the Governor in Cabinet or to retention for the benefit of the Cayman Islands pursuant to s.181 of the Companies Law (2004 Revision), subject, in either case, to the legal charge securing the related mortgage loan.
Pursuant to s.178 of the Companies Law (2004 Revision), a company or any member or creditor thereof may apply (within two years of being struck from the register of companies but no longer than ten years) to the courts of the Cayman Islands to have the company restored to the register upon payment of a re-instatement fee. The courts of the Cayman Islands have discretion as to whether or not to restore the company to the register of companies.
Issues relating to Cayman Islands Security.
The mortgaged property related to the Westin Casuarina Resort & Spa – Grand Cayman mortgage loan is currently encumbered by a first legal charge which stands as security for the principal sum of US$69,848,284.19 plus interest thereon and any other sums secured thereunder. This first legal charge is to be transferred to a co-trustee for the benefit of itself and the trustee with respect to the mortgaged property.
Section 78 of the Registered Land Law (2004 Revision) provides that a secured creditor shall not be entitled to foreclose, nor enter into possession of the charged land or the land comprised in a charged lease or to receive the rents and profits thereof by reason only that default has been made in the payment of the principal sum or of any interest or other periodical payment or of any part thereof or in the performance or observance of any agreement expressed or implied in the charge.
A lender’s remedies if a default is made in payment of the principal sum or in the performance or observance of any agreement express or implied in any charge document are contained in the Registered Land Law (2004 Revision).
The usual methods by which a secured lender enforces its security are:
(i) by taking possession of the property charged and obtaining an order for sale;
(ii) if the charge document has provision for one, the appointment of a receiver of the property; and
(iii) if the security is a debenture with both a fixed and floating charge over substantially the whole of the assets and undertaking of the company and assuming it has provisions for the appointment of one, to appoint an administrative receiver.
The ability of a secured creditor to take any of the above three steps depends on the express terms of his contract for loan with a debtor and specifically when he has the right to invoke any of these sanctions. The documents executed in connection with the Westin Casuarina Resort & Spa – Grand Cayman mortgage loan give the secured creditor the power to exercise these remedies.
The Registered Land Law (2004 Revision) sets out the statutory powers of a registered land law receiver. However, and subject to court approval, these powers can be varied and/or added to in the
S-75
charge document itself. A legal charge document must specifically reserve the right to appoint a receiver and this right must be acknowledged by the borrower. The legal charge securing the Westin Casuarina Resort & Spa – Grand Cayman mortgage loan specifically reserves to the secured creditor the right to appoint, among others, a receiver upon an event of default with the power, among others, to sell the mortgaged property or to operate it for the benefit of the secured creditor.
In respect of a legal charge over land, if a borrower defaults in payment of the principal sum or of any interest or any other periodical payment or of any part thereof, or in the performance or observation of any agreement express or implied in any charge, and continues for one month, the lender may serve on the borrower written notice to pay the money owing or to perform and observe the agreement, as the case may be.
If the borrower does not comply within three months of the date of service, with the notice served on him, the lender may appoint a receiver or sell the charged property provided that a lender who has appointed a receiver may not exercise the power of sale unless the borrower fails to comply within three months of the date of service, with a further notice served on him. The pooling and servicing agreement will require the master servicer to make written demand upon the maturity date of the Westin Casuarina Resort & Spa – Grand Cayman mortgage loan and upon the occurrence of an event of default.
A secured lender’s right to sell a property would normally be exercised at public auction. This requirement may be varied by agreement, but such variation is valid only with court approval. In considering whether or not to give its approval, the court has regard to the proceedings in conduct of the parties and the circumstances of the case. Furthermore, in any sale, the lender is required to act in good faith and have regard to the interest of the borrower and is under a duty to use reasonable endeavors to obtain the best price reasonably available under all the circumstances at the date of sale. Accordingly, an extensive marketing effort may be required in order for the court to be satisfied that the best price reasonably available was obtained.
If a secured lender has a fixed and floating charge over substantially the whole of the assets and undertakings of the company and assuming its debenture provides for the appointment of an administrative receiver on an event of default the debenture holder can so appoint one. The powers of an administrative receiver will be governed by the terms of the debenture.
A debenture creating a fixed and floating charge over the business and assets of the borrower has been registered in the Register of Mortgages and Charges of the borrower.
The Companies Law (2004 Revision) provides various mechanisms for the liquidation and winding up of Cayman Islands companies, whether or not insolvent. Certain preferential creditors will always take priority upon the liquidation over all other creditors. These include the liquidator in respect of liquidation expenses, government rates, taxes and assessments and staffing of employees of a company.
Additional Debt on Some Mortgage Loans Creates Additional Risks
In general, the borrowers are:
| • | required to satisfy any existing indebtedness encumbering the related mortgaged property as of the closing of the related mortgage loan; and |
| • | prohibited from encumbering the related mortgaged property with additional secured debt without the mortgagee’s prior approval. |
Except as described herein, none of the mortgage loans included in the trust fund, other than the mortgage loans with companion loans, are secured by mortgaged properties that secure other loans outside the trust fund, and, except as provided below, none of the related entities with a controlling ownership interest in the borrower may pledge or has pledged its interest in that borrower as security for mezzanine debt. For a discussion regarding the existence of, or the ability of a borrower to incur, additional indebtedness (including subordinate debt secured by the related mortgaged property, subordinate unsecured debt and mezzanine debt), see ‘‘DESCRIPTION OF THE MORTGAGE POOL—Certain Terms of the Mortgage Loans—Other financing’’.
Secured subordinated debt encumbering any mortgaged property may increase the difficulty of refinancing the related mortgage loan at maturity and the possibility that reduced cash flow could result
S-76
in deferred maintenance. Also, in the event that the holder of the subordinated debt has filed for bankruptcy or been placed in involuntary receivership, foreclosure by any senior lienholder (including the trust fund) on the mortgaged property could be delayed. In addition, substantially all of the mortgage loans permit the related borrower to incur limited indebtedness in the ordinary course of business or for capital improvements that is not secured by the related mortgaged property which is generally limited to a specified percentage of the outstanding principal balance of the related mortgage loan. Further, certain of the mortgage loans included in the trust fund do not prohibit limited partners or other owners of non-controlling interests in the related borrower from pledging their interests in the borrower as security for mezzanine debt.
In addition, certain mortgage loans, which may include the mortgage loans previously described in this risk factor, permit the related borrower to incur, or do not prohibit the related borrower from incurring, unsecured debt to an affiliate of, or owner of an interest in, the borrower or to an affiliate of such an owner, subject to certain conditions under the related mortgage loan documents. Further, certain of the mortgage loans permit additional liens on the related mortgaged properties for (1) assessments, taxes or other similar charges or (2) liens which in the aggregate constitute an immaterial and insignificant monetary amount with respect to the net value of the related borrower’s assets. A default by the borrower on such additional indebtedness could impair the borrower’s financial condition and result in the bankruptcy or receivership of the borrower which would cause a delay in the foreclosure by the trust fund on the mortgaged p roperty. It may not be evident that a borrower has incurred any such future subordinate second lien debt until the related mortgage loan otherwise defaults. In cases in which one or more subordinate liens are imposed on a mortgaged property or the borrower incurs other indebtedness, the trust fund is subject to additional risks, including, without limitation, the following:
| • | the risk that the necessary maintenance of the mortgaged property could be deferred to allow the borrower to pay the required debt service on the subordinate financing and that the value of the mortgaged property may fall as a result; |
| • | the risk that the borrower may have a greater incentive to repay the subordinate or unsecured indebtedness first; |
| • | the risk that it may be more difficult for the borrower to refinance the mortgage loan or to sell the mortgaged property for purposes of making any balloon payment upon the maturity of the mortgage loan; |
| • | the existence of subordinated debt encumbering any mortgaged property may increase the difficulty of refinancing the related mortgage loan at maturity and the possibility that reduced cash flow could result in deferred maintenance; and |
| • | the risk that, in the event that the holder of the subordinated debt has filed for bankruptcy or been placed in involuntary receivership, foreclosing on the mortgaged property could be delayed and the trust fund may be subjected to the costs and administrative burdens of involvement in foreclosure or bankruptcy proceedings or related litigation. |
See ‘‘CERTAIN LEGAL ASPECTS OF MORTGAGE LOANS AND LEASES—Subordinate Financing’’ and ‘‘—Due-on-Sale and Due-on-Encumbrance’’ in the accompanying prospectus and ‘‘DESCRIPTION OF THE MORTGAGE POOL—Certain Terms and Conditions of the Mortgage Loans—Other Financing’’ and ‘‘—Due-on-Sale and Due-on-Encumbrance Provisions’’ in this prospectus supplement.
Mezzanine debt is debt that is incurred by the owner of equity in one or more borrowers and is secured by a pledge of the equity ownership interests in such borrowers. Because mezzanine debt is secured by the obligor’s equity interest in the related borrowers, such financing effectively reduces the obligor’s economic stake in the related mortgaged property. The existence of mezzanine debt may reduce cash flow on the borrower’s mortgaged property after the payment of debt service and may increase the likelihood that the owner of a borrower will permit the value or income producing potential of a mortgaged property to fall and may create a greater risk that a borrower will default on the mortgage loan secured by a mortgaged property whose value or income is relatively weak.
Generally, upon a default under mezzanine debt, the holder of such mezzanine debt would be entitled to foreclose upon the equity in the related mortgagor, which has been pledged to secure payment of such
S-77
mezzanine debt. Although such transfer of equity may not trigger the due-on-sale clause under the related mortgage loan, it could cause the obligor under such mezzanine debt to file for bankruptcy, which could negatively affect the operation of the related mortgaged property and such borrower’s ability to make payments on the related mortgage loan in a timely manner.
Additionally, some intercreditor agreements with respect to certain mezzanine debt may give the holder of the mezzanine debt the right to cure certain defaults and, upon a default, to purchase the related mortgage loan for an amount equal to the then current outstanding balance of such mortgage loan. Some intercreditor agreements relating to mezzanine debt may also limit the special servicer’s ability to enter into certain modifications of the mortgage loan without the consent of the related mezzanine lender.
See ‘‘CERTAIN LEGAL ASPECTS OF MORTGAGE LOANS AND LEASES—Due-on-Sale and Due-on-Encumbrance’’ in the accompanying prospectus and ‘‘DESCRIPTION OF THE MORTGAGE POOL—Certain Terms and Conditions of the Mortgage Loans—Other Financing’’ and ‘‘—Due-on-Sale and Due-on-Encumbrance Provisions’’ in this prospectus supplement.
Seven (7) of the mortgage loans (loan numbers 4, 8, 10, 15, 18, 26 and 100), representing 13.9% of the mortgage pool (15.7% of loan group 1), have companion loans that are subordinate to the related mortgage loan. See ‘‘DESCRIPTION OF THE MORTGAGE POOL—Co-Lender Loans’’ in this prospectus supplement and ‘‘Two Herald Square’’, ‘‘17 Battery Place South’’, ‘‘Centerside II’’, ‘‘La Jolla Center I’’, ‘‘La Jolla Center II’’, ‘‘Courtyard by Marriott-Philadelphia, PA’’, and ‘‘Bunge North America’’ in Annex D to this prospectus supplement.
Three (3) of the mortgage loans (loan numbers 1, 2, and 3), representing 24.0% of the mortgage pool (27.2% of loan group 1), have 1 or more companion loans that are pari passu in right of entitlement with the related mortgage loan. See ‘‘DESCRIPTION OF THE MORTGAGE POOL—Co-Lender Loans’’ in this prospectus supplement and the description of the Beacon D.C. & Seattle Pool mortgage loan, the ING Hospitality Pool mortgage loan and the DDR Southeast Pool mortgage loan in Annex D to this prospectus supplement.
Although the assets of the trust fund do not include the companion loans related to the mortgage loans which have companion loans, the related borrower is still obligated to make interest and principal payments on those additional obligations. As a result, the trust fund is subject to additional risks, including:
| • | the risk that the necessary maintenance of the related mortgaged property could be deferred to allow the borrower to pay the required debt service on the subordinate or pari passu obligations and that the value of the mortgaged property may fall as a result; and |
| • | the risk that it may be more difficult for the borrower to refinance the mortgage loan or to sell the mortgaged property for purposes of making any balloon payment on the entire balance of both the loans contained in the loan pair upon the maturity of the mortgage loans. |
The holders of the pari passu companion loans have certain control, consultation and/or consent rights with respect to the servicing and/or administration of the subject split loan structures. See ‘‘DESCRIPTION OF THE MORTGAGE POOL—Co-Lender Loans’’ in this prospectus supplement.
Bankruptcy and Other Proceedings Relating to Sponsors Entail Certain Risks
Certain of the mortgage loans have a sponsor or sponsors that have, or that have affiliates that have, previously filed bankruptcy, been involved in foreclosures, deeds-in-lieu of foreclosures or workouts pertaining to other loans secured by properties of such sponsor(s) or sponsor affiliates, or have been involved in evictions or other proceedings. We cannot assure you that such sponsors will not utilize their rights in bankruptcy in the event of any threatened action by the mortgagee to enforce its rights under the related mortgage loan documents or otherwise assert defenses or dispute or prolong any foreclosure actions or other exercise of rights by the mortgagee. For example, with respect to 2 mortgage loans (loan numbers 26 and 122), representing 1.0% of the mortgage pool (1.1% of loan group 1), the sponsor of the borrower has been affiliated with several actions in bankruptcy.
See ‘‘RISK FACTORS—Bankruptcy Proceedings Entail Certain Risks’’ in the accompanying prospectus.
S-78
The Borrower’s Form of Entity May Cause Special Risks
Most of the borrowers are legal entities rather than individuals. Mortgage loans made to legal entities may entail risks of loss greater than those of mortgage loans made to individuals. For example, a legal entity, as opposed to an individual, may be more inclined to seek legal protection from its creditors under the bankruptcy laws. Unlike individuals involved in bankruptcies, most of the entities generally do not have personal assets and creditworthiness at stake. The bankruptcy of a borrower, or a general partner or managing member of a borrower, may impair the ability of the mortgagee to enforce its rights and remedies under the related mortgage.
Certain of the borrowers are not special purpose entities structured to limit the possibility of becoming insolvent or bankrupt, and therefore may be more likely to become insolvent or the subject of a voluntary or involuntary bankruptcy proceeding because such borrowers may be:
| • | operating entities with businesses distinct from the operation of the related mortgaged property with the associated liabilities and risks of operating an ongoing business; or |
| • | individuals or entities that have personal liabilities unrelated to the related mortgaged property. |
However, any borrower, even a special purpose entity structured to be bankruptcy remote, as an owner of real estate will be subject to certain potential liabilities and risks. We cannot provide assurances that any borrower will not file for bankruptcy protection or that creditors of a borrower of a corporate or individual general partner or managing member of a borrower will not initiate a bankruptcy or similar proceeding against such borrower or corporate or individual general partner or managing member.
Furthermore, with respect to any related borrowers, creditors of a common parent in bankruptcy may seek to consolidate the assets of such borrowers with those of the parent. Consolidation of the assets of such borrowers would likely have an adverse effect on the funds available to make distributions on your certificates, and may lead to a downgrade, withdrawal or qualification of the ratings of your certificates. See ‘‘CERTAIN LEGAL ASPECTS OF MORTGAGE LOANS AND LEASES—Bankruptcy Laws’’ in the accompanying prospectus.
With respect to 15 mortgage loans (loan numbers 21, 27, 30, 35, 40, 48, 66, 69, 72, 77, 98, 102, 118, 121 and 141), representing 6.4% of the mortgage pool (9 mortgage loans in loan group 1 or 3.1% and 6 mortgage loans in loan group 2 or 31.5%), the borrowers own the related mortgaged property as tenants-in-common. See ‘‘DESCRIPTION OF THE MORTGAGE POOL—Twenty Largest Mortgage Loans’’ and Annex D in this prospectus supplement. As a result, the related mortgage loans may be subject to prepayment, including during periods when prepayment might otherwise be prohibited, as a result of partition. Although some of the related borrowers have purported to waive any right of partition, we cannot assure you that any such waiver would be enforced by a court of competent jurisdiction. In addition, enforcement of remedies against tenant-in-common borrowers may be prolonged if the tenant-in-common borrowers become insolvent or bankrupt at different times because each time a tenant-in-common borrower files for bankruptcy, the bankruptcy court stay is reinstated.
Condominium Agreements Entail Certain Risks
Three (3) mortgaged properties securing 3 mortgage loans (loan numbers 8, 86 and 112), representing, by allocated loan amount, 2.8% of the mortgage pool (2 mortgage loans in loan group 1 or 3.1% and 1 mortgage loan in loan group 2 or 1.1%), are subject to the terms of one or more condominium agreements. In certain of these cases, the related mortgaged property does not represent the entire condominium regime, and as a result the risks associated with this form of property ownership may be greater because the related borrower does not control 100% of the condominium hoard. In addition, certain of the mortgage loans, subject to the terms and conditions in the related mortgage loan documents, allow or do not prohibit the related mortgaged property to become subject to a condominium regime in the future. Due to the nature of condominiums, a default on the part o f the related borrower will not allow the mortgagee the same flexibility in realizing on the collateral as is generally available with respect to commercial properties that are not condominiums. The rights of other unit owners, the condominium documents and the state and local laws applicable to condominium units must be considered and respected. Consequently, servicing and realizing upon the collateral could subject the certificateholders to greater delay, expense and risk than a loan secured by a commercial property that is not a condominium.
S-79
Inspections and Appraisals May Not Accurately Reflect Value or Condition of Mortgaged Property
In general, appraisals represent only the analysis and opinion of qualified experts and are not guaranties of present or future value, and may determine a value of a property that is significantly higher than the amount that can be obtained from the sale of a mortgaged property under a distress or liquidation sale. In certain cases, appraisals may reflect ‘‘as-stabilized’’ values reflecting certain assumptions, such as future construction completion, projected re-tenanting or increased tenant occupancies. For example, with respect to 63 mortgaged properties securing in whole or in part 18 mortgage loans (loan numbers 2, 9, 10, 15, 18, 25, 31, 32, 36, 46, 49, 53, 55, 59, 63, 82, 104 and 113), representing by allocated loan amount 21.0% of the mortgage pool (58 mortgaged properties in loan group 1 or 20.7% and 5 mortgaged properties in loan group 2 or 22.8%), the appraised value represented is the ‘‘as-stabilized&rsquo ;’ value. See ‘‘DESCRIPTION OF THE MORTGAGE POOL—Twenty Largest Mortgage Loans’’ in this prospectus supplement. In addition, with respect to certain of the appraisals reflecting ‘‘as-stabilized’’ values, the corresponding ‘‘as-is’’ value is less than the principal balance of the related mortgage loan. Information regarding the values of the mortgaged properties at the date of such report is presented under ‘‘DESCRIPTION OF THE MORTGAGE POOL—Additional Mortgage Loan Information’’ in this prospectus supplement for illustrative purposes only. Any engineering reports or site inspections obtained in connection with this offering represent only the analysis of the individual engineers or site inspectors preparing such reports at the time of such report, and may not reveal all necessary or desirable repairs, maintenance or capital improvement items.
Risks Relating to Net Cash Flow
As described under ‘‘DESCRIPTION OF THE MORTGAGE POOL—Additional Mortgage Loan Information’’, ‘‘net cash flow’’ means cash flow as adjusted based on a number of assumptions used by the mortgage loan sellers. No representation is made that the net cash flow set forth herein as of the cut-off date or any other date represents future net cash flows. In certain cases, co-tenancy provisions were assumed to be satisfied and vacant space was assumed to be occupied and space that was due to expire was assumed to have been re-let at market rates that may have exceeded current rent. Each originator of commercial mortgage loans has its own underwriting criteria and no assurance can be given that adjustments or calculations made by one originator would be made by other lenders.
In addition, net cash flow reflects calculations and assumptions used by the mortgage loan sellers and should not be used as a substitute for, and may vary (perhaps substantially) from, cash flow as determined in accordance with GAAP as a measure of the results of a mortgaged property’s operation or for cash flow from operating activities determined in accordance with GAAP as a measure of liquidity. For example, with respect to the 6 mortgage loans (loan numbers 3, 6, 46, 50, 123 and 131), representing 9.7% of the mortgage pool (11.0% of loan group 1), net cash flow includes amounts received under a master lease entered into with the related borrowers, sponsors or other affiliates of the related borrowers, as lessees, pursuant to which the lessees are required to make monthly rental payments which in some cases may cease at such time as the net cash flow at the related mortgaged property reaches a certain level, as more particularly described in the r elated mortgage loan documents.
The underwritten net operating income for each mortgaged property is calculated on the basis of numerous assumptions and subjective judgments which, if ultimately proven erroneous, could cause the actual net operating income from the mortgaged property to differ materially from the underwritten net operating income set forth herein. Some assumptions and subjective judgments related to future events, conditions and circumstances, including future income and expense levels and the re-leasing of occupied space, will be affected by a variety of complex factors over which none of the trust fund, the depositor, the loan sellers, the master servicer, the special servicer or the trustee have control. In some cases, the underwritten net operating income for any mortgaged property is higher, and may be materially higher, than the actual net operating income for that mortgaged property based on historical operating statements. There can be no guarantee as to the accuracy o f the information provided by the underlying borrowers or the adequacy of the procedures used by a loan seller in determining and presenting operating information.
S-80
The Mortgaged Properties May Not Be in Compliance with Current Zoning Laws
The mortgaged properties securing the mortgage loans included in the trust fund are typically subject to building and zoning ordinances and codes affecting the construction and use of real property. Since the zoning laws applicable to a mortgaged property (including, without limitation, density, use, parking and set-back requirements) are usually subject to change by the applicable regulatory authority at any time, the improvements upon the mortgaged properties may not, currently or in the future, comply fully with all applicable current and future zoning laws. Such changes may limit the ability of the related borrower to rehabilitate, renovate and update the premises, and to rebuild or utilize the premises ‘‘as is’’ in the event of a casualty loss with respect thereto. Such limitations may adversely affect the cash flow of the mortgaged property following such loss. Insurance proceeds may not be sufficient to pay off such mortgage loan i n full. In addition, if the mortgaged property were to be repaired or restored in conformity with then current law, its value could be less than the remaining balance on the mortgage loan and it may produce less revenue than before such repair or restoration. In many instances, if a mortgaged property was not in material compliance with current zoning requirements, the borrower was required to obtain law and ordinance insurance coverage and/or have such violation insured over by the lender’s title insurance policy to offset these risks. In the event the applicable regulatory authorities wish to take action against the related borrowers for these violations, the actions required to be taken by the borrower may have a material adverse effect on its ability to meet its obligations under the related mortgage loan documents.
Certain Mortgaged Properties May be Redeveloped or Renovated
Certain of the mortgaged properties are currently undergoing or are expected to undergo redevelopment or renovation.
In the event the related borrower fails to pay the costs of work completed or material delivered in connection with such on-going redevelopment or renovation, the portion of the mortgaged property on which there are renovations may be subject to mechanics’ or materialmen’s liens that may be senior to the lien on the related mortgage loans.
The existence of construction or renovation at a mortgaged property may make such mortgaged property less attractive to tenants or their customers or, in the case of hospitality properties may require that a portion of the mortgaged property not be used during that renovation and, accordingly, could have a negative effect on net operating income.
Restrictions on Certain of the Mortgaged Properties May Limit Their Use
Certain of the mortgaged properties securing mortgage loans included in the trust fund which are non-conforming may not be ‘‘legal non-conforming’’ uses. Further, even if a non-conforming mortgaged property is considered to be ‘‘legal non-conforming’’, certain jurisdictions have laws which state that in the event of a casualty where the damage to such mortgaged property exceeds certain specified thresholds, the improvements may only be rebuilt in conformity with the current zoning laws at the time of such casualty. The failure of a mortgaged property to comply with zoning laws or to be a ‘‘legal non-conforming’’ use or the existence of any threshold laws impacting the ability to rebuild the improvements may adversely affect the market value of the mortgaged property or the borrower’s ability to continue to use it in the manner it is currently being used or to rebuild the mortgaged prop erty following a casualty event.
In addition, certain of the mortgaged properties are subject to certain use restrictions imposed pursuant to restrictive covenants, covenants and agreements requiring the related mortgaged property or portions thereof to be made available for low income housing or other affordable housing (under affordable housing tax credit programs or otherwise), governmental requirements, reciprocal easement agreements or operating agreements or, in the case of those mortgaged properties that are condominiums, condominium declarations or other condominium use restrictions or regulations, which, especially in a situation where the related mortgaged property does not represent the entire condominium building (for example, 2 mortgage loans (loan numbers 86 and 112), representing 0.4% of the mortgage pool (1 mortgage loan in loan group 1 or 0.3% and 1 mortgage loan in loan group 2 or 1.1%), may adversely affect
S-81
the ability of the related borrower to lease the related mortgaged property on favorable terms, thus adversely affecting the related borrower’s ability to fulfill its obligations under the related mortgage loan documents. Such use restrictions include, for example, limitations on the character of the improvements or the properties, limitations affecting noise and parking requirements, among other things, and limitations on the borrowers’ right to operate certain types of facilities within a prescribed radius. These limitations could adversely affect the ability of the related borrower to lease the related mortgaged property on favorable terms, thus adversely affecting the borrower’s ability to fulfill its obligations under the related mortgage loan. See ‘‘RISK FACTORS—The Mortgage Loans—Condominium Agreements Entail Certain Risks’’ in this prospectus supplement.
If the special servicer forecloses on behalf of the trust fund or a mortgaged property that is being redeveloped or renovated, the special servicer will only be permitted to arrange for completion of the redevelopment or renovation if at least 10% of the costs of construction were incurred at the time default on the related mortgage loan became imminent.
Compliance With Applicable Laws and Regulations May Result in Losses
A borrower may be required to incur costs to comply with various existing and future federal, state or local laws and regulations applicable to the related mortgaged property securing a mortgage loan included in the trust fund. Examples of these laws and regulations include, among others, rent control and rent stabilization laws, zoning laws and the Americans with Disabilities Act of 1990, which requires all public accommodations to meet certain federal requirements related to access and use by disabled persons. See ‘‘CERTAIN LEGAL ASPECTS OF MORTGAGE LOANS AND LEASES—Americans with Disabilities Act’’ in the accompanying prospectus. The expenditure of such costs or the imposition of injunctive relief, penalties or fines in connection with the borrower’s noncompliance could negatively impact the borrower’s cash flow and, consequently, its ability to pay its mortgage loan.
Limitations on the Benefits of Cross-Collateralized and Cross-Defaulted Properties
Three (3) groups of mortgage loans, representing 1.0% of the mortgage pool (5 mortgage loans in loan group 1 or 0.3% and 2 mortgage loans in loan group 2 or 6.1%) are groups of mortgage loans that are cross-collateralized and/or cross-defaulted with each of the other mortgage loans in their respective groups, as indicated in Annex A-5 to this prospectus supplement.
Certain of the mortgage loans referred to in the prior paragraph may entitle the related borrower(s) to obtain a release of one or more of the corresponding mortgaged properties and/or a termination of any applicable cross-collateralization and cross-default provisions, subject, in each case, to the fulfillment of one or more of the following conditions:
| • | the satisfaction of certain criteria set forth in the related mortgage loan documents; |
| • | the satisfaction of certain leasing goals or other performance tests; |
| • | the satisfaction of debt service coverage and/or loan-to-value tests for the property or properties that will remain as collateral; and/or |
| • | receipt by the mortgagee of confirmation from each applicable rating agency that the action will not result in a qualification, downgrade or withdrawal of any of the then-current ratings of the offered certificates. |
In addition, some mortgage loans are secured by first lien deeds of trust or mortgages, as applicable, on multiple mortgaged properties securing obligations of one borrower or the joint and several obligations of multiple borrowers. For example, the Beacon D.C. & Seattle Pool mortgage loan (loan number 1), representing 10.8% of the mortgage pool (12.2% of loan group 1), is secured directly or indirectly by 20 properties located in 2 states and the District of Columbia. See ‘‘Beacon D.C. & Seattle Pool’’ in Annex D to this prospectus supplement. In addition, the DDR Southeast Pool mortgage loan (loan number 3), representing 5.8% of the mortgage pool (6.5% of loan group 1), is secured by 52 mortgaged properties located in 10 states. See ‘‘DDR Southeast Pool’’ in Annex D to this prospectus supplement. However, some of these mortgage loans permit the release of individual mortgaged
S-82
properties from the related mortgage lien through partial defeasance or otherwise. Furthermore, such arrangements could be challenged as fraudulent conveyances by creditors of any of the related borrowers or by the representative of the bankruptcy estate of any related borrower if one or more of such borrowers becomes a debtor in a bankruptcy case. Generally, under federal and most state fraudulent conveyance statutes, a lien granted by any such borrower could be voided if a court determines that:
| • | such borrower was insolvent at the time of granting the lien, was rendered insolvent by the granting of the lien, was left with inadequate capital or was not able to pay its debts as they matured; and |
| • | such borrower did not, when it allowed its mortgaged property to be encumbered by the liens securing the indebtedness represented by the other cross-collateralized loans, receive ‘‘fair consideration’’ or ‘‘reasonably equivalent value’’ for pledging such mortgaged property for the equal benefit of the other related borrowers. |
We cannot provide assurances that a lien granted by a borrower on a cross-collateralized loan to secure the mortgage loan of another borrower, or any payment thereon, would not be avoided as a fraudulent conveyance. See ‘‘DESCRIPTION OF THE MORTGAGE POOL—Certain Terms and Conditions of the Mortgage Loans—Cross-Default and Cross-Collateralization of Certain Mortgage Loans; Certain Multi-Property Mortgage Loans’’ in this prospectus supplement and Annex A-5 to this prospectus supplement for more information regarding the cross-collateralized loans. No mortgage loan included in the trust fund (other than the mortgage loans with companion loans) is cross-collateralized with a mortgage loan not included in the trust fund.
Substitution of Mortgaged Properties May Lead to Increased Risks
Five (5) mortgage loans (loan numbers 3, 6, 130, 133 and 134) representing 8.8% of the mortgage pool (10.0% of loan group 1), permit the related borrowers the right to substitute mortgaged properties of like kind and quality for the properties currently securing the related mortgage loans. As a result, it is possible that one or more (and possibly all) mortgaged properties that secure the mortgage loans may not secure such mortgage loans for their entire term. Any substitution will require mortgagee consent and will have to meet certain conditions, including loan-to-value tests and debt service coverage tests, and, in certain cases, the related borrower will also be required to obtain written confirmation from the rating agencies that any ratings of the certificates will not, as a result of the proposed substitution, be downgraded, qualified or withdrawn and the related borrower will provide an opinion of counsel that the REMIC status of the trust fund will not be adversely impacted by the proposed substitution. Nevertheless, the replacement property may differ from the substituted property with respect to certain characteristics.
Single Tenants and Concentration of Tenants Subject the Trust Fund to Increased Risk
Thirty (30) of the mortgaged properties securing mortgage loans included in the trust fund, representing 3.6% of the mortgage pool by allocated loan amount (4.1% of loan group 1), are leased wholly to a single tenant or are wholly owner occupied. For example, one of these mortgaged properties securing 1 mortgage loan (loan number 100), representing 0.2% of the mortgage pool (0.2% of loan group 1) is leased to one tenant, Bunge Oils, Inc. See Annex D to this prospectus supplement. Certain other of the mortgaged properties are leased in large part to a single tenant or are in large part owner occupied. Any default by a major tenant could adversely affect the related borrower’s ability to make payments on the related mortgage loan. We cannot provide assurances that any major tenant will continue to perform its obligations under its lease (or, in the case of an owner-occupied mortgaged property, under the related mortgage loan documents).
In addition, certain of the mortgaged properties that are leased to a single tenant or a major tenant may have leases that terminate or grant the tenant early termination rights prior to the maturity date of the related mortgage loan. For example, with respect to the 1 mortgage loan (loan number 10), representing approximately 2.3% of the mortgage pool (2.6% of loan group 1), leases with tenants representing approximately 88.7% of the net rentable area of the commercial space at the related mortgaged property expires within the first 5 years of the loan term. As a further example, with respect
S-83
to 1 mortgage loan (loan number 4), representing 5.2% of the mortgage pool (5.9% of loan group 1), the largest 2 tenants, representing 53.8% of the net rentable area, have leases that expire the year prior to the mortgage loan’s maturity date. If the borrower is not able to relet the space or is unable to relet the space at favorable rents, this may adversely impact the ability of the borrower to successfully refinance the related mortgaged property. In addition, mortgaged properties leased to a single tenant, or a small number of tenants, are more likely to experience interruptions of cash flow if a tenant fails to renew its lease because there may be less or no rental income until new tenants are found, and it may be necessary to expend substantial amounts of capital to make the space acceptable to new tenants.
In addition, certain of the mortgaged properties may be leased in whole or in part by government-sponsored tenants who may have certain rights to cancel their leases or reduce the rent payable with respect to such leases at any time for, among other things, lack of appropriations. See ‘‘—Future Cash Flow and Property Values are Not Predictable’’ in this prospectus supplement.
In addition, retail and office properties also may be adversely affected if there is a concentration of particular tenants among the mortgaged properties or of tenants in a particular business or industry.
The Failure of a Tenant Will Have a Negative Impact on Single Tenant and Tenant Concentration Properties
The bankruptcy or insolvency of a major tenant or sole tenant, or a number of smaller tenants, in retail, industrial and office properties may adversely affect the income produced by a mortgaged property. Under the Bankruptcy Code, a tenant has the option of assuming or rejecting any unexpired lease. If the tenant rejects the lease, the landlord’s claim for breach of the lease would be a general unsecured claim against the tenant (absent collateral securing the claim) and the amounts the landlord could claim would be limited.
In addition, certain of the mortgaged properties may have tenants that are paying rent but are not in occupancy or may have vacant space that is not leased or major tenants or retail anchors at properties adjacent to the related mortgaged property that have ‘‘gone dark’’. Any ‘‘dark’’ space may cause the property to be less desirable to other potential tenants or the related tenant may be more likely to default in its obligations under the lease. We cannot assure you that those tenants will continue to fulfill their lease obligations or that the space will be relet. Additionally, certain tenants may have a right to a rent abatement or the right to cancel their lease if certain major tenants at the mortgaged property vacate or ‘‘go dark’’. For example, with respect to the Wellington Market Place mortgage loan (loan number 32), representing 0.8% of the mortgage pool (0.9% of loan group&nb sp;1), one tenant, representing approximately 27.0% of the net rentable area, is paying rent but is not in occupancy. In addition, with respect to the English Village mortgage loan (loan number 81), representing approximately 0.3% of the mortgage pool (0.3% of loan group 1), one tenant, representing approximately 19.5% of the net rentable area, has vacated its rented space and has not yet exercised its lease renewal option.
In addition, with respect to 15 mortgaged properties (loan numbers 1.06, 2.16, 3.27, 4, 5, 9, 23, 36, 37, 39, 55, 78, 97, 106 and 128), representing, by allocated loan amount, approximately 16.3% of the mortgage pool (18.4% of loan group 1), the related borrower is the lessor under a ground lease and the ground lease payments are the borrowers only source of income available to satisfy its obligations under the related mortgage loan documents.
Litigation May Have Adverse Effect on Borrowers
From time to time, there may be legal proceedings pending, threatened or ongoing against the borrowers, managers, sponsors and their respective affiliates relating to the business of, or arising out of the ordinary course of business of, or outside of the ordinary course of business of, the borrowers, managers, sponsors and their respective affiliates, and certain of the borrowers, managers, sponsors and their respective affiliates are currently subject to legal proceedings relating to the business of, or arising out of the ordinary course of business of, or outside of the ordinary course of business, the borrowers, managers, sponsors or their respective affiliates. In addition, certain borrowers, managers and their respective affiliates may be or have been subject to investigation, civil penalty, criminal penalty or
S-84
enforcement. It is possible that such proceedings may have a material adverse effect on any borrower’s ability to meet its obligations under the related mortgage loan and, thus, on distributions on your certificates.
With respect to 4 mortgage loans (loan numbers 35, 57, 66 and 85), representing approximately 1.7% of the mortgage pool (3 mortgage loans in loan group 1 or 1.5% and 1 mortgage loan in loan group 2 or 2.8%), Triple Net Properties, LLC or G REIT, Inc., a public company affiliated with Triple Net Properties, LLC, is the sponsor of the related borrowers and an affiliate of the property managers. Triple Net Properties, LLC has advised the related mortgage loan seller that the SEC commenced an investigation regarding certain of its activities. In its filings with the SEC, G REIT, Inc., indicated that the SEC requested information relating to disclosure in securities offerings and exemptions from the registration requirements of the Securities Act of 1933, as amended, for the private offerings in which Triple Net Properties, LLC and its affiliated entities were involved and exemptions from the registration requirements of the Se curities Exchange Act of 1934, as amended, for several entities. In a recent filing with the SEC, G REIT, Inc. indicated that the information disclosed in connection with these securities offerings relating to the prior performance of all public and non public investment programs sponsored by Triple Net Properties, LLC contained certain errors. G REIT, Inc. reported that these errors included the following: (i) the prior performance tables included in the offering documents were stated to be presented on a GAAP basis but generally were not, (ii) a number of the prior performance data figures were themselves erroneous, even as presented on a tax or cash basis and (iii) with respect to certain programs sponsored by Triple Net Properties, LLC, where Triple Net Properties, LLC invested either alongside or in other programs sponsored by Triple Net Properties, LLC, the nature and results of these investments were not fully and accurately disclosed in the tables, resulti ng in an overstatement of Triple Net Properties, LLC’s program and aggregate portfolio operating results. We cannot assure you that G REIT, Inc. or Triple Net Properties, LLC will be able to adequately address these disclosure issues or that these investigations will not result in fines, penalties or administrative remedies or otherwise have an adverse effect on the performance, operations or financial condition of G REIT, Inc. or Triple Net Properties, LLC. In addition, we cannot assure you that if litigation were to commence or security holders were to assert claims related to the foregoing, it would not have a material adverse effect on your certificates.
The Prospective Performance of the Commercial and Multifamily Mortgage Loans Included in the Trust Fund Should Be Evaluated Separately from the Performance of the Mortgage Loans in Any of Our Other Trusts
While there may be certain common factors affecting the performance and value of income-producing real properties in general, those factors do not apply equally to all income-producing real properties and, in many cases, there are unique factors that will affect the performance and/or value of a particular income-producing real property. Moreover, the effect of a given factor on a particular real property will depend on a number of variables, including but not limited to property type, geographic location, competition, sponsorship and other characteristics of the property and the related mortgage loan. Each income-producing real property represents a separate and distinct business venture; and, as a result, each of the multifamily and commercial mortgage loans included in one of the depositor’s trusts requires a unique underwriting analysis. Furthermore, economic and other conditions affecting real properties, whether worldwide, national, regional or local , vary over time. The performance of a pool of mortgage loans originated and outstanding under a given set of economic conditions may vary significantly from the performance of an otherwise comparable mortgage pool originated and outstanding under a different set of economic conditions. Accordingly, investors should evaluate the mortgage loans underlying the offered certificates independently from the performance of mortgage loans underlying any other series of offered certificates.
As a result of the distinct nature of each pool of commercial mortgage loans, and the separate mortgage loans within each pool, this prospectus supplement does not include disclosure concerning the delinquency and loss experience of static pools of periodic originations by the sponsor of assets of the type to be securitized (known as ‘‘static pool data’’). Because of the highly heterogeneous nature of the assets in commercial mortgage backed securities transactions, static pool data for prior securitized pools, even those involving the same asset types (e.g., hotels or office buildings), may be misleading, since the
S-85
economics of the mortgaged properties and terms of the mortgage loans may be materially different. In particular, static pool data showing a low level of delinquencies and defaults would not be indicative of the performance of this pool or any other pool of mortgage loans originated by the same sponsor or sponsors. Therefore, investors should evaluate this offering on the basis of the information set forth in this prospectus supplement with respect to these mortgage loans, and not on the basis of any successful performance of other pools of securitized commercial mortgage loans.
The Status of a Ground Lease May Be Uncertain in a Bankruptcy Proceeding
Fourteen (14) mortgaged properties, representing 16.2% of the mortgage pool (18.3% of loan group 1) by allocated loan amount, are secured in whole or in part by leasehold interests. Leasehold mortgage loans are subject to certain risks not associated with mortgage loans secured by a lien on the fee estate of the borrower. One of these risks is that if the related leasehold interest were to be terminated upon a lease default, the mortgagee would lose its security in the loan. Generally, each related ground lease requires the lessor thereunder to give the mortgagee notice of the borrower’s defaults under the ground lease and an opportunity to cure them, permits the leasehold interest to be assigned to the mortgagee or a purchaser at a foreclosure sale (in some cases only upon the consent of the lessor) and contains certain other protective provisions typically included in a ‘‘mortgageable’’ ground lease. In addition, pursuant to Secti on 365(h) of the Bankruptcy Code, ground lessees in possession under a ground lease that has commenced have the right to continue in a ground lease even though the representative of their bankrupt ground lessor rejects the lease. The leasehold mortgages generally provide that the borrower may not elect to treat the ground lease as terminated on account of any such rejection by the ground lessor without the prior approval of the holder of the mortgage note or otherwise prohibit the borrower from terminating the ground lease. In a bankruptcy of a ground lessee/borrower, the ground lessee/borrower under the protection of the Bankruptcy Code has the right to assume (continue) or reject (breach and/or terminate) any or all of its ground leases. If the ground lessor and the ground lessee/borrower are concurrently involved in bankruptcy proceedings, the trustee may be unable to enforce the bankrupt ground lessee/borrower’s right to continue in a ground lease rejected by a bankrupt ground lessor. In such circumstances, a ground lease could be terminated notwithstanding lender protection provisions contained therein or in the related mortgage. Further, in a recent decision by the United States Court of Appeals for the Seventh Circuit (Precision Indus. v. Qualitech Steel SBQ, LLC, 327 F.3d 537 (7th Cir. 2003)), the court ruled with respect to an unrecorded lease of real property that where a statutory sale of the fee interest in leased property occurs under Section 363(f) of the Bankruptcy Code (11 U.S.C. Section 363(f)) upon the bankruptcy of a landlord, such sale terminates a lessee’s possessory interest in the property, and the purchaser assumes title free and clear of any interest, including any leasehold estates. Pursuant to Section 363(e) of the Bankruptcy Code (11 U.S.C. Section 363(e)), a lessee may request the bankruptcy cour t to prohibit or condition the statutory sale of the property so as to provide adequate protection of the leasehold interest; however, the court ruled that this provision does not ensure continued possession of the property, but rather entitles the lessee to compensation for the value of its leasehold interest, typically from the sale proceeds. While there are certain circumstances under which a ‘‘free and clear’’ sale under Section 363(f) of the Bankruptcy Code would not be authorized (including that the lessee could not be compelled in a legal or equitable proceeding to accept a monetary satisfaction of his possessory interest, and that none of the other conditions of Section 363(f)(1)-(4) of the Bankruptcy Code otherwise permits the sale), we cannot provide assurances that those circumstances would be present in any proposed sale of a leased premises. As a result, we cannot provide assurances that, in the event of a statutory sale of leased property pursuant to Section&nb sp;363(f) of the Bankruptcy Code, the lessee will be able to maintain possession of the property under the ground lease. In addition, we cannot provide assurances that the lessee and/or the mortgagee will be able to recuperate the full value of the leasehold interest in bankruptcy court.
In addition, certain of the mortgaged properties securing the mortgage loans are subject to operating leases. The operating lessee then sublets space in the mortgaged property to sub-tenants. Therefore, the cash flow from the rented mortgaged property will be subject to the bankruptcy risks with respect to the operating lessee.
S-86
Mortgage Loan Sellers May Not Be Able to Make a Required Repurchase or Substitution of a Defective Mortgage Loan
Each mortgage loan seller is the sole warranting party in respect of the mortgage loans sold by such mortgage loan seller to us. Neither we nor any of our affiliates (except, in certain circumstances, for Wachovia Bank, National Association in its capacity as a mortgage loan seller) are obligated to repurchase or substitute any mortgage loan in connection with either a breach of any mortgage loan seller’s representations and warranties or any document defects, if such mortgage loan seller defaults on its obligation to do so. We cannot provide assurances that the mortgage loan sellers will have the financial ability to effect such repurchases or substitutions.
In addition, one or more of the mortgage loan sellers may have acquired a portion of the mortgage loans included in the trust fund in one or more secondary market purchases. Such purchases may be challenged as fraudulent conveyances. Such a challenge, if successful, may have a negative impact on the distributions on your certificates. See ‘‘DESCRIPTION OF THE MORTGAGE POOL—Assignment of the Mortgage Loans; Repurchases and Substitutions’’ and ‘‘—Representations and Warranties; Repurchases and Substitutions’’ in this prospectus supplement and ‘‘DESCRIPTION OF THE POOLING AND SERVICING AGREEMENTS—Representations and Warranties; Repurchases’’ in the accompanying prospectus.
S-87
Description of the Mortgage Pool
General
The pool of mortgage loans included in the Trust Fund (the ‘‘Mortgage Pool’’) is expected to consist of 142 fixed rate mortgage loans (the ‘‘Mortgage Loans’’), with an aggregate principal balance (the ‘‘Cut-Off Date Pool Balance’’) of $3,823,853,069. The ‘‘Cut-Off Date’’ for (i) 138 of the Mortgage Loans is June 11, 2007, (ii) 1 of the Mortgage Loans is June 7, 2007, (iii) 2 of the Mortgage Loans is June 1, 2007 and (iv) 1 of the Mortgage Loans is June 7, 2007, its origination date. The ‘‘Cut-Off Date Balanc e’’ of each Mortgage Loan will equal the unpaid principal balance thereof as of the related Cut-Off Date, after reduction for all payments of principal due on or before such date, whether or not received. The Mortgage Pool will be deemed to consist of 2 loan groups (‘‘Loan Group 1’’ and ‘‘Loan Group 2’’ and, together, the ‘‘Loan Groups’’). Loan Group 1 will consist of all of the Mortgage Loans that are not secured by multifamily properties. Loan Group 1 is expected to consist of 113 Mortgage Loans, with an aggregate Cut-Off Date Balance of $3,380,656,275 (the ‘& lsquo;Cut-Off Date Group 1 Balance’’). Loan Group 2 will consist of 29 Mortgage Loans that are secured by multifamily properties, with an aggregate Cut-Off Date Balance of $443,196,794 (the ‘‘Cut-Off Date Group 2 Balance’’ and, together with the Cut-Off Date Group 1 Balance, the ‘‘Cut-Off Date Group Balances’’). Annex A-1 to this prospectus supplement sets forth the Loan Group designation with respect to each Mortgage Loan. The Cut-Off Date Balances of all of the Mortgage Loans in the Mortgage Pool range from $1,000,000 to $414,000,000. The Mortgage Loans in the Mortgage Pool have an av erage Cut-Off Date Balance of $26,928,543. The Cut-Off Date Balances of the Mortgage Loans in Loan Group 1 range from $1,000,000 to $414,000,000. The Mortgage Loans in Loan Group 1 have an average Cut-Off Date Balance of $29,917,312. The Cut-Off Date Balances of the Mortgage Loans in Loan Group 2 range from $3,100,000 to $40,000,000. The Mortgage Loans in Loan Group 2 have an average Cut-Off Date Balance of $15,282,648. References to percentages of Mortgaged Properties referred to in this prospectus supplement without further description are references to the percentages of the Cut-Off Date Pool Balance represented by the aggregate Cut-Off Date Balance of the related Mortgage Loans and references to percentages of Mortgage Loans in a particular Loan Group without further description are references to the related Cut-Off Date Group Balance. The descriptions in this prospectus supplement of the Mortgage Loans and the Mortgaged Properties are based upon the pool of Mortgage Loans as it is ex pected to be constituted as of the close of business on the Closing Date, assuming that (1) all scheduled principal and/or interest payments due on or before the Cut-Off Date will be made, and (2) there will be no principal prepayments on or before the Cut-Off Date.
All percentages of the Mortgage Loans or any specified group of Mortgage Loans referred to in this prospectus supplement are approximate percentages. All numerical and statistical information presented in this prospectus supplement (including Cut-Off Date Balances, cut-off date balance per square foot/room/unit, loan-to-value ratios and debt service coverage ratios) with respect to the Co-Lender Loans are calculated without regard to the related Subordinate Companion Loans; provided that with respect to the Beacon D.C. & Seattle Pool Loan, the ING Hospitality Loan and the DDR Southeast Pool Loan, numerical and statistical information presented herein with respect to loan balance per square foot/room, loan-to-value ratios and debt service coverage ratios reflect its Pari Passu Companion Loan, as well as the Mortga ge Loan itself.
All of the Mortgage Loans are evidenced by a promissory note (each, a ‘‘Mortgage Note’’) and are secured by a mortgage, deed of trust or other similar security instrument (each, a ‘‘Mortgage’’) that creates a first mortgage lien on a fee simple estate or, with respect to 14 Mortgaged Properties, representing, by allocated loan amount, approximately 16.2% of the Cut-Off Date Pool Balance (18.3% of the Cut-Off Date Group 1 Balance), on a portion or all of a leasehold estate in an income-producing real property (each, a ‘‘Mortgaged Property’’).
Set forth below are the number of Mortgage Loans, and the approximate percentage of the Cut-Off Date Pool Balance represented by such Mortgage Loans that are secured by Mortgaged Properties operated for each indicated purpose:
S-88
Mortgaged Properties by Property Type(1)
| Property Type | Number of Mortgaged Properties | Aggregate Cut-Off Date Balance | % of Initial Pool Balance | % of Group 1 Pool Balance | % of Group 2 Pool Balance | |||||||||||||||||||||||||
| Office | 56 | $ | 1,169,790,500 | 30.6 | % | 34.6 | % | 0.0 | % | |||||||||||||||||||||
| Retail | 99 | 1,026,196,690 | 26.8 | 30.4 | 0.0 | |||||||||||||||||||||||||
| Retail - Anchored | 76 | 801,889,645 | 21.0 | 23.7 | 0.0 | |||||||||||||||||||||||||
| Retail - Outlet | 1 | 92,400,000 | 2.4 | 2.7 | 0.0 | |||||||||||||||||||||||||
| Retail - Single Tenant | 11 | 56,317,045 | 1.5 | 1.7 | 0.0 | |||||||||||||||||||||||||
| Retail - Unanchored | 7 | 49,190,000 | 1.3 | 1.5 | 0.0 | |||||||||||||||||||||||||
| Retail - Shadow Anchored(2) | 4 | 26,400,000 | 0.7 | 0.8 | 0.0 | |||||||||||||||||||||||||
| Hospitality | 61 | 715,271,335 | 18.7 | 21.2 | 0.0 | |||||||||||||||||||||||||
| Multifamily | 30 | 443,196,794 | 11.6 | 0.0 | 100.0 | |||||||||||||||||||||||||
| Mixed Use | 11 | 365,700,000 | 9.6 | 10.8 | 0.0 | |||||||||||||||||||||||||
| Industrial | 10 | 67,297,750 | 1.8 | 2.0 | 0.0 | |||||||||||||||||||||||||
| Special Purpose | 2 | 17,500,000 | 0.5 | 0.5 | 0.0 | |||||||||||||||||||||||||
| Healthcare | 1 | 13,000,000 | 0.3 | 0.4 | 0.0 | |||||||||||||||||||||||||
| Land(3) | 5 | 5,900,000 | 0.2 | 0.2 | 0.0 | |||||||||||||||||||||||||
| 275 | $ | 3,823,853,069 | 100.0 | % | 100.0 | % | 100.0 | % | ||||||||||||||||||||||
| (1) | Because this table presents information relating to the Mortgaged Properties and not the Mortgage Loans, the information for the Mortgage Loans secured by more than one Mortgaged Property is based on allocated loan amounts (allocating the Mortgage Loan principal balance to each of those properties by the appraised values of the Mortgaged Properties or the allocated loan amount (or specified release prices) as detailed in the related Mortgage Loan documents). |
| (2) | A Mortgaged Property is classified as ‘‘shadow anchored’’ if it is located in close proximity to an anchored retail property. |
| (3) | As of the origination of the related Mortgage Loan, one Mortgaged Property was improved with a mixed use office/retail building, one was improved with an apartment complex, one was improved with multifamily condominium complex, one was improved with a high rise office building and a seven-story parking garage and the other was improved with a mixed use project that includes an office tower, retail arcade, underground parking facilities, meeting space and a 395-room luxury hotel; however, in all cases, the improvements are not part of the collateral for the related Mortgaged Property. |
Mortgaged Properties by Property Type
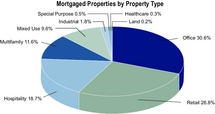
Mortgage Loan Selection Process
All of the Mortgage Loans were selected based on various considerations concerning the Mortgage Pool in an effort to maximize the execution of the Certificates, including the Non-Offered Certificates, and create a diverse Mortgage Pool. Such considerations include, but are not limited to, the property types that serve as collateral for the Mortgage Loans, the principal balance of the Mortgage Loans, the geographic location of such properties, the sponsor of each Mortgage Loan and certain financial characteristics of the Mortgage Loans, such as debt service coverage ratios and loan-to-value ratios. For
S-89
a description of the types of underlying Mortgage Loans included in the Trust Fund and a description of the material terms of such underlying Mortgage Loans, see ‘‘DESCRIPTION OF THE MORTGAGE POOL’’ in this prospectus supplement.
Mortgage Loan History
All of the Mortgage Loans will be acquired on the Closing Date by the Depositor from the Mortgage Loan Sellers. Wachovia Bank, National Association (‘‘Wachovia’’), in its capacity as a Mortgage Loan Seller, originated 125 of the Mortgage Loans to be included in the Trust Fund, representing 97.9% of the Cut-Off Date Pool Balance (99 Mortgage Loans in Loan Group 1 or 98.2% of the Cut-Off Date Group 1 Balance and 26 Mortgage Loans in Loan Group 2 or 95.3% of the Cut-Off Date Group 2 Balance). Artesia Mortgage Capital Corporation (‘‘Artesia’’) originated 17 of the Mortgage Loans to be included in the Trust Fund, representing 2.1% of the Cut-Off Date Pool Balance (14 Mortgag e Loans in Loan Group 1 or 1.8% of the Cut-Off Date Group 1 Balance and 3 Mortgage Loans in Loan Group 2 or 4.7% of the Cut-Off Date Group 2 Balance). None of the Mortgage Loans were 30 days or more delinquent as of the Cut-Off Date, and no Mortgage Loan has been 30 days or more delinquent during the 12 months preceding the Cut-Off Date (or since the date of origination if such Mortgage Loan has been originated within the past 12 months). A Mortgage Loan is generally considered delinquent if the full contractual payment is not received on the related Due Date, in all instances, taking into account any applicable grace periods.
Certain Terms and Conditions of the Mortgage Loans
Mortgage Rates; Calculations of Interest. All of the Mortgage Loans bear interest at rates (each a ‘‘Mortgage Rate’’) that will remain fixed for their remaining terms; provided, however, after the applicable Anticipated Repayment Date, the interest rate on the related ARD Loans will increase as described in this prospectus supplement. See ‘‘—Amortization’’ below. One hundred forty-one (141) of the Mortgage Loans, representing 98.0% of the Cut-Off Date Pool Balance (112 Mortgage Loans in Loan Group 1 or 97.8% of the Cut-Off Date Group 1 Balance and all of the Mortgage Loans in Loan Group 2), accrue interest on the basis of the actual number of days elapsed over a 360-day year (an ‘‘Actual/360 basis’’). One (1) of the Mortgage Loans, representing 2.0% of the Cut-Off Date Pool Balance (2.2% of the Cut-Off Date Group 1 Balance), accrues interest on the basis of a 360-day year consisting of twelve 30-day months (a ‘‘30/360 basis’’). This Mortgage Loan is sometimes referred to in this prospectus supplement as the ‘‘30/360 Mortgage Loan’’. Thirty-three (33) of the Mortgage Loans, representing 15.7% of the Cut-Off Date Pool Balance (29 Mortgage Loans in Loan Group 1 or 16.5% of the Cut-Off Date Group 1 Balance and 4 Mortgage Loans in Loan Group 2 or 9.1% of the Cut-Off Date Group 2 Balance), have periods during which only interest is due and periods in which principal and interest are due. Eighty-six (86) of the Mortgage Loans, representing 79.6% of the Cut-Off Date Pool Balance (64 Mortgage Loans in Loan Group 1 or 78.8% of the Cut-Off Date Group 1 Balance and 22 Mortgage Loans in Loan Group 2 or 86.0% of the Cut-Off Date Group 2 Balance), are interest-only for their entire term.
Mortgage Loan Payments. Scheduled payments of principal and/or interest other than Balloon Payments (the ‘‘Periodic Payments’’) on all of the Mortgage Loans are due monthly.
Due Dates. Generally, the Periodic Payment for each Mortgage Loan is due on the date (each such date, a ‘‘Due Date’’) occurring on the 11th day of the month (or in the case of 2 Mortgage Loans, the 1st day of the month, in the case of 1 Mortgage Loan, the 5th day of the month and in the case of 1 Mortgage Loan, the 7th day of the month). No Mortgage Loan has a grace period that extends payment beyond the 11th day of any calendar month other than 1 Mortgage Loan, representing 2.0% of the Cut-Off Date Pool Balance (2.2% of the Cut-Off Date Group 1 Balance) wh ich have a twice-per-year grace period that may extend payment until the 13th day of any calendar month (capped at five notices over the life of the loan).
Amortization. All of the Mortgage Loans provide for Periodic Payments based on amortization schedules significantly longer than their respective terms to maturity (the ‘‘Balloon Loans’’), in each case with payments on their respective scheduled maturity dates of principal amounts outstanding (each such amount, together with the corresponding payment of interest, a ‘‘Balloon Payment’’). Eighty-six (86) of these Mortgage Loans, representing 79.6% of the Cut-Off Date Pool Balance (64 Mortgage Loans in Loan
S-90
Group 1 or 78.8% of the Cut-Off Date Group 1 Balance and 22 Mortgage Loans in Loan Group 2 or 86.0% of the Cut-Off Date Group 2 Balance), provide for interest-only Periodic Payments for the entire term and do not amortize.
Five (5) of the Balloon Loans (the ‘‘ARD Loans’’), representing 0.6% of the Cut-Off Date Pool Balance (0.7% of the Cut-Off Date Group 1 Balance), provide that if the unamortized principal amount thereof is not repaid on a date set forth in the related Mortgage Note (the ‘‘Anticipated Repayment Date’’), the Mortgage Loan will accrue additional interest (the ‘‘Additional Interest’’) at the rate set forth therein and the borrower will be required to apply excess monthly cash flow (the ‘‘Excess Cash Flow’’) generated by the Mortgaged Property (as determined in the related Mortgage Loan documents) to the repayment of principal outstanding on the Mortgage Loan. On or before the Anticipated Repayment Date, the ARD Loans generally require the related borrower to enter into a cash management agreement whereby all Excess Cash Flow will be deposited directly into a lockbox account. All of these ARD Loans provide for monthly payments of interest only until the related Anticipated Repayment Date and do not provide for any amortization of principal before the related Anticipated Repayment Date. Any amount received in respect of Additional Interest will be distributed to the holders of the Class Z Certificates. Generally, Additional Interest will not be included in the calculations of the Mortgage Rate for a Mortgage Loan, and will only be paid after the outstanding principal balance of the Mortgage Loan together with all in terest thereon at the Mortgage Rate has been paid. With respect to such Mortgage Loans, no Prepayment Premiums or Yield Maintenance Charges will be due in connection with any principal prepayment after the Anticipated Repayment Date.
Thirty-three (33) of the Balloon Loans and ARD Loans, representing 15.7% of the Cut-Off Date Pool Balance (29 Mortgage Loans in Loan Group 1 or 16.5% of the Cut-Off Date Group 1 Balance and 4 Mortgage Loans in Loan Group 2 or 9.1% of the Cut-Off Date Group 2 Balance), provide for monthly payments of interest only for the first 12 to 84 months in the case of Loan Group l and 60 months in the case of Loan Group 2 followed by payments which amortize a portion of the principal balance of the Mortgage Loans by their related maturity dates or Anticipated Repayment Dates, as applicable, but not the entire principal balance of the Mortgage Loans. Eighty-six (86) of the Balloon Loans and ARD Loans, representing 79.6% of the Cut-Off Date Pool Balance (64 Mortgage Loans in Loan Group 1 or 78.8% of the Cut-Off Date Group 1 Balance and 22 Mortgage Loans in Loan Group 2 or 86.0% of the Cut-Off Date Group 2 Balance), provide fo r monthly payments of interest only until maturity or ARD and do not provide for any amortization of principal.
Prepayment Provisions. As of the Cut-Off Date, all of the Mortgage Loans restrict or prohibit voluntary principal prepayment. In general, all of the Mortgage Loans either:
(i) prohibit prepayment for most of the term of the Mortgage Loan but permit defeasance after a date specified in the related Mortgage Note for all or most of the remaining term (87 Mortgage Loans or 47.2% of the Cut-Off Date Pool Balance (67 Mortgage Loans in Loan Group 1 or 45.0% of the Cut-Off Date Group 1 Balance and 20 Mortgage Loans in Loan Group 2 or 63.9% of the Cut-Off Date Group 2 Balance));
(ii) impose a Yield Maintenance Charge for most or all of the remaining term of the Mortgage Loan (17 Mortgage Loans or 14.8% of the Cut-Off Date Pool Balance (11 Mortgage Loans in Loan Group 1 or 13.0% of the Cut-Off Date Group 1 Balance and 6 Mortgage Loans in Loan Group 2 or 28.2% of the Cut-Off Date Group 2 Balance));
(iii) prohibit prepayment until a date specified in the related Mortgage Note and then impose a Yield Maintenance Charge for most or all of the remaining term (21 Mortgage Loans or 14.2% of the Cut-Off Date Pool Balance (18 Mortgage Loans in Loan Group 1 or 15.1% of the Cut-Off Date Group 1 Balance and 3 Mortgage Loans in Loan Group 2 or 7.9% of the Cut-Off Date Group 2 Balance));
(iv) prohibit prepayment until a date specified in the related Mortgage Note, but permit defeasance or impose a Yield Maintenance Charge for most or all of the remaining term (14 Mortgage Loans or 12.2% of the Cut-Off Date Pool Balance (13.9% of the Cut-Off Date Group 1 Balance);
S-91
(v) impose a Yield Maintenance Charge for most of the term of the Mortgage Loan but permit defeasance after a date specified in the related Mortgage Note for most or all of the remaining term (2 Mortgage Loans or 11.5% of the Cut-Off Date Pool Balance (13.0% of the Cut-Off Date Group 1 Balance); or
(vi) prohibit prepayment for most or all of the remaining term (1 Mortgage Loan or 0.1% of the Cut-Off Date Pool Balance (0.1% of the Cut-Off Date Group 1 Balance)); provided that for purposes of each of the foregoing, ‘‘remaining term’’ refers to either the remaining term to maturity or the Anticipated Repayment Date, as applicable, of the related Mortgage Loan.
See ‘‘—Additional Mortgage Loan Information’’ in this prospectus supplement. Prepayment Premiums and Yield Maintenance Charges, if and to the extent collected, will be distributed as described under ‘‘DESCRIPTION OF THE CERTIFICATES—Distributions—Allocation of Prepayment Premiums and Yield Maintenance Charges’’ in this prospectus supplement. The Depositor makes no representation as to the enforceability of the provisions of any Mortgage Note requiring the payment of a Prepayment Premium or Yield Maintenance Charge, or of the collectibility of any Prepayment Premium or Yield Maintenance Charge.
Certain state laws limit the amounts that a mortgagee may collect from a borrower as an additional charge in connection with the prepayment of a mortgage loan. The Mortgage Loans generally do not require the payment of Prepayment Premiums or Yield Maintenance Charges in connection with a prepayment, in whole or in part, of the related Mortgage Loan as a result of or in connection with a total casualty or condemnation. Furthermore, the enforceability, under the laws of a number of states, of provisions providing for payments comparable to the Prepayment Premiums and/or Yield Maintenance Charges upon an involuntary prepayment is unclear. No assurance can be given that, at the time a Prepayment Premium or Yield Maintenance Charge is required to be made on a Mortgage Loan in connection with an involuntary prepayment, any obligation to pay such Prepayment Premium or Yield Maintenance Charge will be enforceable under applicable state law.
The Mortgage Loans included in the Trust Fund provide that, in the event of a partial prepayment of such Mortgage Loan due to the receipt of insurance proceeds or a condemnation award in connection with a casualty or condemnation, the monthly debt service payment of such Mortgage Loan will remain unchanged. See ‘‘RISK FACTORS—The Offered Certificates—Prepayments Will Affect Your Yield’’ in this prospectus supplement.
One hundred three (103) of the Mortgage Loans, representing 70.9% of the Cut-Off Date Pool Balance (83 Mortgage Loans in Loan Group 1 or 71.8% of the Cut-Off Date Group 1 Balance and 20 Mortgage Loans in Loan Group 2 or 63.9% of the Cut-Off Date Group 2 Balance), provide that, in general, under certain conditions, the related borrower will have the right, no earlier than two years following the Closing Date, to substitute a pledge of defeasance collateral (‘‘Defeasance Collateral’’) in exchange for a release of the related Mortgaged Property (or a portion thereof) from the lien of the related Mortgage without the prepayment of the Mortgage Loan or the payment of the applicable Prepayment Premium or Yield Maintenance Charge. Mortgage Loans secured by more than one Mortgaged Property (or multiple parcels or buildings constituting one Mortgaged Property) which provide for partial defeasance generally require that, among other things, (i) prior to the release of a related Mortgaged Property (or a portion thereof), a specified percentage (generally between 100% and 125%) of the allocated loan amount for such Mortgaged Property be defeased and (ii) that certain debt service coverage ratios and loan-to-value ratio tests be satisfied with respect to the remaining Mortgaged Properties (or portion thereof) after the defeasance. See ‘‘Beacon D.C. & Seattle Pool’’ in Annex D to this prospectus supplement. A Mortgage Loan may still be subject to prepayment during any applicable open period notwithstanding that it has been defeased as described in this prospectus supplement.
In general, Defeasance Collateral is required to consist of United States government obligations that provide for payments on or prior, but as close as possible, to all successive Due Dates and the scheduled maturity date (or the Anticipated Repayment Date in the case of the ARD Loans) (provided that in the case of certain Mortgage Loans, such defeasance payments may cease at the beginning of the open prepayment period with respect to such Mortgage Loan, and the final payment on the Defeasance Collateral may be sufficient to fully prepay the Mortgage Loan), with each such payment being equal to
S-92
or greater than (with any excess to be returned to the borrower (in some cases, after the related Mortgage Loan is paid in full)) the Periodic Payment due on such date or (i) in the case of a Balloon Loan on the scheduled maturity date, the Balloon Payment, or (ii) in the case of an ARD Loan, the principal balance on its Anticipated Repayment Date. The Pooling and Servicing Agreement requires the Master Servicer or the Special Servicer to require each borrower that proposes to prepay its Mortgage Loan to pledge Defeasance Collateral in lieu of making a prepayment, to the extent the related Mortgage Loan documents enable the Master Servicer or the Special Servicer, as applicable, to make such requirement, but in each case subject to certain conditions, including that the defeasance would not have an adverse effect on the REMIC status of any of the REMICs (accordingly, no defeasance would be required or permitted prior to the second anniversary of the Closing Date). The cash amount a borrower must ex pend to purchase, or deliver to the Master Servicer in order for the Master Servicer to purchase, such Defeasance Collateral may be in excess of the principal balance of the related Mortgage Loan. There can be no assurances that a court would not interpret such portion of the cash amount that exceeds the principal balance as a form of prepayment consideration and would not take it into account for usury purposes. In some states some forms of prepayment consideration are unenforceable.
See ‘‘YIELD AND MATURITY CONSIDERATIONS—Yield Considerations’’ and the modeling assumptions described in ‘‘YIELD AND MATURITY CONSIDERATIONS—Weighted Average Life’’ in this prospectus supplement.
Generally, neither the Master Servicer nor the Special Servicer is permitted to waive or modify the terms of any Mortgage Loan prohibiting voluntary prepayments during a Lockout Period or requiring the payment of a Prepayment Premium or Yield Maintenance Charge except under the circumstances described in ‘‘SERVICING OF THE MORTGAGE LOANS—Modifications, Waivers and Amendments’’ in this prospectus supplement.
Other Financing. With limited exceptions, all of the Mortgage Loans prohibit the related borrower from encumbering the Mortgaged Property with additional secured debt without the mortgagee’s prior consent and, also with limited exceptions, prohibit the entities with a controlling interest in the related borrower from pledging their interests in such borrower as security for mezzanine debt.
With respect to 4 Mortgage Loans (loan numbers 25, 31, 80 and 96), representing 2.2% of the Cut-Off Date Pool Balance (18.8% of the Cut-Off Date Group 2), Wachovia Development Corporation, an affiliate of Wachovia Bank, National Association, has an equity interest in the related borrower. See ‘‘RISK FACTORS—The Offered Certificates—Potential Conflicts of Interest’’ in this prospectus supplement.
With respect to 3 Mortgage Loans (loan numbers 72, 82 and 87), representing approximately 0.8% of the Cut-Off Date Pool Balance (0.9% of the Cut-Off Date Group 1 Balance), the ownership interests of the direct or indirect owners of the related borrower have been pledged as security for mezzanine debt subject to the terms of an intercreditor agreement entered into in favor of the mortgagee.
With respect to 1 Mortgage Loan (loan number 51), representing approximately 0.4% of the Cut-Off Date Pool Balance (0.5% of the Cut-Off Date Group 1 Balance), the related borrower has incurred additional unsecured debt other than in the ordinary course of business and the related promissory notes contain subordination and standstill provisions or there is a separate subordination and standstill agreement.
With respect to 5 Mortgage Loans (loan numbers 21, 52, 75, 111 and 135), representing approximately 1.9% of the Cut-Off Date Pool Balance (2 Mortgage Loans in Loan Group 1 or 0.2% of the Cut-Off Date Group 1 Balance and 3 Mortgage Loans in Loan Group 2 or 15.1% of the Cut-Off Date Group 2 Balance), the related Mortgage Loan documents provide that under certain circumstances the related borrower may encumber the related Mortgaged Property with subordinate debt in the future.
With respect to 35 Mortgage Loans (loan numbers 2, 3, 4, 6, 9, 10, 15, 18, 19, 23, 25, 27, 30, 31, 33, 34, 39, 41, 45, 50, 53, 60, 67, 73, 77, 78, 87, 90, 92, 103, 108, 109, 119, 125 and 138), representing approximately 41.5% of the Cut-Off Date Pool Balance (28 Mortgage Loans in Loan Group 1 or 42.0% of the Cut-Off Date Group 1 Balance and 7 Mortgage Loans in Loan Group 2 or 37.7% of the Cut-Off Date Group 2 Balance), the related Mortgage Loan documents provide that, under certain circumstances
S-93
(which may include satisfaction of DSCR and LTV tests) and in certain cases with the consent of the mortgagee, ownership interests in the related borrowers may be pledged as security for mezzanine debt in the future, subject to the terms of a subordination and standstill agreement or intercreditor agreement to be entered into in favor of the mortgagee.
With respect to 1 Mortgage Loan (loan number 1) representing 10.8%, of the Cut-Off Date Pool Balance (12.2% of the Cut-Off Date Group 1 Balance), the related borrower has incurred additional debt (a) secured by an interest in the related Mortgaged Property and (b) secured by ownership interests in the related borrower pledged as security for such loan.
With respect to 2 Mortgage Loans (loan numbers 1 and 11), representing 12.8% of the Cut-Off Date Pool Balance (14.5% of the Cut-Off Date Group 1 Balance), the related Mortgage Loan documents provide that, under certain circumstances, the related borrowers may incur additional unsecured debt (in addition to unsecured trade payables in customary amounts incurred in the ordinary course of business).
Further, certain of the Mortgage Loans included in the Trust Fund do not prohibit limited partners or other owners of non-controlling interests in the related borrower from pledging their interests in the borrower as security for mezzanine debt. See ‘‘RISK FACTORS—The Mortgage Loans—Additional Debt on Some Mortgage Loans Creates Additional Risks’’ in this prospectus supplement.
In addition, with respect to the Co-Lender Loans, the related Mortgaged Property also secures one or more Companion Loans. See ‘‘Co-Lender Loans’’ in this prospectus supplement.
Nonrecourse Obligations. The Mortgage Loans are generally nonrecourse obligations of the related borrowers and, upon any such borrower’s default in the payment of any amount due under the related Mortgage Loan, the holder thereof may look only to the related Mortgaged Property for satisfaction of the borrower’s obligations. In addition, in those cases where recourse to a borrower or guarantor is purportedly permitted, the Depositor has not undertaken an evaluation of the financial condition of any such person, and prospective investors should therefore consider all of the Mortgage Loans to be nonrecourse.
Due-On-Sale and Due-On-Encumbrance Provisions. Substantially all of the Mortgages contain ‘‘due-on-sale’’ and ‘‘due-on-encumbrance’’ clauses that, in general, permit the holder of the Mortgage to accelerate the maturity of the related Mortgage Loan if the borrower sells or otherwise transfers or encumbers the related Mortgaged Property or prohibit the borrower from doing so without the consent of the holder of the Mortgage. However, certain of the Mortgage Loans may permit one or more transfers of the related Mortgaged Property or the transfer of a controlling interest in the related borrower to pre-approved transferees or pursuant to pre-approved conditions (including without limitation, as and to the extent permitted under the related Mortgage Loan documents, transfers to or between borrower affiliates, family members, partners and other co-owners and their affiliates, estate planning transfers and transfers upon death or disability, and transfers to transferees meeting criteria set forth in the related Mortgage Loan documents) without the approval of the mortgagee, and certain Mortgage Loans may not prohibit transfers of limited partnership interests or non-managing member interests in the related borrowers. For example , the terms of 15 Mortgage Loans (loan numbers 21, 27, 30, 35, 40, 48, 66, 69, 72, 77, 98, 102, 118, 121 and 141), representing 6.4% of the Cut-Off Date Pool Balance (9 Mortgage Loans in Loan Group 1 or 3.1% of the Cut-Off Date Group 1 Balance and 6 Mortgage Loans in Loan Group 2 or 31.5% of the Cut-Off Date Group 2 Balance), permit the borrowers to transfer tenant-in-common interests to certain transferees as specified in the related Mortgage Loan documents, or to investors that qualify as ‘‘accredited investors’’ under the Securities Act. In the case of certain Mortgage Loans, the related borrower is required under the terms of the related loan documents to transfer the Mortgaged Property to an affiliate in the future that will assume the related Mortgage Loan. As provided in, and subject to, the Pooling and Servicing Agreement, the Master Servicer or the Special Servicer will determine, in a manner consistent with the servicing standard described under ‘&l squo;SERVICING OF THE MORTGAGE LOANS—General’’ in this prospectus supplement whether to exercise any right the mortgagee may have under any such clause to accelerate payment of the related Mortgage Loan upon, or to withhold its consent to, any transfer or further encumbrance of the related Mortgaged Property.
Cross-Default and Cross-Collateralization of Certain Mortgage Loans; Certain Multi-Property Mortgage Loans. Three (3) groups of Mortgage Loans are groups of Mortgage Loans that are
S-94
cross-collateralized and/or cross-defaulted with each of the other Mortgage Loans in their respective groups, as indicated in Annex A-5 to this prospectus supplement. Although the Mortgage Loans within each group of cross-collateralized and/or cross-defaulted Mortgage Loans are generally cross-collateralized and/or cross-defaulted with the other Mortgage Loans in such group, the Mortgage Loans in one group are not cross-co llateralized or cross-defaulted with the Mortgage Loans in any other group. As of the Closing Date, no Mortgage Loan, except the Co-Lender Loans, will be cross-collateralized or cross-defaulted with any loan that is not included in the Mortgage Pool. See ‘‘RISK FACTORS—The Mortgage Loans—Limitations on the Benefits of Cross-Collateralized and Cross-Defaulted Properties’’ in this prospectus supplement. The Master Servicer or the Special Servicer, as the case may be, will determine whether to enforce the cross-default and cross-collaterali zation rights upon a mortgage loan default with respect to any of these Mortgage Loans. The Certificateholders will not have any right to participate in or control any such determination. No other Mortgage Loans are subject to cross-collateralization or cross-default provisions.
Partial Releases. Certain of the Mortgage Loans permit a partial release of a portion of the related Mortgaged Property not material to the underwriting of the Mortgage Loan at the time of origination, without any prepayment or defeasance of the Mortgage Loan.
Nine (9) of the Mortgage Loans (loan numbers 1, 2, 3, 6, 7, 30, 36, 58 and 105), representing 31.7% of the Cut-Off Date Pool Balance (8 Mortgage Loans in Loan Group 1 or 34.9% of the Cut-Off Date Group 1 Balance and 1 Mortgage Loan in Loan Group 2 or 7.0% of the Cut-Off Date Group 2 Balance), permit a partial release of a portion or portions of the related Mortgaged Property or one or more entire Mortgaged Property(ies) in the case of a multi-property loan; provided that among other things, (i) prior to the release of the portion or portions of the related Mortgaged Property or one or more entire Mortgaged Properties in the case of a multi-property loan, a specified percentage (generally between 100% and 120%) of the allocated loan amount for such released Mortgaged Property(ies) or portion(s) of a Mortgaged Property may be prepaid or partially defeased, or alternatively, partial defeasance of an amount specified in the related Mortgage Loan documents and (ii) c ertain DSC Ratio and LTV tests are satisfied at the time of the partial release with respect to the remaining portion of the related Mortgaged Property after the partial release. See ‘‘Beacon D.C. & Seattle Pool’’, ‘‘ING Hospitality Pool’’ and ‘‘DDR Southeast Pool’’ in Annex D to this prospectus supplement.
Seven (7) of the Mortgage Loans (loan numbers 6, 11, 24, 53, 117, 123 and 125), representing 6.5% of the Cut-Off Date Pool Balance (7.3% of the Cut-Off Date Group 1 Balance), permit a partial release of a material portion of the related Mortgaged Property without partial defeasance or prepayment of the related Mortgage Loan; provided that certain DSCR and/or LTV tests are satisfied at the time of the partial release with respect to the remaining portion of the related Mortgaged Property after the partial release.
Substitutions. Certain of the Mortgage Loans permit the related borrowers to substitute Mortgaged Properties of like kind and quality for the properties securing the related Mortgage Loans, upon mortgagee consent and subject to certain conditions, including LTV tests and DSC tests, and, in certain cases, the related Mortgage Loan documents also provide for the delivery of an opinion of counsel that the proposed substitution will not adversely affect the REMIC status of the Trust Fund and written confirmation from the Rating Agencies that any ratings of the Certificates will not, as a result of the proposed substitution, be downgraded, qualified or withdrawn. See ‘‘RISK FACTORS—The Mortgage Loans—Substitution of Mortgaged Properties May Lead to Increased Risks’’ in this prospectus supplement.
Certain State-Specific Considerations
Ten (10) of the Mortgaged Properties, representing, by allocated loan amount, 15.6% of the Cut-Off Date Pool Balance (17.7% of the Cut-Off Date Group 1 Balance) are located in the State of New York. As a result of this concentration, any adverse economic impact on the New York area may have a more pronounced effect on certificateholders as compared with a similar economic impact on other geographical areas.
In addition, laws related to foreclosure may be more or less favorable to lenders depending on the state. New York law requires a mortgagee to elect either a foreclosure action or a personal action against
S-95
the borrower, and to exhaust the security under the mortgage, or exhaust its personal remedies against the borrower, before it may bring the other such action. The practical effect of the election requirement is that mortgagees will usually proceed first against the security rather than bringing personal action against the borrower. Other statutory provisions limit any deficiency judgment against the former borrower following a judicial sale to the excess of the outstanding debt over the fair market value of the property at the time of the public sale. The purpose of these statutes is generally to prevent a mortgagee from obtaining a large deficiency judgment against the former borrower as a result of low bids or the absence of bids at the judicial sale.
Twenty-five (25) of the Mortgaged Properties, representing, by allocated loan amount, 15.1% of the Cut-Off Date Pool Balance (23 Mortgaged Properties in Loan Group 1 or 16.1% of the Cut-Off Date Group 1 Balance and 2 Mortgaged Properties in Loan Group 2 or 7.0% of the Cut-Off Date Group 2 Balance), are located in the state of California. Twenty (20) of these Mortgaged Properties, representing, by allocated loan amount, 13.7% of the Cut-Off Date Pool Balance (18 Mortgaged Properties in Loan Group 1 or 14.6% of the Cut-Off Date Group 1 Balance and 2 Mortgaged Properties in Loan Group 2 or 7.0% of the Cut-Off Date Group 2 Balance), are located in southern California. During the past several years, California’s economy has benefited from a continued rise in residential home prices, increased investment in technology and software equipment and a strong office leasing market. There can be no assurances, however, that such economic growth will continue. Additionally, rising energy prices, increasing consumer debt and decreasing prices of residential homes could slow the growth of the southern California economy. Further, a weakening of the southern California office leasing market in particular, may a dversely affect the related mortgaged properties’ operation and could lessen their market value. Conversely, a strong market could lead to increased building and increased competition for tenants. In either case, there could be an adverse effect on the operation of the Mortgage Loans and consequently the amount and timing of distributions on the certificates.
Assessments of Property Condition
Property Inspections. Generally, the Mortgaged Properties were inspected by or on behalf of the Mortgage Loan Sellers in connection with the origination or acquisition of the related Mortgage Loans to assess their general condition. No inspection revealed any patent structural deficiency or any deferred maintenance considered material and adverse to the value of the Mortgaged Property as security for the related Mortgage Loan, except in such cases where adequate reserves have been established.
Appraisals. All of the Mortgaged Properties were appraised by, a state-certified appraiser or an appraiser belonging to the Appraisal Institute in accordance with the Federal Institutions Reform, Recovery and Enforcement Act of 1989. The primary purpose of each appraisal was to provide an opinion as to the market value of the related Mortgaged Property. There can be no assurance that another appraiser would have arrived at the same opinion of market value. In addition, with respect to 63 Mortgaged Properties securing 18 Mortgage Loans (loan numbers 2.01, 2.02, 2.03, 2.04, 2.05, 2.06, 2.07, 2.08, 2.09, 2.10, 2.11, 2.12, 2.13, 2.14, 2.15, 2.16, 2.17, 2.18, 2.19, 2.20, 2.21, 2.22, 2.23, 2.24, 2.25, 2.26, 2.27, 2.28, 2.29, 2.30, 2.31, 2.32, 2.33, 2.34, 2.35, 2.36, 2.37, 2.38, 2.39, 2.40, 2.41, 2.42, 2.43, 2.44, 2.45, 2.46, 9, 10, 15, 18, 25, 31, 32, 3 6, 46, 49, 53, 55, 59, 63, 82.02, 104 and 113), representing, by allocated loan amount, 21.0% of the Cut-Off Date Pool Balance (58 Mortgaged Properties in Loan Group 1 or 20.7% of the Cut-Off Date Group 1 Balance and 5 Mortgaged Properties in Loan Group 2 or 22.8% of the Cut-Off Date Group 2 Balance), the appraised value represented is the ‘‘as-stabilized’’ value. See also ‘‘RISK FACTORS—The Mortgage Loans—Inspections and Appraisals May Not Accurately Reflect Value or Condition of Mortgaged Property’’ and ‘‘DESCRIPTION OF THE MORTGAGE POOL—Additional Mortgage Loan Information’’ in this prospectus supplement.
Environmental Assessments. A ‘‘Phase I’’ environmental site assessment was performed by independent environmental consultants with respect to each Mortgaged Property in connection with the origination of the related Mortgage Loans. ‘‘Phase I’’ environmental site assessments generally do not include environmental testing. In certain cases, environmental testing, including in some cases a ‘‘Phase II’’ environmental site assessment as recommended by such ‘‘Phase I’’ assessment, was performed. Generally, in each case where environmental assessments recommended corrective action, the originator of the Mortgage Loan determined that the necessary corrective action had been undertaken in a
S-96
satisfactory manner, was being undertaken in a satisfactory manner or that such corrective action would be adequately addressed post-closing. In some instances, the originator required that reserves be established to cover the estimated cost of such remediation or an environmental insurance policy was obtained from a third-party. See also ‘‘RISK FACTORS—The Mortgage Loans—Environmental Laws May Adversely Affect the Value of and Cash Flow from a Mortgaged Property’’ in this prospectus supplement.
Engineering Assessments. In connection with the origination of all of the Mortgage Loans, a licensed engineer or architect inspected the related Mortgaged Property to assess the condition of the structure, exterior walls, roofing, interior structure and mechanical and electrical systems. The resulting reports indicated deferred maintenance items and/or recommended capital improvements on the Mortgaged Properties. Generally, with respect to a majority of Mortgaged Properties, the related borrowers were required to deposit with the mortgagee an amount equal to at least 100% of the licensed engineer’s estimated cost of the recommended repairs, corrections or replacements to assure their completion; provided, however, the mortgagee may waive such required deposits under certain circumstances.
Earthquake Analyses. An architectural and/or engineering consultant performed an analysis on certain Mortgaged Properties located in areas considered to be an earthquake risk, which includes California, in order to evaluate the structural and seismic condition of the property and to assess, based primarily on statistical information, the maximum probable loss for the property in an earthquake scenario. The resulting reports concluded that, in the event of an earthquake, 5 Mortgaged Properties (loan numbers 2.02, 2.05, 2.08, 2.09 and 73) representing, by allocated loan amount, 1.5% of the Cut-Off Date Pool Balance (1.7% of the Cut-Off Date Group 1 Balance) is likely to suffer a probable maximum los s equal to or in excess of 20% of the amount of the estimated replacement cost of the improvements located on the related Mortgaged Property. The related Mortgage Loan Seller obtained earthquake insurance to protect against these risks.
Co-Lender Loans
General
Ten (10) Mortgage Loans (loan number 1, the ‘‘Beacon D.C. & Seattle Pool Loan’’, loan number 2, the ‘‘ING Hospitality Pool Loan’’, loan number 3, the ‘‘DDR Southeast Pool Loan’’, loan number 4, the ‘‘Two Herald Square Loan’’, loan number 8, the ‘‘17 Battery Place South Loan ’’, loan number 10, the ‘‘Centerside II Loan’’, loan number 15, the ‘‘La Jolla Centre I Loan’’, loan number 18, the ‘‘La Jolla Centre II Loan’’, loan number 26, the ‘‘Courtyard by Marriott – Philadelphia, PA Loan’’ and loan number 100, the ‘‘Bunge North America Loan’’ (collectively, the &l squo;‘Co-Lender Loans’’)), are each evidenced by one of two or more notes each secured by a single mortgage and a single assignment of leases and rents. In addition to the Co-Lender Loans, certain other mortgage loans have additional debt. See ‘‘RISK FACTORS—The Mortgage Loans—Additional Debt on Some Mortgage Loans Creates Additional Risks’’ in this prospectus supplement.
The Beacon D.C. & Seattle Pool Loan is part of a split loan structure, which has several companion loans (the ‘‘Beacon D.C. & Seattle Pool Pari Passu Companion Loans’’), in which the Beacon D.C. & Seattle Pool Pari Passu Companion Loans are pari passu in right of entitlement to payment with the Beacon D.C. & Seattle Pool Loan. The Beacon D.C. & Seattle Pool Pari Passu Companion Loans and the Beacon D.C. & Seattle Pool Loan are referred to collectively herein as the ‘‘Beacon D.C. & Seattle Pool Whole Loan’’. One of th e Beacon D.C. & Seattle Pool Companion Loans was included in the trust fund created in connection with the Morgan Stanley 2007-IQ14 transaction. The Beacon D.C. & Seattle Pool Loan has a Cut-Off Date Balance of $414,000,000, representing 10.8% of the Cut-Off Date Pool Balance (12.2% of the Cut-Off Date Group 1 Balance). None of the Beacon D.C. & Seattle Pool Pari Passu Companion Loans will be included in the Trust Fund. See ‘‘Beacon D.C. & Seattle Pool’’ in Annex D to this prospectus supplement.
The ING Hospitality Pool Loan is part of a split loan structure, which has a companion loan (the ‘‘ING Hospitality Pool Pari Passu Companion Loan’’), in which the ING Hospitality Pool Pari Passu
S-97
Companion Loan is pari passu in right of entitlement to payment with the ING Hospitality Pool Loan. The ING Hospitality Pool Pari Passu Companion Loan and the ING Hospitality Pool Loan are referred to collectively herein as the ‘‘ING Hospitality Pool Whole Loan’’. The ING Hospitality Pool Loan has a Cut-Off Date Balance of $283,850,000, representing 7.4% of the Cut-Off Date Pool Balance (8.4% of the Cut-Off Date Group 1 Balance). None of the ING Hospitality Pool Pari Passu Companion Loans will be included in the Trust Fund. See ‘‘ING Hospitality Pool’’ in Annex D to this prospectus supplement.
The DDR Southeast Pool Loan is part of a split loan structure, which has 2 companion loans (the ‘‘DDR Southeast Pool Pari Passu Note A-1 Companion Loan’’ and the ‘‘DDR Southeast Pool Pari Passu Note A-2 Companion Loan’’, and together the ‘‘DDR Southeast Pool Pari Passu Companion Loans’’), in which the DDR Southeast Pool Pari Passu Companion Loans are pari passu in right of entitlement to payment with the DDR Southeast Pool Loan. The DDR Southeast Pool Pari Passu Companion Loans and the DDR Southeast Pool Loan are referred to collectively herein as the ‘‘DDR Southeast Pool Whole Loan’’. The DDR Southeast Pool Loan has a Cut-Off Date Balance of $221,250,000, representing 5.8% of the Cut-Off Date Pool Balance (6.5% of the Cut-Off Date Group 1 Balance). None of the DDR Southeast Pool Pari Passu Companion Loans will be included in the Trust Fund. See ‘‘DDR Southeast Pool’’ in Annex D to this prospectus supplement.
The Centerside II Loan, which has 1 companion loan (the ‘‘Centerside II Subordinate Companion Loan’’), is part of a split loan structure in which the Centerside II Subordinate Companion Loan is subordinate in its right of entitlement to payment to the Centerside II Loan. The Centerside II Loan has a Cut-Off Date Balance of $89,300,000, representing 2.3% of the Cut-Off Date Pool Balance (2.6% of the Cut-Off Date Group 1 Balance). The Centerside II Subordinate Companion Loan will not be included in the Trust Fund. See ‘‘Centerside II’’ in Annex D to this prospectus supplement.
The La Jolla Centre I Loan, which has 1 companion loan (the ‘‘La Jolla Centre I Loan Subordinate Companion Loan’’), is part of a split loan structure in which the La Jolla Centre I Loan Subordinate Companion Loan is subordinate in its right of entitlement to payment to the La Jolla Centre I Loan. The La Jolla Centre I Loan has a Cut-Off Date Balance of $60,000,000, representing 1.6% of the Cut-Off Date Pool Balance (1.8% of the Cut-Off Date Group 1 Balance). The La Jolla Centre I Loan Subordinate Companion Loan will not be included in the Trust Fund. See ‘‘La Jolla Centre I’’ in Annex D to this prospectus supplement.
The La Jolla Centre II Loan, which has 1 companion loan (the ‘‘La Jolla Centre II Loan Subordinate Companion Loan’’), is part of a split loan structure in which the La Jolla Centre II Loan Subordinate Companion Loan is subordinate in its right of entitlement to payment to the La Jolla Centre II Loan. The La Jolla Centre I Loan has a Cut-Off Date Balance of $46,000,000, representing 1.2% of the Cut-Off Date Pool Balance (1.4% of the Cut-Off Date Group 1 Balance). The La Jolla Centre II Loan Subordinate Companion Loan will not be included in the Trust Fund. See ‘‘La Jolla Centre II’’ in Annex D to this prospectus supplement.
The Two Herald Square Loan, which has 1 companion loan (the ‘‘Two Herald Square Subordinate Companion Loan’’), is part of a split loan structure in which the Two Herald Square Subordinate Companion Loan is subordinate in its right of entitlement to payment to the Two Herald Square Loan. The Two Herald Square Loan has a Cut-Off Date Balance of $200,000,000, representing 5.2% of the Cut-Off Date Pool Balance (5.9% of the Cut-Off Date Group 1 Balance). The Two Herald Square Subordinate Companion Loan will not be included in the Trust Fund. See ‘‘Two Herald Square’’ in Annex D to this prospectus supplement.
The 17 Battery Place South Loan, which has 1 companion loan (the ‘‘17 Battery Place South Subordinate Companion Loan’’), is part of a split loan structure in which the 17 Battery Place South Subordinate Companion Loan is subordinate in its right of entitlement to payment to the 17 Battery Place South Loan. The 17 Battery Place South Loan has a Cut-Off Date Balance of $95,000,000, representing 2.5% of the Cut-Off Date Pool Balance (2.8% of the Cut-Off Date Group 1 Balance). The 17 Battery Place South Subordinate Companion Loan will not be included in the Trust Fund. See ‘‘17 Battery Place South’’ in Annex D to this prospectus supplement.
The Courtyard by Marriott – Philadelphia, PA Loan, which has 1 companion loan (the ‘‘Courtyard by Marriott – Philadelphia, PA Subordinate Companion Loan’’), is part of a split loan structure in which
S-98
the Courtyard by Marriott – Philadelphia, PA Subordinate Companion Loan is subordinate in its right of entitlement to payment to the Courtyard by Marriott – Philadelphia, PA Loan. The Courtyard by Marriott – Philadelphia, PA Loan has a Cut-Off Date Balance of $35,000,000, representing 0.9% of the Cut-Off Date Pool Balance (1.0% of the Cut-Off Date Group 1 Balance). The Courtyard by Marriott – Philadelphia, PA Subordinate Companion Loan will not be included in the Trust Fund. See ‘‘Courtyard by Marriott – Philadelphia, PA’’ in Annex D to this prospectus supplement.
The Bunge North America Loan (the ‘‘Caplease Loan’’) is part of a split loan structure that has 2 companion loans (together, the ‘‘Caplease Subordinate Companion Loans’’) that are subordinate in their right of entitlement to payment to the Caplease Loan. Notwithstanding the immediately preceding sentence, the holder of the Caplease Subordinate Companion Loans has agreed to subordinate its interests in certain respects to the Caplease Loan, subject to its prior right to receive proceeds of a claim for accelerated future rent payments payable upon a default under the lease (a ‘‘Defaulted Lease Claim’’). The Caplease Loan has a Cut-Off Date Balance of $6,262,000, representing 0.2% of the Cut-Off Date Pool Balance (0.2% of the Cut-Off Date Group 1 Balance). See ‘‘—The Caplease Loan’’ below. Capital Lease Debt Funding, LP (‘‘Caplease’’) is the holder of the Caplease Subordinate Companion Loans, but may elect to sell the Caplease Subordinate Companion Loan s at any time. See ‘‘RISK FACTORS—The Offered Certificates—Potential Conflicts of Interest’’ in this prospectus supplement. In addition, Wachovia Bank, National Association owns an equity interest in Caplease and provides financing to Caplease secured by, among other things, the Caplease Subordinate Companion Loans.
The Beacon D.C. & Seattle Pool Pari Passu Companion Loans, the ING Hospitality Pool Pari Passu Companion Loan, DDR Southeast Pool Pari Passu Companion Loan, the Centerside II Subordinate Companion Loan, the La Jolla Centre I Subordinate Companion Loan, the La Jolla Centre II Subordinate Companion Loan and the Caplease Subordinate Companion Loans are referred to herein as the ‘‘Companion Loans’’. None of the Companion Loans are included in the Trust Fund.
The Beacon D.C. & Seattle Pool Pari Passu Companion Loans, the ING Hospitality Pool Pari Passu Companion Loan and the DDR Southeast Pool Pari Passu Companion Loan, are referred to herein as the ‘‘Pari Passu Companion Loans’’ and the Beacon D.C. & Seattle Pool Loan, the ING Hospitality Pool Loan and the DDR Southeast Pool Loan are referred to as the ‘‘Pari Passu Loans’’. The Companion Loans, other than the Pari Passu Companion Loans, are collectively referred to herein as the ‘‘Subordinate Companion Loans’’. The Two Herald Square Loan, the 17 Bat tery Place South Loan, the Centerside II Loan, the La Jolla Centre I Loan, the La Jolla Centre II Loan and the Courtyard by Marriott – Philadelphia, PA Loan are referred to as the ‘‘A/B Loans’’. The Caplease Loan, together with its related Caplease Subordinate Companion Loans, is referred to herein as the ‘‘Caplease Whole Loan’’. The Beacon D.C. & Seattle Pool Whole Loan, the ING Hospitality Pool Whole Loan, the DDR Southeast Pool Whole Loan, the Bunge North America Whole Loan, the Courtyard by Marriott – Philadelphia, PA Whole Loan, the Centerside II Whole Loan, the La Jolla Centre I Whole Loan, the La Jolla Centre II Whole Loan, and the Caplease Whole Loans are referred to in this prospectus supplement individually as a ‘‘Whole Loan’’ and, collectively, as the ‘‘Whole Loans’’.
With respect to the Beacon D.C. & Seattle Pool Loan, the terms of the related intercreditor agreement (the ‘‘Beacon D.C. & Seattle Pool Pari Passu Intercreditor Agreement’’), provide that the Beacon D.C. & Seattle Pool Loan and the Beacon D.C. & Seattle Pool Pari Passu Companion Loans are generally of equal priority with each other and no portion of either of the loans will have priority or preference over the other.
With respect to the ING Hospitality Pool Loan, the terms of the related intercreditor agreement (the ‘‘ING Hospitality Pool Intercreditor Agreement’’), provide that the ING Hospitality Pool Loan and the ING Hospitality Pool Pari Passu Companion Loan are of equal priority with each other and no portion of either of the loans will have priority or preference over the other.
With respect to the DDR Southeast Pool Loan, the terms of the related intercreditor agreement (the ‘‘DDR Southeast Pool Intercreditor Agreement’’), provide that the DDR Southeast Pool Loan and the DDR Southeast Pool Pari Passu Companion Loans are of equal priority with each other and no portion of either of the loans will have priority or preference over the other.
S-99
With respect to the Centerside II Loan, the terms of the related intercreditor agreement (the ‘‘Centerside II Intercreditor Agreement’’) provide that the Centerside II Subordinate Companion Loan is subordinate in certain respects to the Centerside II Loan.
With respect to the La Jolla Centre I Loan, the terms of the related intercreditor agreement (the ‘‘La Jolla Centre I Intercreditor Agreement’’) provide that the La Jolla Centre I Subordinate Companion Loan is subordinate in certain respects to the La Jolla Centre I Loan.
With respect to the La Jolla Centre II Loan, the terms of the related intercreditor agreement (the ‘‘La Jolla Centre II Intercreditor Agreement’’) provide that the La Jolla Centre II Subordinate Companion Loan is subordinate in certain respects to the La Jolla Centre II Loan.
With respect to the Caplease Loan, the terms of the related intercreditor agreement (the ‘‘Caplease Intercreditor Agreement’’) provide that the related Caplease Subordinate Companion Loans are subordinate in certain respects to the Caplease Loan.
The Beacon D.C. & Seattle Pool Pari Passu Intercreditor Agreement, the ING Hospitality Pool Pari Passu Intercreditor Agreement, the DDR Southeast Pool Pari Passu Intercreditor Agreement, the Bunge North America Intercreditor Agreement, the Centerside II Intercreditor Agreement, the La Jolla Centre I Intercreditor Agreement, the La Jolla Centre II Intercreditor Agreement, the 2100 Ross Intercreditor Agreement and the Caplease Intercreditor Agreement are individually referred to in this prospectus supplement as an ‘‘Intercreditor Agreement’’ and, collectively, as the ‘‘Intercreditor Agreements’’.
The Courtyard by Marriott - Philadelphia, PA Intercreditor Agreement, the Centerside II Intercreditor Agreement, the La Jolla Centre I Intercreditor Agreement, the La Jolla Centre II Intercreditor Agreement, and the Caplease Intercreditor Agreements are individually referred to in this prospectus supplement as an ‘‘A/B Loan Intercreditor Agreement’’ and, collectively, as the ‘‘A/B Loan Intercreditor Agreements’’.
S-100
The following table presents certain information with respect to the Co-Lender Loans:
| Mortgage Loan | Cut-Off Date Principal Balance of Trust Mortgage Asset | Cut-Off Date Principal Balance of Senior Mortgage Loan(s) | Cut-Off Date Principal Balance of Whole Loan | Whole Loan Underwritten DSCR | Whole Loan Cut-Off Date LTV Ratio | ||||||||||||||||||||||||||||
| Beacon D.C. & Seattle Pool | $ | 414,000,000 | $ | 2,700,000,000 | $ | 2,700,000,000 | 1.27x | 78.7 | % | ||||||||||||||||||||||||
| ING Hospitality Pool(1) | $ | 283,850,000 | $ | 567,700,000 | $ | 567,700,000 | 2.14x | 63.8 | % | ||||||||||||||||||||||||
| DDR Southeast Pool | $ | 221,250,000 | $ | 885,000,000 | $ | 885,000,000 | 1.51x | 63.5 | % | ||||||||||||||||||||||||
| Two Herald Square | $ | 200,000,000 | $ | 200,000,000 | $ | 250,000,000 | 1.00x | 83.3 | % | ||||||||||||||||||||||||
| 17 Battery Place South | $ | 95,000,000 | $ | 95,000,000 | $ | 108,000,000 | 1.36x | 80.0 | % | ||||||||||||||||||||||||
| Centerside II(1) | $ | 89,300,000 | $ | 89,300,000 | $ | 119,300,000 | 1.25x | 75.0 | % | ||||||||||||||||||||||||
| La Jolla Centre I(1) | $ | 60,000,000 | $ | 60,000,000 | $ | 83,000,000 | 1.26x | 73.0 | % | ||||||||||||||||||||||||
| La Jolla Centre II(1) | $ | 46,000,000 | $ | 46,000,000 | $ | 75,000,000 | 1.29x | 74.5 | % | ||||||||||||||||||||||||
| Courtyard by Marriott – Philadelphia, PA | $ | 35,000,000 | $ | 35,000,000 | $ | 43,960,201 | 1.72x | 43.5 | % | ||||||||||||||||||||||||
| Bunge North America | $ | 6,262,000 | $ | 6,262,000 | $ | 8,723,367 | 1.08x | 86.4 | % | ||||||||||||||||||||||||
| (1) | Certain of the Mortgage Loans reflect LTV Ratios that have been calculated on an ‘‘as-stabilized’’ basis, or that have DSC Ratios that have been adjusted to take into account certain cash reserves or letters of credit. See ‘‘Additional Mortgage Loan Information’’ herein. Also, see ‘‘DESCRIPTION OF THE MORTGAGE POOL—Additional Mortgage Loan Information’’ and ‘‘RISK FACTORS—The Mortgage Loans—Risks Relating to Net Cash Flow’’ and ‘‘—Inspections and Appraisals May Not Accurately Reflect Value & Condition of Mortgaged Property’’ in this Prospectus Supplement. |
Certain Information Relating to the A/B Loans
General. Pursuant to the terms of the related A/B Loan Intercreditor Agreements, the A/B Loans will be serviced and administered pursuant to the terms of the Pooling and Servicing Agreement by the Master Servicer and Special Servicer, as applicable, on behalf of the holders of the various notes (as a collective whole). The A/B Loan Intercreditor Agreements generally provide that expenses, losses and shortfalls relating to the A/B Loans will be allocated first, to the holder of the A/B Subordinate Companion Loans and thereafter to the A/B Loans. Prior to a default under the related mortgage loan documents or, in some cases, prior to when the A/B Loan becomes a specially serviced loan as a result of an event of default under the related Mortgage Loan documents, payments received by or on behalf of the related Borrower are generally applied pro rata between the A/B Loan and the related A/B Subordinate Companion Loan(s). During the continuance of an event of default or, in some cases, during the time that an A/B Loan is specially serviced as a result of an event of default under the related Mortgage Loan documents, such payments will be applied first in respect of interest and principal to the A/B Loan until paid in full and then in respect of interest and principal to each related A/B Subordinate Companion Loan until paid in full, and then in respect of certain prepayment fees, extension fees, exit fees and default interest among the A/B Loan and A/B Subordinate Companion Loan, all in accordance with the terms of the related A/B Loan Intercreditor Agreement.
With respect to the A/B Loans, the Master Servicer and Special Servicer will service and administer each of the A/B Loans and the A/B Subordinate Companion Loans pursuant to the Pooling and Servicing Agreement and the A/B Loan Intercreditor Agreements for so long as each A/B Loan is part of the Trust Fund. The holders of the most subordinate A/B Subordinate Companion Loan will be entitled to advise and direct the Master Servicer and/or Special Servicer with respect to certain matters, including, among other things, foreclosure or material modifications of the A/B Loans at such times as such A/B Subordinate Companion Loans are not the subject of an A/B Loan Control Appraisal Period (as defined below).
Control Appraisals. While certain A/B Loans may provide for certain variations, an ‘‘A/B Loan Control Appraisal Period’’ will generally be deemed to have occurred if and so long as (a) the principal balance of an A/B Subordinate Companion Loan minus an amount equal to the excess (if any) of (i)(A) the outstanding principal balance of the related A/B Loan, plus (B) to the extent not previously advanced by the Master Servicer or the Trustee, all accrued and unpaid interest on the related A/B Loan at a per
S-101
annum rate equal to its mortgage interest rate (exclusive, in most cases, of any default interest), plus (C) all unreimbursed Advances and unpaid interest thereon and any unpaid interest on any principal and interest advances with respect to the related A/B Loan, plus (D) all currently due and unpaid real estate taxes and assessments, insurance premiums and, if applicable, ground rents relating to the Mortgaged Property (less, in certain cases, any amounts held in escrow for such items) over (ii) an amount equal to ninety percent (90%) of the value thereof as determined by the most recent appraisal of the Mortgaged Property as required by the related A/B Loan Intercreditor Agreement (net of any liens senior to the lien of the related A/B Loan), is less than or equal to (b) twenty five percent (25%) of the principal balance of such A/B Subordinate Companion Loan. No advice or direction of the holder of an A/B Subordinate Companion Loan may require or cause the Master Servicer or the Special Servicer to violate any provision of the Pooling and Servicing Agreement, including the Master Servicer’s and the Special Servicer’s obligation to act in accordance with the Servicing Standard. See ‘‘SERVICING OF THE MORTGAGE LOANS—The Controlling Class Representative’’ in this prospectus supplement.
Cure and Purchase Rights. In the event of certain defaults under an A/B Loan, the holder of the related A/B Subordinate Companion Loan that is most subordinate will generally be entitled to (i) cure such monetary default within a certain specified time frame, generally between 3 and 7 Business Days of receipt of the cure notice; (ii) cure such non-monetary default within a certain specified time frame, generally between 20 and 30 days of receipt of the cure notice; (iii) purchase such A/B Loan (together with any A/B Subordinate Companion Loan that is senior to it) from the Trust Fund after the expiration of the cure period and/or, (iv) post additional collateral, subject to the conditions contained in the applicable A/B Loan Intercreditor Agreement; provided, further, however, the holder of the related A/B Subordinate Companion Loan is limited with respect to the amount and duration of cures as more particularly described in the applicable A/B Loan Intercreditor Agreement, but that are generally between 3 and 30 days. While certain A/B Loans may provide for certain limited variations, the purchase price will generally equal the unpaid aggregate principal balance of the A/B Loan, together with all unpaid interest thereon at the related mortgage interest rate (including default interest) and any unreimbursed servicing expenses, advances and interest on advances for which the borrower under the A/B Loan is responsible and any other Additional Trust Fund Expenses in respect of the A/B Loan actually paid or incurred by the Trust Fund; provided, however, that the purchase price shall typically not be reduced by any outstanding P&I Advance. No prepayment consideration will typically be payable in connection with such a purchase of an A/B Loan. The holder of the most subordinate A/B Subordinate Companion Loan has the right, at any time and from time to time, to replace the Special Servicer then acting with respect to the related A/B Loan with or without cause and appoint a replacement Special Servicer solely with respect to such A/B Loan.
Consent and Consultation Rights of the Holders of the A/B Subordinate Companion Loans. Prior to a Control Appraisal Period with respect to the A/B Subordinate Companion Loans, the holder of the related A/B Subordinate Companion Loan that is most subordinate is entitled to advise the Special Servicer with respect to the following actions of the Special Servicer, and the Special Servicer is generally not permitted to take any of the following actions as to which the Controlling Class Representative has objected in writing within a certain period of time, generally between 10 to 20 Business Days of being notified thereof (provided that if such written objection has not been received by the Special Service r within that time frame, then the approval will be deemed to have been given):
(i) any actual or proposed foreclosure upon or comparable conversion (which may include acquisitions of an REO Property) of the ownership of properties securing such of the Specially Serviced Mortgage Loans as come into and continue in default;
(ii) any modification or waiver of any term of the related Mortgage Loan documents of a Mortgage Loan that relates to the maturity date, Mortgage Rate, principal balance, amortization term, payment frequency or any provision requiring the payment of a Prepayment Premium or Yield Maintenance Charge (other than a modification consisting of the extension of the maturity date of a Mortgage Loan for one year or less) or a material non-monetary term;
(iii) any actual or proposed sale of an REO Property (other than in connection with the termination of the Trust Fund as described under ‘‘DESCRIPTION OF THE CERTIFICATES—
S-102
Termination’’ in this prospectus supplement or pursuant to a Purchase Option as described below under ‘‘—Defaulted Mortgage Loans; REO Properties; Purchase Option’’);
(iv) any determination to bring an REO Property into compliance with applicable environmental laws or to otherwise address hazardous materials located at an REO Property;
(v) any acceptance of substitute or additional collateral or release of material collateral for a Mortgage Loan unless required by the underlying Mortgage Loan documents;
(vi) any waiver of a ‘‘due-on-sale’’ or ‘‘due-on-encumbrance’’ clause;
(vii) any release of any performance or ‘‘earn-out’’ reserves, escrows or letters of credit;
(viii) any acceptance of an assumption agreement releasing a borrower from liability under a Mortgage Loan (other than in connection with a defeasance permitted under the terms of the applicable Mortgage Loan documents);
(ix) any termination of, or modification of, any applicable franchise agreements related to a Mortgage Loan secured by a hotel;
(x) any termination of the related property manager for Mortgage Loans having an outstanding principal balance of greater than $5,000,000;
(xi) any determination to allow a borrower not to maintain terrorism or, to the extent provided in the Pooling and Servicing Agreement, windstorm insurance;
(xii) any adoption or implementation of a business plan submitted by the borrower with respect to the related Mortgaged Property,
(xiii) the execution or renewal of any lease,
(xiv) the release of any escrow held in conjunction with the Mortgage Loan to the borrower not expressly required by the terms of the Mortgage Loan documents or under applicable law;
(xv) alterations on the related Mortgaged Property if approval by the mortgagee is required by the related Mortgage Loan documents;
(xvi) any modification of, or waiver with respect to, the Mortgage Loan that would result in a discounted pay-off of the Mortgage Loan;
(xvii) any sale of the related Mortgaged Property or any material portion thereof (other than pursuant to a purchase option contained in the related Intercreditor Agreement or in the Pooling and Servicing Agreement) or, except, as specifically permitted in the related Mortgage Loan documents, the transfer of any direct or indirect interest in the borrower or any sale of the Mortgage Loan;
(xviii) any release of the borrower or any guarantor from liability with respect to the Mortgage Loan;
(xix) any material changes to or waivers of any of the insurance requirements under the related Mortgage Loan documents;
(xx) the voting on any plan of reorganization, restructuring or similar plan in the bankruptcy of the borrowers;
(xxi) any modification of, or waiver with respect to, the Mortgage Loan that would result in a discounted pay-off;
(xxii) any foreclosure upon or comparable conversion of the ownership of the Mortgaged Property or any acquisition of the Mortgaged Property by deed-in-lieu of foreclosure;
(xxiii) any incurrence of additional debt by the borrower to the extent such incurrence requires the consent of the mortgagee under the related Mortgage Loan documents;
(xxiv) any substitution of the bank holding the cash management account, unless such bank agrees in writing (x) to comply with the terms of the related Intercreditor Agreement and (y) to provide to the holder of the related Companion Loans copies of any reconciliation required to be prepared thereunder; and
S-103
(xxv) alterations on the Mortgaged Property if approval by the mortgagee is required by the related Mortgage Loan documents.
In addition, the Controlling Class Representative may direct the Special Servicer to take, or to refrain from taking, such other actions as the Controlling Class Representative may deem advisable or as to which provision is otherwise made in the Pooling and Servicing Agreement; provided that no such direction and no objection contemplated by the prior paragraph may (i) require or cause the Special Servicer to violate any REMIC provisions, any provision of the Pooling and Servicing Agreement or applicable law, including the Special Servicer’s obligation to act in accordance with the Servicing Standard, or (ii) expose the Master Servicer, the Special Servicer, the Trust Fund or the Trustee to liability, or materially expand the scope of the Special Servicer’s responsibilities under the Pooling and Servicing Agreement or cause the Special Servicer to act or fail to act in a manner which, in the reasonable judgment of the Special Servicer, is not in the best interests of the Certificateholders. American Capital Strategies, Ltd., an affiliate of the Special Servicer, will be the initial Controlling Class Representative.
The holders of the A/B Subordinate Companion Loans generally also have the right, among other things, to (i) approve the annual operating budget of the related borrower in accordance with the terms of the related Mortgage Loan documents with respect to such A/B Subordinate Companion Loan; and (ii) cause the termination of the property manager with respect to such Mortgaged Property and approve successor managers subject to certain conditions set forth in the related A/B Loan Intercreditor Agreements.
The holders of the A/B Subordinate Companion Loans generally have the right to be notified prior to the commencement of any enforcement action by the mortgagee with respect to the related Mortgaged Property and to cure any default causing such action in accordance with the provisions of the related A/B Loan Intercreditor Agreement.
The Mortgage Loan documents for a A/B Subordinate Companion Loan generally may be amended without the consent of the holder of such A/B Subordinate Companion Loans; except for certain amendments relating to, among other things, the economic terms of the related Mortgage Loan, the cash management provisions and the collateral for the related Mortgage Loan; provided, however, in a work-out context the foregoing consent is generally not required.
The Caplease Loan
Servicing Provisions of the Caplease Intercreditor Agreement. With respect to the Caplease Loan, the Master Servicer and Special Servicer will service and administer the Caplease Loan and its related Caplease Subordinate Companion Loans pursuant to the Pooling and Servicing Agreement and the Caplease Intercreditor Agreement for so long as the Caplease Loan is part of the Trust Fund. The Caplease Loan and its related Caplease Subordinate Companion Loans are cross defaulted. However, upon an event of default which does not constitute a payment default but is limited to a default in the performance by the related borrower of its obligations under its lease, or the failure to reimburse a servicing advance made to fulfill such obligations, the Master Servicer will generally be required to make servicing advances to cure any such borrower default and pr event a default under the lease, subject to customary standards of recoverability, and will be prohibited from foreclosing on the related Mortgaged Property so long as any such advance, together with interest thereon, would be recoverable. Further, the Special Servicer will not be permitted to amend the Caplease Loan or its related Caplease Subordinate Companion Loans in a manner materially adverse to the holders of the related Caplease Subordinate Companion Loans without the consent of the holders of the related Caplease Subordinate Companion Loans. The holders of the related Caplease Subordinate Companion Loans will be entitled to advise the Special Servicer with respect to certain matters related to the Caplease Whole Loan. See ‘‘SERVICING OF THE MORTGAGE LOANS—The Controlling Class Representative’’ in this prospectus supplement.
In the event either the Caplease Loan becomes 90 days or more delinquent, an acceleration of the Caplease Whole Loan after an event of default under the related Mortgage Loan documents occurs, the principal balance of either Caplease Whole Loan is not paid at maturity, or the related borrower files a petition for bankruptcy, the holders of the related Caplease Subordinate Companion Loans will be entitled to purchase the Caplease Loan from the Trust Fund, pursuant to the Caplease Intercreditor
S-104
Agreement, for a purchase price equal to the sum of (i) the principal balance of the Caplease Loan, together with accrued and unpaid interest thereon up to (but not exceeding) the date of purchase, (ii) unreimbursed advances together with accrued and unpaid interest thereon and (iii) certain other amounts payable under the related Mortgage Loan documents.
Applications of Payments. Pursuant to the Caplease Intercreditor Agreement, to the extent described below, the rights of the holders of the related Caplease Subordinate Companion Loans to receive payments with respect to the related Caplease Subordinate Companion Loans (other than payments in respect of Defaulted Lease Claims) are subordinated to the payment rights of the Trust Fund to receive payments with respect to the Caplease Loan. For purposes of this section, the Caplease Subordinate Companion Loans are sometimes referred to herein as the ‘‘Caplease Senior Subordinate Companion Loan’’ and the ‘‘Caplease Junior Subordinate Companion Loan ’’. All payments and proceeds of the Caplease Loan and the related Caplease Subordinate Companion Loans (including, among other things, regular payments, insurance proceeds and liquidation proceeds), other than in respect of Defaulted Lease Claims, whether before or after the occurrence of an event of default with respect to the Caplease Loan, will be applied, in the event of liquidation of the real property, a determination that applicable servicing advances are nonrecoverable, or a lease acceleration or termination, first, to the holder of the Caplease Loan, for reimbursement of servicing advances together with interest thereon and second, to the holders of the related Caplease Subordinate Companion Loans, for reimbursement of servicing advances together with interest thereon. All remaining amounts (or all amounts if no such liquidation, nonrecoverability determination or lease acceleration or termination has occurred), will be paid in the following manner:
First, to the holder of the Caplease Loan, in an amount equal to interest due with respect to the Caplease Loan at the pre-default interest rate thereon;
Second, to the holder of the Caplease Loan, in an amount equal to (i) the portion of any scheduled payments of principal, if any, due with respect to the Caplease Loan, plus, (ii) the pro rata portion (based on the outstanding principal balances of the Caplease Loan and the related Caplease Subordinate Companion Loans) of any unscheduled payments allocable to the Caplease Loan (including, following acceleration, the full principal balance thereof);
Third, if the related borrower is an affiliate of the holder of the related Caplease Senior Subordinate Companion Loan, to the holder of such Caplease Senior Subordinate Companion Loan, the amount of any property advance made by it (including any interest thereon) and outstanding upon final liquidation of the related Mortgage Loan or related Mortgaged Property or upon any earlier determination by the holder of such Caplease Senior Subordinate Companion Loan that such property advance is a nonrecoverable advance as certified by such party;
Fourth, to the holder of the related Caplease Senior Subordinate Companion Loan, in an amount equal to interest due with respect to such Caplease Senior Subordinate Companion Loan at the pre-default interest rate thereon;
Fifth, to the holder of the related Caplease Senior Subordinate Companion Loan, in an amount equal to (i) the portion of any scheduled payments of principal, if any, due with respect to such Caplease Senior Subordinate Companion Loan, plus, (ii) the pro rata portion (based on the outstanding principal balances of the related Caplease Loan and the related Caplease Subordinate Companion Loans) of any unscheduled payments allocable to such Caplease Senior Subordinate Companion Loan (including, following acceleration, the full principal balance thereof);
Sixth, following any lease acceleration or termination, but only prior to any reinstatement of such credit lease following any cure or waiver of the default permitting such lease acceleration or termination, to the holder of the Caplease Loan for any outstanding advances and any other unreimbursed costs made by or on behalf of such holder of the Caplease Loan;
Seventh, to fund any applicable reserves under the terms of the Mortgage Loan documents for the Caplease Whole Loan;
Eighth, if the related borrower is an affiliate of the holder of the related Caplease Junior Subordinate Companion Loan, to the holder of such Caplease Junior Subordinate Companion Loan, the amount of
S-105
any property advance made by it (including any interest thereon) and outstanding upon final liquidation of the related Mortgage Loan or related Mortgaged Property or upon any earlier determination by the holder of such Caplease Junior Subordinate Companion Loan that such property advance is a nonrecoverable advance as certified by such party;
Ninth, to the holder of the Caplease Junior Subordinate Companion Loan, in an amount equal to interest due with respect to such Caplease Junior Subordinate Companion Loan at the pre-default interest rate thereon;
Tenth, to the holder of the related Caplease Junior Subordinate Companion Loan, in an amount equal to (i) the portion of any scheduled payments of principal, if any, due with respect to such Caplease Junior Subordinate Companion Loan, plus, (ii) the pro rata portion (based on the outstanding principal balances of the Caplease Loan and the related Caplease Subordinate Companion Loans) of any unscheduled payments allocable to such Caplease Junior Subordinate Companion Loan (including, following acceleration, the full principal balance thereof);
Eleventh, to reimburse the Master Servicer, Special Servicer or the holders of the related Caplease Subordinate Companion Loans for any outstanding advances made by either such party on the Caplease Loan or such Caplease Subordinate Companion Loans, to the extent then deemed to be nonrecoverable and not previously reimbursed;
Twelfth, to any prepayment premiums or yield maintenance charges (allocated pro rata based on the principal then prepaid);
Thirteenth, to the holder of the Caplease Loan, in an amount equal to the default interest accrued on such Caplease Loan;
Fourteenth, to the holder of the related Caplease Senior Subordinate Companion Loan, in an amount equal to the default interest accrued on such Caplease Senior Subordinate Companion Loan;
Fifteenth, to the holder of the related Caplease Junior Subordinate Companion Loan, in an amount equal to the default interest accrued on such Caplease Junior Subordinate Companion Loan; and
Sixteenth, any remaining amounts to be paid to the related borrower or as otherwise specified in the related Mortgage Loan documents.
Proceeds of Defaulted Lease Claims will generally be applied first, to payment of amounts due under the related Caplease Junior Subordinate Companion Loan, second, to payment of amounts due to the holder of the Caplease Loan, and thereafter, to payment of amounts due under the related Caplease Senior Subordinate Companion Loan.
Application of Amounts Paid to Trust Fund. On or before each Distribution Date, amounts payable to the Trust Fund as holder of any Co-Lender Loan pursuant to the related Intercreditor Agreement will be included in the Available Distribution Amount for such Distribution Date to the extent described in this prospectus supplement and amounts payable to the holders of the related Companion Loans will be distributed to such holders net of fees and expenses on such Companion Loans; and in the case of the Beacon D.C. & Seattle Pool Loan and the DDR Southeast Pool Loan, such amounts will be applied and distributed in accordance with the Morgan Stanley 2007-IQ14 Pooling and Servicing Agreement and the CGCMT 2007-C6 Pooling and Servicing Agreement, respectively.
Mezzanine Loans
With respect to the Mortgage Loans with existing mezzanine debt, the holder of each mezzanine loan generally has the right to purchase the related Mortgage Loan from the Trust Fund if certain defaults on the related Mortgage Loan occur or upon the transfer of the related Mortgage Loan to special servicing as a result of an event of default under the related Mortgage Loan and, in some cases, may have the right to cure certain defaults occurring on the related Mortgage Loan. The purchase price required to be paid in connection with such a purchase is generally equal to the outstanding principal balance of the related Mortgage Loan, together with accrued and unpaid interest on, and all unpaid servicing expenses, advances and interest on advances relating to, such Mortgage Loan. The lenders for this mezzanine debt are
S-106
generally not affiliates of the related Mortgage Loan borrower. Upon a default under the mezzanine debt, the holder of the mezzanine debt may, under certain circumstances, foreclose upon the ownership interests in the related borrower.
Additional Mortgage Loan Information
For a detailed presentation of certain of the characteristics of the Mortgage Loans and the Mortgaged Properties, on an individual basis, see Annexes A-1, A-2, A-3, A-4, A-5 and A-6, Annex B, Annex D and Annex E to this prospectus supplement. For purposes of numerical and statistical information set forth in this prospectus supplement and Annexes A-1, A-2, A-3, A-4, A-5, A-6, Annex B, Annex D and Annex E unless otherwise specified, such numerical and statistical information excludes any Subordinate Companion Loans and assumes that no future Pari Passu Companion Loans are advanced. For purposes of the calculation of the DSC Ratio, the LTV Ratio and Cut-Off Date Balance per Sq. Ft. or room, with respect to the Beacon D.C. & Seattle Pool Loan, the ING Hospitality Pool Loan and the DDR Southeast Pool Loan, such ratios are calculated based upon the aggregate debt service on or aggregate indebtedness of the Beacon D.C. & Seat tle Pool Loan and the Beacon D.C. & Seattle Pool Pari Passu Loans, the ING Hospitality Pool Loan and the ING Hospitality Pool Pari Passu Loan, and the DDR Southeast Pool Loan and the DDR Southeast Pool Pari Passu Loans. Certain of the Mortgage Loans may have previously computed interest on a floating rate basis, but have been converted to a fixed rate prior to the Closing Date. With respect to these Mortgage Loans, all calculations in this prospectus supplement will be computed on the basis of the date any such Mortgage Loan was converted to a fixed rate, rather than the date of origination. Certain additional information regarding the Mortgage Loans is contained under ‘‘—Assignment of the Mortgage Loans; Repurchases and Substitutions’’ and ‘‘—Representations and Warranties; Repurchases and Substitutions,’’ in this prospectus supplement and under ‘‘DESCRIPTION OF THE TRUST FUNDS’’ and ‘‘CERTAIN LEGAL ASPECTS O F MORTGAGE LOANS AND LEASES’’ in the accompanying prospectus.
In the schedule and tables set forth in Annexes A-1, A-2, A-3, A-4, A-5, A-6, Annex B, Annex D and Annex E to this prospectus supplement, cross-collateralized Mortgage Loans are not grouped together; instead, references are made under the heading ‘‘Cross Collateralized and Cross Defaulted Loan Flag’’ with respect to the other Mortgage Loans with which they are cross-collateralized.
Each of the tables herein and in the Annexes sets forth certain characteristics of the Mortgage Pool presented, where applicable, as of the Cut-Off Date. For purposes of the tables and Annexes A-1, A-2, A-3, A-4, A-5, A-6, Annex B, Annex D and Annex E:
(i) References to ‘‘DSC Ratio’’ and ‘‘DSCR’’ are references to debt service coverage ratios. Debt service coverage ratios are used by income property lenders to measure the ratio of (a) cash currently generated by a property that is available for debt service (that is, cash that remains after average cost of non-capital expenses of operation, tenant improvements, leasing commissions, replacement reserves and furniture, fixture and equipment reserves during the term of the Mortgage Loan) to (b) required debt service payments. However, debt service coverage ratios only measure the current, or recent, ability of a property to service mortgage debt. The DSC Rat io for any Mortgage Loan or Pari Passu Loan is the ratio of Net Cash Flow produced by the related Mortgaged Property to the annualized amount of debt service that will be payable under that Mortgage Loan commencing after the origination date. The ‘‘Net Cash Flow’’ for a Mortgaged Property is the ‘‘net cash flow’’ of such Mortgaged Property as set forth in, or determined by the applicable Mortgage Loan Seller on the basis of, Mortgaged Property operating statements, generally unaudited, and certified rent rolls (as applicable) supplied by the related borrower in the case of multifamily, mixed-use, retail, industrial, residential health care, self storage and office properties (each a ‘‘Rental Property’’); provided, however, for purposes of calculating the DSC Ratios provided herein (i) with respect to 33 Mortgage Loans, representing 15.7% of the Cut-Off Date Pool Balance (29 Mortgage Loans in Loan Group 1 or 16.5% of the Cut-Off Date Group 1 Balance and 4 Mortgage Loans in Loan Group 2 or 9.1% of the Cut-Off Date Group 2 Balance) where Periodic Payments are interest-only for a certain amount of time after origination after which date the Mortgage Loan amortizes principal for the remaining term of the loan the debt service used is the annualized amount of debt service that will be payable under the Mortgage Loan commencing after the amortization period begins; (ii) with
S-107
respect to 1 Mortgage Loan (loan number 88), representing 0.2% of the Cut-Off Date Pool Balance (0.3% of the Cut-Off Date Group 1 Balance) such ratio was adjusted by taking into account amounts available under certain letters of credit or cash reserves; (iii) with respect to Mortgage Loans that are interest-only until paid off at maturity, the annual debt service used is based on the outstanding loan amount times the applicable interest rate without regard to interest accrual basis with respect to all Mortgage Loans except those originated by Artesia; and (iv) with respect to 1 Mortgage Loan (loan number 35), representing 0.7% of the Cut-Off Date Pool Balance (0.8% of the Cut-Off Date Group 1 Balance), such ratio was derived by using the average monthly debt service during the period in which amortization is due according to the related payment schedule mortgage, as described in Annex A-6, to this prospectus supplement; provided, further, for purposes of calculating the DSCRs provided herein for each Pari Passu Loan, the debt service on the related Pari Passu Companion Loan will be taken into account, but it will be assumed that no future Pari Passu Companion Loans are advanced. In general, the Mortgage Loan Sellers relied on either full-year operating statements, rolling 12-month operating statements and/or applicable year-to-date financial statements, if available, and on rent rolls for all Rental Properties that were current as of a date not earlier than six months prior to the respective date of origination in determining Net Cash Flow for the Mortgaged Properties.
In the case of the certain Mortgage Loans, with respect to which a portion of the related Mortgaged Property has been leased to an affiliate of the related borrower (or to the related borrower itself), as tenant, but the related Mortgaged Property is not used by such tenant for business operations but instead is master leased in order to increase property net cash flow, the net cash flow for purposes of calculating DSCR includes the rent under such master lease.
In general, ‘‘Net Cash Flow’’ is the revenue derived from the use and operation of a Mortgaged Property less operating expenses (such as utilities, administrative expenses, repairs and maintenance, tenant improvement costs, leasing commissions, management fees and advertising), fixed expenses (such as insurance, real estate taxes and, if applicable, ground lease payments) and replacement reserves and an allowance for vacancies and credit losses. Net Cash Flow does not reflect interest expenses and non-cash items such as depreciation and amortization, and generally does not reflect capital expenditures, but does reflect reserves for replacements and an allowance for vacancies and credit losses. Each originator of commercial mortgage loans has its own underwriting criteria, and no assurance can be given that adjustments or calculations made by one originator would be made by other lenders. See ‘‘RISK FACTORS—The Mortgage L oans—Risks Relating to Net Cash Flow’’ in this prospectus supplement.
In determining the ‘‘revenue’’ component of Net Cash Flow for each Rental Property, the applicable Mortgage Loan Seller generally relied on the most recent rent roll and/or other known, signed tenant leases, executed extension options, master leases or other indications of anticipated income (generally supported by market considerations, cash reserves or letters of credit) supplied and, where the actual vacancy shown thereon and the market vacancy was less than 5.0%, assumed a 5.0% vacancy in determining revenue from rents, except that in the case of certain non-multifamily properties, space occupied by such anchor or single tenants or other large creditworthy tenants may have been disregarded (or a rate of less than 5.0% has been assumed) in performing the vacancy adjustment due to the length of the related leases or creditworthiness of such tenants, in accordance with the respective Mortgage Loan Seller’s underwriting standards. W here the actual or market vacancy was not less than 5.0%, the applicable Mortgage Loan Sellers determined revenue from rents by generally relying on the most recent rent roll and/or other known, signed leases, executed lease extension options, master leases or other indications of anticipated income (generally supported by market considerations, cash reserves or letters of credit) supplied and the greater of (a) actual historical vacancy at the related Mortgaged Property, (b) historical vacancy at comparable properties in the same market as the related Mortgaged Property, and (c) 5.0%. In determining rental revenue for multifamily and self storage properties, the Mortgage Loan Sellers generally either reviewed rental revenue shown on the certified rolling 12-month operating statements, the rolling 3-month operating statements for multifamily properties or annualized the rental revenue and reimbursement of expenses shown on rent rolls or operating statements with respect to the prior one-to-twe lve
S-108
month periods. For the other Rental Properties, the Mortgage Loan Sellers generally annualized rental revenue shown on the most recent certified rent roll (as applicable), after applying the vacancy factor, without further regard to the terms (including expiration dates) of the leases shown thereon. In the case of hospitality properties, gross receipts were generally determined based upon the average occupancy not to exceed 75.0% and daily rates achieved during the prior two-to-three year annual reporting period. In the case of residential health care facilities, receipts were based on historical occupancy levels, historical operating revenues and then current occupancy rates. Occupancy rates for the private health care facilities were generally within then current market ranges, and vacancy levels were generally a minimum of 5.0%. In general, any non-recurring items and non-property related revenue were eliminated from the calculation except in the case of residential health care facilities. Notwithstanding the foregoing, as indicated on Annex A-1, in certain cases, historical income and revenue information was not utilized in determining underwritten Net Cash Flow because such historical information either was not available or was not an accurate reflection of the current status of the related Mortgaged Property as a result of a change in circumstances at the related Mortgaged Property. In those cases, the related Mortgage Loan Seller generally relied on comparative market and sub-market leasing assumptions (including rental rates and vacancy), master leases and other potential revenue generators as well as budget projections provided by the borrower and information contained in the related mortgaged property appraisal in determining Net Cash Flow.
In determining the ‘‘expense’’ component of Net Cash Flow for each Mortgaged Property, the Mortgage Loan Sellers generally relied on rolling 12-month operating statements and/or full-year or year-to-date financial statements supplied by the related borrower, except that (a) if tax or insurance expense information more current than that reflected in the financial statements was available, the newer information was used, (b) property management fees were generally assumed to be 1.0% to 7.0% of effective gross revenue (except with respect to full service hospitality properties, where a minimum of 3.0% of gross receipts was assumed, with respect to limited service hospitality properties, where a minimum of 4.0% of gross receipts was assumed, and with respect to single tenant properties, where fees as low as 1.0% of effective gross receipts were assumed), (c) assumptions were made with respect to reserves for leasing commissions , tenant improvement expenses and capital expenditures and (d) expenses were assumed to include annual replacement reserves. See ‘‘DESCRIPTION OF THE MORTGAGE POOL—The Sponsors—Wachovia’s Underwriting Standards—Escrow Requirements—Replacement Reserves’’ and ‘‘—Artesia’s Underwriting Standards—Escrow Requirements’’ in this prospectus supplement. In addition, in some instances, the Mortgage Loan Sellers recharacterized as capital expenditures those items reported by borrowers as operating expenses (thus increasing ‘‘net cash flow’’) where the Mortgage Loan Sellers determined appropriate.
The borrowers’ financial information used to determine Net Cash Flow was in most cases borrower certified, but unaudited, and neither the Mortgage Loan Sellers nor the Depositor verified their accuracy.
(ii) References to ‘‘Cut-Off Date LTV’’ and ‘‘Cut-Off Date LTV Ratio’’ are references to the ratio, expressed as a percentage, of the Cut-Off Date Balance of a Mortgage Loan (or, in the case of the Beacon D.C. & Seattle Pool Loan, the ING Hospitality Pool Loan, and the DDR Southeast Pool Loan, or the related Whole Loan) to the appraised value of the related Mortgaged Property as shown on the most recent third-party appraisal thereof available to the Mortgage Loan Sellers, which for 63 Mortgaged Properties securing, in whole or in part, 18 Mortgage Loans (loan numbers 2, 9, 10, 15, 18, 25, 31, 32, 36, 46, 49, 53, 55, 59, 63, 82, 104 and 113), representing, by allo cated loan amount, approximately 21.0% of the Cut-Off Date Pool Balance (58 Mortgaged Properties in Loan Group 1 or 20.7% of the Cut-Off Date Group 1 Balance and 5 Mortgaged Properties in Loan Group 2 or 22.8% of the Cut-Off Date Group 2 Balance), the appraised value represented is the ‘‘as-stabilized’’ value. The table below shows the Cut-Off Date LTV Ratios calculated using the ‘‘as-is’’ appraised values and the ‘‘as-stabilized’’ appraised values for the 18 Mortgage Loans:
S-109
| Loan/Property Name | Mortgage Loan Number | “As-Is” Cut-Off Date LTV | “As-Is” Date | “As-Stabilized” Cut-Off Date LTV | As-Stabilized Date | |||||||||||||||||||||||||
| ING Hospitality Pool | 2 | 71.3 | % | Various | 63.8 | % | 5/1/2009 | |||||||||||||||||||||||
| Rockvale Square | 9 | 85.6 | % | 3/7/2007 | 80.0 | % | 3/1/2008 | |||||||||||||||||||||||
| Centerside II | 10 | 63.7 | % | 3/22/2007 | 56.1 | % | 3/1/2010 | |||||||||||||||||||||||
| La Jolla Centre I | 15 | 60.2 | % | 3/19/2007 | 52.8 | % | 3/19/2010 | |||||||||||||||||||||||
| La Jolla Centre II | 18 | 52.0 | % | 3/19/2007 | 45.7 | % | 3/19/2010 | |||||||||||||||||||||||
| Mountain Shadow Apartments | 25 | 85.0 | % | 3/27/2007 | 77.0 | % | 10/1/2008 | |||||||||||||||||||||||
| Summit Trails Apartments | 31 | 85.0 | % | 3/27/2007 | 78.4 | % | 10/1/2008 | |||||||||||||||||||||||
| Wellington Market Place | 32 | 94.3 | % | 2/28/2007 | 78.7 | % | 3/1/2008 | |||||||||||||||||||||||
| Columbus Park Crossing Shopping Center | 36 | 83.6 | % | 4/6/2007 | 79.8 | % | 8/1/2007 | |||||||||||||||||||||||
| Pompano Plaza | 46 | 89.8 | % | 2/27/2007 | 75.4 | % | 2/27/2007 | |||||||||||||||||||||||
| Estancia Apartments | 49 | 85.1 | % | 2/9/2007 | 72.2 | % | 2/9/2009 | |||||||||||||||||||||||
| Mount Pleasant Square | 53 | 82.9 | % | 3/27/2007 | 79.1 | % | 5/1/2008 | |||||||||||||||||||||||
| Lazy Days Marina | 55 | 79.1 | % | 4/1/2007 | 59.4 | % | 4/1/2008 | |||||||||||||||||||||||
| Porto Bella | 59 | 82.2 | % | 3/27/2007 | 80.0 | % | 4/1/2008 | |||||||||||||||||||||||
| Sunset Commons | 63 | 84.3 | % | 3/7/2007 | 77.3 | % | 10/1/2007 | |||||||||||||||||||||||
| Heather Ridge Office Building* | 82.02 | 77.4 | % | 3/22/2007 | 75.5 | % | 3/22/2007 | |||||||||||||||||||||||
| Sunset Ridge Center | 104 | 88.2 | % | 4/12/2007 | 74.1 | % | 9/12/2007 | |||||||||||||||||||||||
| 5724-32 South Blackstone Avenue | 113 | 82.1 | % | 3/9/2007 | 73.0 | % | 3/9/2008 | |||||||||||||||||||||||
| * | Loan-to-value ratios as shown reflect the loan-to-value ratio based on an allocated loan amount for the Mortgage Loan. |
(iii) References to ‘‘Maturity Date LTV Ratio’’ and ‘‘LTV at ARD or Maturity’’ are references to the ratio, expressed as a percentage, of the expected balance of a Balloon Loan (or, in the case of the Beacon D.C. & Seattle Pool Loan, the ING Hospitality Pool Loan and the DDR Southeast Pool Loan, or the related Whole Loan) on its scheduled maturity date (or for an ARD Loan on its Anticipated Repayment Date) (prior to the payment of any Balloon Payment or principal prepayments) to the appraised value of portions of the related Mortgaged Property as shown on the most recent third-party appraisal thereof available to the Mortgage Loan Sellers, which for 63 Mortgaged Properties securing in whole or in part 18 Mortgage Loans (loan numbers 2, 9, 10, 15, 18, 25, 31, 32, 36, 46, 49, 53, 55, 59, 63, 82, 104 and 113), representing, by allocated loan amount, 21.0% of the Cut-Off Date Pool Balance (58 Mortgaged Properties in Loan Group 1 or 20.7% of the Cut-Off Date Group 1 Balance and 5 Mortgaged Properties in Loan Group 2 or 22.8% of the Cut-Off Date Group 2 Balance), the appraised value represented is the ‘‘as-stabilized’’ value.
S-110
The table below shows the Maturity Date LTV Ratios calculated using the ‘‘as-is’’ appraised values and the ‘‘as-stabilized’’ appraised values for the 18 Mortgage Loans:
| Loan/Property Name | Mortgage Loan Number | “As-Is” Maturity Date LTV | “As-Is” Date | “As-Stabilized” Maturity Date LTV | As-Stabilized Date | |||||||||||||||||||||||||
| ING Hospitality Pool | 2 | 71.3 | % | Various | 63.8 | % | 5/1/2009 | |||||||||||||||||||||||
| Rockvale Square | 9 | 85.6 | % | 3/7/2007 | 80.0 | % | 3/1/2008 | |||||||||||||||||||||||
| Centerside II | 10 | 63.7 | % | 3/22/2007 | 56.1 | % | 3/1/2010 | |||||||||||||||||||||||
| La Jolla Centre I | 15 | 60.2 | % | 3/19/2007 | 52.8 | % | 3/19/2010 | |||||||||||||||||||||||
| La Jolla Centre II | 18 | 52.0 | % | 3/19/2007 | 45.7 | % | 3/19/2010 | |||||||||||||||||||||||
| Mountain Shadow Apartments | 25 | 85.0 | % | 3/27/2007 | 77.0 | % | 10/1/2008 | |||||||||||||||||||||||
| Summit Trails Apartments | 31 | 85.0 | % | 3/27/2007 | 78.4 | % | 10/1/2008 | |||||||||||||||||||||||
| Wellington Market Place | 32 | 94.3 | % | 2/28/2007 | 78.7 | % | 3/1/2008 | |||||||||||||||||||||||
| Columbus Park Crossing Shopping Center | 36 | 83.6 | % | 4/6/2007 | 79.8 | % | 8/1/2007 | |||||||||||||||||||||||
| Pompano Plaza | 46 | 89.8 | % | 2/27/2007 | 75.4 | % | 2/27/2007 | |||||||||||||||||||||||
| Estancia Apartments | 49 | 85.1 | % | 2/9/2007 | 72.2 | % | 2/9/2009 | |||||||||||||||||||||||
| Mount Pleasant Square | 53 | 82.9 | % | 3/27/2007 | 79.1 | % | 5/1/2008 | |||||||||||||||||||||||
| Lazy Days Marina | 55 | 76.6 | % | 4/1/2007 | 57.5 | % | 4/1/2008 | |||||||||||||||||||||||
| Porto Bella | 59 | 82.2 | % | 3/27/2007 | 80.0 | % | 4/1/2008 | |||||||||||||||||||||||
| Sunset Commons | 63 | 71.3 | % | 3/7/2007 | 65.3 | % | 10/1/2007 | |||||||||||||||||||||||
| Heather Ridge Office Building* | 82.02 | 65.8 | % | 3/22/2007 | 64.2 | % | 3/22/2007 | |||||||||||||||||||||||
| Sunset Ridge Center | 104 | 88.2 | % | 4/12/2007 | 74.1 | % | 9/12/2007 | |||||||||||||||||||||||
| 5724-32 South Blackstone Avenue | 113 | 82.1 | % | 3/9/2007 | 73.0 | % | 3/9/2008 | |||||||||||||||||||||||
| * | Loan-to-value ratios as shown reflect the loan-to-value ratio based on an allocated loan amount for the Mortgage Loan. |
(iv) References to ‘‘Loan per Sq. Ft., Unit, Pad, Room or Bed’’ are, for each Mortgage Loan secured by a lien on a multifamily property, mobile home park, hospitality property or assisted living facility or other health care property or student housing property, respectively, references to the Cut-Off Date Balance of such Mortgage Loan (or, in the case of the Beacon D.C. & Seattle Pool Loan, the ING Hospitality Pool Loan and the DDR Southeast Pool Loan, or the related Whole Loan) divided by the number of dwelling units, pads, guest rooms or beds, respectively, that the related Mortgaged Property comprises, and, for each Mortgage Loan secured by a lien on a retail, industrial/warehouse, self storage or office property, references to the Cut-Off Date Balance of such Mortgage Loan (or, in the case of the Beacon D.C. & Seattle Pool Loan, the ING Hospitality Pool Loan and the DDR Southeast Pool Loan, or the related Whole Loan) divided by the net rentable square foot area of the related Mortgaged Property.
(v) References to ‘‘Year Built’’ are references to the year that a Mortgaged Property was originally constructed or substantially renovated. With respect to any Mortgaged Property which was constructed in phases, the ‘‘Year Built’’ refers to the year that the first phase was originally constructed.
(vi) References to ‘‘weighted averages’’ or ‘‘WA’’ are references to averages weighted on the basis of the Cut-Off Date Balances of the related Mortgage Loans.
(vii) References to ‘‘Underwritten Replacement Reserves’’ represent estimated annual capital costs, as used by the Mortgage Loan Sellers in determining Net Cash Flow.
(viii) References to ‘‘Administrative Cost Rate’’ for each Mortgage Loan represent the sum of (a) the Master Servicing Fee Rate for such Mortgage Loan and (b) 0.00058%, which percentage represents the Trustee Fee Rate with respect to each Mortgage Loan. The Administrative Cost Rate for each Mortgage Loan is set forth on Annex A-1 hereto.
S-111
(ix) References to ‘‘Remaining Term to Maturity’’ represent, with respect to each Mortgage Loan, the number of months remaining from the Cut-Off Date to the stated maturity date of such Mortgage Loan (or the remaining number of months to the Anticipated Repayment Date with respect to each ARD Loan).
(x) References to ‘‘Remaining Amortization Term’’ represent, with respect to each Mortgage Loan, the number of months remaining from the later of the Cut-Off Date and the end of any interest-only period, if any, to the month in which such Mortgage Loan would fully or substantially amortize in accordance with such loan’s amortization schedule without regard to any Balloon Payment, if any, due on such Mortgage Loan.
(xi) References to ‘‘L ( )’’ or ‘‘Lockout’’ or ‘‘Lockout Period’’ represent, with respect to each Mortgage Loan, the period during which prepayments of principal are prohibited and no substitution of Defeasance Collateral is permitted. The number indicated in the parentheses indicates the number of monthly payments of such period (calculated for each Mortgage Loan from the date of its origination). References to ‘‘O ( )’’ represent the number of monthly payments for which (a) no Prepayment Premium or Yield Maintenance Charge is assessed and (b) defeasance is no longer required. References to ‘‘YM ( )’’ represent the period for which the Yield Maintenance Charge is assessed, ‘‘3% ( )’’, ‘‘2% ( )’’ and ‘‘1% ( )’’ each represents the period for which a Prepayment Premium is assessed and the respective percentage used in the calculation thereof. The periods, if any, between consecutive Due Dates occurring prior to the maturity date or Anticipated Repayment Date, as applicable, of a Mortgage Loan during which the related borrower will have the right to prepay such Mortgage Loan without being required to pay a Prepayment Premium or a Yield Maintenance Charge (each such period, an ‘‘Open Period’’) with respect to all of the Mortgage Loans have been calculated as those Open Periods occurring immediately prior to the maturity date or Anticipated Repayment Date, as applicable, of such Mortgage Loan as set forth in the related Mortgage Loan documents.
(xii) References to ‘‘D ( )’’ or ‘‘Defeasance’’ represent, with respect to each Mortgage Loan, the period (in months) during which the related holder of the Mortgage has the right to require the related borrower, in lieu of a principal prepayment, to pledge to such holder Defeasance Collateral.
(xiii) References to ‘‘Occupancy Percentage’’ are, with respect to any Mortgaged Property, references as of the most recently available rent rolls to (a) in the case of multifamily properties and assisted living facilities, the percentage of units or pads rented, (b) in the case of office and retail properties, the percentage of the net rentable square footage rented and is exclusive of hospitality properties, and (c) in the case of self storage facilities, either the percentage of the net rentable square footage rented or the percentage of units rented (depending on borrower reporting), and is exclusive of hospitality properties. For commercial properties, Occupancy Percentages may include tenants who have signed leases but who are not currently occupying their space.
(xiv) References to ‘‘Original Term to Maturity’’ are references to the term from origination to maturity for each Mortgage Loan (or the term from origination to the Anticipated Repayment Date with respect to each ARD Loan).
(xv) References to ‘‘NA’’ indicate that, with respect to a particular category of data, such data is not applicable.
(xvi) References to ‘‘NAV’’ indicate that, with respect to a particular category of data, such data is not available.
(xvii) References to ‘‘Capital Imp. Reserve’’ are references to funded reserves escrowed for repairs, replacements and corrections of issues outlined in the engineering reports.
(xviii) References to ‘‘Replacement Reserve’’ are references to funded reserves escrowed for ongoing items such as repairs and replacements, including, in the case of hospitality properties, reserves for furniture, fixtures and equipment. In certain cases, however, the subject reserve will be subject to a maximum amount, and once such maximum amount is reached, such reserve will not thereafter be funded, except, in some such cases, to the extent it is drawn upon.
S-112
(xix) References to ‘‘TI/LC Reserve’’ are references to funded reserves escrowed for tenant improvement allowances and leasing commissions. In certain cases, however, the subject reserve will be subject to a maximum amount, and once such maximum amount is reached, such reserve will not thereafter be funded, except, in some such cases, to the extent it is drawn upon.
(xx) References to ‘‘Contract Rent’’ means the total rent that is, or is anticipated to be, specified in the lease or other rental contract as payable by the tenant to the property owner for the rental of a dwelling unit, including fees or charges for management and maintenance services. In determining Contract Rent for each unit, the following rules generally have been applied:
| (a) | The average Contract Rent for each unit type was based upon a rent roll certified by the owner of the property or as completed by the appraiser based upon information provided by the borrower. |
| (b) | Rent concessions were not considered (i.e., Contract Rent was not reduced by any rent concessions). Contract rent also has not been reduced by any policeman’s discount. |
| (c) | Where the tenant pays a portion of the rent and the remainder is paid by a federal, state, or local rental assistance program, the Contract Rent is the amount of the rent payment by the tenant, and the payment from the assistance program has been disregarded. |
| (d) | In computing average Contract Rent for units of each bedroom type, the units described in the following table have been treated as indicated in the table: |
| Unit Type | Included in Computation? | Contract Rent Used in Computation | ||||
| Vacant unit being offered for rent | Yes | Contract Rent being asked for that unit | ||||
| Unit that is vacant because undergoing renovation | No | Not applicable | ||||
| Unit being used as a rental office or model unit | Yes | Not applicable | ||||
| Unit occupied by an employee at a discounted rent | Yes | Contract Rent being asked for comparable units | ||||
| Unit shared by multiple tenants under their own leases (e.g., student housing or seniors housing) | Yes, as a single unit | The aggregate Contract Rent being paid by the tenants sharing the unit |
(xxi) The sum in any column of any of the following tables may not equal the indicated total due to rounding.
Certain other additional characteristics of the Mortgage Loans presented on a loan-by-loan basis are set forth in Annex A-1 to this prospectus supplement. Additionally, certain of the anticipated characteristics of the Mortgage Loans are set forth in Annex B to this prospectus supplement, and certain additional information regarding the Mortgage Loans is set forth in this prospectus supplement below under ‘‘—Wachovia’s Underwriting Standards’’ and ‘‘—Artesia’s Underwriting Standards’’ and ‘‘—Assignment of the Mortgage Loans; Repurchases and Substitutions’’ and in the prospectus under ‘‘DESCRIPTION OF THE TRUST FUNDS—Mortgage Loans—Leases’’ and ‘‘CERTAIN LEGAL ASPECTS OF MORTGAGE LOANS AND LEASES’’. Certain Mortgage Loans, set forth on Annex E, have scheduled principal payments that, assuming no prepayments are made prior to their related maturity dates and the other assumptions set forth under ‘‘YIELD AND MATURITY CONSIDERATIONS—Yield Considerations’’ in this prospectus supplement, are expected to support distributions to the holders of the Class A-1, Class A-2 and Class A-PB Certificates.
S-113
Twenty Largest Mortgage Loans
The following table describes the twenty largest Mortgage Loans or groups of cross-collateralized Mortgage Loans in the Mortgage Pool by Cut-Off Date Balance:
| Loan Name | Mortgage Loan Seller | Number of Mortgage Loans/ Mortgaged Properties | Loan Group | Cut-Off Date Balance | % of Initial Pool Balance | % of Initial Group Balance | Property Type | Cut-Off Date Balance Per SF/ Room(1) | Weighted Average DSCR(1)(2) | Cut-Off Date LTV Ratio(1)(2) | LTV Ratio at Maturity or ARD(1)(2) | Weighted Average Mortgage Rate | |||||||||||||||||||||||||||||||||||||||||||||||||||
| Beacon D.C. & Seattle Pool(3) | Wachovia | 1/ 20 | 1 | $ | 414,000,000 | 10.8 | % | 12.2 | % | Office – Various | $ | 274 | 1.27 | x | 78.7 | % | 78.7 | % | 5.797 | % | |||||||||||||||||||||||||||||||||||||||||||
| ING Hospitality Pool | Wachovia | 1/ 46 | 1 | 283,850,000 | 7.4 | 8.4 | % | Hospitality – Extended Stay | $ | 97,947 | 2.14 | x | 63.8 | % | 63.8 | % | 5.663 | % | |||||||||||||||||||||||||||||||||||||||||||||
| DDR Southeast Pool | Wachovia | 1/ 52 | 1 | 221,250,000 | 5.8 | 6.5 | % | Retail – Anchored | $ | 121 | 1.51 | x | 63.5 | % | 63.5 | % | 5.600 | % | |||||||||||||||||||||||||||||||||||||||||||||
| Two Herald Square | Wachovia | 1/ 1 | 1 | 200,000,000 | 5.2 | 5.9 | % | Mixed Use – Office/Retail | $ | 564 | 1.25 | x | 66.7 | % | 66.7 | % | 5.920 | % | |||||||||||||||||||||||||||||||||||||||||||||
| Westin Casuarina Resort & Spa – Cayman Islands | Wachovia | 1/ 1 | 1 | 140,000,000 | 3.7 | 4.1 | % | Hospitality – Full Service | $ | 408,163 | 1.25 | x | 71.4 | % | 63.2 | % | 6.380 | % | |||||||||||||||||||||||||||||||||||||||||||||
| DDR-TRT Pool | Wachovia | 1/ 3 | 1 | 110,000,000 | 2.9 | 3.3 | % | Retail – Anchored | $ | 162 | 1.50 | x | 67.0 | % | 67.0 | % | 5.510 | % | |||||||||||||||||||||||||||||||||||||||||||||
| Ashford Hospitality Pool 4 | Wachovia | 1/ 5 | 1 | 103,906,000 | 2.7 | 3.1 | % | Hospitality – Various | $ | 74,431 | 1.36 | x | 74.3 | % | 69.4 | % | 5.952 | % | |||||||||||||||||||||||||||||||||||||||||||||
| 17 Battery Place South | Wachovia | 1/ 1 | 1 | 95,000,000 | 2.5 | 2.8 | % | Office – CBD | $ | 230 | 1.54 | x | 70.4 | % | 70.4 | % | 5.681 | % | |||||||||||||||||||||||||||||||||||||||||||||
| Rockvale Square | Wachovia | 1/ 1 | 1 | 92,400,000 | 2.4 | 2.7 | % | Retail – Outlet | $ | 171 | 1.38 | x | 80.0 | % | 80.0 | % | 5.755 | % | |||||||||||||||||||||||||||||||||||||||||||||
| Centerside II | Wachovia | 1/ 1 | 1 | 89,300,000 | 2.3 | 2.6 | % | Office – Suburban | $ | 311 | 1.66 | x | 56.1 | % | 56.1 | % | 5.645 | % | |||||||||||||||||||||||||||||||||||||||||||||
| 10/ 131 | $ | 1,749,706,000 | 45.8 | % | 1.50 | x | 69.9 | % | 68.9 | % | 5.786 | % | |||||||||||||||||||||||||||||||||||||||||||||||||||
| Citadel Mall | Wachovia | 1/ 1 | 1 | $ | 75,040,500 | 2.0 | % | 2.2 | % | Retail – Anchored | $ | 253 | 1.22 | x | 79.8 | % | 66.4 | % | 5.680 | % | |||||||||||||||||||||||||||||||||||||||||||
| Port Chester Shopping Center | Wachovia | 1/ 1 | 1 | 70,000,000 | 1.8 | 2.1 | % | Retail – Anchored | $ | 133 | 2.46 | x | 56.0 | % | 56.0 | % | 5.310 | % | |||||||||||||||||||||||||||||||||||||||||||||
| 60 Madison Avenue | Wachovia | 1/ 1 | 1 | 66,500,000 | 1.7 | 2.0 | % | Office – CBD | $ | 356 | 1.27 | x | 79.2 | % | 79.2 | % | 5.753 | % | |||||||||||||||||||||||||||||||||||||||||||||
| 3600 Wilshire Boulevard | Wachovia | 1/ 1 | 1 | 64,000,000 | 1.7 | 1.9 | % | Office – CBD | $ | 155 | 1.20 | x | 74.7 | % | 74.7 | % | 5.980 | % | |||||||||||||||||||||||||||||||||||||||||||||
| La Jolla Centre I | Wachovia | 1/ 1 | 1 | 60,000,000 | 1.6 | 1.8 | % | Office – Suburban | $ | 363 | 1.74 | x | 52.8 | % | 52.8 | % | 5.645 | % | |||||||||||||||||||||||||||||||||||||||||||||
| 450-460 Park Avenue South | Wachovia | 1/ 1 | 1 | 54,000,000 | 1.4 | 1.6 | % | Office – CBD | $ | 324 | 1.35 | x | 77.1 | % | 77.1 | % | 5.695 | % | |||||||||||||||||||||||||||||||||||||||||||||
| Stadium Crossings | Wachovia | 1/ 1 | 1 | 47,000,000 | 1.2 | 1.4 | % | Mixed Use – Office/Retail | $ | 284 | 1.30 | x | 76.1 | % | 76.1 | % | 5.590 | % | |||||||||||||||||||||||||||||||||||||||||||||
| La Jolla Centre II | Wachovia | 1/ 1 | 1 | 46,000,000 | 1.2 | 1.4 | % | Office – Suburban | $ | 313 | 2.11 | x | 45.7 | % | 45.7 | % | 5.645 | % | |||||||||||||||||||||||||||||||||||||||||||||
| Roosevelt Square | Wachovia | 1/ 1 | 1 | 46,000,000 | 1.2 | 1.4 | % | Retail – Anchored | $ | 149 | 1.20 | x | 78.0 | % | 78.0 | % | 5.550 | % | |||||||||||||||||||||||||||||||||||||||||||||
| Marriott – Mobile, AL | Wachovia | 1/ 1 | 1 | 44,000,000 | 1.2 | 1.3 | % | Hospitality – Full Service | $ | 175,299 | 1.31 | x | 75.2 | % | 65.8 | % | 5.890 | % | |||||||||||||||||||||||||||||||||||||||||||||
| 10/ 10 | $ | 572,540,500 | 15.0 | % | 1.53 | x | 69.6 | % | 67.1 | % | 5.670 | % | |||||||||||||||||||||||||||||||||||||||||||||||||||
| 20/ 141 | $ | 2,322,246,500 | 60.7 | % | 1.50 | x | 69.8 | % | 68.5 | % | 5.757 | % | |||||||||||||||||||||||||||||||||||||||||||||||||||
| (1) | The Beacon D.C. & Seattle Pool Loan, the ING Hospitality Pool Loan and the DDR Southeast Pool Loan are part of split loan structures that include one or more pari passu companion loans that are not included in the trust fund. With respect to each Mortgage Loan, unless otherwise specified, the calculations of LTV Ratios, DSC Ratio and Cut-Off Date Balance per square foot/room are based on the aggregate indebtedness of or debt service on, as applicable, the Mortgage Loan and the related pari passu companion loan, but not any related subordinate companion loan or future pari passu companion loan. |
| (2) | Certain of the Mortgage Loans reflect LTV Ratios that have been calculated on an ‘‘as-stabilized’’ basis, or have DSC Ratios that have been adjusted to take into account certain cash reserves, holdbacks or letters of credit or was calculated based on assumptions regarding the future financial performance of the related Mortgaged Property. See ‘‘Additional Mortgage Loan Information’’ herein. Also, see ‘‘DESCRIPTION OF THE MORTGAGE POOL—Additional Mortgage Loan Information’’ and ‘‘RISK FACTORS—The Mortgage Loans—Risks Relating to Net Cash Flow’’ and ‘‘—Inspections and Appraisals May Not Accurately Reflect Value or Condition of Mortgaged Property’’ in this Prospectus Supplement. |
| (3) | The Beacon D.C. & Seattle Pool Loan includes 17 collateral properties and 3 cash flow assets. Collateral properties consist of office properties. |
Detailed descriptions of loan numbers 1 through 10 and certain additional information with respect to loan numbers 11 through 20 are attached to this prospectus supplement as Annex D. Prospective investors are encouraged to carefully review the entire prospectus supplement, including each attached Annex, which are considered part of this prospectus supplement.
The Sponsors
Wachovia Bank, National Association
General. Wachovia Bank, National Association (‘‘Wachovia’’), a national banking association, is a Sponsor of this securitization, originated or acquired and underwrote 125 Mortgage Loans included in the Trust Fund. Wachovia is a national bank and acquires and originates mortgage loans for its own portfolio
S-114
and for public and private securitizations through its network of 13 regional offices and approximately 3,400 financial centers. Wachovia’s principal offices are located in Charlotte, North Carolina, and its telephone number is (704) 374-6161. Wachovia is also acting as a Mortgage Loan Seller and as the Master Servicer with respect to the Offered Certificates. Wachovia is an affiliate of Wachovia Capital Markets, LLC, one of the Underwriters, and of Wachovia Commercial Mortgage Securities, Inc. (the ‘‘Depositor’’). See ‘‘THE SPONSOR’’ in the accompanying prospectus.
Wachovia’s Securitization Program. One of Wachovia’s primary business lines is the underwriting and origination of mortgage loans secured by commercial or multifamily properties. With respect to mortgage loans that are originated for securitization purposes, Wachovia sells these loans through its CMBS securitization program. Wachovia, with its commercial mortgage lending affiliates and predecessors, began originating and securitizing commercial mortgage loans in 1995. As of October 1, 2006, the total amount of commercial mortgage loans originated and securitized by Wachovia since 1995 is approximately $57.0 billion. Approximately $53.7 billion have been securitized by an affiliate of Wachovia acting as depositor, and approximately $3.9 billion have been securitized by an unaffiliated entity acting as depositor. In i ts fiscal year ended December 31, 2005, Wachovia originated and securitized approximately $16.2 billion of commercial mortgage loans, of which approximately $15.7 billion were securitized by an affiliate of Wachovia acting as depositor, and approximately $500 million were securitized by an unaffiliated entity acting as depositor.
Wachovia and its affiliates have been and are currently involved with the origination and/or securitization of auto loans and leases, student loans, home equity loans, credit card receivables, manufactured housing contracts, commercial equipment leases, residential mortgage loans and commercial mortgage loans, as well as less traditional asset classes. Wachovia and its affiliates have also participated in a variety of collateralized loan obligation transactions, synthetic securitizations and asset-backed commercial paper programs. Wachovia and its affiliates have served as sponsors, issuers, dealers, and servicers in a wide array of securitization transactions. Additionally, Wachovia acts as master servicer, special servicer and/or swap counterparty on various commercial mortgage-backed securitizations.
Wachovia’s commercial mortgage loan securitization program has grown from approximately $423 million of securitized commercial mortgage loans in 1995 to approximately $3.4 billion of securitized commercial mortgage loans in 2001 and to approximately $16.2 billion of securitized commercial mortgage loans in 2005. The commercial mortgage loans originated and securitized by Wachovia include both fixed and floating-rate loans, that generally range in size from $2 million up to $500 million. Wachovia primarily originates loans secured by retail, office, multifamily, hospitality, industrial and self storage properties, but also originates loans secured by manufactured housing communities, land subject to a ground lease and mixed use properties. Wachovia originates loans in each of the 50 states, the District of Columbia, Puerto Rico and the U.S. Virgin Islands.
As a Sponsor, Wachovia originates mortgage loans with the intent to securitize them and, either by itself or together with other sponsors or loan sellers, initiates a securitization by transferring the mortgage loans to a depositor, which in turn transfers them to the issuer for the related securitization. In coordination with Wachovia Capital Markets, LLC and other underwriters, Wachovia works with rating agencies, other loan sellers and servicers in structuring securitization transactions. Wachovia, or an affiliate, acts as sponsor, originator, underwriter or loan seller both in transactions in which it is the sole sponsor and mortgage loan seller as well as in transactions in which other entities act as sponsor and/or mortgage loan seller. Wachovia’s primary securitization program is the Wachovia Bank Commercial Mortgage Trust program, in which Wachovia and other national banks and corporations generally act as mortgage loan sellers and Wachovia Co mmercial Mortgage Securities, Inc., an affiliate of Wachovia, acts as the depositor. As of October 1, 2006, Wachovia securitized approximately $55.3 billion through the Wachovia Bank Commercial Mortgage Trust program (or predecessor programs).
Wachovia’s Underwriting Standards
General. Wachovia’s commercial real estate finance group has the authority, with the approval from the appropriate credit committee, to originate fixed-rate, first lien commercial or multifamily mortgage loans for securitization. Wachovia’s commercial real estate finance operation is staffed by real estate
S-115
professionals. Wachovia’s loan underwriting group is an integral component of the commercial real estate finance group which also includes groups responsible for loan origination and closing mortgage loans.
Upon receipt of a loan application, Wachovia’s loan underwriters commence an extensive review of the borrower’s financial condition and creditworthiness and the real property which will secure the loan.
Notwithstanding the discussion below, given the unique nature of income-producing real properties, the underwriting and origination procedures and the credit analysis with respect to any particular multifamily or commercial mortgage loan may differ significantly from one asset to another, and will be driven by circumstances particular to that property, including, among others, its type, current use, physical quality, size, environmental condition, location, market conditions, capital reserve requirements and additional collateral, tenants and leases, borrower identity, borrower sponsorship and/or performance history, and certain other factors. Consequently, there can be no assurance that the underwriting of any particular multifamily or commercial mortgage loan will conform to the general guidelines described in this ‘‘—Wachovia’s Underwriting Standards’’ section.
Loan Analysis. Generally, Wachovia performs both a credit analysis and collateral analysis with respect to a loan applicant and the real estate that will secure the loan. In general, credit analysis of the borrower and the real estate includes a review of historical financial statements, including rent rolls (generally unaudited), third-party credit reports, judgment, lien, bankruptcy and pending litigation searches and, if applicable, the loan payment history of the borrower. Wachovia typically performs a qualitative analysis which incorporates independent credit checks and published debt and equity information with respect to certain principals of the borrower as well as the borrower itself. Borrowers are generally required to be single-purpose entities although they are generally not required to be structured to limit the possibility of becomin g insolvent or bankrupt. The collateral analysis typically includes an analysis of the historical property operating statements, rent rolls, operating budgets, a projection of future performance, if applicable, and a review of tenant leases. Wachovia generally requires third-party appraisals, as well as environmental and property condition reports and, if determined by Wachovia to be applicable, seismic reports. Each report is reviewed for acceptability by a staff member of Wachovia or a third-party consultant for compliance with program standards. Generally, the results of these reviews are incorporated into the underwriting report. In some instances, one or more provisions of the guidelines were waived or modified by Wachovia where it was determined not to adversely affect the Mortgage Loans originated by it in any material respect.
Loan Approval. Prior to commitment, all mortgage loans to be originated by Wachovia must be approved by one or more—depending on loan size—specified internal committees or by officers of Wachovia, which may approve a mortgage loan as recommended, request additional due diligence, modify the loan terms or decline a loan transaction.
Determination of Revenue and Expense at a Mortgaged Property. The repayment of a Mortgage Loan is typically dependent upon the successful operation of the related Mortgaged Property and the ability of that Mortgaged Property to generate income sufficient to make payments on the loan. Accordingly, Wachovia will analyze whether cash flow expected to be derived from the Mortgaged Property will be sufficient to make the required payments under that Mortgage Loan over its expected term, taking into account, among other things, revenues and expenses for, and other debt currently secured by, or that in the future may be secured by, the Mortgaged Property as well as debt secured by pledges of the ownership interests in the related borrower, any related debt service reserves and other sources of income or payment or factors expected to affect such matters.
Wachovia uses both objective and subjective measures to determine the revenue generated and the expenses incurred at each Mortgaged Property. In determining the ‘‘revenue’’ component of Net Cash Flow for each Mortgaged Property securing a Wachovia Mortgage Loan, Wachovia generally relied on a rent roll and/or other known, signed tenant leases, executed extension options, or other indications of anticipated income (generally supported by market considerations, cash reserves or letters of credit) supplied and, where the actual vacancy shown thereon and the market vacancy was less than 5.0%, assumed a 5.0% vacancy in determining revenue from rents, except that in the case of certain non-multifamily properties, space occupied by such anchor or single tenants or other large creditworthy tenants may have been disregarded (or a rate of less than 5.0% has been assumed) in performing the
S-116
vacancy adjustment due to the length of the related leases or creditworthiness of such tenants. Where the actual or market vacancy was greater than 5.0%, Wachovia determined revenue from rents by generally relying on a rent roll and/or other known, signed leases, executed lease extension options, or other indications of anticipated income (generally supported by market considerations, cash reserves or letters of credit) supplied and the greater of (a) actual historical vacancy at the related Mortgaged Property, (b) historical vacancy at comparable properties in the same market as the related Mortgaged Property, and (c) 5.0%. In determining revenue for multifamily and self storage properties, the Mortgage Loan Sellers generally either reviewed rental revenue shown on the rolling 3-month operating statements for multifamily properties or annualized the rental revenue and reimbursement of expenses shown on rent rolls or operating statements with respect to the prior one-to-twelve month periods. I n the case of hospitality properties, gross receipts were generally determined based upon the average occupancy not to exceed 85.0% and daily rates achieved during the prior one-to-three year annual reporting period. In the case of residential health care facilities, receipts were based on historical occupancy levels, historical operating revenues and then current occupancy rates. Occupancy rates for the private health care facilities were generally within then current market ranges, and vacancy levels were generally a minimum of 5.0%. The borrowers’ financial information used to determine revenue was in most cases borrower certified, but unaudited, and neither the Mortgage Loan Sellers nor the Depositor verified their accuracy. In general, any non-recurring items and non-property related revenue were eliminated from the calculation except in the case of residential health care facilities.
In determining the ‘‘expense’’ component of Net Cash Flow for each Mortgaged Property securing a Wachovia Mortgage Loan, Wachovia generally relied on rolling 12-month operating statements and/or full-year or year-to-date financial statements supplied by the related borrower, except that (a) if tax or insurance expense information more current than that reflected in the financial statements was available, the newer information was used, (b) property management fees were generally assumed to be 1.0% to 7.0% of effective gross revenue, (c) assumptions were made with respect to reserves for leasing commissions, tenant improvement expenses and capital expenditures and (d) expenses were assumed to include annual replacement reserves. In addition, in some instances, Wachovia recharacterized as capital expenditures those items reported by borrowers as operating expenses (thus increasing ‘‘net cash flow’&rsquo ;) where Wachovia determined appropriate.
The amounts described as revenue and expense in the two preceding paragraphs are often highly subjective values. For example, when calculating revenue or expense for a Mortgaged Property securing a Wachovia Mortgage Loan. Wachovia may make assumptions regarding projected rental income, expenses and/or occupancy, including, without limitation, one or more of the following:
| • | the assumption that a particular tenant at a Mortgaged Property has executed a lease, but has not yet taken occupancy and/or has not yet commenced paying rent, will take occupancy and commence paying rent on a future date; |
| • | the assumption that an unexecuted lease that is currently being negotiated with respect to a particular tenant at a Mortgaged Property or is out for signature will be executed and in place on a future date; |
| • | the assumption that a portion of currently vacant and unleased space at a Mortgaged Property will be leased at current market rates and consistent with occupancy rates of comparable properties in the subject market; |
| • | the assumption that certain rental income that is to be payable commencing on a future date under a signed lease, but where the subject tenant is in an initial rent abatement or free rent period or has not yet taken occupancy, will be paid commencing on such future date; |
| • | assumptions regarding the probability of renewal or extension of particular leases and/or the re-leasing of certain space at a Mortgaged Property and the anticipated effect on capital and re-leasing expenditures; |
| • | assumptions regarding the costs and expenses, including leasing commissions and tenant improvements, associated with leasing vacant space or releasing occupied space at a future date; |
| • | assumptions regarding future increases or decreases in expenses, or whether certain expenses are capital expenses or should be treated as expenses which are not recurring; and |
S-117
| • | various additional lease-up assumptions and other assumptions regarding the payment of rent not currently being paid. |
There is no assurance that the foregoing assumptions made with respect to any prospective multifamily or commercial mortgage loan will, in fact, be consistent with actual property performance. Accordingly, based on such subjective assumptions and analysis, there can be no assurance that the underwriting analysis of any particular Wachovia Mortgage Loan will conform to the foregoing descriptions in every respect or to any similar analysis which may be performed by other persons or entities.
DSC Ratios and LTV Ratios. Generally, the DSC Ratios for Wachovia Mortgage Loans will be equal to or greater than 1.20x; provided, however, exceptions may be made when consideration is given to circumstances particular to the Mortgage Loan, the related Mortgaged Property, LTV Ratio, reserves or other factors. For example, Wachovia may originate a Mortgage Loan with a DSC Ratio below 1.20x based on, among other things, the amortization features of the Mortgage Loan (for example, if the Mortgage Loan provides for relatively rapid amortization) the type of ten ants and leases at the Mortgaged Property, the taking of additional collateral such as reserves, letters of credit and/or guarantees, Wachovia’s judgment of improved property and/or market performance in the future and/or other relevant factors.
Generally, the LTV Ratio for Wachovia Mortgage Loans will be equal to or less than 80%; provided, however, exceptions may be made when consideration is given to circumstances particular to the Mortgage Loan, the related Mortgaged Property, debt service coverage, reserves or other factors. For example, Wachovia may originate a Mortgage Loan with an LTV Ratio above 80% based on, among other things, the amortization features of the mortgage loan (for example, if the mortgage loan provides for relatively rapid amortization), the type of tenants and leases at the related Mortgaged Property, the taking of additional collateral such as reserves, letters of credit and/or guarante es. Wachovia’s judgment of improved property and/or performance in the future and/or other relevant factors.
While the foregoing discussion generally reflects how calculations of DSC Ratios and LTV Ratios are made, it does not necessarily reflect the specific calculations made to determine the DSC Ratio and the LTV Ratio disclosed in this prospectus supplement. For specific details on the calculations of the DSC Ratio and the LTV Ratio, see ‘‘DESCRIPTION OF THE MORTGAGE POOL—Additional Mortgage Loan Information’’ and ‘‘RISK FACTORS—The Mortgage Loans—Risks Related to Property Inspections and Certain Assumptions in Appraisals’’ in this prospectus supplement.
Additional Debt. When underwriting a multifamily or commercial mortgage loan. Wachovia will take into account whether the mortgaged property and/or direct or indirect interest in a related borrower are encumbered by additional debt and will analyze the likely effect of that additional debt on repayment of the subject mortgage loan. It is possible that Wachovia or an affiliate will be the lender on that additional debt, and may either sell such debt to an unaffiliated third party or hold it in inventory.
The DSC Ratios and LTV Ratios described above under ‘‘DESCRIPTION OF THE MORTGAGE POOL—The Sponsor—Wachovia’s Underwriting Standards—DSC Ratios and LTV Ratios’’ may be significantly below 1.20x and significantly above 80%, respectively, when calculated taking into account the existence of additional debt secured by the related real property collateral or directly or indirectly by equity interests in the related borrower.
Assessments of Property Condition. As part of the underwriting process, Wachovia will analyze the condition of the real property collateral for a prospective multifamily or commercial mortgage loan. To aid in that analysis, Wachovia may, subject to certain exceptions, inspect or retain a third party to inspect the property and will in most cases obtain the property assessments and reports described below.
Appraisals. Wachovia will, in most cases, require that the real property collateral for a prospective multifamily or commercial mortgage loan be appraised by a state certified appraiser, an appraiser belonging to the Appraisal Institute, a membership association of professional real estate appraisers, or an otherwise qualified appraiser. In addition, Wachovia will generally require that those appraisals be conducted in accordance with the Uniform Standards of Professional Appraisal Practices developed by The Appraisal Foundation, a not-for-profit organization established by the appraisal profession.
S-118
Furthermore, the appraisal report will usually include or be accompanied by a separate letter that includes a statement by the appraiser that the guidelines in Title XI of the Financial Institutions Reform, Recovery and Enforcement Act of 1989 were followed in preparing the appraisal. In some cases, however, Wachovia may establish the value of the subject real property collateral based on a cash flow analysis, a recent sales price or another method or benchmark of valuation.
Environmental Assessment. Wachovia may require a Phase I environmental assessment with respect to the real property collateral for a prospective multifamily or commercial mortgage loan. However, when circumstances warrant, Wachovia may utilize an update of a prior environmental assessment, a transaction screen or a desktop review. Alternatively, Wachovia might forego an environmental assessment in limited circumstances, such as when it has obtained the benefits of an environmental insurance policy or an environmental guarantee. Furthermore, an environmental assessment conducted at any particular real property collateral will not necessarily cover all potential environmental issues. For example, an analysis for radon, lead-based paint and lead in drinking water will usually be conducted only at multifamily rental properties and only when Wacho via or the environmental consultant believes that special circumstances warrant such an analysis.
Depending on the findings of the initial environmental assessment, Wachovia may require additional record searches or environmental testing, such as a Phase II environmental assessment with respect to the real property collateral.
Engineering Assessment. In connection with the origination process, Wachovia may require that an engineering firm inspect the real property collateral for any prospective multifamily or commercial mortgage loan to assess the structure, exterior walls, roofing, interior structure and/or mechanical and electrical systems. Based on the resulting report, Wachovia will determine the appropriate response, if any, to any recommended repairs, corrections or replacements and any identified deferred maintenance.
Seismic Report. If the subject real property collateral consists of improvements located in California or in seismic zones 3 or 4, Wachovia may require a report to establish the probable maximum or bounded loss for the improvements at the property as a result of an earthquake. If that loss is in excess of 20% of the estimated replacement cost for the improvements at the property. Wachovia may require retrofitting of the improvements or that the borrower obtain earthquake insurance if available at a commercially reasonable price. It should be noted, however, that because the seismic assessments may not necessarily have used the same assumptions in assessing probable maximum loss, it is possible that some of the real properties that were considered unlikely to experience a probable maximum loss in excess of 20% of estimated replacement cost might ha ve been the subject of a higher estimate had different assumptions been used.
Zoning and Building Code Compliance. In connection with the origination of a multifamily or commercial mortgage loan, Wachovia will generally consider whether the use and occupancy of the related real property collateral is in material compliance with zoning, land-use, building rules, regulations and orders then applicable to that property. Evidence of this compliance may be in the form of one or more of the following: legal opinions; surveys; recorded documents; temporary or permanent certificates of occupancy; letters from government officials or agencies; title insurance endorsements; engineering or consulting reports; and/or representations by the related borrower.
Where a property as currently operated is a permitted nonconforming use and/or structure and the improvements may not be rebuilt to the same dimensions or used in the same manner in the event of a major casualty, Wachovia will consider whether—
| • | any major casualty that would prevent rebuilding has a sufficiently remote likelihood of occurring; |
| • | casualty insurance proceeds together with the value of any additional collateral would be available in an amount estimated by Wachovia to be sufficient to pay off the related mortgage loan in full; |
| • | the real property collateral, if permitted to be repaired or restored in conformity with current law, would in Wachovia’s judgment constitute adequate security for the related mortgage loan; |
S-119
| • | a variance or other similar change in applicable zoning restrictions is potentially available, or whether the applicable governing entity is likely to enforce the related limitations; and/or |
| • | to require the related borrower to obtain law and ordinance insurance. |
While the foregoing discussion generally reflects how calculations of DSC Ratios are made, it does not necessarily reflect the specific calculations made to determine the DSC Ratio disclosed in this prospectus supplement. For specific details on the calculations of DSC Ratio in this prospectus supplement, see ‘‘DESCRIPTION OF THE MORTGAGE POOL—Additional Mortgage Loan Information’’ in this prospectus supplement.
Escrow Requirements. Generally, Wachovia requires most borrowers to fund various escrows for taxes and insurance, capital expenses and replacement reserves. Generally, the required escrows for mortgage loans originated by Wachovia are as follows:
| • | Taxes—Typically an initial deposit and monthly escrow deposits equal to 1/12th of the annual property taxes (based on the most recent property assessment and the current millage rate) are required to provide Wachovia with sufficient funds to satisfy all taxes and assessments. Wachovia may waive this escrow requirement under certain circumstances. |
| • | Insurance—If the property is insured under an individual policy (i.e., the property is not covered by a blanket policy), typically an initial deposit and monthly escrow deposits equal to 1/12th of the annual property insurance premium are required to provide Wachovia with sufficient funds to pay all insurance premiums. Wachovia may waive this escrow requirement under certain circumstances. |
| • | Replacement Reserves—Replacement reserves are generally calculated in accordance with the expected useful life of the components of the property during the term of the mortgage loan. Wachovia may waive this escrow requirement under certain circumstances. |
| • | Completion Repair/Environmental Remediation—Typically, a completion repair or remediation reserve is required where an environmental or engineering report suggests that such reserve is necessary. Upon funding of the applicable Mortgage Loan, Wachovia generally requires that at least 110% of the estimated costs of repairs or replacements be reserved and generally requires that repairs or replacements be completed within a year after the funding of the applicable Mortgage Loan. Wachovia may waive this escrow requirement under certain circumstances. |
| • | Tenant Improvement/Lease Commissions—In most cases, various tenants have lease expirations within the Wachovia Mortgage Loan term. To mitigate this risk, special reserves may be required to be funded either at closing, of the Wachovia Mortgage Loan and/or during the related Mortgage Loan term to cover certain anticipated leasing commissions or tenant improvement costs which might be associated with re-leasing the space occupied by such tenants. |
Furthermore, Wachovia may accept an alternative to a cash escrow or reserve from a borrower, such as a letter of credit or a guarantee from the borrower or an affiliate of the borrower or periodic evidence that the items for which the escrow or reserve would have been established are being paid or addressed. In some cases, Wachovia may determine that establishing an escrow or reserve is not warranted given the amounts that would be involved and Wachovia’s evaluation of the ability of the Mortgaged Property, the borrower or a holder of direct or indirect ownership interests in the borrower to bear the subject expense or cost absent creation of an escrow or reserve.
Artesia Mortgage Capital Corporation
General Character of Artesia Mortgage Capital Corporation’s Business. Artesia Mortgage Capital Corporation (‘‘Artesia’’) is a Delaware Corporation, with its principal offices in Issaquah, Washington. Artesia is a Sponsor of this securitization and acquired or originated and underwrote 17 Mortgage Loans included in the Trust Fund. Artesia is a wholly owned non-bank U.S. subsidiary of Dexia Bank. Dexia Bank, which is rated ‘‘AA+’’ by Fitch, ‘‘AA’’ by S&P and ‘‘Aa2’’ by Moody’s, is part of Dexia Group, a diversified financial services firm located in Brussels, Belgium with a balance sheet of 567 billion Euros ($748 bi llion) and a stock market capitalization of approximately 24 billion Euros ($32 billion) as of December 2006.
S-120
Artesia originates commercial and multifamily mortgage loans for the purpose of securitizing them in CMBS transactions.
Artesia also engages in the origination, and/or buying and selling, of mortgages and other interests in mortgage loans for investment purposes.
Artesia’s Securitization Program. Artesia, directly or through correspondents, originates multifamily and commercial mortgage loans throughout the United States. Artesia has been engaged in the origination of multifamily and commercial mortgage loans for securitization since 1996. The multifamily and commercial mortgage loans originated and securitized by Artesia include both fixed-rate loans and floating-rate loans and both conduit balance loans—which are average-sized loans by industry standards —and large balance loans. Most of the multifamily and commercial mortgage loans included in commercial mortgage securitizations by Artesia have been originated, directly or through correspondents, by Artesia. During the fiscal years 2001 through 2006, the aggregate annual principal balance of commercial mortgage loans securitized by Art esia ranged from approximately $412.6 million in 2001, to approximately $610.1 million in 2003, to approximately $1.5 billion in 2005, and to approximately $2.0 billion in 2006.
When originating mortgage loans in conjunction with third-party correspondents, Artesia performs the underwriting based on its underwriting criteria (see ‘‘—Artesia’s Underwriting Standards’’ below) and originates the subject mortgage loan on a specified closing date prior to inclusion in the subject securitization.
In addition, in the normal course of its securitization program, Artesia may also acquire multifamily and commercial mortgage loans from various third party originators. These mortgage loans may have been originated using underwriting guidelines not established by Artesia.
In connection with the commercial mortgage securitization transactions it is involved in, Artesia generally transfers the subject mortgage assets to a depositor, who then transfers those mortgage assets to the issuing entity for the related securitization. In return for the transfer of the subject mortgage assets by the depositor to the issuing entity, the issuing entity issues commercial mortgage pass-through certificates backed by, and supported by the cash flows generated by, those mortgage assets.
Artesia also works, with respect to the mortgage loans it has originated, with rating agencies, unaffiliated sponsors, originators and servicers in putting together the securitization transaction. Artesia will generally act as a sponsor or originator in the commercial mortgage securitization transactions to which it contributes mortgage loans. Artesia does not act as servicer of the multifamily and commercial mortgage loans in the commercial mortgage securitizations it is involved in. Instead, Artesia and/or the related depositor contract with other entities to service the multifamily and commercial mortgage loans following their transfer into a trust fund for a series of securities.
Artesia may be obligated, specifically with respect to the mortgage loans that it is contributing, generally pursuant to a mortgage loan purchase agreement or other comparable agreement, to:
| • | deliver various specified loan documents; |
| • | file and/or record various specified loan documents and assignments of those documents; and |
| • | make various loan-specific representations and warranties. |
If it is later determined that any mortgage asset contributed by Artesia fails to conform to the specified representations and warranties or there is a defect in or an omission with respect to certain specified mortgage loan documents related to that mortgage asset, which breach, defect or omission, as the case may be, is determined to have a material adverse effect on the value of the subject mortgage asset and/or the interests of holders of securities issued in connection with the subject commercial mortgage securitization transaction, then Artesia will generally have an obligation to cure the subject defect, omission or breach or to repurchase or replace the subject mortgage asset.
Artesia’s Underwriting Standards
General. Set forth below is a discussion of certain general underwriting guidelines of Artesia with respect to multifamily and commercial mortgage loans originated by Artesia. The underwriting guidelines
S-121
described below may not—and generally will not—apply to multifamily and commercial mortgage loans acquired by Artesia from third-party originators.
Notwithstanding the discussion below, given the unique nature of income-producing real properties, the underwriting and origination procedures and the credit analysis with respect to any particular multifamily or commercial mortgage loan may differ significantly from one asset to another, and will be driven by circumstances particular to that property, including, among others, its type, current use, physical quality, size, environmental condition, location, market conditions, capital reserve requirements and additional collateral, tenants and leases, borrower identity, borrower sponsorship and/or performance history. Consequently, there can be no assurance that the underwriting of any particular multifamily or commercial mortgage loan will conform to the general guidelines described in this ‘‘—Artesia’s Underwriting Standards’’ section.
Loan Analysis. Artesia performs both a credit analysis and a collateral analysis with respect to each multifamily and commercial mortgage loan it originates. The credit analysis of the borrower may include a review of third-party credit reports, reports resulting from judgment, lien, bankruptcy and pending litigation searches and, if applicable, the loan payment history of the borrower and its principals. Generally, borrowers are required to be single-purpose entities, although exceptions may be made from time to time on a case-by-case basis. The collateral analysis includes an analysis, in each case to the extent available, of historical property operating statements, rent rolls and a projection of future performance and a review of tenant leases. Depending on the type of real property involved and other relevant circumstances, Artesia’s un derwriting staff, third party reviewers, and/or legal counsel will review leases of significant tenants. Artesia may also perform a limited qualitative review with respect to certain tenants located at the subject property, particularly significant tenants, credit tenants and sole tenants. Artesia generally requires third-party appraisals, as well as environmental reports, building condition reports and, if applicable, seismic reports. Each report is reviewed for acceptability by an Artesia staff member or a third-party reviewer. The results of these reviews are incorporated into the underwriting report.
Loan Approval. Prior to commitment, all multifamily and commercial mortgage loans to be originated by Artesia must be approved by one or more—depending on loan size—specified credit committees of Artesia or Dexia Bank. The credit committee(s) responsible for loan approval may approve a mortgage loan as recommended, request additional due diligence, modify the loan terms or decline a loan transaction.
Debt Service Coverage Ratio. The repayment of a multifamily or commercial mortgage loan is typically dependent upon the successful operation of the related mortgaged property and the ability of that property to generate income sufficient to make payments on the loan. Accordingly, in connection with the origination of any multifamily or commercial mortgage loan. Artesia will analyze whether cash flow expected to be derived from the subject mortgaged property will be sufficient to make the required payments under that mortgage loan, taking into account, among other things, revenues and expenses for, and other debt currently secured by, or that in the future may be secured by, the subject mortgaged property as well as debt secured by pledges of the ownership interests in the related borrower.
The debt service coverage ratio of a multifamily or commercial mortgage loan is an important measure of the likelihood of default on the loan. In general, the debt service coverage ratio of a multifamily or commercial mortgage loan at any given time is the ratio of—
| • | the amount of income, net of operating expenses, capital expenditures and other amounts required to be reserved for various purposes, derived or expected to be derived from the related mortgaged property for a given period that is available to pay debt service on the subject mortgage loan, to |
| • | the scheduled payments of principal and/or interest during that given period on the subject mortgage loan and any other loans that are secured by liens of senior or equal priority on the related mortgaged property. |
However, the amount described in the first bullet of the preceding sentence is often a highly subjective number based on variety of assumptions regarding, and adjustments to, revenues and expenses with respect to the related mortgaged property.
S-122
For example, when calculating the debt service coverage ratio for a multifamily or commercial mortgage loan, Artesia may utilize annual net cash flow that was calculated based on assumptions regarding projected rental income, expenses and/or occupancy, including, without limitation, one or more of the following:
| • | the assumption that a particular tenant at the subject mortgaged property that has executed a lease, but has not yet taken occupancy and/or has not yet commenced paying rent, will take occupancy and commence paying rent on a future date; |
| • | the assumption that an unexecuted lease that is currently being negotiated with respect to a particular tenant at the subject mortgaged property or is out for signature will be executed and in place on a future date; |
| • | the assumption that a portion of currently vacant and unleased space at the subject mortgaged property will be leased at current market rates and consistent with occupancy rates of comparable properties in the subject market; |
| • | the assumption that certain rental income that is to be payable commencing on a future date under a signed lease, but where the subject tenant is in an initial rent abatement or free rent period or has not yet taken occupancy, will be paid commencing on such future date; |
| • | assumptions regarding the probability of renewal of particular leases and/or the re-leasing of certain space at the subject mortgaged property and the anticipated effect on capital and re-leasing expenditures; and |
| • | various additional lease-up assumptions and other assumptions regarding the payment of rent not currently being paid. |
There is no assurance that the foregoing assumptions made with respect to any prospective multifamily or commercial mortgage loan will, in fact, be consistent with actual property performance.
Generally, the debt service coverage ratio for multifamily and commercial mortgage loans originated by Artesia, calculated as described above, will be equal to or greater than 1.20x (subject to the discussion under ‘‘—Additional Debt’’ below); however, exceptions may be made when consideration is given to circumstances particular to the mortgage loan or the related mortgaged property. For example, Artesia may originate a multifamily or commercial mortgage loan with a debt service coverage ratio below 1.20x based on, among other things, the amortization features of the mortgage loan (for example, if the mortgage loan provides for relatively rapid amortization), the type of tenants and leases at the subject mortgaged property, the taking of additional collateral such as reserves, letters of credit and/or guarantees, Artesia’s judgment of improved property performance in the future and/or other relevant factors.
While the foregoing discussion generally reflects how calculations of debt service coverage ratios are made, it does not necessarily reflect the specific calculations made to determine the DSC Ratios disclosed in this prospectus supplement. For specific information regarding the details on the calculations of DSC Ratios in this prospectus supplement, see ‘‘DESCRIPTION OF THE MORTGAGE POOL—Additional Mortgage Loan Information’’.
Loan-to-Value Ratio. Artesia also looks at the loan-to-value ratio of a prospective multifamily or commercial mortgage loan as one of the factors it takes into consideration in evaluating the likelihood of recovery if a property is liquidated following a default. In general, the loan-to-value ratio of a multifamily or commercial mortgage loan at any given time is the ratio, expressed as a percentage, of—
| • | the then outstanding principal balance of the subject mortgage loan and any other loans that are secured by liens of senior or equal priority on the related mortgaged property, to |
| • | the estimated value of the related mortgaged property based on an appraisal, a cash flow analysis, a recent sales price or another method or benchmark of valuation. |
Generally, the loan-to-value ratio for multifamily and commercial mortgage loans originated by Artesia, calculated as described above, will be equal to or less than 80% (subject to the discussion under
S-123
‘‘—Additional Debt’’ below); however, exceptions may be made when consideration is given to circumstances particular to the mortgage loan or the related mortgaged property. For example, Artesia may originate a multifamily or commercial mortgage loan with a loan-to-value ratio above 80% based on, among other things, the amortization features of the mortgage loan (for example, if the mortgage loan provides for relatively rapid amortization), the type of tenants and leases at the subject mortgaged property, the taking of additional collateral such as reserves, letters of credit and/or guarantees, Artesia’s judgment of improved property performance in the future and/or other relevant factors.
Additional Debt. When underwriting a multifamily or commercial mortgage loan, Artesia will take into account whether the subject real property and/or direct or indirect interest in a related borrower are encumbered by additional debt and will analyze the likely effect of that additional debt on repayment of the subject mortgage loan. It is possible that Artesia will be the lender on that additional debt.
The debt service coverage ratios described above under ‘‘—Debt Service Coverage Ratio’’ and the loan-to-value ratios described above under ‘‘—Loan-to-Value Ratio’’ may be below 1.20x and above 80%, respectively, based on the existence of additional debt secured by the related mortgaged property or directly or indirectly by equity interests in the related borrower.
Assessments of Property Condition. As part of the underwriting process, Artesia will analyze the condition of the real property for a prospective multifamily or commercial mortgage loan. To aid in that analysis, Artesia may, subject to certain exceptions, inspect or retain a third party to inspect the property and will obtain the property assessments and reports described below.
Appraisals. Artesia will, in most cases, require that the real property for a prospective multifamily or commercial mortgage loan be appraised by a state certified appraiser or an appraiser belonging to the Appraisal Institute, a membership association of professional real estate appraisers. In addition, Artesia will generally require that those appraisals be conducted in accordance with the Uniform Standards of Professional Appraisal Practices developed by The Appraisal Foundation, a not-for-profit organization established by the appraisal profession. Furthermore, the appraisal report will usually include or be accompanied by a separate letter that includes a statement by the appraiser that the guidelines in Title XI of the Financial Institutions Reform, Recovery and Enforcement Act of 1989 were followed in preparing the appraisal. In some cases, however, Artesia may establish the value of the subject real property based on a cash flow analysis, a recent sales price or another method or benchmark of valuation.
Environmental Assessment. Artesia may require a Phase I environmental assessment with respect to the real property for a prospective multifamily or commercial mortgage loan. However, when circumstances warrant, Artesia may utilize an update of a prior environmental assessment, a transaction screen or a desktop review. Alternatively, Artesia might forego an environmental assessment in limited circumstances, such as when it has obtained the benefits of an environmental insurance policy or an environmental guarantee. Furthermore, an environmental assessment conducted at any particular real property will not necessarily cover all potential environmental issues. For example, an analysis for radon, lead-based paint and lead in drinking water will usually be conducted only at multifamily rental properties and only when Artesia or the environmental consultant believes that such an analysis is warranted under the circumstances.
Depending on the findings of the initial environmental assessment, Artesia may require additional record searches or environmental testing, such as a Phase II environmental assessment with respect to the subject real property.
Engineering Assessment. In connection with the origination process, Artesia may require that an engineering firm inspect the real property for any prospective multifamily or commercial mortgage loan to assess the structure, exterior walls, roofing, interior structure and/or mechanical and electrical systems. Based on the resulting report, Artesia will determine the appropriate response to any recommended repairs, corrections or replacements and any identified deferred maintenance.
Seismic Report. If the subject real property includes any material improvements and is located in California or in seismic zones 3 or 4, Artesia may require a report to establish the probable maximum or bounded loss for the improvements at the property as a result of an earthquake. If that loss is in excess of 20% of the estimated replacement cost for the improvements at the property, Artesia may require
S-124
retrofitting of the improvements or that the borrower obtain earthquake insurance if available at a commercially reasonable price. It should be noted, however, that because the seismic assessments may not necessarily have used the same assumptions in assessing probable maximum loss, it is possible that some of the real properties that were considered unlikely to experience a probable maximum loss in excess of 20% of estimated replacement cost might have been the subject of a higher estimate had different assumptions been used.
Zoning and Building Code Compliance. In connection with the origination of a multifamily or commercial mortgage loan, Artesia will generally examine whether the use and occupancy of the related real property is in material compliance with zoning, land-use, building rules, regulations and orders then applicable to that property. Evidence of this compliance may be in the form of one or more of the following: legal opinions; surveys; recorded documents; temporary or permanent certificates of occupancy; letters from government officials or agencies; title insurance endorsements; engineering or consulting reports; and/or representations by the related borrower.
Where a property as currently operated is a permitted nonconforming use and/or structure and the improvements may not be rebuilt to the same dimensions or used in the same manner in the event of a major casualty, Artesia will analyze whether—
| • | any major casualty that would prevent rebuilding has a sufficiently remote likelihood of occurring; |
| • | casualty insurance proceeds together with the value of any additional collateral would be available in an amount estimated by Artesia to be sufficient to pay off the related mortgage loan in full; |
| • | the real property, if permitted to be repaired or restored in conformity with current law, would in Artesia’s judgment constitute adequate security for the related mortgage loan; and/or |
| • | to require the related borrower to obtain law and ordinance insurance. |
Escrow Requirements. Based on its analysis of the subject real property, the borrower and the principals of the borrower, Artesia may require a borrower under a multifamily or commercial mortgage loan to fund various escrows for taxes and/or insurance, capital expenses, replacement reserves, tenant improvements, leasing commissions, debt service and/or environmental remediation. Artesia conducts a case-by-case analysis to determine the need for a particular escrow or reserve. Consequently, the aforementioned escrows and reserves are not established for every multifamily and commercial mortgage loan originated by Artesia. Furthermore, Artesia may accept an alternative to a cash escrow or reserve from a borrower, such as a letter of credit or a guarantee from the borrower or an affiliate of the borrower or periodic evidence that the items for which the escrow or reserve would have been established are being paid or addressed.
Notwithstanding the foregoing discussion under this ‘‘—Artesia’s Underwriting Standards’’ section, Artesia may include mortgage loans in a trust fund which vary from, or do not comply with, Artesia’s underwriting guidelines. In addition, in some cases, Artesia may not have strictly applied these underwriting guidelines as the result of a case-by-case permitted exception based upon other compensating factors.
Certain Relationships
The Mortgage Loans that will be sold to the Depositor by Artesia Mortgage Capital Corporation were previously the subject of a custodial arrangement between Artesia and Wells Fargo Bank, N.A. in which Wells Fargo Bank, N.A. acted as a document custodian for Artesia. The terms of the custodial arrangement are customary for agreements in the commercial mortgage securitization industry providing for the delivery, receipt, review and safekeeping of mortgage loan files.
Wachovia Bank, National Association is currently servicing all of the Mortgage Loans that will be sold to the Depositor by Artesia pursuant to an interim servicing arrangement between Artesia and Wachovia. The terms of the interim servicing agreement are customary for agreements in the commercial mortgage securitization industry providing for the servicing of mortgage loans.
S-125
The Depositor
Wachovia Commercial Mortgage Securities, Inc., a North Carolina corporation, is the Depositor. The Depositor is a wholly-owned subsidiary of Wachovia Bank, National Association, a national banking association, which is a wholly-owned subsidiary of Wachovia Corporation, a North Carolina corporation. The Depositor purchases commercial mortgage loans and interests in commercial mortgage loans for the purpose of selling such commercial mortgage loans and interests to trusts created in connection with the securitization of pools of assets and does not engage in any activities unrelated thereto.
The Depositor remains responsible under the Pooling and Servicing Agreement for providing the Master Servicer, Special Servicer and Trustee with certain information and other assistance requested by those parties and reasonably necessary to performing their duties under the Pooling and Servicing Agreement. The Depositor also remains responsible for mailing notices to the Certificateholders upon the appointment of certain successor entities under the Pooling and Servicing Agreement.
Significant Obligors
The mortgaged property described in Annex D and in ‘‘DESCRIPTION OF THE MORTGAGE POOL—Twenty Largest Mortgage Loans’’ securing the Beacon D.C. & Seattle Pool mortgage loan represents 10.8% of the Cut-Off Date Pool Balance (12.2% of the Cut-Off Date Group 1 Balance) and is a ‘‘significant obligor’’ with respect to this offering. The borrowers under the Beacon D.C. & Seattle Pool mortgage loan are Liberty Place Property LLC, 1627 Eye Street Property LLC, Lafayette Centre Property LLC, Market Square Associates, Cornerstone Market Square LLC, Cornerstone Market Square II LLC, Market Square Lender LLC, 11111 Sunset Hills Property LLC, 1616 North Fort Myer Drive Property LLC, American Center Property LLC, 8251 Greensboro Drive Property LLC, Marshall Property LLC, Polk And Taylor Property LLC, City Center Bellevue Property LLC, Eastgate Office Park Property LLC, Lincoln Executive Center Property LLC, Pl aza Center Property LLC, Plaza East Property LLC, Sunset North Corporate Campus Property LLC, 999 Third Avenue Property LLC, WA-Three Bellevue Center, L.L.C., WA-1201 Third Avenue, L.L.C., 1300 North Seventeenth Street Holding LLC and Reston Town Center Holding LLC. See ‘‘DESCRIPTION OF THE MORTGAGE POOL—Significant Obligors’’, ‘‘—Twenty Largest Mortgage Loans’’ in this prospectus supplement and the description of the Beacon D.C. & Seattle Pool mortgage loan in Annex D to this prospectus supplement.
The Mortgage Loan Sellers
The Depositor will acquire the Mortgage Loans from the Mortgage Loan Sellers on or prior to the Closing Date pursuant to separate mortgage loan purchase agreements (each, a ‘‘Mortgage Loan Purchase Agreement’’ and together, the ‘‘Mortgage Loan Purchase Agreements’’). The Mortgage Loan Sellers originated or acquired the Mortgage Loans as described above under ‘‘—Mortgage Loan History’’.
One hundred twenty-five (125) of the Mortgage Loans (the ‘‘Wachovia Mortgage Loans’’), representing 97.9% of the Cut-Off Date Pool Balance (99 Mortgage Loans in Loan Group 1 or 98.2% of the Cut-Off Date Group 1 Balance and 26 Mortgage Loans in Loan Group 2 or 95.3% of the Cut-Off Date Group 2 Balance), were originated by Wachovia.
Seventeen (17) of the Mortgage Loans (the ‘‘Artesia Mortgage Loans’’), representing 2.1% of the Cut-Off Date Pool Balance (14 Mortgage Loans in Loan Group 1 or 1.8% of the Cut-Off Date Group 1 Balance and 3 Mortgage Loans in Loan Group 2 or 4.7% of the Cut-Off Date Group 2 Balance), were originated by Artesia.
Wachovia has no obligation to repurchase or substitute any of the Artesia Mortgage Loans or the Column Mortgage Loan. Artesia has no obligation to repurchase or substitute any of the Wachovia Mortgage Loans or the Column Mortgage Loan. Column has no obligation to repurchase or substitute any of the Wachovia Mortgage Loans or the Artesia Mortgage Loans.
All information concerning the Wachovia Mortgage Loans contained in or used in the preparation of this prospectus supplement is as underwritten by Wachovia. All information concerning the Artesia Mortgage Loans contained in or used in the preparation of this prospectus supplement is as underwritten by Artesia.
S-126
Originators
Each of the Mortgage Loan Sellers are originators with respect to this offering.
Assignment of the Mortgage Loans; Repurchases and Substitutions
On the Closing Date, the Depositor will acquire the Mortgage Loans from each Mortgage Loan Seller and will simultaneously transfer the Mortgage Loans, without recourse, to the Trustee for the benefit of the Certificateholders.
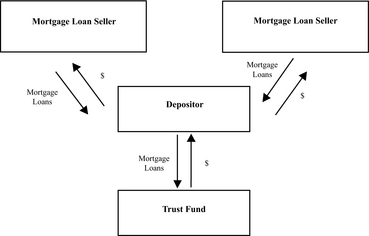
In connection with the above-described transfers, the Depositor will require each Mortgage Loan Seller to deliver to the Trustee or to a document custodian appointed by the Trustee (a ‘‘Custodian’’), among other things, the following documents with respect to each Mortgage Loan originated by the applicable Mortgage Loan Seller (the ‘‘Mortgage File’’): (i) the original Mortgage Note, endorsed on its face or by allonge attached thereto, without recourse, to the order of the Trustee or in blank (or, if the original Mortgage Note has been lost, an affidavit to such effect from the applicable Mortgage Loan Seller or another prior holder, together with a copy of the Mortgage Note); (ii)&nbs p;the original or a copy of the Mortgage, together with an original or copy of any intervening assignments of the Mortgage, in each case (unless not yet returned by the applicable recording office) with evidence of recording indicated thereon or certified by the applicable recorder’s office; (iii) the original or a copy of any related assignment of leases and of any intervening assignments thereof (if such item is a document separate from the Mortgage), in each case (unless not yet returned by the applicable recording office) with evidence of recording indicated thereon or certified by the applicable recorder’s office: (iv) an original assignment of the Mortgage in favor of the Trustee or in blank and (subject to the completion of certain missing recording information) in recordable form; (v) an original assignment of any related assignment of leases (if such item is a document separate from the Mortgage) in favor of the Trustee or in blank and (subject to the completion of certain missing recording information) in recordable form; (vi) the original assignment of all unrecorded documents relating to the Mortgage Loan, if not already assigned pursuant to items (iv) or (v) above; (vii) originals or copies of all modification, consolidation, assumption and substitution agreements in those instances in which the terms or provisions of the Mortgage or Mortgage Note have been modified or the Mortgage Loan has been assumed or consolidated; (viii) the original or a copy of the policy or certificate of lender’s title insurance issued on the date of the origination of such Mortgage Loan, or, if such policy has not been issued or located, an irrevocable, binding commitment (which may be a marked version of the policy that has been executed by an authorized representative of the title company or an agreement to provide the same pursuant to binding escrow instructions executed by an authorized representative of the title company or a ‘‘pro forma’&rs quo; title policy) to issue such title
S-127
insurance policy; (ix) any filed copies (bearing evidence of filing) or other evidence of filing satisfactory to the Trustee of any UCC financing statements, related amendments and continuation statements in the possession of the applicable Mortgage Loan Seller; (x) an original assignment in favor of the Trustee of any financing statement executed and filed in favor of the applicable Mortgage Loan Seller in the relevant jurisdiction; (xi) the original or copy of any ground lease, memorandum of ground lease, ground lessor estoppel, environmental insurance policy, indemnity or guaranty relating to such Mortgage Loan; (xii) any intercreditor agreement relating to permitted debt (including mezzanine debt) of the mortgagor; (xiii) copies of any loan agreement, escrow agreement, or security agreement relating to such Mortgage Loan; (xiv) copies of franchise agreements and franchisor comfort letters, if any, for hospitality properties and any applicable transfer or assignment documents ; and (xv) a copy of any letter of credit and related transfer documents related to such Mortgage Loan. However, with respect to (i) the Beacon D.C. & Seattle Pool Loan, the Morgan Stanley 2007-IQ14 Trustee will hold the original documents related to the Beacon D.C. & Seattle Pool Loan for the benefit of the Morgan Stanley 2007-IQ14 Trust Fund and the Trust Fund, other than the related Mortgage Note which will be held by the Trustee under the Pooling and Servicing Agreement and (ii) the DDR Southeast Pool Loan, the CGCMT 2007-C6 Trustee will hold the original documents related to the DDR Southeast Pool Loan for the benefit of the CGCMT 2007-C6 Trust Fund and the Trust Fund, other than the related Mortgage Note which will be held by the Trustee under the Pooling and Servicing Agreement.
As provided in the Pooling and Servicing Agreement, the Trustee or a Custodian on its behalf is required to review each Mortgage File within a specified period following its receipt thereof. If any of the documents described in the preceding paragraph is found during the course of such review to be missing from any Mortgage File or defective, and in either case such omission or defect materially and adversely affects the value of the applicable Mortgage Loan, the interest of the Trust Fund or the interests of any Certificateholder, the applicable Mortgage Loan Seller, if it does not deliver the document or cure the defect (other than omissions solely due to a document not having been returned by the related recording office) within a period of 90 days following such Mortgage Loan Seller’s receipt of notice thereof, will be obligated pursuant to the applicable Mortgage Loan Purchase Agreement (the relevant rights under which will be assigned by the Dep ositor to the Trustee) to (1) repurchase the affected Mortgage Loan within such 90-day period at a price (the ‘‘Purchase Price’’) generally equal to the sum of (i) the unpaid principal balance of such Mortgage Loan, (ii) the unpaid accrued interest on such Mortgage Loan (calculated at the applicable Mortgage Rate) to but not including the Due Date in the Collection Period in which the purchase is to occur and (iii) certain Additional Trust Fund Expenses in respect of such Mortgage Loan, including but not limited to, servicing expenses that are reimbursable to the Master Servicer, the Special Servicer or the Trustee plus any interest thereon and on any related P&I Advances or (2) other than with res pect to the Beacon D.C. & Seattle Pool Loan, the ING Hospitality Pool Loan and the DDR Southeast Pool Loan, substitute a Qualified Substitute Mortgage Loan for such Mortgage Loan and pay the Master Servicer for deposit into the Certificate Account a shortfall amount equal to the difference between the Purchase Price of the deleted Mortgage Loan calculated as of the date of substitution and the Stated Principal Balance of such Qualified Substitute Mortgage Loan as of the date of substitution (the ‘‘Substitution Shortfall Amount’’); provided that unless the breach would cause the Mortgage Loan not to be a qualified mortgage within the meaning of Section 860G(a)(3) of the Internal Revenue Code of 1986, as amended (the &l squo;‘Code’’), the applicable Mortgage Loan Seller will generally have an additional 90-day period to deliver the document or cure the defect, as the case may be, if it is diligently proceeding to effect such delivery or cure and provided, further, no such document omission or defect (other than with respect to the Mortgage Note, the Mortgage, the title insurance policy, the ground lease, any letter of credit, any franchise agreement, comfort letter and comfort letter transfer document (the ‘‘Core Material Documents’’)) will be considered to materially and adversely affect the interests of the Certificateholders in, or the value of, the affected Mortgage Loans unless the document with respect to which the document omission or defect exists is required in connection with an imminent enforcement of the mortgagee’s rights or remedies under the related Mortgage Loan, defending any claim asserted by any borrower or third-party with respect to the Mortgage Loan, establishing the validity or priority of any lien or any collateral securing the Mortgage Loan or for any immediate significant servicing obligation. With respect to material document defects other than those involving the Core Material Documents, any applicable cure period may be extended if the document involved is not needed imminently. Such
S-128
extension will end upon 30 days notice of such need as reasonably determined by the Master Servicer or Special Servicer (with a possible 30 day extension if the Master Servicer or Special Servicer agrees that the applicable Mortgage Loan Seller is diligently pursuing a cure). All material document defects regardless of the document involved will be cured no later than 2 years after the Closing Date; provided, however, the initial 90-day cure period described herein will not be reduced.
The foregoing repurchase or substitution obligation constitutes the sole remedy available to the Certificateholders and the Trustee for any uncured failure to deliver, or any uncured defect in, a constituent Mortgage Loan document. Each Mortgage Loan Seller is solely responsible for its repurchase or substitution obligation, and such obligations will not be the responsibility of the Depositor.
The Pooling and Servicing Agreement requires the Trustee promptly to cause each of the assignments described in clauses (iv), (v) and (x) of the third preceding paragraph to be submitted for recording or filing, as applicable, in the appropriate public records. See ‘‘DESCRIPTION OF THE POOLING AND SERVICING AGREEMENTS—Assignment of Mortgage Assets; Repurchases’’ in the accompanying prospectus. The Pooling and Servicing Agreement requires that the Trustee take the actions necessary to maintain the security interest of the Trust Fund in the Mortgage Loans.
Wells Fargo Bank is acting as custodian of the Mortgage Files pursuant to the Pooling and Servicing Agreement. In that capacity, Wells Fargo Bank is responsible for holding and safeguarding the Mortgage Notes and other contents of the Mortgage Files on behalf of the Trustee and the Certificateholders. Wells Fargo Bank maintains each Mortgage File in a separate file folder marked with a unique bar code to assure loan level file integrity and to assist in inventory management. Files are segregated by transaction and/or issuer. Wells Fargo Bank has been engaged in the mortgage document custody business for more than 25 years. Wells Fargo Bank maintains its commercial document custody facilities in Minneapolis, Minnesota. As of December 31, 2006, Wells Fargo Bank was acting as custodian of more than 43,000 commercial mortgage loan files.
A ‘‘Qualified Substitute Mortgage Loan’’ is a mortgage loan which must, on the date of substitution: (i) have an outstanding Stated Principal Balance, after application of all scheduled payments of principal and interest due during or prior to the month of substitution, not in excess of the Stated Principal Balance of the deleted Mortgage Loan as of the Due Date in the calendar month during which the substitution occurs; (ii) have a Mortgage Rate not less than the Mortgage Rate of the deleted Mortgage Loan; (iii) have the same Due Date as the deleted Mortgage Loan; (iv) accrue interest on the same basis as the deleted Mortgage Loan (for example, on the basis of a 360-day year consisting of twelve 30-day months); (v) have a remaining term to stated maturity not greater than, and not more than two years less than, the remaining term to stated maturity of the deleted Mortgage Loan; (vi) have an original loan-to-value ratio not higher than that of the deleted Mortgage Loan and a current loan-to-value ratio not higher than the then current loan-to-value ratio of the deleted Mortgage Loan; (vii) comply as of the date of substitution with all of the representations and warranties set forth in the applicable Mortgage Loan Purchase Agreement; (viii) have an environmental report with respect to the related Mortgaged Property which will be delivered as a part of the related servicing file; (ix) have an original debt service coverage ratio not less than the original debt service coverage ratio of the deleted Mortgage Loan; (x) be determined by an opinion of counsel to be a ‘‘qualified replacement mortgage’’ within the meaning of Section 860G(a)(4) of the Code; (xi) not have a maturity date after the date two years prior to the Rated Final Distribution Date; (xii) not be substituted for a deleted Mortgage Loan unless the Trustee has received prior confirmation in writing by each Rating Agency that such substitution will not result in the withdrawal, downgrade or qualification of the rating assigned by the Rating Agency to any Class of Certificates then rated by the Rating Agency (the cost, if any, of obtaining such confirmation to be paid by the applicable Mortgage Loan Seller); (xiii) have a date of origination that is not more than 12 months prior to the date of substitution; (xiv) have been approved by the Controlling Class Representative (or, if there is no Controlling Class Representative then serving, by the holders of Certificates representing a majority of the voting rights allocated to the Controlling Class); (xv) not be substituted for a deleted Mortgage Loan if it would result in the termination of the REMIC status of either of the REMICs or the imposition of tax on either of the REMICs other than a tax on income expressly per mitted or contemplated to be received by the terms of the Pooling and Servicing Agreement; and (xvi) become a part of the same Loan Group as the deleted Mortgage Loan. In the event that one or more mortgage loans are substituted for
S-129
one or more deleted Mortgage Loans, then the amounts described in clause (i) shall be determined on the basis of aggregate principal balances and the rates described in clause (ii) above and the remaining term to stated maturity referred to in clause (v) above shall be determined on a weighted average basis; provided that no individual Mortgage Loan shall have a Mortgage Rate, net of the related Administrative Cost Rate, that is less than the highest Pass-Through Rate of any Class of Sequential Pay Certificates then outstanding bearing a fixed rate. When a Qualified Substitute Mortgage Loan is substituted for a deleted Mortgage Loan, the applicable Mortgage Loan Seller will be required to certify that such Mortgage Loan meets all of the requirements of the above definition and shall send such certification to the Trustee. Notwithstanding the forego ing, no substitutions will be permitted for the Beacon D.C. & Seattle Pool Loan, the Jamison Valley Holdings Pool Loan, the BPRE Pool Loan, the ING Hospitality Pool Loan, the Ashford Pool 4 Loan, the Peachtree Medical Loan and the Barchester Pool Loan.
Representations and Warranties; Repurchases and Substitutions
In each Mortgage Loan Purchase Agreement, the applicable Mortgage Loan Seller has represented and warranted with respect to each Mortgage Loan (subject to certain exceptions specified in each Mortgage Loan Purchase Agreement), as of the Closing Date, or as of such other date specifically provided in the representation and warranty, among other things, generally that:
(i) the information set forth in the schedule of Mortgage Loans attached to the applicable Mortgage Loan Purchase Agreement (which contains certain of the information set forth in Annex A-1 to this prospectus supplement) was true and correct in all material respects as of the Cut-Off Date;
(ii) as of the date of its origination, such Mortgage Loan complied in all material respects with, or was exempt from, all requirements of federal, state or local law relating to the origination of such Mortgage Loan;
(iii) immediately prior to the sale, transfer and assignment to the Depositor, the applicable Mortgage Loan Seller had good and marketable title to, and was the sole owner of, each Mortgage Loan, and is transferring the Mortgage Loan free and clear of any and all liens, pledges, charges, security interests or any other ownership interests of any nature encumbering such Mortgage Loan;
(iv) the proceeds of such Mortgage Loan have been fully disbursed and there is no requirement for future advances thereunder by the mortgagee;
(v) each related Mortgage Note. Mortgage, assignment of leases, if any, and other agreements executed in connection with such Mortgage Loan is the legal, valid and binding obligation of the related mortgagor (subject to any nonrecourse provisions therein and any state anti-deficiency or market value limit deficiency legislation), enforceable in accordance with its terms, except (a) that certain provisions contained in such Mortgage Loan documents are or may be unenforceable in whole or in part under applicable state or federal laws, but neither the application of any such laws to any such provision nor the inclusion of any such provision renders any of the Mortgage Loan documents invalid as a whole and such Mortgage Loan documents taken as a whole are enforceable to the extent necessary and customary for the practical realization of the rights and benefits afforded thereby, and (b) as such enforcement may be limited by bankruptcy , insolvency, receivership, reorganization, moratorium, redemption, liquidation or other laws affecting the enforcement of creditors’ rights generally, and by general principles of equity (regardless of whether such enforcement is considered in a proceeding in equity or at law);
(vi) as of the date of its origination, there was no valid offset, defense, counterclaim, abatement or right to rescission with respect to any of the related Mortgage Notes, Mortgage(s) or other agreements executed in connection therewith, and, as of the Cut-Off Date, there was no valid offset, defense, counterclaim or right to rescission with respect to such Mortgage Note, Mortgage(s) or other agreements, except in each case, with respect to the enforceability of any provisions requiring the payment of default interest, late fees, additional interest, prepayment premiums or yield maintenance charges and the applicable Mortgage Loan Seller has no knowledge of any such rights, defenses or counterclaims having been asserted;
S-130
(vii) each related assignment of Mortgage and assignment of leases from the applicable Mortgage Loan Seller to the Trustee constitutes the legal, valid and binding first priority assignment from such Mortgage Loan Seller (subject to the customary limitations set forth in (v) above);
(viii) the related Mortgage is a valid and enforceable first lien on the related Mortgaged Property except for the exceptions set forth in paragraph (v) above and (a) the lien of current real property taxes, ground rents, water charges, sewer rents and assessments not yet due and payable, (b) covenants, conditions and restrictions, rights of way, easements and other matters of public record, none of which, individually or in the aggregate, materially and adversely interferes with the current use of the Mortgaged Property or the security intended to be provided by such Mortgage or with the mortgagor’s ability to pay its obligations under the Mortgage Loan when they become due or materially and adversely affects the value of the Mortgaged Property, (c) the exceptions (general and specific) and exclusions set forth in the related title insurance policy or appearing of record, none of which, individually or in the agg regate, materially and adversely interferes with the current use of the Mortgaged Property or the security intended to be provided by such Mortgage or with the mortgagor’s ability to pay its obligations under the Mortgage Loan when they become due or materially and adversely affects the value of the Mortgaged Property, (d) other matters to which like properties are commonly subject, none of which, individually or in the aggregate, materially and adversely interferes with the current use of the Mortgaged Property or the security intended to be provided by such Mortgage or with the mortgagor’s ability to pay its obligations under the Mortgage Loan when they become due or materially and adversely affects the value of the Mortgaged Property, (e) the right of tenants (whether under ground leases, space leases or operating leases) at the Mortgaged Property to remain following a foreclosure or similar proceeding (provided that such tenants are performing under such leases) and (f) if such Mortgage Loan is cross-collateralized with any other Mortgage Loan, the lien of the Mortgage for such other Mortgage Loan, none of which, individually or in the aggregate, materially and adversely interferes with the current use of the Mortgaged Property or the security intended to be provided by such Mortgage or with the mortgagor’s ability to pay its obligations under the Mortgage Loan when they become due or materially and adversely affects the value of the Mortgaged Property;
(ix) all real estate taxes and governmental assessments, or installments thereof, which would be a lien on the Mortgaged Property and that prior to the Cut-Off Date have become delinquent in respect of the related Mortgaged Property have been paid, or an escrow of funds in an amount sufficient to cover such payments has been established;
(x) as of the date of origination, there was no proceeding pending, and subsequent to that date, the applicable Mortgage Loan Seller has not received notice of any pending or threatening proceeding for the condemnation of all or any material portion of such Mortgaged Property;
(xi) each Mortgaged Property was covered by (1) a fire and extended perils included within the classification ‘‘All Risk of Physical Loss’ policy in an amount (subject to a customary deductible) at least equal to the lesser of the replacement cost of improvements located on such Mortgaged Property, with no deduction for depreciation, or the outstanding principal balance of the Mortgage Loan and in any event, the amount necessary to avoid the operation of any co-insurance provisions; (2) business interruption or rental loss insurance in an amount at least equal to 12 months of operations of the related Mortgaged Property; and (3) comprehensive general liability insurance against claims for personal and bodily injury, death or property damage occurring on, in or about the related Mortgaged Property in an amount customarily required by prudent commercial mortgage lenders, but not less than $1 million ; such insurance is required by the Mortgage or related Mortgage Loan documents and was in full force and effect with respect to each related Mortgaged Property at origination and to the knowledge of the Mortgage Loan Seller, all insurance coverage required under each Mortgage is in full force and effect with respect to each Mortgaged Property; and no notice of termination or cancellation with respect to any such insurance policy has been received by the Mortgage Loan Seller; except for certain amounts not greater than amounts which would be considered prudent by a commercial mortgage lender with respect to a similar Mortgage Loan and which are set forth in the related Mortgage, any insurance proceeds in respect of a casualty loss, will be applied either to the repair or restoration of the related Mortgaged Property with mortgagee or
S-131
a third-party custodian acceptable to mortgagee having the right to hold and disburse the proceeds as the repair or restoration progresses, other than with respect to amounts that are customarily acceptable to commercial and multifamily mortgage lending institutions, or the reduction of the outstanding principal balance of the Mortgage Loan and accrued interest thereon; to the Mortgage Loan Seller’s knowledge, the insurer with respect to each policy is qualified to do business in the relevant jurisdiction to the extent required; the insurance policies contain a standard mortgagee clause or names the mortgagee, its successors and assigns as loss payees in the case of property insurance policies and additional insureds in the case of liability insurance policies and provide that they are not terminable and may not be reduced without 30 days prior written notice to the mortgagee (or, with respect to non-payment of premiums, 10 days prior written notice to the mortgagee) or such lesser period as prescribed by applicable law; and each Mortgage requires that the mortgagor maintain insurance as described above or permits the mortgagee to require insurance as described above;
(xii) other than payments due but not yet 30 days or more delinquent, there is no material default, breach, violation or event of acceleration existing under the related Mortgage or the related Mortgage Note, and, to the applicable Mortgage Loan Seller’s actual knowledge, no event (other than payments due but not yet delinquent) which, with the passage of time or with notice and the expiration of any grace or cure period, would constitute a material default, breach, violation or event of acceleration;
(xiii) as of the Closing Date, each Mortgage Loan was not, and in the prior 12 months (or since the date of origination if such Mortgage Loan has been originated within the past 12 months), has not been, 30 days or more past due in respect of any Scheduled Payment;
(xiv) one or more environmental site assessments or updates thereof were performed by an environmental consulting firm independent of the applicable Mortgage Loan Seller and the applicable Mortgage Loan Seller’s affiliates with respect to each related Mortgaged Property during the 18-month period preceding the origination of the related Mortgage Loan, and the applicable Mortgage Loan Seller, having made no independent inquiry other than to review the report(s) prepared in connection with the assessment(s) referenced herein, has no actual knowledge and has received no notice of any material and adverse environmental condition or circumstance affecting such Mortgaged Property that was not disclosed in such report(s); and
(xv) an appraisal of the related Mortgaged Property was conducted in connection with the origination of such Mortgage Loan; and such appraisal satisfied either (A) the requirements of the ‘‘Uniform Standards of Professional Appraisal Practice’’ as adopted by the ‘‘Appraisal Standards Board of the Appraisal Professional Appraisal Practice’’ as adopted by the Appraisal Standards Board of the Appraisal Foundation, or (B) the guidelines in Title XI of the Financial Institutions Reform, Recovery and Enforcement Act of 1989, in either case as in effect on the date such Mortgage Loan was originated.
In the case of a breach of any of the representations and warranties in any Mortgage Loan Purchase Agreement that materially and adversely affects the value of a Mortgage Loan (or in the case of certain representations and warranties, is deemed to materially and adversely affect the value of a Mortgage Loan), the interests of the Trust Fund therein or the interests of any Certificateholder, the applicable Mortgage Loan Seller, if it does not cure such breach within a period of 90 days following its receipt of notice thereof, is obligated pursuant to the applicable Mortgage Loan Purchase Agreement (the relevant rights under which have been assigned by the Depositor to the Trustee) to either substitute a Qualified Substitute Mortgage Loan and pay any Substitution Shortfall Amount (other than with respect to the Beacon D.C. & Seattle Pool Loan, ING Hospitality Pool Loan and the DDR Southeast Pool Loan) or to repurchase the affected Mortgage Loan within suc h 90-day period at the applicable Purchase Price; provided that unless the breach would cause the Mortgage Loan not to be a qualified mortgage within the meaning of Section 860G(a)(3) of the Code, the applicable Mortgage Loan Seller generally has an additional 90-day period to cure such breach if it is diligently proceeding with such cure. Each Mortgage Loan Seller is solely responsible for its repurchase or substitution obligation, and such obligations will not be the responsibility of the Depositor.
S-132
The foregoing substitution or repurchase obligation constitutes the sole remedy available to the Certificateholders and the Trustee for any uncured breach of any Mortgage Loan Seller’s representations and warranties regarding its Mortgage Loans. There can be no assurance that the applicable Mortgage Loan Seller will have the financial resources to repurchase any Mortgage Loan at any particular time. Each Mortgage Loan Seller is the sole warranting party in respect of the Mortgage Loans sold by such Mortgage Loan Seller to the Depositor, and none of the Depositor nor any of such party’s affiliates (except with respect to Wachovia Bank, National Association in its capacity as a Mortgage Loan Seller) will be obligated to substitute or repurchase any such affected Mortgage Loan in connection with a breach of a Mortgage Loan Seller’s representations and warranties if such Mortgage Loan Seller defaults on its obligation to do so.
With respect to any Mortgage Loan which has become a Defaulted Mortgage Loan under the Pooling and Servicing Agreement or with respect to which the related Mortgaged Property has been foreclosed and which is the subject of a repurchase claim under the related Mortgage Loan Purchase Agreement, the Special Servicer with the consent of the Controlling Class Representative will be required to notify the related Mortgage Loan Seller in writing of its intention to sell such Defaulted Mortgage Loan or such foreclosed Mortgaged Property at least 45 days prior to commencing any such action. Such Mortgage Loan Seller shall have 10 business days to determine whether or not to consent to such sale. If such Mortgage Loan Seller does not consent to such sale, the Special Servicer shall contract with a third-party set forth in the Pooling and Servicing Agreement (a ‘‘Determination Party’’) as to the merits of such sale. If the related Determination Party determines that the proposed sale is reasonable, given the circumstances, and subsequent to such sale, a court of competent jurisdiction determines that such Mortgage Loan Seller was liable under the related Mortgage Loan Purchase Agreement and required to repurchase such Defaulted Mortgage Loan or REO Property in accordance with the terms thereof, then such Mortgage Loan Seller will be required to pay an amount equal to the difference (if any) between the proceeds of the related action and the price at which such Mortgage Loan Seller would have been obligated to pay had such Mortgage Loan Seller repurchased such Defaulted Mortgage Loan or REO Property in accordance with the terms thereof which shall generally include the costs related to contracting with the Determination Party. In the event that (a) the Special Servicer ignores the determination of the Determination Party and liqui dates the related Defaulted Mortgage Loan or REO Property and/or (b) a court of competent jurisdiction determines that such Mortgage Loan Seller was not obligated to repurchase the related Defaulted Mortgage or REO Property, the costs of contracting with the Determination Party will constitute Additional Trust Fund Expenses, and the Mortgage Loan Seller will not be liable for any such difference.
Repurchase or Substitution of Cross-Collateralized Mortgage Loans
If (i) any Mortgage Loan is required to be repurchased or substituted for in the manner described above in ‘‘—Assignment of the Mortgage Loans; Repurchases and Substitutions’’ or ‘‘—Representations and Warranties; Repurchases and Substitutions’’, (ii) such Mortgage Loan is cross-collateralized and cross-defaulted with one or more other Mortgage Loans (each a ‘‘Crossed Loan’’ and, collectively, a ‘‘Crossed Group’’), and (iii) the applicable document omission or defect (a ‘‘Defect’&rsquo ;) or breach of a representation and warranty (a ‘‘Breach’’) does not constitute a Defect or Breach, as the case may be, as to each other Crossed Loan in such Crossed Group (without regard to this paragraph), then the applicable Defect or Breach, as the case may be, will be deemed to constitute a Defect or Breach, as the case may be, as to any other Crossed Loan in the Crossed Group for purposes of this paragraph, and the related Mortgage Loan Seller will be required to repurchase or substitute for such other Crossed Loan(s) in the related Crossed Group as provided above in ‘‘—Assignment of the Mortgage Loans; Repurchases and Substitutions’’ or ‘‘—Representations and Warranties; Repurchases and Substitutions’’ unless: (i) the debt service coverage ratio for all of the remaining Crossed Loans for the four cal endar quarters immediately preceding the repurchase or substitution is not less than the debt service coverage ratio for all such related Crossed Loans, including the affected Crossed Loan, for the four calendar quarters immediately preceding the repurchase or substitution, (ii) the loan-to-value ratio for any of the remaining related Crossed Loans, determined at the time of repurchase or substitution, is not greater than the loan-to-value ratio for all such related Crossed Loans, including the affected Crossed Loan, determined at the time of repurchase or substitution, and (iii) the Trustee receives an opinion of counsel to the effect that such
S-133
repurchase or substitution is permitted by the REMIC provisions. In the event that the remaining Crossed Loans satisfy the aforementioned criteria, the related Mortgage Loan Seller may elect either to repurchase or substitute for only the affected Crossed Loan as to which the related Breach or Defect exists or to repurchase or substitute for all of the Crossed Loans in the related Crossed Group.
To the extent that the related Mortgage Loan Seller repurchases or substitutes for an affected Crossed Loan as described in the immediately preceding paragraph while the Trustee continues to hold any related Crossed Loans, the related Mortgage Loan Seller and the Depositor have agreed in the related Mortgage Loan Purchase Agreement to forbear from enforcing any remedies against the other’s Primary Collateral (as defined below), but each is permitted to exercise remedies against the Primary Collateral securing its respective affected Crossed Loans, including, with respect to the Trustee, the Primary Collateral securing Mortgage Loans still held by the Trustee, so long as such exercise does not materially impair the ability of the other party to exercise its remedies against its Primary Collateral. If the exercise of remedies by one party would materially impair the ability of the other party to exercise its remedies with respect to the Primary Collateral se curing the Crossed Loans held by such party, then both parties have agreed in the related Mortgage Loan Purchase Agreement to forbear from exercising such remedies until the loan documents evidencing and securing the relevant Mortgage Loans can be modified in a manner that complies with the related Mortgage Loan Purchase Agreement to remove the threat of material impairment as a result of the exercise of remedies or some other accommodation can be reached. ‘‘Primary Collateral’’ means the Mortgaged Property directly securing a Crossed Loan and excluding any property as to which the related lien may only be foreclosed upon by virtue of the cross collateralization features of such loans.
Changes in Mortgage Pool Characteristics
The descriptions in this prospectus supplement of the Mortgage Loans and the Mortgaged Properties are based upon the Mortgage Pool as it is expected to be constituted as of the close of business on the Closing Date, assuming that (i) all scheduled principal and interest payments due on or before the Cut-Off Date will be made and (ii) there will be no principal prepayments on or before the Cut-Off Date. Prior to the issuance of the Certificates, Mortgage Loans may be removed from the Mortgage Pool as a result of prepayments, delinquencies, incomplete documentation or otherwise, if the Depositor or any Mortgage Loan Seller deems such removal necessary, appropriate or desirable. A limited number of other mortgage loans may be included in the Mortgage Pool prior to the issuance of the Certificates, unless including such mortgage loans would materially alter the characteristics of the Mortgage Pool as described in this prospectus supplement. The Depositor b elieves that the information set forth in this prospectus supplement will be representative of the characteristics of the Mortgage Pool as it will be constituted at the time the Certificates are issued, although the range of Mortgage Rates and maturities as well as other characteristics of the Mortgage Loans described in this prospectus supplement may vary.
A Current Report on Form 8-K (the ‘‘Form 8-K’’) will be available to purchasers of the Offered Certificates on or shortly after the Closing Date and will be filed, together with the Pooling and Servicing Agreement, with the SEC within fifteen days after the initial issuance of the Offered Certificates.
S-134
Servicing of the Mortgage Loans
General
The Master Servicer and the Special Servicer, either directly or through sub-servicers, are required to service and administer the Mortgage Loans (other than the Beacon D.C. & Seattle Pool Loan and, after the securitization of the DDR Southeast Pool Pari Passu Note A-1 Companion Loan, the DDR Southeast Pool Loan) for the benefit of the Certificateholders, and the Companion Loans for the benefit of the holders of such Companion Loans, in accordance with applicable law, the terms of the Pooling and Servicing Agreement, the terms of the related Intercreditor Agreement, if applicable, and the terms of the respective Mortgage Loans and, if applicable, the Companion Loans, to the extent consistent with the foregoing, (a) in the same manner in which, and with the same care, skill, prudence and diligence with which, the Master Servicer or the Special Servicer, as the case may be, generally services and administers similar mortgage loans with similar borrowers ( i) for other third-parties, giving due consideration to customary and usual standards of practice of prudent institutional commercial mortgage lenders servicing their own loans, or (ii) held in its own portfolio, whichever standard is higher, (b) with a view to the maximization of the recovery on such Mortgage Loans on a net present value basis and the best interests of the Certificateholders and the Trust Fund or, if a Co-Lender Loan and its related Companion Loan(s) (a ‘‘Loan Pair’’) are involved, with a view towards the maximization of recovery on such Loan Pair to the Certificateholders, the holder of the related Companion Loan and the Trust Fund (as a collective whole, taking into account that the Subordinate Companion Loans are subordinate to the related Mortgage Loans and that the related Pari Passu Companion Loans are pari passu in right of entitlement to payment with the related Pari Passu Loans, to the extent set forth in the related Intercreditor Agreement), and (c) without regard to (i) any relationship that the Master Servicer or the Special Servicer, as the case may be, or any affiliate thereof, may have with the related borrower, a Mortgage Loan Seller or any other party to the Pooling and Servicing Agreement or any affiliate thereof; (ii) the ownership of any Certificate or Companion Loan by the Master Servicer or the Special Servicer, as the case may be, or by any affiliate thereof; (iii) the right of the Master Servicer or the Special Servicer, as the case may be, to receive compensation or other fees for its services rendered pursuant to the Pooling and Servicing Agreement; (iv) the obligation of the Master Servicer to make Advances (as defined in this prospectus sup plement); (v) the ownership, servicing or management by the Master Servicer or the Special Servicer or any affiliate thereof for others of any other mortgage loans or real property; (vi) any obligation of the Master Servicer, or any affiliate thereof, to repurchase or substitute a Mortgage Loan as a Mortgage Loan Seller; (vii) any obligation of the Master Servicer or any affiliate thereof to cure a breach of a representation and warranty with respect to a Mortgage Loan; and (viii) any debt the Master Servicer or the Special Servicer or any affiliate thereof has extended to any obligor or any affiliate thereof on a Mortgage Note (the foregoing referred to as the ‘‘Servicing Standard’’).
Generally, for purposes of the servicing provisions described in this section, the terms Co-Lender Loan and Mortgage Loan exclude the Beacon D.C. & Seattle Pool Loan and, after the securitization of the DDR Southeast Pool Pari Passu Note A-1 Companion Loan, will exclude the DDR Southeast Pool Loan, and the term Companion Loan excludes any Companion Loan related to that Mortgage Loan. See ‘‘—Servicing of the Beacon D.C. & Seattle Pool Loan’’ and ‘‘—Servicing of the DDR Southeast Pool Loan’’ below for a description of the servicing of the Beacon D.C. & Seattle Pool Loan and the DDR Southeast Pool Loan, respectively.
The securitization of the DDR Southeast Pool Pari Passu Note A-1 Companion Loan is expected to occur in connection with the Citigroup Commercial Mortgage Trust, Commercial Mortgage Pass-Through Certificates, Series 2007-C6. Upon settlement of such trust, the DDR Southeast Pool Loan and its companion loan will be serviced pursuant to the pooling and servicing agreement entered into in connection with the issuance of the Citigroup Commercial Mortgage Trust, Commercial Mortgage Pass-Through Certificates, Series 2007-C6. The master servicer with respect to the DDR Southeast Pool Loan under the CGCMT 2007-C6 Pooling and Servicing Agreement is expected to be Wachovia Bank, National Association, the special servicer under the CGCMT 2007-C6 Pooling and Servicing Agreement is expected to be LNR Partners, Inc. and the trustee under the CGCMT 2007-C6 Pooling and Servicing Agreement is expected to be Wells Fargo Bank, N.A. The terms of the CGCMT 2007-C6 Pooling and
S-135
Servicing Agreement are expected to be generally similar (but are not identical) to the terms of the pooling and servicing agreement for the CD 2007-CD4 Commercial Mortgage Trust, Series 2007-CD4. See ‘‘SERVICING OF THE MORTGAGE LOANS—Servicing of the DDR Southeast Pool Loan’’ in this prospectus supplement.
The Master Servicer and the Special Servicer may appoint sub-servicers with respect to the Mortgage Loans and Companion Loans; provided that the Master Servicer and the Special Servicer will remain obligated under the Pooling and Servicing Agreement for the servicing of the Mortgage Loans. The Trust Fund will not be responsible for any fees owed to any sub-servicer retained by the Master Servicer or the Special Servicer. Each sub-servicer retained thereby will be reimbursed by the Master Servicer or the Special Servicer, as the case may be, for certain expenditures which it makes, generally to the same extent the Master Servicer or the Special Servicer would be reimbursed under the Pooling and Servicing Agreement.
With respect to any Loan Pair, the Companion Loan for which is included in a securitization trust that is subject to the provisions of Regulation AB of the Securities Act, the Master Servicer, Special Servicer. Trustee and any subservicer will be required to provide such reports and information and otherwise take such commercially reasonable actions with respect to such Companion Loan as is necessary for the Depositor, Issuing Entity, Master Servicer, Special Servicer and Trustee to comply with all requirements of Regulation AB of the Securities Act.
The Master Servicer
Wachovia Bank, National Association, will act as the master servicer (in such capacity, the ‘‘Master Servicer’’) under the Pooling and Servicing Agreement. The Master Servicer is a national banking association organized under the laws of the United States of America and is a wholly-owned subsidiary of Wachovia Corporation. The Master Servicer has been servicing commercial and multifamily mortgage loans in excess of ten years. The Master Servicer’s primary servicing system runs on EnableUs software. The Master Servicer reports to trustees in the CMSA format. The Master Servicer’s principal servicing offices are located at NC 1075, 8739 Research Drive URP4, Charlotte, North Carolina 28262. The table below sets forth information about the Master Servicer’s portfolio of master or primary serviced commercial and multifamily mortgage loans as of the dates indicated:
| Commercial and Multifamily Mortgage Loans | As of December 31, 2003 | As of December 31, 2004 | As of December 31, 2005 | As of December 31, 2006 | As of March 31, 2007 | |||||||||||||||||||||||||
| By Approximate Number | 10,015 | 15,531 | 17,641 | 20,725 | 21,551 | |||||||||||||||||||||||||
| By Approximate Aggregate Unpaid Principal Balance (in Billions) | $ | 88.6 | $ | 141.3 | $ | 182.5 | $ | 262.1 | $ | 286.7 | ||||||||||||||||||||
Within this portfolio, as of March 31, 2007, are approximately 17,950 commercial and multifamily mortgage loans with an unpaid principal balance of approximately $217.6 billion related to commercial mortgage backed securities or commercial real estate collateralized debt obligation securities.
In addition to servicing loans related to commercial mortgage-backed securities and commercial real estate collateralized debt obligation securities, the Master Servicer also services whole loans for itself and a variety of investors. The properties securing loans in the Master Servicer’s servicing portfolio as of March 31, 2007, were located in all 50 states, the District of Columbia, Guam, Mexico, the Bahamas, the Virgin Islands and Puerto Rico and include retail, office, multifamily, industrial, hospitality and other types of income-producing properties.
The Master Servicer utilizes a mortgage-servicing technology platform with multiple capabilities and reporting functions. This platform allows the Master Servicer to process mortgage servicing activities including but not limited to: (i) performing account maintenance; (ii) tracking borrower communications; (iii) tracking real estate tax escrows and payments, insurance escrows and payments, replacement reserve escrows and operating statement data and rent rolls; (iv) entering and updating transaction data; and (v) generating various reports.
The table below sets forth information regarding the aggregate amount of principal and interest advances and servicing advances (i) made by the Master Servicer on commercial and multifamily
S-136
mortgage loans included in commercial mortgage-backed securitizations master serviced by the Master Servicer and (ii) outstanding as of the dates indicated:
| Date | Approximate Securitized Master Serviced Portfolio (UPB)* | Approximate Outstanding Advances (P&I and PPA)* | Approximate Outstanding Advances as % of UPB | |||||||||||||||
| December 31, 2003 | $ | 74,461,414,561 | $ | 84,616,014 | 0.1 | % | ||||||||||||
| December 31, 2004 | $ | 113,159,013,933 | $ | 129,858,178 | 0.1 | % | ||||||||||||
| December 31, 2005 | $ | 142,222,662,628 | $ | 164,516,780 | 0.1 | % | ||||||||||||
| December 31, 2006 | $ | 201,283,960,215 | $ | 162,396,491 | 0.1 | % | ||||||||||||
| * | ‘‘UPB’’ means unpaid principal balance, ‘‘P&I’’ means principal and interest advances and ‘‘PPA’’ means property protection advances. |
The Master Servicer is rated by Fitch and S&P as a primary servicer and master servicer. The Master Servicer’s ratings by each of these agencies is outlined below:
| Fitch | S&P | |||||
| Primary Servicer | CPS2+ | Strong | ||||
| Master Servicer | CMS2 | Strong |
The short-term debt ratings of Wachovia Bank, National Association are ‘‘A-1+’’ by S&P, ‘‘P-1’’ by Moody’s and ‘‘F1+’’ by Fitch.
The Master Servicer has developed policies, procedures and controls relating to its servicing functions to maintain compliance with applicable servicing agreements and servicing standards, including procedures for handling delinquent loans during the period prior to the occurrence of a special servicing transfer event.
The Master Servicer’s servicing policies and procedures are updated periodically to keep pace with the changes in the commercial mortgage-backed securities industry and have been generally consistent for the last three years in all material respects. The only significant changes in the Master Servicer’s policies and procedures have come in response to changes in federal or state law or investor requirements, such as updates issued by the Federal National Mortgage Association or the Federal Home Loan Mortgage Corporation. The Master Servicer may perform any of its obligations under the Pooling and Servicing Agreement through one or more third-party vendors, affiliates or subsidiaries. The Master Servicer may engage third-party vendors to provide technology or process efficiencies. The Master Servicer monitors its third-party vendors in compliance with its internal procedures and applicable law. The Master Servicer has entered into contracts with third - -party vendors for the following functions:
| • | monitoring and applying interest rate changes with respect to adjustable rate mortgage loans in accordance with loan documents; |
| • | provision of Strategy and Strategy CS software; |
| • | identification, classification, imaging and storage of documents; |
| • | analysis and determination of amounts to be escrowed for payment of taxes and insurance; |
| • | entry of rent roll information and property performance data from operating statements; |
| • | tracking and reporting of flood zone changes; |
| • | tracking, maintenance and payment of rents due under ground leases; |
| • | abstracting of insurance requirements contained in loan documents; |
| • | comparison of insurance certificates to insurance requirements contained in loan documents and reporting of expiration dates and deficiencies, if any; |
| • | abstracting of leasing consent requirements contained in loan documents; |
| • | legal representation; |
S-137
| • | assembly of data regarding buyer and seller (borrower) with respect to proposed loan assumptions and preparation of loan assumption package for review by the Master Servicer; |
| • | maintenance and storage of letters of credit; |
| • | tracking of anticipated repayment dates for loans with such terms; |
| • | reconciliation of deal pricing, tapes and annexes prior to securitization; |
| • | entry of new loan data and document collection; |
| • | initiation of loan payoff process and provision of payoff quotes; |
| • | printing, imaging and mailing of statements to borrowers; |
| • | performance of property inspections; |
| • | performance of tax parcel searches based on property legal description, monitoring and reporting of delinquent taxes, and collection and payment of taxes; |
| • | review of financial spreads performed by sub-servicers; |
| • | review of borrower requests for disbursements from reserves for compliance with loan documents, which are submitted to the Master Servicer for approval; and |
| • | performance of UCC searches and filing of UCCs. |
The Master Servicer may also enter into agreements with certain firms to act as a primary servicer and to provide cashiering or non-cashiering sub-servicing on certain loans.
Generally, all amounts received by the Master Servicer on the Mortgage Loans are initially deposited into a common clearing account with collections on other mortgage loans serviced by the Master Servicer and are then allocated and transferred to the appropriate account within the time described in this prospectus supplement. On the day any amount is to be disbursed by the Master Servicer, that amount is transferred to a common disbursement account prior to disbursement.
The Master Servicer will not have primary responsibility for custody services of original documents evidencing the Mortgage Loans. On occasion, the Master Servicer may have custody of certain of such documents as necessary for enforcement actions involving Mortgage Loans or otherwise. To the extent the Master Servicer performs custodial functions as the master servicer, documents will be maintained in a manner consistent with the Servicing Standard. Custodial functions will be performed by the Trustee as described under ‘‘DESCRIPTION OF THE MORTGAGE POOL—Assignment of the Mortgage Loans; Repurchases and Substitutions’’ in this prospectus supplement.
There are no legal proceedings pending against Wachovia Bank, National Association, or to which any property of Wachovia Bank, National Association is subject, that are material to the Certificateholders, nor does Wachovia Bank, National Association have actual knowledge of any proceedings of this type contemplated by governmental authorities.
The information set forth herein regarding the Master Servicer has been provided by Wachovia Bank, National Association.
The Special Servicer
CWCapital Asset Management LLC (‘‘CWCAM’’), a Massachusetts limited liability company, will initially be appointed as Special Servicer of the underlying Mortgage Loans under the Pooling and Servicing Agreement. The principal servicing offices of CWCAM are located at 701 Thirteenth Street, NW, Suite 1000, Washington, DC 20005 and its telephone number is (202) 715-9500. CWCAM and its affiliates are involved in the real estate investment, finance and management business, including:
| • | originating commercial and multifamily real estate loans; |
| • | investing in high yielding real estate loans and other commercial real estate debt instruments; and |
| • | investing in, surveilling and managing as special servicer, unrated and non investment grade rated securities issued pursuant to CMBS and CRE CDO transactions. |
S-138
CWCAM was organized in June 2005. In July of 2005, it acquired Allied Capital Corporation’s special servicing operations and replaced Allied Capital Corporation as special servicer for all transactions for which Allied Capital Corporation served as special servicer. In February 2006, an affiliate of CWCAM merged with CRIIMI MAE, Inc. (‘‘CMAE’’) and the special servicing operations of CRIIMI MAE Services L.P., the special servicing subsidiary of CMAE, were consolidated into the special servicing operations of CWCAM. An affiliate or affiliates of CWCAM may acquire certain of the Non Offered Certificates. CWCAM is a wholly owned subsidiary of CW Financial Services LLC. CWCAM and its affiliates own and are in the business of acquiring assets similar in type to the assets of the Trust Fund. According ly, the assets of CWCAM and its affiliates may, depending upon the particular circumstances including the nature and location of such assets, compete with the mortgaged real properties for tenants, purchasers, financing and so forth.
Because CWCAM was not formed until June 2005, CWCAM did not serve as special servicer for any CMBS pools as of December 31, 2004. As of December 31, 2005, CWCAM acted as special servicer with respect to 25 domestic CMBS pools containing approximately 3,670 loans secured by properties throughout the United States with a then current face value in excess of $32 billion. As of December 31, 2006, CWCAM acted as special servicer with respect to 94 domestic and 2 Canadian CMBS pools containing approximately 11,100 loans secured by properties throughout the United States and Canada with a then current face value in excess of $108.7 billion. Those loans include commercial mortgage loans secured by the same types of income producing properties as those securing the Mortgage Loans backing the Certificates.
CWCAM has three offices (Washington, D.C., Rockville, Maryland and Needham, Massachusetts) and CWCAM provides special servicing activities for investments in over 88 markets throughout the United States. As of December 31, 2006, CWCAM had 57 employees responsible for the special servicing of commercial real estate assets. As of December 31, 2006, within the CMBS pools described in the preceding paragraph, 162 assets were actually in special servicing. The assets owned or managed by CWCAM and its affiliates may, depending upon the particular circumstances, including the nature and location of such assets, compete with the mortgaged real properties securing the underlying Mortgage Loans for tenants, purchasers, financing and so forth. CWCAM does not service or manage any assets other than commercial and multifamily real estate assets.
Since its formation, policies and procedures of special servicing at CWCAM have been adopted from the best practices of the Allied Capital Corporation and CRIIMI MAE Services L.P., operations that it has acquired. These policies and procedures for the performance of its special servicing obligations among other things in compliance with applicable servicing criteria set forth in Item 1122 of Regulation AB of the Securities Act, including managing delinquent loans and loans subject to the bankruptcy of the borrower. Standardization and automation have been pursued, and continue to be pursued, wherever possible so as to provide for continued accuracy, efficiency, transparency, monitoring and controls.
CWCAM occasionally engages consultants to perform property inspections and to provide close surveillance on a property and its local market; it currently does not have any plans to engage sub-servicers to perform on its behalf any of its duties with respect to this transaction. CWCAM does not believe that its financial condition will have any adverse effect on the performance of its duties under the Pooling and Servicing Agreement and, accordingly, will not have any material impact on the mortgage pool performance or the performance of the Certificates. CWCAM does not have any material primary principal and interest advancing obligations with respect to the CMBS pools as to which it acts as special servicer and only has primary property protection advancing obligations for one CMBS pool.
CWCAM will not have primary responsibility for custody services of original documents evidencing the underlying Mortgage Loans. On occasion, CWCAM may have custody of certain of such documents as necessary for enforcement actions involving particular Mortgage Loans or otherwise. To the extent that CWCAM has custody of any such documents, such documents will be maintained in a manner consistent with the servicing standard.
There are currently no legal proceedings pending, and no legal proceedings known to be contemplated by governmental authorities, against CWCAM or of which any of its property is the subject, that is material to the Certificateholders.
S-139
CWCAM is not an affiliate of the Depositor, the Trust Fund, the Master Servicer or the Trustee. There are no specific relationships involving or relating to this transaction or the underlying Mortgage Loans between CWCAM or any of its affiliates, on the one hand, and the Depositor, the Master Servicer or the Trust Fund, on the other hand, that currently exist or that existed during the past two years. In addition, there are no business relationships, agreements, arrangements, transactions or understandings that have been entered into outside the ordinary course of business or on terms other than would be obtained in an arm’s length transaction with an unrelated third party—apart from the subject securitization transaction—between CWCAM or any of its affiliates, on the one hand, and the Depositor, the Master Servicer or the Trust Fund, on the other hand, that currently exist or that existed during the past two years and that are material t o an investor’s understanding of the Offered Certificates.
No securitization transaction involving commercial or multifamily mortgage loans in which CWCAM was acting as special servicer has experienced an event of default as a result of any action or inaction performed by CWCAM as special servicer. In addition, there has been no previous disclosure of material non compliance with servicing criteria by CWCAM with respect to any other securitization transaction involving commercial or multifamily mortgage loans in which CWCAM was acting as special servicer. From time to time, CWCAM and its affiliates may be parties to lawsuits and other legal proceedings arising in the ordinary course of business. CWCAM does not believe that any such lawsuits or legal proceedings would, individually or in the aggregate, have a material adverse effect on its business or its ability to service as special servicer.
The information set forth herein regarding the Special Servicer has been provided by CWCAM.
Certain Special Servicing Provisions
With respect to the Mortgage Loans, the Pooling and Servicing Agreement permits the holder (or holders) of the majority of the Voting Rights allocated to the Controlling Class to replace the Special Servicer and to select a representative (the ‘‘Controlling Class Representative’’) who may advise the Special Servicer and whose approval is required for certain actions by the Special Servicer under certain circumstances. With respect to the Beacon D.C. & Seattle Pool Loan, the rights of the Controlling Class Representative to advise on certain servicing actions will be shared with the controlling class representative with respect to the securitizations related to the related Pari Passu Companion Loans. With respect to the ING Hospitality Pool Loan, if the related Pari Passu Companion Loan is included in a securitization , the rights of the Controlling Class Representative to advise on certain servicing actions will be shared with the controlling class representative with respect to such securitization. With respect to the DDR Southeast Pool Loan, the controlling class representative of the securitization in which the DDR Southeast Pool Pari Passu Note A-1 Companion Loan is included, or if it has not been securitized, the holder of the related Note, has the right to advise the Special Servicer on certain servicing actions and is obligated to consult with the Controlling Class Representative and the controlling class representative of the securitization of the other DDR Southeast Pool Pari Passu Companion Loan. The rights of the controlling class representatives are as described in ‘‘SERVICING OF THE MORTGAGE LOANS—The Controlling Class Representative’’ in this prospectus supplement. Notwithstanding anything contained in this prospectus supplement to the contrary, the holders of the Companion Loa ns may have the ability to exercise some or all of the rights of the Controlling Class and the Controlling Class Representative as well as certain additional rights as more fully described in ‘‘—The Controlling Class Representative’’ below including, with respect to the Beacon D.C. & Seattle Pool Loan, the ING Hospitality Pool Loan and the DDR Southeast Pool Loan, the right to replace the Special Servicer solely with respect to the related Mortgage Loan. The Controlling Class Representative with respect to the Mortgage Loans is selected by holders of Certificates representing more than 50% of the Certificate Balance of the Controlling Class. See ‘‘—The Controlling Class Representative’’ below. Such holder (or holders) will be required to pay all out-of-pocket costs related to the transfer of servicing if the Special Servicer is replaced other than due to an event of default, including without limitation, any costs relating to Rating Agency confirmation and legal fees associated with the transfer. The ‘‘Controlling Class’’ is the Class of Sequential Pay Certificates, (i) which bears the latest payment priority and (ii) the Certificate Balance of which is greater than 25% of its original Certificate Balance; provided, however, if no Class of Sequential Pay Certificates satisfies clause (ii) above, the Controlling Class shall be the outstanding Class of Sequential Pay Certificates
S-140
bearing the latest payment priority. The Class A-1, Class A-2, Class A-PB, Class A-3 and Class A-1A Certificates will be treated as one Class for purposes of determining the Controlling Class.
The Special Servicer is responsible for servicing and administering any Mortgage Loan (other than the Beacon D.C. & Seattle Pool Loan and, after the securitization of the DDR Southeast Pool Pari Passu Note A-1 Companion Loan, the DDR Southeast Pool Loan) or Companion Loan (other than the Beacon D.C. & Seattle Pool Pari Passu Companion Loan and the DDR Southeast Pool Loan Pari Passu Companion Loan) as to which (a) the related mortgagor has (i) failed to make any Balloon Payment; provided, however, if the borrower continues to make its Assumed Scheduled Payment and diligently pursues refinancing, a Servicing Transfer Event shall not occur until 60 day s following such default (or, if the Master Servicer has, within 60 days after the Due Date of such Balloon Payment, received written evidence from an institutional lender of such lender’s binding commitment (which is reasonably acceptable to the Special Servicer and the Controlling Class Representative has given its consent (which consent shall be deemed denied if not granted within 10 Business Days)) to refinance such Mortgage Loan, 120 days following such default) (provided that if such refinancing does not occur during such time specified in the commitment, a Servicing Transfer Event will be deemed to have occurred), or (ii) failed to make when due any Periodic Payment (other than a Balloon Payment), and such failure has continued unremedied for 60 days; (b) the Master Servicer or the Special Servicer (in the case of the Special Servicer, with the consent of the Controlling Class Representative) has determined, in its good faith reasonable judgment and in accordance with the Servicing Standard, based on communications with the related mortgagor, that a default in making a Periodic Payment (including a Balloon Payment) or any other default under the applicable Mortgage Loan documents that would (with respect to such other default) materially impair the value of the Mortgaged Property as security for the Mortgage Loan and, if applicable, Companion Loan or otherwise would materially adversely affect the interests of Certificateholders and would continue unremedied beyond the applicable grace period under the terms of the Mortgage Loan (or, if no grace period is specified, for 60 days; provided that a default would give rise to an acceleration right without any grace period shall be de emed to have a grace period equal to zero) is likely to occur and is likely to remain unremedied for at least 60 days; (c) there shall have occurred a default (other than as described in clause (a) above and, in certain circumstances, the failure to maintain insurance for terrorist or similar attacks or for other risks required by the Mortgage Loan documents to be insured against pursuant to the terms of the Pooling and Servicing Agreement) that the Master Servicer or the Special Servicer (in the case of the Special Servicer, with the consent of the Controlling Class Representative) shall have determined, in its good faith and reasonable judgment and in accordance with the Servicing Standard, materially impairs the value of the Mortgaged Property as security for the Mortgage Loan and, if applicable, Companion Loan or otherwise materially adversely affects the interests of Certificateholders (and, if applicable, the holders of the Companion Loans) and that continues unremedied beyond the applic able grace period under the terms of the Mortgage Loan (or, if no grace period is specified, for 60 days; provided that a default that gives rise to an acceleration right without any grace period shall be deemed to have a grace period equal to zero); (d) a decree or order under any bankruptcy, insolvency or similar law shall have been entered against the related borrower and such decree or order shall have remained in force, undischarged, undismissed or unstayed for a period of 60 days; (e) the related borrower shall consent to the appointment of a conservator or receiver or liquidator in any insolvency or similar proceedings of or relating to such related borrower or of or relating to all or substantially all of its property; (f) the related borrower shall admit in writing its inability to pay its debts generally as they become due, file a petition to take advantage of any applicable insolvency or reorganization statute, make an assignment for the benefit of its creditors, or voluntarily suspend payment of its obligations; (g) the Master Servicer shall have force placed insurance against damages or losses arising from acts of terrorism due to the failure of the related borrower to maintain or cause such insurance to be maintained and (1) subsequent to such force placement such borrower fails to maintain or cause to be maintained insurance coverage against damages or losses arising from acts of terrorism for a period of 60 days (or such shorter time period as the Controlling Class Representative may consent to) or (2) the Master Servicer fails to have been reimbursed for any Servicing Advances made in connection with the force placement of such insurance coverage (unless the circumstances giving rise to such forced placement of such insurance coverage have otherwise been cured and the Master Servicer has been reimbursed f or any Servicing Advances made in connection with the forced placement of such insurance
S-141
coverage); or (h) the Master Servicer shall have received notice of the commencement of foreclosure or similar proceedings with respect to the related Mortgaged Property (each event described in clauses (a) through (h) above, a ‘‘Servicing Transfer Event’’).
In general, as long as a Co-Lender Loan (other than the Beacon D.C. & Seattle Pool Loan and, after the securitization of the DDR Southeast Pool Pari Passu Note A-1 Companion Loan, the DDR Southeast Pool Loan) is owned by the Trust Fund, each related Companion Loan will be serviced and administered under the Pooling and Servicing Agreement as if it were a Mortgage Loan and the holder of the related promissory note were a Certificateholder. If a Companion Loan (other than the Beacon D.C. & Seattle Pool Pari Passu Companion Loan and, after the securitization of the DDR Southeast Pool Pari Passu Note A-1 Companion Loan, the DDR Southeast Pool Pari Passu Companion Loan) becomes specially serviced, then the Co-Lender Loan will become a Specially Serviced Mortgage Loan. If a Co-Lender Loan (other than the Beacon D.C. & Seattle Pool Loan and, after the securitization of the DDR Southeast Pool Pari Passu Note A-1 Companion Loan, the DDR Southeast Pool Loan) b ecomes a Specially Serviced Mortgage Loan, then the related Companion Loan will become a Specially Serviced Mortgage Loan.
If any amounts due under a Co-Lender Loan or the related Subordinate Companion Loan are accelerated after an event of default under the applicable Mortgage Loan documents, the holder of any related Subordinate Companion Loan will be entitled to purchase the related Mortgage Loan at the price described under ‘‘DESCRIPTION OF THE MORTGAGE POOL—Co-Lender Loans’’ in this prospectus supplement.
If a Servicing Transfer Event occurs with respect to any Mortgage Loan (other than the Beacon D.C. & Seattle Pool Pari Passu Companion Loan and, after the securitization of the DDR Southeast Pool Pari Passu Note A-1 Companion Loan, the DDR Southeast Pool Pari Passu Companion Loan) or a related Companion Loan, the Master Servicer is in general required to transfer its servicing responsibilities with respect to such Mortgage Loan and Companion Loan to the Special Servicer. Notwithstanding such transfer, the Master Servicer will continue to receive payments on such Mortgage Loan and/or Companion Loan (including amounts collected by the Special Servicer), to make certain calculations with respect to such Mortgage Loan and Companion Loan, and to make remittances (including, if necessary, P&I Advances, as described in the Pooling and Servicing Agreement) and prepare certain reports to the Trustee with respect to such Mortgage Loan. If title to the related Mort gaged Property is acquired by the Trust Fund (upon acquisition, an ‘‘REO Property’’), whether through foreclosure, deed in lieu of foreclosure or otherwise, the Special Servicer will continue to be responsible for the management thereof.
Mortgage Loans and Companion Loans serviced by the Special Servicer, together with any REO Properties are referred to in this prospectus supplement as ‘‘Specially Serviced Mortgage Loans’’. The Master Servicer has no responsibility for the Special Servicer’s performance of its duties under the Pooling and Servicing Agreement.
A Mortgage Loan (other than the Beacon D.C. & Seattle Pool Loan and, after the securitization of the DDR Southeast Pool Pari Passu Note A-1 Companion Loan, the DDR Southeast Pool Loan) or Companion Loan (other than the Beacon D.C. & Seattle Pool Pari Passu Companion Loans and, after the securitization of the DDR Southeast Pool Pari Passu Note A-1 Companion Loan, the DDR Southeast Pool Pari Passu Companion Loans) will cease to be a Specially Serviced Mortgage Loan (and will become a ‘‘Corrected Mortgage Loan’’ as to which the Master Servicer will re-assume servicing responsibilities):
(a) with respect to the circumstances described in clause (a) of the definition of Servicing Transfer Event, when the related borrower has made three consecutive full and timely Periodic Payments under the terms of such Mortgage Loan (as such terms may be changed or modified in connection with a bankruptcy or similar proceeding involving the related borrower or by reason of a modification, waiver or amendment granted or agreed to by the Special Servicer);
(b) with respect to any of the circumstances described in clauses (b), (d), (e) and (f) of the definition of Servicing Transfer Event, when such circumstances cease to exist in the good faith, reasonable judgment of the Special Servicer, but, with respect to any bankruptcy or insolvency proceedings described in clauses (d), (e) and (f) no later than the entry of an order or decree dismissing such proceeding;
S-142
(c) with respect to the circumstances described in clause (c) of the definition of Servicing Transfer Event, when such default is cured; and
(d) with respect to the circumstances described in clause (h) of the definition of Servicing Transfer Event, when such proceedings are terminated;
so long as at that time no other Servicing Transfer Event then exists and provided no additional default is foreseeable in the reasonable good faith judgment of the Special Servicer.
The Master Servicer (or, in certain limited cases with respect to Specially Serviced Mortgage Loans, the Special Servicer), either directly or through sub-servicers, will direct the deposit, transfer and disbursement of collections on the Mortgage Loans consistent with the Servicing Standard. Account activity will not generally be independently audited or verified. See ‘‘DESCRIPTION OF THE POOLING AND SERVICING AGREEMENTS—Certificate Account’’ and ‘‘—Collection and Other Servicing Procedures’’ in the attached prospectus.
Servicing of the Beacon D.C. & Seattle Pool Loan
The Beacon D.C. & Seattle Pool Loan, and any related REO Property, are being serviced under the pooling and servicing agreement which governs the Morgan Stanley 2007-IQ14 Transaction (the ‘‘Morgan Stanley 2007-IQ14 Pooling and Servicing Agreement’’). Accordingly, the master servicer under the Morgan Stanley 2007-IQ14 Pooling and Servicing Agreement (the ‘‘Morgan Stanley 2007-IQ14 Master Servicer’’) will generally make servicing advances and remit collections on the Beacon D.C. & Seattle Pool Loan to or on behalf of the Trust Fund. However, the Master Servicer will generally be obligated to compile reports that include information on the Beacon D.C. & Seattle Pool Loan, and to e nforce the terms of the Beacon D.C. & Seattle Pool Intercreditor Agreement and make P&I Advances with respect to the Beacon D.C. & Seattle Pool Loan, subject to its non-recoverability. The servicing arrangements under the Morgan Stanley 2007-IQ14 Pooling and Servicing Agreement differ in certain respects to the servicing arrangements under the Pooling and Servicing Agreement.
In that regard:
| • | Wells Fargo Bank, N.A. is the Morgan Stanley 2007-IQ14 Master Servicer, and ARCap Special Servicing Inc. is the Morgan Stanley 2007-IQ14 Special Servicer (the ‘‘Morgan Stanley 2007-IQ14 Special Servicer’’). |
| • | The Morgan Stanley 2007-IQ14 Trustee is the Bank of New York (the ‘‘Morgan Stanley 2007-IQ14 Trustee’’), who will be the mortgagee of record for the Beacon D.C. & Seattle Pool Loan. |
| • | The Master Servicer, the Special Servicer and the Trustee under the Pooling and Servicing Agreement will have no obligation or authority to (a) supervise the Morgan Stanley 2007-IQ14 Master Servicer, the Morgan Stanley 2007-IQ14 Special Servicer or the Morgan Stanley 2007-IQ14 Trustee or (b) except as described below, make servicing advances with respect to the Beacon D.C. & Seattle Pool Loan. The obligation of the Master Servicer to provide information and collections and make P&I Advances to the Trustee and the Certificateholders with respect to the Beacon D.C. & Seattle Pool Loan is dependent on its receipt of the corresponding information and/or collections from the Morgan Stanley 2007-IQ14 Master Servicer or the Morgan Stanley 2007-IQ14 Special Servicer. |
| • | Pursuant to the Morgan Stanley 2007-IQ14 Pooling and Servicing Agreement, the liquidation fee, the special servicing fee and the workout fee with respect to the Beacon D.C. & Seattle Pool Loan will be generally similar to the corresponding fee payable under the Pooling and Servicing Agreement. |
| • | The Master Servicer will be required to make P&I Advances with respect to the Beacon D.C. & Seattle Pool Loan, unless (i) the Master Servicer, after receiving the necessary information from the Morgan Stanley 2007-IQ14 Master Servicer, has determined that such Advance would not be recoverable from collections on the Beacon D.C. & Seattle Pool Loan or (ii) the Morgan Stanley 2007-IQ14 Master Servicer has made a similar determination with respect to an advance on the related Beacon D.C. & Seattle Pool Pari Passu Companion Loan. |
S-143
| • | The Morgan Stanley 2007-IQ14 Master Servicer is obligated to make servicing advances with respect to the Beacon D.C. & Seattle Pool Whole Loan. If the Morgan Stanley 2007-IQ14 Master Servicer determines that a servicing advance it made with respect to the Beacon D.C. & Seattle Pool Whole Loan or the related Mortgaged Property is nonrecoverable, it will be entitled to be reimbursed first from collections on, and proceeds of, the Beacon D.C. & Seattle Pool Loan and the Beacon D.C. & Seattle Pool Pari Passu Companion Loans, on a pro rata basis (based on each such loan’s outstanding principa l balance), and then from general collections on all Mortgage Loans and with respect to the Beacon D.C. & Seattle Pool Pari Passu Companion Loans, out of funds payable to the holders of such mortgage loans (including if that mortgage loan is included in a securitization, from general collections of the related securitization trust, on a pro rata basis (based on each such loan’s outstanding principal balance)). |
| • | The Beacon D.C. & Seattle Pool Directing Holder will be entitled to remove the Morgan Stanley 2007-IQ14 Special Servicer at any time, with or without cause, and to appoint a replacement special servicer, subject to satisfaction of the conditions contained in the Morgan Stanley 2007-IQ14 Pooling and Servicing Agreement. The appointment of any successor special servicer will be subject to receipt of written confirmation from the Rating Agencies that such appointment would not cause the downgrade, withdrawal or qualification of the then current ratings of the Certificates (as well as written confirmation from any rating agency then rating any commercial mortgage pass-through certificates backed by a Beacon D.C. & Seattle Pool Pari Passu Companion Lo an to the same effect). |
| • | Under the Morgan Stanley 2007-IQ14 Pooling and Servicing Agreement, if the related Beacon D.C. & Seattle Pool Pari Passu Companion Loan is subject to a fair value purchase option, the Morgan Stanley 2007-IQ14 Special Servicer will be required to determine the purchase price for the Beacon D.C. & Seattle Pool Loan and the other Beacon D.C. & Seattle Pool Pari Passu Companion Loans as well. Each option holder specified in ‘‘ —Defaulted Mortgage Loans; REO Properties; Purchase Option’’ of this prospectus supplement will have an option to purchase the Beacon D.C. & Seattle Pool Loan and the holder of each Beacon D.C. & Seattle Pool Pari Passu Companion Loan (or its designees) will have an option to purchase t he related Beacon D.C. & Seattle Pool Pari Passu Companion Loan, at the purchase price determined by the Morgan Stanley 2007-IQ14 Special Servicer under the Morgan Stanley 2007-IQ14 Pooling and Servicing Agreement. |
| • | If an event of default under the Morgan Stanley 2007-IQ14 Pooling and Servicing Agreement occurs and is continuing with respect to the Morgan Stanley 2007-IQ14 Master Servicer, to the extent that it is affected by such event of default, the Controlling Class Representative is entitled to direct the Morgan Stanley 2007-IQ14 Trustee to appoint a sub-servicer solely with respect to the Beacon D.C. & Seattle Pool Whole Loan. The sub-servicer is required to be selected by the Beacon D.C. & Seattle Pool Directing Holder. The appointment of a sub-servicer will be subject to receipt of written confirmation from the Rating Agencies that such appointment would not cause the downgrade, withdrawal or qualification of the then current ratings of the Certifica tes (as well as any rating agency then rating any commercial mortgage pass-through certificates backed by a Beacon D.C. & Seattle Pool Pari Passu Companion Loan). |
The Morgan Stanley 2007-IQ14 Master Servicer. Wells Fargo Bank, N.A. is the Morgan Stanley 2007-IQ14 Master Servicer under the Morgan Stanley 2007-IQ14 Pooling and Servicing Agreement.
The Morgan Stanley 2007-IQ14 Special Servicer. ARCap Special Servicing Inc. is the Morgan Stanley 2007-IQ14 Special Servicer under the Morgan Stanley 2007-IQ14 Pooling and Servicing Agreement.
The Morgan Stanley 2007-IQ14 Trustee. The Bank of New York is the Morgan Stanley 2007-IQ14 Trustee under the Morgan Stanley 2007-IQ14 Pooling and Servicing Agreement.
Servicing of the DDR Southeast Pool Loan
Prior to the securitization of the DDR Southeast Pool Pari Passu Note A-1 Companion Loan, the DDR Southeast Pool Loan, and any related REO Property will be serviced under Pooling and Servicing
S-144
Agreement; however, the Pooling and Servicing Agreement will provide that the Master Servicer and Special Servicer will service the DDR Southeast Pool Loan pursuant to the related Intercreditor Agreement and a ‘‘model’’ pooling agreement that has terms as described below. After such securitization, the DDR Southeast Pool Loan, and any related REO Property, are expected to be serviced under the pooling and servicing agreement that governs the CGCMT 2007-C6 Transaction (the ‘‘CGCMT 2007-C6 Pooling and Servicing Agreement’’), which is expected to close subsequent to the closing of this securitization. Accordingly, the master servicer under the CGCMT 2007-C6 Pooling and Servicing Agreement (the ‘‘CGCMT 2007-C6 Master Servicer’’) will generally make servicing advances and remit collections on the DDR Southeast Pool Loan to or on behalf of the Trust Fund. However, the Master Servicer will generally be obligated to compile reports that include information on the DDR Southeast Pool Loan, and to enforce the terms of the DDR Southeast Pool Intercreditor Agreement and make P&I Advances with respect to the DDR Southeast Pool Loan, subject to their non-recoverability. The servicing arrangements under the CGCMT 2007-C6 Pooling and Servicing Agreement differ in certain respects to the servicing arrangements under the Pooling and Servicing Agreement.
In that regard:
| • | Wachovia Bank, National Association is expected to be the CGCMT 2007-C6 Master Servicer, and LNR Partners, Inc. is expected to be the CGCMT 2007-C6 Special Servicer (the ‘‘CGCMT 2007-C6 Special Servicer’’). |
| • | The CGCMT 2007-C6 Trustee is expected to be Wells Fargo Bank, N.A. (the ‘‘CGCMT 2007-C6 Trustee’’), who will be the mortgagee of record for the DDR Southeast Pool Loan. |
| • | The Master Servicer, the Special Servicer and the Trustee under the Pooling and Servicing Agreement will have no obligation or authority to (a) supervise the CGCMT 2007-C6 Master Servicer, the CGCMT 2007-C6 Special Servicer or the CGCMT 2007-C6 Trustee or (b) except as described below, make servicing advances with respect to the DDR Southeast Pool Loan. The obligation of the Master Servicer to provide information and collections and make P&I Advances to the Trustee and the Certificateholders with respect to the DDR Southeast Pool Loan is dependent on its receipt of the corresponding information and/or collections from the CGCMT 2007-C6 Master Servicer or the CGCMT 2007-C6 Special Servicer. |
| • | Pursuant to the CGCMT 2007-C6 Pooling and Servicing Agreement, the liquidation fee, the special servicing fee and the workout fee with respect to the DDR Southeast Pool Loan will be generally similar to the corresponding fee payable under the Pooling and Servicing Agreement. |
| • | The Master Servicer will be required to make P&I Advances with respect to the DDR Southeast Pool Loan, unless (i) the Master Servicer, after receiving the necessary information from the CGCMT 2007-C6 Master Servicer, has determined that such Advance would not be recoverable from collections on the DDR Southeast Pool Loan or (ii) the CGCMT 2007-C6 Master Servicer has made a similar determination with respect to an advance on the related DDR Southeast Pool Pari Passu Companion Loan. |
| • | The CGCMT 2007-C6 Master Servicer is obligated to make servicing advances with respect to the DDR Southeast Pool Whole Loan. If the CGCMT 2007-C6 Master Servicer determines that a servicing advance it made with respect to the DDR Southeast Pool Whole Loan or the related Mortgaged Property is nonrecoverable, it will be entitled to be reimbursed first from collections on, and proceeds of, the DDR Southeast Pool Loan and the DDR Southeast Pool Pari Passu Companion Loans, on a pro rata basis (based on each such loan’s outstanding principal balance), and then from general collections on all Mortgage Loans an d with respect to the DDR Southeast Pool Pari Passu Companion Loans, out of funds payable to the holders of such mortgage loans (including if that mortgage loan is included in a securitization, from general collections of the related securitization trust, on a pro rata basis (based on each such loan’s outstanding principal balance)). |
| • | The controlling class representative of the DDR Southeast Pool Pari Passu Note A-1 Companion Loan will be entitled to remove the CGCMT 2007-C6 Special Servicer at any time, with or without cause, and to appoint a replacement special servicer, subject to satisfaction of the |
S-145
| conditions contained in the CGCMT 2007-C6 Pooling and Servicing Agreement. The appointment of any successor special servicer will be subject to receipt of written confirmation from the Rating Agencies that such appointment would not cause the downgrade, withdrawal or qualification of the then current ratings of the Certificates (as well as written confirmation from any rating agency then rating any commercial mortgage pass-through certificates backed by a DDR Southeast Pool Pari Passu Companion Loan to the same effect). |
| • | Under the CGCMT 2007-C6 Pooling and Servicing Agreement, if the related DDR Southeast Pool Pari Passu Note A-1 Companion Loan is subject to a fair value purchase option, the CGCMT 2007-C6 Special Servicer will be required to determine the purchase price for the DDR Southeast Pool Loan and the other DDR Southeast Pool Pari Passu Companion Loans as well. Each option holder specified in ‘‘—Defaulted Mortgage Loans; REO Properties; Purchase Option’’ of this prospectus supplement will have an option to purchase the DDR Southeast Pool Loan and the holder of each DDR Southeast Pool Pari Passu Companion Loan (or its designees) will have an option to purchase the related DDR Southeast Pool Pari Passu Companion Loan, at the purchase p rice determined by the CGCMT 2007-C6 Special Servicer under the CGCMT 2007-C6 Pooling and Servicing Agreement. |
| • | If an event of default under the CGCMT 2007-C6 Pooling and Servicing Agreement occurs and is continuing with respect to the CGCMT 2007-C6 Master Servicer, to the extent that it is affected by such event of default, the Controlling Class Representative is entitled to appoint and select a sub-servicer solely with respect to the DDR Southeast Pool Whole Loan. The appointment of a sub-servicer will be subject to receipt of written confirmation from the Rating Agencies that such appointment would not cause the downgrade, withdrawal or qualification of the then current ratings of the Certificates (as well as any rating agency then rating any commercial mortgage pass-through certificates backed by a DDR Southeast Pool Pari Passu Companion Loan). |
The CGCMT 2007-C6 Master Servicer. Wachovia Bank, National Association is expected to be the CGCMT 2007-C6 Master Servicer under the CGCMT 2007-C6 Pooling and Servicing Agreement.
The CGCMT 2007-C6 Special Servicer. LNR Partners, Inc. is expected to be the CGCMT 2007-C6 Special Servicer under the CGCMT 2007-C6 Pooling and Servicing Agreement.
The CGCMT 2007-C6 Trustee. Wells Fargo Bank, N.A. is expected to be the CGCMT 2007-C6 Trustee under the CGCMT 2007-C6 Pooling and Servicing Agreement.
S-146
Compensation and Payment of Expenses
The Master Servicer, the Special Servicer and the Trustee will be entitled to payment of certain fees as compensation for its services performed under the Pooling and Servicing Agreement. Certain additional fees and costs payable by the related Mortgagors are allocable to the Master Servicer, the Special Servicer and the Trustee, but such amounts are not payable from amounts that the Trust Fund is entitled to receive.
Upon the settlement of the Citigroup Commercial Mortgage Trust, Commercial Mortgage Pass-Through Certificates, Series 2007-C6, the CGCMT 2007-C6 Master Servicer and, in certain circumstances, the CGCMT 2007-C6 Special Servicer under the CGCMT 2007-C6 Trust Fund will each be entitled to reimbursement of a pro rata share of servicing advances made with respect to the DDR Southeast Pool Whole Loan (based on the principal balance of the DDR Southeast Pool Loan to the aggregate principal balance of the DDR Southeast Pool Whole Loan). After the settlement described above, in the event collections related to the DDR Southeast Pool Loan are insufficient to reimburse the CGCMT 2007-C6 Master Servicer or CGCMT 2007-C6 Special Servicer, reimbursement may be obtained from the other Mortgage Loans in the Trust Fund.
The table below summarizes the related fees and expenses to be paid from the assets of the Trust Fund and the recipient, general purpose and frequency of payments for those fees and expenses:
| Type / Recipient(1)(2) | Amount | Source(3) | Frequency | ||||||
| Fees | |||||||||
| Master Servicing Fee / Master Servicer | With respect to the pool of Mortgage Loans (other than Specially Serviced Mortgage Loans) in the Trust Fund, one-twelfth of the product of the related annual Master Servicing Fee Rate (4) calculated on the outstanding principal amount of the pool of Mortgage Loans in the Trust Fund | First, out of recoveries of interest with respect to that Mortgage Loan and then, if the related Mortgage Loan and any related REO Property has been liquidated, out of general collections on deposit in the Certificate Account. | Monthly | ||||||
| Additional Master Servicing Compensation / Master Servicer | Prepayment Interest Excesses, net of Prepayment Interest Shortfalls, on underlying Mortgage Loans that are the subject of a principal prepayment in full or in part after its due date in any collection period. | Interest payments made by the related borrower intended to cover interest accrued on the subject principal prepayment with respect to the related Mortgage Loan during the period from and after the related Due Date. | Time to time | ||||||
| All interest and investment income earned on amounts on deposit in the collection account. | Interest and investment income related to the subject accounts (net of investment losses). | Monthly | |||||||
| All interest and investment income earned on amounts on deposit in the servicing accounts and reserve accounts, to the extent not otherwise payable to the borrower. | Interest and investment income related to the subject accounts (net of investment losses). | Monthly |
S-147
| Type / Recipient(1)(2) | Amount | Source(3) | Frequency | ||||||
| Late payment charges and default interest actually collected with respect to any Mortgage Loan in the Trust Fund during any collection period; but only to the extent that such late payment charges and default interest accrued while it was a non-specially serviced Mortgage Loan and are not otherwise allocable to pay the following items with respect to the related Mortgage Loan: (i) interest on advances; or (ii) Additional Trust Fund Expenses (exclusive of Special Servicing Fees, Liquidation Fees and Workout Fees) currently payable or previously paid with respect to the related Mortgage Loan or Mor tgaged Property from collections on the mortgage pool and not previously reimbursed. | Payments of late payment charges and default interest made by borrowers with respect to the underlying Mortgage Loans. | Time to time | |||||||
| Special Servicing Fee / Special Servicer | With respect to each Mortgage Loan that is being specially serviced or as to which the related Mortgaged Property has become an REO Property, one-twelfth of the product of the annual Special Servicing Fee Rate(5) computed on the basis of the same principal amount in respect of which any related interest payment is due on such Mortgage Loan or REO Loan. | Out of general funds on deposit in the Certificate Account | Monthly | ||||||
| Workout Fee / Special Servicer | With respect to each Mortgage Loan that is a worked-out Mortgage Loan, the Workout Fee Rate of 1.00% multiplied by all payments of interest and principal received on the subject Mortgage Loan for so long as it remains a Corrected Mortgage Loan. | Out of each collection of interest (other than default interest), principal, and prepayment consideration received on the related Mortgage Loan. | Time to time |
S-148
| Type / Recipient(1)(2) | Amount | Source(3) | Frequency | ||||||
| Liquidation Fee / Special Servicer | With respect to any Specially Serviced Mortgage Loan for which the Special Servicer obtains a full or partial payment of any liquidation proceeds an amount calculated by application of a liquidation fee rate of 1.00% to the related payment or proceeds (exclusive of default interest). | Out of the full, partial or discounted payoff obtained from the related borrower and/or liquidation proceeds (exclusive of any portion of that payment or proceeds that represents a recovery of default interest) in respect of the related Specially Serviced Mortgage Loan or related REO Property, as the case may be.(6) | Time to time | ||||||
| Additional Special Servicing Compensation / Special Servicer | All interest and investment income earned on amounts on deposit in the Special Servicer’s REO accounts. | Interest and investment income related to the subject accounts (net of investment losses). | Time to time | ||||||
| Late payment charges and default interest actually collected with respect to any Mortgage Loan, but only to the extent such late payment charges and default interest (a) accrued with respect to that Mortgage Loan while it was specially serviced or after the related mortgaged property became an REO Property and (b) are not otherwise allocable to pay the following items with respect to the related Mortgage Loan or REO Property: (i) interest on advance, or (ii) Additional Trust Fund Expenses (exclusive of special servicing fees, liquidation fees and workout fees) currently payable or pre viously paid with respect to the related Mortgage Loan, Mortgaged Property or REO Property from collections on the mortgage pool and not previously reimbursed. | Late payment charges and default interest actually collected in respect of the underlying Mortgage Loans. | Time to time | |||||||
| Additional Servicing Compensation / Master Servicer and/or Special Servicer | All modification fees, assumption fees, defeasance fees and other application fees actually collected on the Mortgage Loans.(7) | Related payments made by borrowers with respect to the related Mortgage Loans. | Monthly |
S-149
| Type / Recipient(1)(2) | Amount | Source(3) | Frequency | ||||||
| Trustee Fee / Trustee | With respect to each Distribution Date, an amount equal to one-twelfth of the product of the annual Trustee Fee Rate(8) calculated on the outstanding principal amount of the pool of Mortgage Loans in the Trust Fund. | Out of general funds on deposit in the Distribution Account. | Monthly | ||||||
| Additional Trustee Compensation / Trustee | All interest and investment income earned on amounts on deposit in the Distribution Account, the Floating Rate Account, the Interest Reserve Account, the Additional Interest Account and the Gain-On-Sale Reserve Account. | Interest and investment income related to the subject accounts (net of investment losses). | Monthly | ||||||
| Expenses | |||||||||
| Servicing Advances / Master Servicer, Special Servicer or Trustee | To the extent of funds available, the amount of any servicing advances. | First, from funds collected with respect to the related Mortgage Loan and then out of general funds on deposit in the Certificate Account, subject to certain limitations, and, under certain circumstances, from collections on the related Companion Loan. | Time to time | ||||||
| Interest on Servicing Advances / Master Servicer, Special Servicer or Trustee | At a rate per annum equal to the Reimbursement Rate calculated on the number of days the related Advance remains unreimbursed. | First, out of default interest and late payment charges on the related Mortgage Loan and then, after or at the same time that advance is reimbursed, out of any other amounts then on deposit in the Master Servicer’s Certificate Account, and, under certain circumstances, from collections on the related Companion Loan. | Monthly | ||||||
| P&I Advances / Master Servicer and Trustee | To the extent of funds available, the amount of any P&I Advances. | First, from funds collected with respect to the related Mortgage Loan and then out of general funds on deposit in the Certificate Account, subject to certain limitations. | Time to time |
S-150
| Type / Recipient(1)(2) | Amount | Source(3) | Frequency | ||||||
| Interest on P&I Advances / Master Servicer and Trustee | At a rate per annum equal to Reimbursement Rate. | First, out of default interest and late payment charges on the related Mortgage Loan and then, after or at the same time that advance is reimbursed, out of any other amounts then on deposit in the Master Servicer’s Certificate Account. | Monthly | ||||||
| Indemnification Expenses / Depositor, Master Servicer, Special Servicer or Trustee and any director, officer, employee or agent of any of the foregoing parties | Amount to which such party is entitled for indemnification under the Pooling and Servicing Agreement. | Out of general funds on deposit in the Certificate Account, subject to certain limitations. | Time to time |
| (1) | The Morgan Stanley 2007-IQ14 Master Servicer and the Morgan Stanley 2007-IQ14 Special Servicer are generally entitled to payment of similar fees and expenses from the same sources of funds with respect to the Beacon D.C. & Seattle Pool Loan pursuant to the Morgan Stanley 2007-IQ14 Pooling and Servicing Agreement. See ‘‘—Servicing of the Beacon D.C. & Seattle Pool Loan’’ in this prospectus supplement. The CGCMT 2007-C6 Master Servicer and the CGCMT 2007-C6 Special Servicer are generally entitled to payment of similar fees and expenses from the same sources of funds with respect to the DDR Southeast Pool Loan pursuant to the CGCMT 2007-C6 Pooling and Servicing Agreement. See ‘‘—Servicing of the DDR Southeast Pool Loan’’ in th is prospectus supplement |
| (2) | If the Trustee succeeds to the position of Master Servicer, it will be entitled to receive the same fees and expenses of the Master Servicer described in this prospectus supplement. Any change to the fees and expenses described in this prospectus supplement would require an amendment to the Pooling and Servicing Agreement. Sec ‘‘DESCRIPTION OF THE POOLING AND SERVICING AGREEMENTS—Amendment’’ in the accompanying prospectus. |
| (3) | Unless otherwise specified, the fees and expenses shown in this table are paid (or retained by the Master Servicer or the Trustee in the case of amounts owed to any of them) prior to distributions on the Certificates. |
| (4) | The Master Servicing Fee for each Mortgage Loan will range, on a loan-by-loan basis, from 0.0200% per annum to 0.0900% per annum, as described in this ‘‘—Compensation and Payment of Expenses’’ section. |
| (5) | The Special Servicing Fee Rate for each Mortgage Loan will equal 0.25% per annum, as described in this ‘‘—Compensation and Payment of Expenses’’ section. |
| (6) | Circumstances as to when a Liquidation Fee is not payable are set forth in this ‘‘—Compensation and Payment of Expenses’’ section. |
| (7) | Allocable between the Master Servicer and the Special Servicer as provided in the Pooling and Servicing Agreement. |
| (8) | The Trustee Fee Rate will equal 0.00058% per annum, as described in this prospectus supplement under ‘‘DESCRIPTION OF THE CERTIFICATES—The Trustee’’. |
As compensation for its services, the Trustee will be entitled to receive monthly, from general funds on deposit in the Distribution Account, the Trustee Fee. The ‘‘Trustee Fee’’ for each Mortgage Loan and REO Mortgage Loan for any Distribution Date equals one month’s interest for the most recently ended calendar month (calculated on the basis of a 360-day year consisting of twelve 30-day months), accrued at the Trustee Fee Rate on the Stated Principal Balance of such Mortgage Loan or REO Mortgage Loan, as the case may be, outstanding immediately following the prior Distribution Date (or, in the case of the initial Distribution Date, as of the Closing Date).
The principal compensation to be paid to the Master Servicer in respect of its servicing activities is the Master Servicing Fee. The ‘‘Master Servicing Fee’’ is payable monthly on a loan-by-loan basis from amounts received in respect of interest on each Mortgage Loan and each Specially Serviced Mortgage Loan (and from revenue with respect to each REO Mortgage Loan), is calculated on the basis of a 360-day year consisting of twelve 30-day months, accrues at the related Master Servicing Fee Rate and is
S-151
computed on the basis of the same principal amount respecting which any related interest payment due on the Mortgage Loan is computed. The ‘‘Master Servicing Fee Rate’’ is a per annum rate ranging from 0.02000% to 0.09000%. As of the Cut-Off Date the weighted average Master Servicing Fee Rate will be approximately 0.02099% per annum. The Master Servicer will not be entitled to receive a separate fee with respect to a Companion Loan unless such fee is expressly set forth in the related Intercreditor Agreement. Otherwise, all references in this section to ‘‘Mortgage Loans’’ will include the Companion Loans unless otherwise specified.
The Beacon D.C. & Seattle Pool Loan will be serviced by the Morgan Stanley 2007-IQ14 Master Servicer.
The principal compensation to be paid to the Special Servicer in respect of its special servicing activities is the Special Servicing Fee (together with the Master Servicing Fee, the ‘‘Servicing Fees’’) and, under the circumstances described in this prospectus supplement, Liquidation Fees and Workout Fees. The ‘‘Special Servicing Fee’’ is calculated on the basis of a 360-day year consisting of twelve 30-day months, accrues at a rate (the ‘‘Special Servicing Fee Rate’’) equal to 0.25% per annum, and is computed on the basis of the same principal amount respecting which any related interest payment due on such Specially Serviced Mortgage Loan or REO Mortgage Loan, as the case may be, is paid. However, earned Special Servicing Fees are payable out of general collections on the Mortgage Loans then on deposit in the Certificate Account. The Special Servicing Fee with respect to any Specially Serviced Mortgage Loan (or REO Mortgage Loan) will cease to accrue if such loan (or the related REO Property) is liquidated or if such loan becomes a Corrected Mortgage Loan.
The Special Servicer is entitled to a ‘‘Liquidation Fee’’ with respect to each Specially Serviced Mortgage Loan, which Liquidation Fee generally will be in an amount equal to 1.00% of all whole or partial cash payments of Liquidation Proceeds (as defined in the accompanying Prospectus) received in respect thereof; provided, however, in no event shall the Liquidation Fee be payable to the extent a Workout Fee is payable concerning the related cash payments. However, no Liquidation Fee will be payable in connection with, or out of, insur ance proceeds, condemnation proceeds or Liquidation Proceeds (as defined in the accompanying Prospectus) resulting from, the purchase of any Specially Serviced Mortgage Loan (i) by any Mortgage Loan Seller (as described in this prospectus supplement under ‘‘DESCRIPTION OF THE MORTGAGE POOL—Assignment of the Mortgage Loans; Repurchases and Substitutions’’ and ‘‘—Representations and Warranties; Repurchases and Substitutions’’) within the time period specified therein, (ii) by the Master Servicer, the Special Servicer, the Depositor or the Majority Subordinate Certificateholder as described in this prospectus supplement under ‘‘DESCRIPTION OF THE CERTIFICATES—Termination’’ or (iii) in certain other limited circumstances.
The Special Servicer also is entitled to a ‘‘Workout Fee’’ with respect to each Corrected Mortgage Loan, which is generally equal to 1.00% of all payments of interest and principal received on such Mortgage Loan for so long as it remains a Corrected Mortgage Loan. If the Special Servicer is terminated or resigns, it will retain the right to receive any and all Workout Fees payable with respect to any Mortgage Loan that became a Corrected Mortgage Loan during the period that it acted as Special Servicer and remained a Corrected Mortgage Loan at the time of its termination or resignation or if the Special Servicer resolved the circumstances and/or conditions (including by way of a modification of the related Mortgage Loan documents) causing the Mortgage Loan to be a Specially Serviced Mortgage Loan, but the Mortgage Loan had no t as of the time the Special Servicer is terminated or resigns become a Corrected Mortgage Loan because the related borrower had not made three consecutive monthly debt service payments and subsequently becomes a Corrected Mortgage Loan as a result of making such three consecutive payments. The successor Special Servicer will not be entitled to any portion of those Workout Fees.
If a borrower prepays a Mortgage Loan on a date that is prior to its Due Date in any Collection Period, the amount of interest (net of related Master Servicing Fees and, if applicable, Additional Interest) that accrues on the Mortgage Loan during such Collection Period will be less (such shortfall, a ‘‘Prepayment Interest Shortfall’’) than the amount of interest (net of related Master Servicing Fees and, if applicable, Additional Interest and without regard to any Prepayment Premium or Yield Maintenance Charge actually collected) that would have accrued on the Mortgage Loan through its Due Date. If such
S-152
a principal prepayment occurs during any Collection Period after the Due Date for such Mortgage Loan in such Collection Period, the amount of interest (net of related Master Servicing Fees) that accrues and is collected on the Mortgage Loans during such Collection Period will exceed (such excess, a ‘‘Prepayment Interest Excess’’) the amount of interest (net of related Master Servicing Fees, and without regard to any Prepayment Premium or Yield Maintenance Charge actually collected) that would have been collected on the Mortgage Loan during such Collection Period if the borrower had not prepaid. Any Prepayment Interest Excesses collected will be paid to the Master Servicer as additional servicing compensation. However, with respect to each Distribution Date, the Master Servicer is required to deposit into the Certificate Account (such deposit, a ‘‘Compensating Interest Payment’’), without any right of reimbursement therefor, with respect to each Mortgage Loan (other than a Specially Serviced Mortgage Loan and other than any Mortgage Loan on which the Special Servicer has waived a prepayment restriction and other than any Companion Loan) that was subject to a voluntary principal prepayment during the most recently ended Collection Period creating a Prepayment Interest Shortfall, an amount equal to the lesser of (i) the sum of (a) the Master Servicing Fee (up to a Master Servicing Fee Rate of 0.01% per annum) received by the Master Servicer during such Collection Period on such Mortgage Loan and (b) investment income earned by the Master Servicer on the related principal prepayment during the most recently ended Collection Period, and (ii) the amount of the related Prepayment Interest Shortfall: provided, however, to the extent any such Prepayment Interest Shortfall is the result of the Master Servicer’s failure to enforce the applicable Mortgage Loan documents, the amount in clause (a) shall include the entire Master Servicing Fee on the applicable Mortgage Loan for such Collection Period. Compensating Interest Payments will not cover shortfalls in Mortgage Loan interest accruals that result from any liquidation of a defaulted Mortgage Loan, or of any REO Property acquired in respect thereof, that occurs during a Collection Period prior to the related Due Date therein or involu ntary prepayments.
As additional servicing compensation, the Master Servicer and/or the Special Servicer is entitled to retain all modification fees, assumption fees, defeasance fees, assumption and other application fees, late payment charges and default interest (to the extent not used to offset interest on Advances, Additional Trust Fund Expenses (other than Special Servicing Fees, Workout Fees and/or Liquidation Fees) and the cost of property inspections as provided in the Pooling and Servicing Agreement and to the extent not otherwise allocated to the Companion Loan in accordance with the related Intercreditor Agreement) and Prepayment Interest Excesses collected from borrowers on Mortgage Loans. In addition, to the extent the Master Servicer or the Special Servicer receives late payment charges or default interest on a Mortgage Loan for which interest on Advances or Additional Trust Fund Expenses (other than Special Servicing Fees, Workout Fees and/or Liquidation Fees) relat ed to such Mortgage Loan has been paid and not previously reimbursed to the Trust Fund, such late payment charges or default interest will be used to reimburse the Trust Fund for such payment of interest or Additional Trust Fund Expenses. In addition, each of the Master Servicer and the Special Servicer is authorized to invest or direct the investment of funds held in those accounts maintained by it that relate to the Mortgage Loans or REO Properties, as the case may be, in certain short-term United States government securities and certain other permitted investment grade obligations, and the Master Servicer and the Special Servicer each will be entitled to retain any interest or other income earned on such funds held in those accounts maintained by it, but shall be required to cover any losses on investments of funds held in those accounts maintained by it, from its own funds without any right to reimbursement, except in certain limited circumstances described in the Pooling and Servicing Agreement.
Each of the Master Servicer and Special Servicer is, in general, required to pay all ordinary expenses incurred by it in connection with its servicing activities under the Pooling and Servicing Agreement, including the fees and any additional servicing compensation of any sub-servicers retained by it, and is not entitled to reimbursement therefor except as expressly provided in the Pooling and Servicing Agreement. However, each of the Master Servicer and Special Servicer is permitted to pay certain of such expenses (including certain expenses incurred as a result of a Mortgage Loan default) directly out of the Certificate Account and at times without regard to the Mortgage Loan with respect to which such expenses were incurred. See ‘‘DESCRIPTION OF THE CERTIFICATES—Distributions’’ in this prospectus supplement and ‘‘DESCRIPTION OF THE POOLING AND SERVICING AGREEMENTS—Certificate Account’’ and ‘&ls quo;—Servicing Compensation and Payment of Expenses’’ in the accompanying prospectus.
S-153
As and to the extent described in this prospectus supplement under ‘‘DESCRIPTION OF THE CERTIFICATES—P&I Advances’’, each of the Master Servicer and the Trustee is entitled to receive interest, at the Reimbursement Rate, on any reimbursable servicing expenses incurred by it. Such interest will compound annually and will be paid, contemporaneously with the reimbursement of the related servicing expense, first out of late payment charges and default interest received on the related Mortgage Loan during the Collection Period in which such reimbursement is made and then from general collections on the Mortgage Loans then on deposit in the Certificate Account. In addition, to the extent the Master Servicer receives late payment charges or default interest on a Mortgage Loan for which interest on servicing expenses related to such Mortgage Loan has been paid from general collections on deposit in the Certificate Account and not previo usly reimbursed, such late payment charges or default interest will be used to reimburse the Trust Fund for such payment of interest.
Modifications, Waivers and Amendments
The Pooling and Servicing Agreement permits the Special Servicer (subject, with respect to the Co-Lender Loans, to certain rights of the holder of any related Companion Loan and subject to the Master Servicer’s right to approve certain transfers of the equity interests in the related borrowers and waivers regarding due-on-sale and due-on-encumbrance provisions for certain Mortgage Loans as described below) to modify, waive or amend any term of any Mortgage Loan (other than the Beacon D.C. & Seattle Pool Loan) if (a) it determines, in accordance with the Servicing Standard, that it is appropriate to do so and the Special Servicer determines that such modification, waiver or amendment is not ‘‘significant’’ within the meaning of Treasury Regulations Section 1.860G-2(b), and (b) except as described in the following paragraph, such modification, waiver or amendment, will not (i) affect the amount or timing of any related payments of principal, interest or other amount (including Prepayment Premiums and Yield Maintenance Charges) payable under the Mortgage Loan, (ii) affect the obligation of the related borrower to pay a Prepayment Premium or Yield Maintenance Charge or permit a principal prepayment during the applicable Lockout Period, (iii) except as expressly provided by the related Mortgage or in connection with a material adverse environmental condition at the related Mortgaged Property, result in a release of the lien of the related Mortgage on any material portion of such Mortgaged Property without a corresponding principal prepayment in an amount not less than the fair market value of the property released, (iv) if such Mortgage Loan is equal to or in excess of 5% of the then aggregate current principal balances of all Mortgage Loans or $35,000,000, or is one of the ten largest Mortgage Loans by Stated Principal Balance as of such date, permit the transfer of (A) the related Mortgaged Prop erty or any interest therein or (B) equity interests in the related borrower or an equity owner of the borrower that would result, in the aggregate during the term of the related Mortgage Loan, in a transfer greater than 49% of the total interest in the borrower and/or any equity owner of the borrower or a transfer of voting control in the borrower or an equity owner of the borrower without the prior written confirmation from each Rating Agency (as applicable) that such change will not result in the qualification, downgrade or withdrawal of the ratings then assigned to the Certificates, (v) allow any additional lien on the related Mortgaged Property if such Mortgage Loan is equal to or in excess of 2% of the then aggregate current principal balances of the Mortgage Loans or $20,000,000, is one of the ten largest Mortgage Loans by Stated Principal Balance as of such date, or with respect to S&P only, has an aggregate LTV that is equal to or greater than 85% or has an aggregate DSCR that is less than 1.20x, without the prior written confirmation from each Rating Agency (as applicable) that such change will not result in the qualification, downgrade or withdrawal of the ratings then assigned to the Certificates, or (vi) in the good faith, reasonable judgment of the Special Servicer, materially impair the security for the Mortgage Loan or reduce the likelihood of timely payment of amounts due thereon. As provided in the Pooling and Servicing Agreement, the Master Servicer may approve certain transfers of the equity interests in the related borrowers and waivers regarding due-on-sale or due-on-encumbrance provisions relating to Mortgage Loans with tenants-in-common borrowing entities, subject to the Servicing Standard, the related Mortgage Loan documents and certain limiting conditions as set forth in the Pooling and Servicing Agreement, including Rating Agency approval of any such waivers for Mortgage Loans with certain outstanding Stated Principal Balances and that meet certain other financial t hresholds.
Notwithstanding clause (b) of the preceding paragraph and, with respect to the Co-Lender Loans (other than the Beacon D.C. & Seattle Pool Loan and, after the securitization of the DDR Southeast Pool
S-154
Pari Passu Note A-1 Companion Loan, the DDR Southeast Pool Loan), subject to certain rights of the holders of any related Companion Loan, the Special Servicer may (i) reduce the amounts owing under any Specially Serviced Mortgage Loan by forgiving principal, accrued interest and/or any Prepayment Premium or Yield Maintenance Charge, (ii) reduce the amount of the Periodic Payment on any Specially Serviced Mortgage Loan, including by way of a reduction in the related Mortgage Rate, (iii) forbear in the enforcement of any right granted under any Mortgage Note or Mortgage relating to a Specially Serviced Mortgage Loan, (iv) extend the maturity date of any Specially Serviced Mortgage Loan (and the Master Servicer may extend the maturity date of Mortgage Loans with an original maturity of five years or less with Controlling Class approval for up to two six-month extensions), and/or (v) accept a principal prepayment during any Lockout Period; provided that (x) the related borrower is in default with respect to the Specially Serviced Mortgage Loan or, in the reasonable, good faith judgment of the Special Servicer, such default by the borrower is reasonably foreseeable, (y) in the reasonable, good faith judgment of the Special Servicer, such modification would increase the recovery to Certificateholders (and any of the holders of the Companion Loans, taken as a collective whole, as applicable) on a net present value basis determined in accordance with the Servicing Standard and (z) such modification, waiver or amendment does not result in a tax being imposed on the Trust Fund or cause any REMIC relating to the assets of the Trust Fund to fail to qualify as a REMIC at any time the Certificates are outstanding. In no event, however, is the Special Servicer permitted to (i) extend the maturity date of a Mortgage Loan beyond a date th at is two years prior to the Rated Final Distribution Date, (ii) reduce the Mortgage Rate of a Mortgage Loan to less than the lesser of (a) the original Mortgage Rate of such Mortgage Loan, (b) the highest Pass-Through Rate of any Class of Certificates (other than the Class IO Certificates) then outstanding, or (c) a rate below the then prevailing interest rate for comparable loans, as determined by the Special Servicer, (iii) if the Mortgage Loan is secured by a ground lease (and not also by the corresponding fee simple interest), extend the maturity date of such Mortgage Loan beyond a date which is 20 years prior to the expiration of the term of such ground lease or (iv) defer interest due on any Mortgage Loan in excess of 10% of the Stated Principal Balance of such Mortgage Loan or defer the collection of interest on any Mortgage Loan without accruing interest on such deferred interest at a rate at least equal to the Mortgage Rate of such Mortgage Loan. The Special Servicer will have the ability, subject to the Servicing Standard described under ‘‘—General’’ above, to modify Mortgage Loans with respect to which default is reasonably foreseeable, but which are not yet in default.
The Special Servicer is required to notify the Trustee, the Master Servicer, the Controlling Class Representative and the Rating Agencies and, with respect to the Co-Lender Loans (other than the Beacon D.C. & Seattle Pool Loan and, after the securitization of the DDR Southeast Pool Pari Passu Note A-1 Companion Loan, the DDR Southeast Pool Loan), subject to certain rights of the holders of the related Companion Loans, of any material modification, waiver or amendment of any term of any Specially Serviced Mortgage Loan, and to deliver to the Trustee or the related Custodian (with a copy to the Master Servicer), for deposit in the related Mortgage File, an original counterpart of the agreement related to such modification, waiver or amendment, promptly (and in any event within ten business days) following the execution thereof. Copies of each agreement whereby any such modification, waiver or amendment of any term of any Specially Serviced Mortgage Loan is eff ected are required to be available for review during normal business hours at the offices of the Special Servicer. See ‘‘DESCRIPTION OF THE CERTIFICATES—Reports to Certificateholders; Available Information’’ in this prospectus supplement.
For any Mortgage Loan other than a Specially Serviced Mortgage Loan, and subject to the rights of the Special Servicer, and, with respect to the Co-Lender Loans, subject to certain rights of the holders of the related Companion Loans, the Master Servicer is responsible for any request by a borrower for the consent to modify, waive or amend certain terms as specified in the Pooling and Servicing Agreement, including, without limitation, (i) approving certain leasing activities subject to certain thresholds as more particularly set forth in the Pooling and Servicing Agreement, (ii) approving certain substitute property managers, (iii) approving certain waivers regarding the timing or need to audit certain financial statements, (iv) approving certain modifications in connection with a defeasance permitted by the terms of the applicable Mortgage Loan documents and (v) approving certain consents with respect to
S-155
non-material rights-of-way and easements and consents to subordination of the related Mortgage Loan to such non-material easements or rights-of-way as more specifically set forth in the Pooling and Servicing Agreement.
Generally, any modification, extension, waiver or amendment of the payment terms of a Co-Lender Loan will be required to be structured so as to be consistent with the allocation and payment priorities in the related Mortgage Loan documents and the related Intercreditor Agreement, such that neither the Trust Fund as holder of the Co-Lender Loan, nor the holder(s) of the related Companion Loans gain a priority over the other such holder that is not reflected in the related Mortgage Loan documents and the related Intercreditor Agreement.
The Controlling Class Representative
Subject to the succeeding paragraphs, and other than with respect to the Beacon D.C. & Seattle Pool Loan and, after the securitization of the DDR Southeast Pool Pari Passu Note A-1 Companion Loan, the DDR Southeast Pool Loan, the Controlling Class Representative is entitled to advise the Special Servicer with respect to the following actions of the Special Servicer, and the Special Servicer is not permitted to take any of the following actions as to which the Controlling Class Representative has objected in writing within ten business days of being notified thereof (provided that if such written objection has not been received by the Special Servicer within such ten business day period, then the Controlling Class Representative’s approval will be deemed to have been given):
(i) any actual or proposed foreclosure upon or comparable conversion (which may include acquisitions of an REO Property) of the ownership of properties securing such of the Specially Serviced Mortgage Loans as come into and continue in default;
(ii) any modification or waiver of any term of the related Mortgage Loan documents of a Mortgage Loan that relates to the Maturity Date, Mortgage Rate, principal balance, amortization term, payment frequency or any provision requiring the payment of a Prepayment Premium or Yield Maintenance Charge (other than a modification consisting of the extension of the maturity date of a Mortgage Loan for one year or less) or a material non-monetary term;
(iii) any actual or proposed sale of an REO Property (other than in connection with the termination of the Trust Fund as described under ‘‘DESCRIPTION OF THE CERTIFICATES—Termination’’ in this prospectus supplement or pursuant to a Purchase Option as described below under ‘‘—Defaulted Mortgage Loans; REO Properties; Purchase Option’’);
(iv) any determination to bring an REO Property into compliance with applicable environmental laws or to otherwise address hazardous materials located at an REO Property;
(v) any acceptance of substitute or additional collateral or release of material collateral for a Mortgage Loan unless required by the underlying Mortgage Loan documents;
(vi) any waiver of a ‘‘due-on-sale’’ or ‘‘due-on-encumbrance’’ clause;
(vii) any release of any performance or ‘‘earn-out’’ reserves, escrows or letters of credit;
(viii) any acceptance of an assumption agreement releasing a borrower from liability under a Mortgage Loan (other than in connection with a defeasance permitted under the terms of the applicable Mortgage Loan documents);
(ix) any termination of, or modification of, any applicable franchise agreements related to a Mortgage Loan secured by a hotel;
(x) any termination of the related property manager for Mortgage Loans having an outstanding principal balance of greater than $5,000,000;
(xi) any determination to allow a borrower not to maintain terrorism or, to the extent provided in the Pooling and Servicing Agreement, windstorm insurance; and
(xii) any determination to decrease the time period referenced in clause (g) of the definition of Servicing Transfer Event.
S-156
In addition, the Controlling Class Representative may direct the Special Servicer to take, or to refrain from taking, such other actions as the Controlling Class Representative may deem advisable or as to which provision is otherwise made in the Pooling and Servicing Agreement; provided that no such direction and no objection contemplated by the prior paragraph may (i) require or cause the Special Servicer to violate any REMIC provisions, any provision of the Pooling and Servicing Agreement or applicable law, including the Special Servicer’s obligation to act in accordance with the Servicing Standard, or (ii) expose the Master Servicer, the Special Servicer, the Trust Fund or the Trustee to liability, or materially expand the scope of the Special Servicer or its responsibilities under the Pooling and Servicing Agreement or cause the Special Servicer to act or fail to act in a manner which, in the reasonable judgment of the Special Servicer, is not in the best interests of the Certificateholders. American Capital Strategies, Ltd. will be the initial Controlling Class Representative.
Pursuant to the Morgan Stanley 2007-IQ14 Pooling and Servicing Agreement and the Beacon D.C. & Seattle Pool Intercreditor Agreement, with respect to the Beacon D.C. & Seattle Pool Loan, the Controlling Class Representative will have certain consultation rights it exercises with the controlling class representative under the Morgan Stanley 2007-IQ14 Pooling and Servicing Agreement (the ‘‘Morgan Stanley 2007-IQ14 Controlling Class Representative’’) in connection with the rights given to the Morgan Stanley 2007-IQ14 Controlling Class Representative under the Morgan Stanley 2007-IQ14 Pooling and Servicing Agreement to direct the Morgan Stanley 2007-IQ14 Master Servicer and/or Morgan Stanley 2007-IQ14 Special Servicer with respect to the servicing of the Beacon D.C. & Seattle Pool Loan and the relate d Pari Passu Companion Loans. In general, in the event that the Morgan Stanley 2007-IQ14 Controlling Class Representative is required to give its consent or advice or otherwise take any action with respect to the Beacon D.C. & Seattle Pool Loan, the Morgan Stanley 2007-IQ14 Controlling Class Representative will generally be required to confer with the Controlling Class Representative regarding such advice or consent. In the event that the Morgan Stanley 2007-IQ14 Controlling Class Representative and the Controlling Class Representative disagree with respect to such advice, consent or action, the Beacon D.C. & Seattle Pool Intercreditor Agreement and the Morgan Stanley 2007-IQ14 Pooling and Servicing Agreement provide that the decision of the Morgan Stanley 2007-IQ14 Controlling Class Representative will control in the event such disagreement is not resolved within 10 business days.
Pursuant to the CGCMT 2007-C6 Pooling and Servicing Agreement and the DDR Southeast Pool Intercreditor Agreement, with respect to the DDR Southeast Pool Loan, the Controlling Class Representative will have certain consultation rights it exercises with the controlling class representative under the CGCMT 2007-C6 Pooling and Servicing Agreement (the CGCMT 2007-C6 Controlling Class Representative’’) in connection with the rights given to the CGCMT 2007-C6 Controlling Class Representative under the CGCMT 2007-C6 Pooling and Servicing Agreement to direct the CGCMT 2007-C6 Master Servicer and/or CGCMT 2007-C6 Special Servicer with respect to the servicing of the DDR Southeast Pool Loan and the related Pari Passu Companion Loans. In general, in the event that the CGCMT 2007-C6 Controlling Class Representative is required to give its consent or advice or otherwise take any action with respect to the DDR S outheast Pool Loan, the CGCMT 2007-C6 Controlling Class Representative will generally be required to confer on a non-binding basis with the Controlling Class Representative regarding such advice or consent. In the event that the CGCMT 2007-C6 Controlling Class Representative and the Controlling Class Representative disagree with respect to such advice, consent or action, the DDR Southeast Pool Intercreditor Agreement and the CGCMT 2007-C6 Pooling and Servicing Agreement provide that the decision of the CGCMT 2007-C6 Controlling Class Representative will control in the event such disagreement is not resolved within 10 business days.
In addition, the holders of the related Caplease Subordinate Companion Loans may exercise certain approval rights relating to modification of the related Caplease Subordinate Companion Loans that materially and adversely affects the holders of the related Caplease Subordinate Companion Loans prior to the expiration of the related repurchase period. In addition, the holders of the related Caplease Subordinate Companion Loans may exercise certain approval rights relating to a modification of the Caplease Loan or related Caplease Subordinate Companion Loans that materially and adversely affects the holders of the related Caplease Subordinate Companion Loans and certain other matters
S-157
related to Defaulted Lease Claims. See ‘‘DESCRIPTION OF THE MORTGAGE POOL—Co-Lender Loans—The Caplease Loan—Servicing Provisions of the Caplease Intercreditor Agreement’’ in this prospectus supplement.
Further, notwithstanding any of the control rights of the holders of the Subordinate Companion Loans described above, generally no such control rights contemplated by the prior paragraphs may require or cause the Master Servicer or Special Servicer, as applicable, to violate any REMIC regulations, any provision of the Pooling and Servicing Agreement or applicable law, including the Master Servicer’s or Special Servicer’s obligation to act in accordance with the Servicing Standard.
Limitation on Liability of the Controlling Class Representative. The Controlling Class Representative will not have any liability to the Certificateholders for any action taken, or for refraining from the taking of any action, or for errors in judgment; provided, however, the Controlling Class Representative will not be protected against any liability to a Controlling Class Certificateholder which would otherwise be imposed by reason of willful misfeasance, bad faith or negligence in the performance of duties or by reason of reckless disregard of oblig ations or duties. By its acceptance of a Certificate, each Certificateholder confirms its understanding that the Controlling Class Representative may take actions that favor the interests of one or more Classes of the Certificates over other Classes of the Certificates, and that the Controlling Class Representative may have special relationships and interests that conflict with those of holders of some Classes of the Certificates; and each Certificateholder agrees to take no action against the Controlling Class Representative or any of its respective officers, directors, employees, principals or agents as a result of such a special relationship or conflict. Generally, the holders of the Subordinate Companion Loans or their respective designees, in connection with exercising the rights and powers described above with respect to the related Co-Lender Loan will be entitled to substantially the same liability limitations to which the Controlling Class Representative is entitled.
Defaulted Mortgage Loans; REO Properties; Purchase Option
The Pooling and Servicing Agreement contains provisions requiring, within 60 days after a Mortgage Loan (other than the Beacon D.C. & Seattle Pool Loan and, after the securitization of the DDR Southeast Pool Pari Passu Note A-1 Companion Loan, the DDR Southeast Pool Loan) becomes a Defaulted Mortgage Loan, the Special Servicer to determine the fair value of the Mortgage Loan in accordance with the Servicing Standard. The Beacon D.C. & Seattle Pool Loan will be serviced under the Morgan Stanley 2007-IQ14 Pooling and Servicing Agreement and any actions taken following a default will be in accordance with the terms thereof. See ‘‘—Servicing of the Beacon D.C. & Seattle Pool Loan’’ in this prospectus supplement. After the securitization of the DDR Southeast Pool Pari Passu Note A-1 Companion Loan, DDR Southeast Pool Loan will be serviced under the CGCMT 2007-C6 Pooling and Servicing Agreement and any actions taken follo wing a default will be in accordance with the terms thereof. See ‘‘—Servicing of the DDR Southeast Pool Loan’’ in this prospectus supplement. A ‘‘Defaulted Mortgage Loan’’ is a Mortgage Loan (i) that is delinquent 60 days or more with respect to a Periodic Payment (not including the Balloon Payment) or (ii) that is delinquent in respect of its Balloon Payment; provided, however, if the borrower continues to make its Assumed Scheduled Payment and diligently pursues refinancing, such Mortgage Loan shall not be considered a Defaulted Mortga ge Loan until 60 days following such default (or, if the Master Servicer has, within 60 days after the Due Date of such Balloon Payment, received written evidence from an institutional lender of such lender’s binding commitment (which is reasonably acceptable to the Special Servicer and the Controlling Class Representative has given its consent (which consent shall be deemed denied if not granted within 10 Business Days)) to refinance such Mortgage Loan, 120 days following such default) (provided that if such refinancing does not occur during such time specified in the commitment, the related Mortgage Loan will immediately become a Defaulted Mortgage Loan), in either case such delinquency to be determined without giving effect to any grace period permitted by the related Mortgage Loan documents and without regard to any acceleration of paymen ts under the related Mortgage and Mortgage Note or (iii) as to which the Master Servicer or Special Servicer has, by written notice to the related mortgagor, accelerated the maturity of the indebtedness evidenced by the related Mortgage Note. The Special Servicer will be permitted to change, from time to time, its determination of the fair value of a Defaulted Mortgage Loan based upon changed circumstances, new information or otherwise, in accordance with the Servicing
S-158
Standard; provided, however, the Special Servicer will update its determination of the fair value of a Defaulted Mortgage Loan at least once every 90 days.
In the event a Mortgage Loan becomes a Defaulted Mortgage Loan, the Majority Subordinate Certificateholder will have an assignable option to purchase (subject to, in certain instances, the rights of subordinated secured creditors or mezzanine lenders to purchase the related Mortgage Loan, see ‘‘DESCRIPTION OF THE MORTGAGE POOL—Certain Provisions of the Intercreditor Agreements with Respect to Certain Subordinate Loans’’) (the ‘‘Purchase Option’’) the Defaulted Mortgage Loan from the Trust Fund at a price (the ‘‘Option Price’’) equal to (i) the outstanding principal balance of the Defaulted Mortgage Loan as of the date of purchase, plus all accrued and unpaid interest on such balance plus all related fees and expenses, if the Special Servicer has not yet determined the fair value of the Defaulted Mortgage Loan, or (ii) the fair value of the Defaulted Mortgage Loan as determined by the Special Servicer, if the Special Servicer has made such fair value determination. If the Purchase Option is not exercised by the Majority Subordinate Certificateholder or any assignee thereof within 60 days of a Mortgage Loan becoming a Defaulted Mortgage Loan, then the Majority Subordinate Certificateholder shall assign the Purchase Option to the Special Servicer for 15 days. If the Purchase Option is not exercised by the Special Servicer or its assignee within such 15&nbs p;day period, then the Purchase Option shall revert to the Majority Subordinate Certificateholder.
Unless and until the Purchase Option with respect to a Defaulted Mortgage Loan is exercised, the Special Servicer will be required to pursue such other resolution strategies available under the Pooling and Servicing Agreement, including workout and foreclosure, consistent with the Servicing Standard, but the Special Servicer generally will not be permitted to sell the Defaulted Mortgage Loan other than pursuant to the exercise of the Purchase Option.
If not exercised sooner, the Purchase Option with respect to any Defaulted Mortgage Loan will automatically terminate upon (i) the related mortgagor’s cure of all defaults on the Defaulted Mortgage Loan, (ii) the acquisition on behalf of the Trust Fund of title to the related Mortgaged Property by foreclosure or deed in lieu of foreclosure or (iii) the modification or pay-off (full or discounted) of the Defaulted Mortgage Loan in connection with a workout. In addition, the Purchase Option with respect to a Defaulted Mortgage Loan held by any person will terminate upon the exercise of the Purchase Option by any other holder of the Purchase Option.
If (a) the Purchase Option is exercised with respect to a Defaulted Mortgage Loan and the person expected to acquire the Defaulted Mortgage Loan pursuant to such exercise is the Majority Subordinate Certificateholder, the Special Servicer, or any affiliate of any of them (in other words, the Purchase Option has not been assigned to another unaffiliated person) and (b) the Option Price is based on the Special Servicer’s determination of the fair value of the Defaulted Mortgage Loan, the Trustee will be required to determine if the Option Price represents a fair price for the Defaulted Mortgage Loan. In making such determination, the Trustee will be entitled to rely on the most recent appraisal of the related Mortgaged Property that was prepared in accordance with the terms of the Pooling and Servicing Agreement and may rely upon the opinion and report of an independent third-party in making such determination, the cost of which will be advanced by the Master Servicer.
If title to any Mortgaged Property is acquired by the Trustee on behalf of the Certificateholders pursuant to foreclosure proceedings instituted by the Special Servicer or otherwise, the Special Servicer, after notice to the Controlling Class Representative, shall use its reasonable best efforts to sell any REO Property as soon as practicable in accordance with the Servicing Standard but prior to the end of the third calendar year following the year of acquisition, unless (i) the Internal Revenue Service grants an extension of time to sell such property (an ‘‘REO Extension’’) or (ii) it obtains an opinion of counsel generally to the effect that the holding of the property for more than 3 years after the end of the calendar year in which it was acquired will not result in the imposition of a tax on the Trust Fun d or cause any REMIC relating to the assets of the Trust Fund to fail to qualify as a REMIC under the Code. If the Special Servicer on behalf of the Trustee has not received an Extension or such opinion of counsel and the Special Servicer is not able to sell such REO Property within the period specified above, or if an REO Extension has been granted and the Special Servicer is unable to sell such REO Property within the extended time period, the Special Servicer shall auction the property pursuant to the auction procedure set forth below.
S-159
The Special Servicer shall give the Controlling Class Representative, the Master Servicer and the Trustee not less than 5 days’ prior written notice of its intention to sell any such REO Property, and shall auction the REO Property to the highest bidder (which may be the Special Servicer) in accordance with the Servicing Standard; provided, however, the Master Servicer, Special Servicer, Majority Subordinate Certificateholder, any independent contractor engaged by the Master Servicer or the Special Servicer pursuant to the Pooling and Servicing Agreement (or any officer or affiliate thereof) shall not be permitted to purchase the REO Property at a price less th an the outstanding principal balance of such Mortgage Loan as of the date of purchase, plus all accrued but unpaid interest and related fees and expenses, except in limited circumstances set forth in the Pooling and Servicing Agreement; provided, further, if the Special Servicer intends to bid on any REO Property, (i) the Special Servicer shall notify the Trustee of such intent, (ii) the Trustee shall promptly obtain, at the expense of the Trust Fund an appraisal of such REO Property (or internal valuation in accordance with the procedures specified in the Poolin g and Servicing Agreement) and (iii) the Special Servicer shall not bid less than the greater of (x) the fair market value set forth in such appraisal (or internal valuation) or (y) the outstanding principal balance of such Mortgage Loan, plus all accrued but unpaid interest and related fees and expenses.
Subject to the REMIC provisions, the Special Servicer shall act on behalf of the Trust Fund in negotiating and taking any other action necessary or appropriate in connection with the sale of any REO Property or the exercise of the Purchase Option, including the collection of all amounts payable in connection therewith. Notwithstanding anything to the contrary herein, neither the Trustee, in its individual capacity, nor any of its affiliates may bid for any REO Property or purchase any Defaulted Mortgage Loan. Any sale of a Defaulted Mortgage Loan (pursuant to the Purchase Option) or REO Property shall be without recourse to, or representation or warranty by, the Trustee, the Depositor, any Mortgage Loan Seller, the Special Servicer, the Master Servicer or the Trust Fund. Notwithstanding the foregoing, nothing herein shall limit the liability of the Master Servicer, the Special Servicer or the Trustee to the Trust Fund and the Certificateholders for failure to pe rform its duties in accordance with the Pooling and Servicing Agreement. None of the Special Servicer, the Master Servicer, the Depositor or the Trustee shall have any liability to the Trust Fund or any Certificateholder with respect to the price at which a Defaulted Mortgage Loan is sold if the sale is consummated in accordance with the terms of the Pooling and Servicing Agreement. The proceeds of any sale after deduction of the expenses of such sale incurred in connection therewith shall be deposited within one business day in the Certificate Account.
If the Trust Fund acquires a Mortgaged Property by foreclosure or deed-in-lieu of foreclosure upon a default with respect to a Mortgage Loan, the Pooling and Servicing Agreement provides that the Special Servicer, on behalf of the Trustee, must administer such Mortgaged Property so that the Trust Fund’s interest therein qualifies at all times as ‘‘foreclosure property’’ within the meaning of Code Section 860G(a)(8). The Pooling and Servicing Agreement also requires that any such Mortgaged Property be managed and operated by an ‘‘independent contractor,’’ within the meaning of applicable Treasury regulations, who furnishes or renders services to the tenants of such Mortgaged Property. Generally, REMIC I will not be taxable on income received with respect to a related Mortgaged Property to the extent that it constitutes ‘‘rents from real property,’’ within the meaning of Code Sectio n 856(c)(3)(A) and Treasury regulations thereunder. ‘‘Rents from real property’’ do not include the portion of any rental based on the net income or gain of any tenant or sub-tenant. No determination has been made whether rent on any of the Mortgaged Properties meets this requirement. ‘‘Rents from real property’’ include charges for services customarily furnished or rendered in connection with the rental of real property, whether or not the charges are separately stated. Services furnished to the tenants of a particular building will be considered as customary if, in the geographic market in which the building is located, tenants in buildings which are of a similar class are customarily provided with the service. No determination has been made whether the services furnished to the tenants of the Mortgaged Properties are ‘‘customary’’ within the meaning of applicable regulations. It is therefore possible that a portion of the rental income with respect to a Mortgaged Property owned by REMIC I would not constitute ‘‘rents from real property,’’ or that all of such income would not qualify, if a separate charge is not stated for such services or they are not performed by an independent contractor. In addition to the foregoing, any net income from a trade or business operated or managed by an independent contractor on a Mortgaged Property owned by REMIC I, or gain on a sale of a Mortgaged Property (including condominium units to
S-160
customers in the ordinary course of a trade or business), will not constitute ‘‘rents from real property’’. Any of the foregoing types of income may instead constitute ‘‘net income from foreclosure property’’, which would be taxable to REMIC I, at the highest marginal federal corporate rate (currently 35%) and may also be subject to state or local taxes. Any such taxes would be chargeable against the related income for purposes of determining the proceeds available for distribution to holders of Certificates. The Pooling and Servicing Agreement provides that the Special Servicer will be permitted to cause REMIC I, to earn ‘‘net income from foreclosure property’’ that is subject to tax if it determines that the net after-tax benefit to Certificateholders and the holders of the related Companion Loans could reasonably be expected to result in a greater recovery than another method of operation or rental of the Mortgaged Property. See &lsqu o;‘MATERIAL FEDERAL INCOME TAX CONSEQUENCES’’ in this prospectus supplement.
Inspections; Collection of Operating Information
The Special Servicer is required to perform or cause to be performed a physical inspection of a Mortgaged Property (other than the Mortgaged Property related to the Beacon D.C. & Seattle Pool Loan and, after the securitization of the DDR Southeast Pool Pari Passu Note A-1 Companion Loan, the DDR Southeast Pool Loan) as soon as practicable after the related Mortgage Loan becomes a Specially Serviced Mortgage Loan, and the Master Servicer (in the case of each Mortgaged Property securing a Mortgage Loan other than a Specially Serviced Mortgage Loan and other than the Beacon D.C. & Seattle Pool Loan and, after the securitization of the DDR Southeast Pool Pari Passu Note A-1 Companion Loan, the DDR Southeast Pool Loan) or the Special Servicer (in the case of Specially Serviced Mortgage Loans but other than the Beacon D.C. & Seattle Pool Loan and, after the securitization of the DDR Southeast Pool Pari Passu Note A-1 Companion Loan, the DDR Southeast Pool Loan) shall perform or cause to be performed a physical inspection of a Mortgaged Property as soon as the related debt service coverage ratio is below 1.00x; provided, however, with respect to inspections prepared by the Special Servicer, such expense will be payable first, out of penalty interest and late payment charges otherwise payable to the Special Servicer and received in the Collection Period during which such inspection related expenses were incurred, then at the Trust Fund’s expense. The Special Servicer and the Master Servicer each will be required to prepare a written report of each such inspection performed by it that describes the condition of the Mortgaged Property and that specifies the existence with respect thereto of any sale, transfer or abandonment or any material change in its condition or value.
The Special Servicer with respect to Specially Serviced Mortgage Loans and REO Properties or the Master Servicer with respect to all other Mortgage Loans is also required consistent with the Servicing Standard to collect from the related borrower and review the quarterly and annual operating statements of each Mortgaged Property (other than the Mortgaged Property related to the Beacon D.C. & Seattle Pool Loan and, after the securitization of the DDR Southeast Pool Pari Passu Note A-1 Companion Loan, the Mortgaged Property related to the DDR Southeast Pool Loan) and to cause annual operating statements to be prepared for each REO Property. Generally, the Mortgage Loans require the related borrower to deliver an annual property operating statement. However, there can be no assurance that any operating statements required to be delivered will in fact be delivered, nor is the Master Servicer or Special Servicer likely to have any practical means of compelli ng such delivery in the case of an otherwise performing Mortgage Loan.
Copies of the inspection reports and operating statements referred to above are required to be available for review by Certificateholders during normal business hours at the offices of the Special Servicer or the Master Servicer, as applicable. See ‘‘DESCRIPTION OF THE CERTIFICATES—Reports to Certificateholders; Available Information’’ in this prospectus supplement.
S-161
Description of the Certificates
General
The Wachovia Bank Commercial Mortgage Trust, Commercial Mortgage Pass-Through Certificates, Series 2007-C32 (the ‘‘Certificates’’) will be issued pursuant to a pooling and servicing agreement, dated as of June 1, 2007, among the Depositor, the Master Servicer, the Special Servicer and the Trustee (the ‘‘Pooling and Servicing Agreement’’). The Certificates represent in the aggregate the entire beneficial ownership interest in a trust fund (the ‘‘Trust Fund’’) consisting primarily of: (i) the Mortgage Loans and all payments and other collec tions in respect of such loans received or applicable to periods after the applicable Cut-Off Date (exclusive of payments of principal and interest due, and principal prepayments received, on or before the Cut-Off Date); (ii) any REO Property acquired on behalf of the Trust Fund; (iii) such funds or assets as from time to time are deposited in the Certificate Account, the Distribution Account, the REO accounts, the Additional Interest Account, the Gain-on-Sale Reserve Account and the Interest Reserve Account (see ‘‘DESCRIPTION OF THE POOLING AND SERVICING AGREEMENTS—Certificate Account’’ in the prospectus); (iv) certain rights of the Depositor under each Mortgage Loan Purchase Agreement relating to Mortgage Loan document delivery requirements and the representations and warranties of the Mortgage Loan Sellers regarding the Mortgage Loans; and (v) the swap contracts with respect to the Class A-4FL Regular Interest and the Class A-MFL Regular Interest.
The Certificates consist of the following classes (each, a ‘‘Class’’) designated as: (i) the Class A-1, Class A-2, Class A-PB, Class A-3, and Class A-1A Certificates (collectively, the ‘‘Class A Certificates’’); (ii) the Class A-J, Class B, Class C, Class D, Class E, Class F, Class G, Class H, Class J, Class K, Class L, Class M, Class N, Class O, Class P, Class Q and Class S Certificates (collectively, the ‘‘Subordinate Certificates’’ and, together with the Class A Certificates, the ‘‘Sequential Pay Certificates’’); (iii) the Class IO Certificates (collectively, with the Sequential Pay Certificates, the ‘‘Regular Certificates’’); (iv) the Class R-I and Class R-II Certificates (together, the ‘‘REMIC Residual Certificates’’); and (v) the Class Z Certificates.
Only the Class A-1, Class A-2, Class A-PB, Class A-3, Class A-1A, Class IO, Class A-J, Class B, Class C, Class D, Class E, and Class F Certificates (collectively, the ‘‘Offered Certificates’’) are offered by this prospectus supplement. The Class G, Class H, Class J, Class K, Class L, Class M, Class N, Class O, Class P, Class Q and Class S Certificates (collectively, the ‘‘Non-Offered Certificates’’), the Class Z Certificates and the REMIC Residual Certificates have not been registered under the Securities Act of 1933, as amended (the ‘‘Securities Act’’) and are not offered by this prospectus supplement. On the Closing Date, the Depositor will transfer the REMIC Residual Certificates to Wachovia Bank, National Association, a Sponsor, pursuant to that certain Transfer Affidavit and Agreement (the ‘‘Transfer Affidavit and Agreement’’), but the REMIC Residual Certificates may be sold or otherwise transferred to another person at any time subject to any applicable transfer restrictions. Accordingly, information in this prospectus supplement regarding the terms of the Non-Offered Certificates, the Class Z Certificates and the REMIC Residual Certificates is provided solely because of its potential relevance to a prospective purchaser of an Offered Certificate.
On the Closing Date, the ‘‘Class A-4FL Regular Interest’’ and the ‘‘Class A-MFL Regular Interest’’ will also be issued by the Trust Fund as uncertificated regular interests in one of the REMICs. The Class A-4FL Regular Interest and Class A-MFL Regular Interest are not being offered by this prospectus supplement. The Issuer is separately offering to private investors in a Rule 144A offering one or more component certificates or other interests based on the Class A-4FL Regular Interest and the Class A-MFL Regular Interest, respectively.
The Issuing Entity
The Issuing Entity will be a common law trust, created under the laws of the State of New York, formed on the Closing Date pursuant to the Pooling and Servicing Agreement. The Issuing Entity is also sometimes referred to herein as the Trust Fund. The assets of the Trust Fund will constitute the only assets of the Issuing Entity. The Issuing Entity will have no officers or directors and no continuing duties other
S-162
than to hold the assets underlying the Certificates and to issue the Certificates; and except for these activities, the issuing entity will not be authorized and will have no power to borrow money or issue debt, merge with another entity, reorganize, liquidate or sell assets or engage in any business or activities. The Issuing Entity will operate under a fiscal year ending each December 31st. The Trustee, the Master Servicer and the Special Servicer are the persons authorized to act on behalf of the Issuing Entity under the Pooling and Servicing Agreement with respect to the Mortgage Loans and the Certificates. The roles and responsibilities of the foregoing are described in this prospectus supplement under ‘‘SERVICING OF THE MORTGAGE LOANS—The Master Servicer’’, ‘‘—The Special Servicer’’ and ‘‘DESCRIPTION OF THE CERTIFICATES—The Trustee’’. Additional information may also be found in the accompanying prospectus und er ‘‘DESCRIPTION OF THE POOLING AND SERVICING AGREEMENTS’’.
Since the Issuing Entity is a common law trust, it may not be eligible for relief under the federal bankruptcy laws, unless it can be characterized as a ‘‘business trust’’ for purposes of the federal bankruptcy laws. Bankruptcy courts look at various considerations in making this determination, so it is not possible to predict with any certainty whether or not the Issuing Entity would be characterized as a ‘‘business trust.’’ The Depositor has been formed as a bankruptcy remote special purpose entity. In connection with the sale of the Mortgage Loans from each Mortgage Loan Seller to the Depositor and from the Depositor to the Trust Fund, certain legal opinions are required.
Accordingly, although the transfer of the underlying Mortgage Loans from each Mortgage Loan Seller to the Depositor and from the Depositor to the Trust Fund has been structured as a sale, there can be no assurance that the sale of the underlying Mortgage Loans will not be recharacterized as a pledge, with the result that the Depositor or Trust Fund is deemed to be a creditor of the related Mortgage Loan Seller rather than an owner of the Mortgage Loans. See ‘‘RISK FACTORS—The Offered Certificates —The Mortgage Loan Sellers, the Depositor and the Issuing Entity Are Subject to Bankruptcy or Insolvency Laws That May Affect the Trust Fund’s Ownership of the Mortgage Loans’’ in this prospectus supplement.
Registration and Denominations
The Offered Certificates will be made available in book-entry format through the facilities of The Depository Trust Company (‘‘DTC’’). The Offered Certificates (other than the Class IO Certificates) will be offered in denominations of not less than $10,000 actual principal amount and in integral multiples of $1 in excess thereof. The Class IO Certificates will be offered in notional amounts of not less than $1,000,000 actual notional amount and in integral multiples of $1 in excess thereof.
S-163
Certificate Balances and Notional Amount
Subject to a permitted variance of plus or minus 5.0%, the respective Classes of Sequential Pay Certificates and the Class A-4FL Regular Interest and Class A-MFL Regular Interest described below will have the Certificate Balances or Notional Amount representing the approximate percentage of the Cut-Off Date Pool Balance as set forth in the following table:
| Class of Certificates | Closing Date Certificate Balance or Notional Amount | Percentage of Cut-Off Date Pool Balance | ||||||||||
| Class A-1 Certificates | $ | 25,707,000 | 0.672 | % | ||||||||
| Class A-2 Certificates | $ | 946,379,000 | 24.749 | % | ||||||||
| Class A-PB Certificates | $ | 62,827,000 | 1.643 | % | ||||||||
| Class A-3 Certificates | $ | 948,589,000 | 24.807 | % | ||||||||
| Class A-1A Certificates | $ | 443,196,000 | 11.590 | % | ||||||||
| Class IO Certificates | $ | 3,823,853,068 | N/A | |||||||||
| Class A-J Certificates | $ | 253,330,000 | 6.625 | % | ||||||||
| Class B Certificates | $ | 43,019,000 | 1.125 | % | ||||||||
| Class C Certificates | $ | 47,798,000 | 1.250 | % | ||||||||
| Class D Certificates | $ | 28,679,000 | 0.750 | % | ||||||||
| Class E Certificates | $ | 28,679,000 | 0.750 | % | ||||||||
| Class F Certificates | $ | 38,238,000 | 1.000 | % | ||||||||
| Non-offered certificates (other than the Class R-I, Class R-II and Class Z Certificates) | $ | 957,412,068 | 25.038 | % | ||||||||
The ‘‘Certificate Balance’’ of any Class of Sequential Pay Certificates and the Class A-4FL Regular Interest and Class A-MFL Regular Interest outstanding at any time represents the maximum amount that the holders thereof are entitled to receive as distributions allocable to principal from the cash flow on the Mortgage Loans and the other assets in the Trust Fund. The Certificate Balance of each Class of Sequential Pay Certificates and the Class A-4FL Regular Interest and Class A-MFL Regular Interest in each case, will be reduced on each Distribution Date by any distributions of principal actually made on such Class of Certificates or the Class A-4FL Regular Interest or Class A-MFL Regular Interest on such Distribution Date, and further by any Realized Losses and Additional Trust Fund Expenses actually alloc ated to such Class of Certificates or the Class A-4FL or Class A-MFL Regular Interest on such Distribution Date. The Certificate Balance of certain beneficial interests in the Class A-4FL Regular Interest or Class A-MFL Regular Interest, respectively, will be reduced on each Distribution Date by an amount corresponding to any such reduction in the Certificate Balance of the Class A-4FL Regular Interest or Class A-MFL Regular Interest, respectively.
The Class IO Certificates do not have a Certificate Balance, but represent the right to receive the distributions of interest in an amount equal to the aggregate interest accrued on its notional amount (the ‘‘Notional Amount’’). The Class IO Certificates have 26 separate components (each, a ‘‘Component’’), each corresponding to a different Class of Sequential Pay Certificates or the Class A-4FL or the Class A-MFL Regular Interests. Each such Component has the same letter and/or numerical designation as its related Class of Sequential Pay Certificates or the Class A-4FL Regular Interest or the Class A-MFL Regular Interest, as applicable. The component balance (the &lsquo ;‘Component Balance’’) of each Component will equal the Certificate Balance of the corresponding Class of Sequential Pay Certificates or the Class A-4FL Regular Interest or the Class A-MFL Regular Interest, as applicable, outstanding from time to time.
On each Distribution Date, the Notional Amount of the Class IO Certificates will be equal to the aggregate outstanding Component Balances of the Components on such date. The initial Notional Amount of the Class IO Certificates will equal approximately $3,823,853,068 (subject to a permitted variance of plus or minus 5.0%).
The Certificate Balance of any Class of Sequential Pay Certificates and the Class A-4FL Regular Interest or Class A-MFL Regular Interest may be increased by the amount, if any, of Certificate Deferred
S-164
Interest added to such Class Certificate Balance. With respect to any Mortgage Loan as to which the Mortgage Rate has been reduced through a modification on any Distribution Date, ‘‘Mortgage Deferred Interest’’ is the amount by which (a) interest accrued at such reduced rate is less than (b) the amount of interest that would have accrued on such Mortgage Loan at the Mortgage Rate before such reduction, to the extent such amount has been added to the outstanding principal balance of such Mortgage Loan.
On each Distribution Date, the amount of interest distributable to a Class of Sequential Pay Certificates and the Class A-4FL Regular Interest and Class A-MFL Regular Interest will be reduced by the amount of Mortgage Deferred Interest allocable to such Class (any such amount, ‘‘Certificate Deferred Interest’’). With respect to the Sequential Pay Certificates and the Class A-4FL Regular Interest and Class A-MFL Regular Interest, Certificate Deferred Interest will be allocated from lowest payment priority to highest (except with respect to the Class A-1, Class A-2, Class A-PB, Class A-3 and Class A-1A Certificates and the Class A-4FL Regular Interest, which amounts shall be applied pro rata (based on the Certificate Balances of the remaining Classes)) to such Classes. The Certificate Balance of each Class of Sequential Pay Certificates or the Class A-4FL Regular Interest and Class A-MFL Regular Interest to which Certificate Deferred Interest has been so allocated on a Distribution Date will be increased by the amount of Certificate Deferred Interest. Any increase in the Certificate Balance of a Class of Sequential Pay Certificates or the Class A-4FL Regular Interest and Class A-MFL Regular Interest will result in an increase in the Notional Amount of the Class IO Certificates.
The REMIC Residual Certificates do not have Certificate Balances or Notional Amounts, but represent the right to receive on each Distribution Date any portion of the Available Distribution Amount for such date that remains after the required distributions have been made on all the Regular Certificates and the Class A-4FL Regular Interest and Class A-MFL Regular Interest. It is not anticipated that any such portion of the Available Distribution Amount will result in more than a de minimis distribution to the REMIC Residual Certificates.
The Class Z Certificates do not have Certificate Balances or Notional Amounts, but represent the right to receive on each Distribution Date any amounts of Additional Interest received in the related Collection Period with respect to each ARD Loan.
Pass-Through Rates
The Pass-Through Rates applicable to each of the Class A-1, Class A-2, Class A-PB, Class A-3, Class A-1A, Class A-J, Class B, Class C, Class D, Class E and Class F Certificates for each Distribution Date will equal the respective rate per annum set forth on the front cover of this prospectus supplement and/or the corresponding footnotes. Each Component will be deemed to have a Pass-Through Rate equal to the Pass-Through Rate of the related Class of Certificates or the Class A-4FL Regular Interest or Class A-MFL Regular Interest.
The Pass-Through Rate applicable to the Class IO Certificates for each subsequent Distribution Date will, in general, equal the weighted average of the Strip Rates for the components (the ‘‘Components’’) for such Distribution Date (weighted on the basis of the respective Component Balances of such Components outstanding immediately prior to such Distribution Date). The ‘‘Strip Rate’’ in respect of any Class of Components for any Distribution Date will, in general, equal the Weighted Average Net Mortgage Rate for such Distribution Date, minus the Pass-Through Rate for the Class of Sequential Pay Certificates or the Class A-4FL Regular Interest or Class A-MFL Regular Interest, as applic able, corresponding to such Component (but in no event will any Strip Rate be less than zero).
In the case of each Class of Regular Certificates and the Class A-4FL Regular Interest and the Class A-MFL Regular Interest, interest at the applicable Pass-Through Rate will be payable monthly on each Distribution Date and will accrue during each Interest Accrual Period on the Certificate Balance (or, in the case of the Class IO Certificates, the Notional Amount) of such Class of Certificates or the Class A-4FL Regular Interest and Class A-MFL Regular Interest immediately following the Distribution Date in such Interest Accrual Period (after giving effect to all distributions of principal made on such Distribution Date). Interest on each Class of Regular Certificates and the Class A-4FL Regular Interest and Class A-MFL Regular Interest will be calculated on the basis of a 360-day year consisting of twelve 30-day months. With respect to any Class of Regular Certificates and the Class A-4FL Regular Interest
S-165
and Class A-MFL Regular Interest and any Distribution Date, the ‘‘Interest Accrual Period’’ will be the preceding calendar month, which will be deemed to consist of 30 days; provided, however, for purposes of the initial Interest Accrual Period, such period commences on the Cut-Off Date and continues through the calendar month preceding the month in which such Distribution Date occurs.
The Class Z Certificates will not have a Pass-Through Rate or be entitled to distributions in respect of interest other than Additional Interest with respect to the Mortgage Loans.
The ‘‘Weighted Average Net Mortgage Rate’’ for each Distribution Date is the weighted average of the Net Mortgage Rates for the Mortgage Loans as of the commencement of the related Collection Period, weighted on the basis of their respective Stated Principal Balances immediately following the preceding Distribution Date: provided that for the purpose of determining the Weighted Average Net Mortgage Rate only, if the Mortgage Rate for any Mortgage Loan has been modified in connection with a bankruptcy or similar proceeding involving the related borrower or a modification, waiver or amendment granted or agreed to by the Special Servicer, the Weighted Average Net Mortgage Rate for su ch Mortgage Loan will be calculated without regard to such event.
The ‘‘Net Mortgage Rate’’ for each Mortgage Loan will generally equal (x) the Mortgage Rate in effect for such Mortgage Loan (without regard to any increase in the interest rate of an ARD Loan as a result of not repaying the outstanding principal amount of such ARD Loan on or prior to the related Anticipated Repayment Date), minus (y) the applicable Administrative Cost Rate for such Mortgage Loan. Notwithstanding the foregoing, because no Mortgage Loan, other than 1 Mortgage Loan (loan number 11), representing 2.0% of the Cut-Off Date Pool Balance (2.2% of the Cut-Off Date Group 1 Balance), accrues interest on the basis of a 360-day year consisting of twelve 30-day months (which is the basis on which interest accrues in respect of the Regular Certificates and the Class A-4FL Regular Interest and Class A-MFL Regular Interest, then, solely for purposes of calculating the Weighted Average Net Mortgage Rate for each Distribution Date, the Mortgage Rate of each Mortgage Loan in effect during any calendar month will be deemed to be the annualized rate at which interest would have to accrue in respect of such loan on a 30/360 basis in order to derive the aggregate amount of interest (other than default interest) actually accrued in respect of such loan during such calendar month; provided, however, the Mortgage Rate in effect during (a) December of each year that does not imm ediately precede a leap year, and January of each year will be the per annum rate stated in the related Mortgage Note, unless the final Distribution Date occurs in January or February immediately following such December or January and (b) in February of each year (January if the final Distribution Date occurs in February) will be determined inclusive of the one day of interest retained from the immediately preceding January and, if applicable, December.
The ‘‘Stated Principal Balance’’ of each Mortgage Loan outstanding at any time will generally be an amount equal to the principal balance thereof as of the Cut-Off Date, (a) reduced on each Distribution Date (to not less than zero) by (i) the portion of the Principal Distribution Amount for that date which is attributable to such Mortgage Loan and (ii) the principal portion of any Realized Loss incurred in respect of such Mortgage Loan during the related Collection Period and (b) increased on each Distribution Date by any Mortgage Deferred Interest added to the principal balance of such Mortgage Loan on such Distribution Date. The Stated Principal Balance of a Mortgage Loan may also be reduced in connection with any forced reduction of the actual unpaid principal balance thereof imposed by a court presidin g over a bankruptcy proceeding in which the related borrower is a debtor. In addition, to the extent that principal from general collections is used to reimburse nonrecoverable Advances or Workout-Delayed Reimbursement Amounts, and such amount has not been included as part of the Principal Distribution Amount, such amount shall not reduce the Stated Principal Balance (other than for purposes of computing the Weighted Average Net Mortgage Rate). Notwithstanding the foregoing, if any Mortgage Loan is paid in full, liquidated or otherwise removed from the Trust Fund, commencing as of the first Distribution Date following the Collection Period during which such event occurred, the Stated Principal Balance of such Mortgage Loan will be zero. With respect to any Companion Loan on any date of determination, the Stated Principal Balance shall equal the unpaid principal balance of such Companion Loan.
The ‘‘Collection Period’’ for each Distribution Date is the period that begins on the 12th day in the month immediately preceding the month in which such Distribution Date occurs (or the day after the
S-166
applicable Cut-Off Date in the case of the first Collection Period) and ends on and includes the 11th day in the same month as such Distribution Date. Notwithstanding the foregoing, in the event that the last day of a Collection Period is not a business day, any payments received with respect to the Mortgage Loans relating to such Collection Period on the business day immediately following such day will be deemed to have been received during such Collection Period and not during any other Collection Period, and in the event that the payment date (after giving effect to any grace period) related to any Distribution Date occurs after the related Collection Period, any amounts received on that payment date (after giving effect to any grace period) will be deemed to have been received during the related Collection Period and not during any other Collection Period.
The ‘‘Determination Date’’ will be, for any Distribution Date, the 11th day of each month, or if such 11th day is not a business day, the next succeeding business day, commencing in July 2007.
Distributions
General. Except as described below with respect to the Class Z Certificates, distributions on the Certificates and the Class A-4FL Regular Interest and the Class A-MFL Regular Interest are made by the Trustee, to the extent of the Available Distribution Amount, on the fourth business day following the related Determination Date (each, a ‘‘Distribution Date’’). Except as described below, all such distributions will be made to the persons in whose names the Certificates are registered (the ‘‘Certificateholders’’) at the close of business on the last business day of t he month preceding the month in which the related Distribution Date occurs and shall be made by wire transfer of immediately available funds, if such Certificateholder shall have provided wiring instructions no less than five business days prior to such record date, or otherwise by check mailed to the address of such Certificateholder as it appears in the Certificate register. The final distribution on any Certificate (determined without regard to any possible future reimbursement of any Realized Loss or Additional Trust Fund Expense previously allocated to such Certificate) will be made only upon presentation and surrender of such Certificate at the location that will be specified in a notice of the pendency of such final distribution. All distributions made with respect to a Class of Certificates will be allocated pro rata among the outstanding Certificates of such Class based on their respective percentage interests in such Class. The first Distribution Date on which investors in the Certificates may receive distributions will be the Distribution Date occurring in July, 2007. The amount allocated to the Class A-4FL Regular Interest and the Class A-MFL Regular Interest on each Distribution Date will be deposited into the related Floating Rate Account, less the portion of such amount, if any, due to the swap counterparty with respect to such Distribution Date. In addition, amounts payable to the Trust Fund by the swap counterparty with respect to the Distribution Date will be deposited into the applicable Floating Rate Account.
The Available Distribution Amount. The aggregate amount available for distributions of interest and principal to Certificateholders (other than the Class R-I, Class R-II and Class Z Certificateholders) and the Class A-4FL Regular Interest and Class A-MFL Regular Interest on each related Distribution Date (the ‘‘Available Distribution Amount’’) will, in general, equal the sum of the following amounts:
(a) the total amount of all cash received on or in respect of the Mortgage Loans and any REO Properties (without regard to any payments made to or received by the swap counterparty) as of the close of business on the last day of the related Collection Period and not previously distributed with respect to the Certificates or applied for any other permitted purpose, exclusive of any portion thereof that represents one or more of the following:
(i) any Periodic Payments collected but due on a Due Date after the related Collection Period;
(ii) any Prepayment Premiums and Yield Maintenance Charges;
(iii) all amounts in the Certificate Account or Distribution Account that are payable or reimbursable to any person other than the Certificateholders, including any Servicing Fees and Trustee Fees on the Mortgage Loans or Companion Loans;
(iv) any amounts deposited in the Certificate Account in error;
(v) any Additional Interest on the ARD Loans (which is separately distributed to the Class Z Certificates); and
S-167
(vi) if such Distribution Date occurs in February of any year or during January of any year that is not a leap year unless the final Distribution Date occurs in January or February immediately following such December or January, the Interest Reserve Amounts with respect to the Mortgage Loans to be deposited in the Interest Reserve Account and held for future distribution;
(b) all P&I Advances made by the Master Servicer or the Trustee with respect to such Distribution Date;
(c) any Compensating Interest Payment made by the Master Servicer to cover the aggregate of any Prepayment Interest Shortfalls experienced during the related Collection Period (other than any Compensating Interest Payment made on any Companion Loan); and
(d) if such Distribution Date occurs during March of any year or if such Distribution Date is the final Distribution Date and occurs in February or, if such year is not a leap year, in January, the aggregate of the Interest Reserve Amounts then on deposit in the Interest Reserve Account in respect of each Mortgage Loan.
See ‘‘SERVICING OF THE MORTGAGE LOANS—Compensation and Payment of Expenses’’ and ‘‘DESCRIPTION OF THE CERTIFICATES—P&I Advances’’ in this prospectus supplement and ‘‘DESCRIPTION OF THE POOLING AND SERVICING AGREEMENTS—Certificate Account’’ in the accompanying prospectus.
Any Prepayment Premiums or Yield Maintenance Charges actually collected will be distributed separately from the Available Distribution Amount. See ‘‘—Allocation of Prepayment Premiums and Yield Maintenance Charges’’ below.
All amounts received by the Trust Fund with respect to any Co-Lender Loan will be applied to amounts due and owing under the related loan (including for principal and accrued and unpaid interest) in accordance with the provisions of the related Mortgage Loan documents, the related Intercreditor Agreement and the Pooling and Servicing Agreement.
Interest Reserve Account. The Trustee will establish and maintain an ‘‘Interest Reserve Account’’ in the name of the Trustee for the benefit of the holders of the Certificates. With respect to each Distribution Date occurring in February and each Distribution Date occurring in any January which occurs in a year that is not a leap year, unless the final Distribution Date occurs in January or February immediately following such December or January, there will be withdrawn from the Certificate Account and deposited to the Interest Reserve Account in respect of each Mortgage Loan (the ‘‘Interest Reserve Loans’’) which accrues interest on an Actual/360 basis an amount equal to one day’s interest at the related Mortgage Rate on its Stated Principal Balance, as of the Due Date in the month in which such Distribution Date occurs, to the extent a Periodic Payment or P&I Advance is timely made in respect thereof for such Due Date (all amounts so deposited in any consecutive January (if applicable) and February in respect of each Interest Reserve Loan, the ‘‘Interest Reserve Amount’’). With respect to each Distribution Date occurring in March, or in the event the final Distribution Date occurs in February or, if such year is not a leap year, in January, there will be withdrawn from the Interest Reserve Account the amounts deposited from the immediately preceding February and, if applicable, January, and such withdrawn amount is to be included as part of the Available Distribution Amount for such Distribution Date.
Certificate Account. The Master Servicer will establish and will maintain a ‘‘Certificate Account’’ in the name of the Trustee for the benefit of the Certificateholders and will maintain the Certificate Account as an eligible account pursuant to the terms of the Pooling and Servicing Agreement. Funds on deposit in the Certificate Account to the extent of the Available Distribution Amount will be used to make distributions on the Certificates and the Class A-4FL Regular Interest and Class A-MFL Regular Interest. See ‘‘DESCRIPTION OF THE TRUST FUNDS—Certificate Accounts’’ in the prospectus.
Distribution Account. The Trustee will establish and will maintain a ‘‘Distribution Account’’ in the name of the Trustee for the benefit of the Certificateholders and will maintain the Distribution Account as an eligible account pursuant to the terms of the Pooling and Servicing Agreement. Funds on deposit in the Distribution Account, to the extent of the Available Distribution Amount will be used to make distributions on the Certificates and the Class A-4FL Regular Interest and Class A-MFL Regular Interest.
S-168
Gain-on-Sale Reserve Account. The Trustee will establish and will maintain a ‘‘Gain-on-Sale Reserve Account’’ in the name of the Trustee for the benefit of the Certificateholders. To the extent that gains realized on sales of Mortgaged Properties, if any, are not used to offset Realized Losses previously allocated to the Certificates, such gains will be held and applied to offset future Realized Losses, if any.
Additional Interest Account. The Trustee will establish and will maintain an ‘‘Additional Interest Account’’ in the name of the Trustee for the benefit of the holders of the Class Z Certificates. Prior to the applicable Distribution Date, an amount equal to the Additional Interest received in respect of the Mortgage Loans during the related Collection Period will be deposited into the Additional Interest Account.
Floating Rate Accounts. On or before the Closing Date, the Trustee will establish and maintain (i) a ‘‘Class A-4FL Floating Rate Account’’ in trust for the benefit of the holders of certain beneficial interests in the Class A-4FL Regular Interest and (ii) a ‘‘Class A-MFL Floating Rate Account’’ in trust for the benefit of the holders of certain beneficial interests in the Class A-MFL Regular Interest, each as an eligible account pursuant to the terms of the Pooling and Servicing Agreement. The Class A-4FL Floating Rate Account and the Cl ass A-MFL Floating Rate Account are collectively defined as the ‘‘Floating Rate Accounts’’. The Floating Rate Accounts may be subaccounts of the Distribution Account. Promptly upon receipt of any payment or other receipt in respect of the Class A-4FL or Class A-MFL Regular Interest or the swap contract, the Trustee will deposit the same into the applicable Floating Rate Account.
Other than the Assessment of Compliance and the Attestation Report, as such terms are defined in the accompanying prospectus, required to be delivered by certain parties, as described in the accompanying prospectus, there will be no independent certification of the account activity with respect to any of the Distribution Account, the Floating Rate Account, the Interest Reserve Account, the Additional Interest Account or the Gain-on-Sale Reserve Account.
Application of the Available Distribution Amount. On each Distribution Date, the Trustee will (except as otherwise described under ‘‘—Termination’’ below) apply amounts on deposit in the Distribution Account, to the extent of the Available Distribution Amount, in the following order of priority:
| (1) | concurrently, to distributions of interest (i) from the portion of the Available Distribution Amount for such Distribution Date attributable to Mortgage Loans in Loan Group 1, to the holders of the Class A-1 Certificates, Class A-2 Certificates, Class A-PB Certificates and Class A-3 Certificates and the Class A-4FL Regular Interest, pro rata, in accordance with the amounts of Distributable Certificate Interest in respect of such Classes on such Distribution Date, in an amount equal to all Distributable Certificate Interest in respect of such Classes for such Distribution Date and , to the extent not previously paid, for all prior Distribution Dates, (ii) from the portion of the Available Distribution Amount for such Distribution Date attributable to Mortgage Loans in Loan Group 2, to the holders of the Class A-1A Certificates in an amount equal to all Distributable Certificate Interest in respect of such Class of Certificates on such Distribution Date and, to the extent not previously paid, for all prior Distribution Dates, and (iii) from the entire Available Distribution Amount for such Distribution Date relating to the entire Mortgage Pool, to the holders of the Class IO Certificates in accordance with the amounts of Distributable Certificate Interest in respect of such Classes on such Distribution Date, in an amount equal to all Distributable Certificate Interest in respect of such Classes of Certificates for such Distribution Date and, to the extent not previously paid, for all prior Distribution Dates; provided, however, on any Distribution Date where the Available Distribution Amount (or applicable portion thereof) is not sufficient to make distributions in full to the related Classes as described above, the Available Distribution Amount will be allocated among the above Classes without regard to Loan Group, pro rata, in accordance with the respective amounts of Distributable Certificate Interest in respect of such Classes on such Distribution Date, in an amount equal to all Distributable Certificate Interest in respect of each such Class for such Distribution Date and, to the extent not previously paid, for all prior Di stribution Dates; |
S-169
| (2) | to distributions of principal to the holders of the Class A-PB Certificates, in an amount equal to the Loan Group 1 Principal Distribution Amount for such Distribution Date and, after the Class A-1A Certificates have been retired, the Loan Group 2 Principal Distribution Amount remaining after payments to the Class A-1A Certificates have been made on such Distribution Date, until the Certificate Balance of the Class A-PB Certificates is reduced to the Class A-PB Planned Principal Balance set forth on Annex F to this prospectus supplement; |
| (3) | after distributions of principal have been made from the Loan Group 1 Principal Distribution Amount to the Class A-PB Certificates as set forth in clause (2) above, to distributions of principal to the holders of the Class A-1 Certificates in an amount (not to exceed the then outstanding Certificate Balance of the Class A-1 Certificates) equal to the remaining Loan Group 1 Principal Distribution Amount for such Distribution Date and, after the Class A-1A Certificates have been retired, the Loan Group 2 Principal Distribution Amount remaining after payments to the Class A-1A Certificates have been made on such Distribution Date, in each case, less any portion thereof distributed in respect of the Class A-P B Certificates on such Distribution Date; |
| (4) | after distributions of principal have been made from the Loan Group 1 Principal Distribution Amount to the Class A-PB Certificates and the Class A-1 Certificates as set forth in clauses (2) and (3) above, to distributions of principal to the Class A-2 Certificates in an amount (not to exceed the then outstanding Certificate Balance of the Class A-2 Certificates) equal to the remaining Loan Group 1 Principal Distribution Amount for such Distribution Date and, after the Class A-1A Certificates have been retired, the Loan Group 2 Principal Distribution Amount remaining after payments to the Class A-1A Certificates have been made on such Distribution Date, in each case, less any portion thereof dist ributed in respect of the Class A-PB Certificates and the Class A-1 Certificates on such Distribution Date; |
| (5) | after distributions of principal have been made from the Loan Group 1 Principal Distribution Amount to the Class A-PB Certificates, the Class A-1 Certificates and the Class A-2 Certificates as set forth in clauses (2), (3) and (4) above, to distributions of principal to the holders of the Class A-PB Certificates in an amount (not to exceed the then outstanding Certificate Balance of the Class A-PB Certificates) equal to the remaining Loan Group 1 Principal Distribution Amount for such Distribution Date and, after the Class A-1A Certificates have been retired, the Loan Group 2 Principal Distribution Amount remaining after payments to the Class A-1A Certificates have been made on such Distribution Date , in each case, less any portion thereof distributed in respect of the Class A-PB Certificates, the Class A-1 Certificates and the Class A-2 Certificates on such Distribution Date; |
| (6) | after distributions of principal have been made from the Loan Group 1 Principal Distribution Amount to the Class A-PB Certificates, the Class A-1 Certificates and the Class A-2 Certificates as set forth in clauses (2), (3), (4) and (5) above, to distributions of principal, to the holders of the Class A-3 Certificates, in an amount (not to exceed the then outstanding Certificate Balance of the Class A-3 Certificates) equal to the remaining Loan Group 1 Principal Distribution Amount for such Distribution Date and, after the Class A-1A Certificates have been retired, the Loan Group 2 Principal Distribution Amount remaining after payments to the Class A-1A Certificates have been made on such Distribution Date , in each case, less any portion thereof distributed in respect of the Class A-PB Certificates, the Class A-1 Certificates and the Class A-2 Certificates on such Distribution Date; |
| (7) | after distributions of principal have been made from the Loan Group 1 Principal Distribution Amount to the Class A-PB Certificates, the Class A-1 Certificates, the Class A-2 Certificates and the Class A-3 Certificates as set forth in clauses (2), (3), (4), (5) and (6) above, to distributions of principal to the holders of the Class A-4FL Regular Interest, in an amount (not to exceed the then outstanding Certificate Balance of the Class A-4FL Regular Interest) equal to the remaining Loan Group 1 Principal Distribution Amount for such Distribution Date and, after the Class A-1A Certificates have been retired, the Loan Group 2 Principal |
S-170
| Distribution Amount remaining after payments to the Class A-1A Certificates have been made on such Distribution Date, in each case, less any portion thereof distributed in respect of the Class A-PB Certificates, the Class A-1 Certificates, the Class A-2 Certificates and the Class A-3 Certificates on such Distribution Date; |
| (8) | to distributions of principal to the holders of the Class A-1A Certificates in an amount (not to exceed the then outstanding Certificate Balance of the Class A-1A Certificates) equal to the Loan Group 2 Principal Distribution Amount for such Distribution and, after the Class A-PB Certificates, the Class A-1 Certificates, the Class A-2 Certificates, the Class A-3 Certificates and the Class A-4FL Regular Interest have been retired, the Loan Group 1 Principal Distribution Amount remaining after payments to the Class A-PB Certificates, the Class A-1 Certificates, the Class A-2 Certificates, the Class A-3 Certificates and the Class A-4FL Regular Interest have been made on such Distribution Date; |
| (9) | to distributions to the holders of the Class A-PB Certificates, the Class A-1 Certificates, the Class A-2 Certificates, the Class A-3 Certificates and the Class A-1A Certificates and the Class A-4FL Regular Interest, pro rata, in accordance with the respective amounts of Realized Losses and Additional Trust Fund Expenses, if any, previously allocated to such Classes of Certificates and the Class A-4FL Regular Interest for which no reimbursement has previously been received, to reimburse such holders for all such Realized Losses and Additional Trust Fund Expenses, if any; |
| (10) | to distributions of interest, to the holders of the Class A-MFL Regular Interest in an amount equal to all Distributable Certificate Interest in respect of the Class A-MFL Regular Interest on such Distribution Date and, to the extent not previously paid, for all prior Distribution Dates; |
| (11) | after all Classes of Certificates and the Class A-4FL Regular Interest with an earlier priority of distribution have been retired, to distributions of principal to the holders of the Class A-MFL Regular Interest in an aggregate amount (not to exceed the then outstanding Certificate Balance of the Class A-MFL Regular Interest) equal to the Principal Distribution Amount in respect of such Class A-MFL Regular Interest for such Distribution Date, less any portion thereof distributed in respect of Classes of Certificates or the Class A-4FL Regular Interest with an earlier priority of payment; |
| (12) | to distributions to the holders of the Class A-MFL Regular Interest in accordance with the amount of Realized Losses and Additional Trust Fund Expenses, if any, previously allocated to such Class of Certificates and the Class A-MFL Regular Interest, to reimburse such holders for all Realized Losses and Additional Trust Fund Expenses, if any previously allocated to such Class of Certificates or the Class A-MFL Regular Interest and for which no reimbursement has previously been received; |
| (13) | to distributions of interest to the holders of the Class A-J Certificates in an amount equal to all Distributable Certificate Interest in respect of such Class A-J Certificates for such Distribution Date and, to the extent not previously paid, for all prior Distribution Dates; |
| (14) | after all Classes of Certificates or the Class A-4FL Regular Interest or the Class A-MFL Regular Interest with an earlier priority of distribution have been retired, to distributions of principal to the holders of the Class A-J Certificates in an amount (not to exceed the then outstanding Certificate Balance of the Class A-J Certificates) equal to the Principal Distribution Amount in respect of such Class A-J Certificates for such Distribution Date, less any portion thereof distributed in respect of all Classes of Certificates and/or the Class A-4FL Regular Interest or the Class A-MFL Regular Interest with an earlier priority of payment; |
| (15) | to distributions to the holders of the Class A-J Certificates to reimburse such holders for all Realized Losses and Additional Trust Fund Expenses, if any, previously allocated to such Class of Certificates and for which no reimbursement has previously been received; |
| (16) | to distributions of interest to the holders of the Class B Certificates in an amount equal to all Distributable Certificate Interest in respect of such Class B Certificates for such Distribution Date and, to the extent not previously paid, for all prior Distribution Dates; |
S-171
| (17) | after all Classes of Certificates or the Class A-4FL Regular Interest or the Class A-MFL Regular Interest with an earlier priority of distribution have been retired, to distributions of principal to the holders of the Class B Certificates in an amount (not to exceed the then outstanding Certificate Balance of the Class B Certificates) equal to the Principal Distribution Amount in respect of such Class B Certificates for such Distribution Date, less any portion thereof distributed in respect of all Classes of Certificates and/or the Class A-4FL Regular Interest or the Class A-MFL Regular Interest with an earlier priority of distribution on such Distribution Date; |
| (18) | to distributions to the holders of the Class B Certificates to reimburse such holders for all Realized Losses and Additional Trust Fund Expenses, if any, previously allocated to such Class B Certificates and for which no reimbursement has previously been received; |
| (19) | to distributions of interest to the holders of the Class C Certificates in an amount equal to all Distributable Certificate Interest in respect of such Class C Certificates for such Distribution Date and, to the extent not previously paid, for all prior Distribution Dates; |
| (20) | after all Classes of Certificates and the Class A-4FL Regular Interest or the Class A-MFL Regular Interest with an earlier priority of distribution have been retired, to distributions of principal to the holders of the Class C Certificates in an amount (not to exceed the then outstanding Certificate Balance of the Class C Certificates) equal to the Principal Distribution Amount in respect of such Class C Certificates for such Distribution Date, less any portion thereof distributed in respect of all Classes of Certificates and/or the Class A-4FL Regular Interest or the Class A-MFL Regular Interest with an earlier priority of distribution on such Distribution Date; |
| (21) | to distributions to the holders of the Class C Certificates to reimburse such holders for all Realized Losses and Additional Trust Fund Expenses, if any, previously allocated to such Class C Certificates and for which no reimbursement has previously been received; |
| (22) | to distributions of interest to the holders of the Class D Certificates in an amount equal to all Distributable Certificate Interest in respect of such Class D Certificates for such Distribution Date and, to the extent not previously paid, for all prior Distribution Dates; |
| (23) | after all Classes of Certificates and the Class A-4FL Regular Interest or the Class A-MFL Regular Interest with an earlier priority of distribution have been retired, to distributions of principal to the holders of the Class D Certificates in an amount (not to exceed the then outstanding Certificate Balance of the Class D Certificates) equal to the Principal Distribution Amount in respect of such Class D Certificates for such Distribution Date, less any portion thereof distributed in respect of all Classes of Certificates and/or the Class A-4FL Regular Interest or the Class A-MFL Regular Interest with an earlier priority of distribution on such Distribution Date; |
| (24) | to distributions to the holders of the Class D Certificates to reimburse such holders for all Realized Losses and Additional Trust Fund Expenses, if any, previously allocated to such Class D Certificates and for which no reimbursement has previously been received; |
| (25) | to distributions of interest to the holders of the Class E Certificates in an amount equal to all Distributable Certificate Interest in respect of such Class E Certificates for such Distribution Date and, to the extent not previously paid, for all prior Distribution Dates; |
| (26) | after all Classes of Certificates and the Class A-4FL Regular Interest or the Class A-MFL Regular Interest with an earlier priority of distribution have been retired, to distributions of principal to the holders of the Class E Certificates in an amount (not to exceed the then outstanding Certificate Balance of the Class E Certificates) equal to the Principal Distribution Amount in respect of such Class E Certificates for such Distribution Date, less any portion thereof distributed in respect of all Classes of Certificates and/or the Class A-4FL Regular Interest or the Class A-MFL Regular Interest with an earlier priority of distribution on such Distribution Date; |
S-172
| (27) | to distributions to the holders of the Class E Certificates to reimburse such holders for all Realized Losses and Additional Trust Fund Expenses, if any, previously allocated to such Class E Certificates and for which no reimbursement has previously been received; |
| (28) | to distributions of interest to the holders of the Class F Certificates in an amount equal to all Distributable Certificate Interest in respect of such Class F Certificates for such Distribution Date and, to the extent not previously paid, for all prior Distribution Dates; |
| (29) | after all Classes of Certificates and the Class A-4FL Regular Interest or the Class A-MFL Regular Interest with an earlier priority of distribution have been retired, to distributions of principal to the holders of the Class F Certificates in an amount (not to exceed the then outstanding Certificate Balance of the Class F Certificates) equal to the Principal Distribution Amount in respect of such Class F Certificates for such Distribution Date, less any portion thereof distributed in respect of all Classes of Certificates and/or the Class A-4FL Regular Interest or the Class A-MFL Regular Interest with an earlier priority of distribution on such Distribution Date; |
| (30) | to distributions to the holders of the Class F Certificates to reimburse such holders for all Realized Losses and Additional Trust Fund Expenses, if any, previously allocated to such Class F Certificates and for which no reimbursement has previously been received; |
| (31) | to distributions of interest to the holders of the Class G Certificates in an amount equal to all Distributable Certificate Interest in respect of such Class G Certificates for such Distribution Date and, to the extent not previously paid, for all prior Distribution Dates; |
| (32) | after all Classes of Certificates and the Class A-4FL Regular Interest or the Class A-MFL Regular Interest with an earlier priority of distribution have been retired, to distributions of principal to the holders of the Class G Certificates in an amount (not to exceed the then outstanding Certificate Balance of the Class G Certificates) equal to the Principal Distribution Amount in respect of such Class G Certificates for such Distribution Date, less any portion thereof distributed in respect of all Classes of Certificates and/or the Class A-4FL Regular Interest or the Class A-MFL Regular Interest with an earlier priority of distribution on such Distribution Date; |
| (33) | to distributions to the holders of the Class G Certificates to reimburse such holders for all Realized Losses and Additional Trust Fund Expenses, if any, previously allocated to such Class G Certificates and for which no reimbursement has previously been received; |
| (34) | to distributions of interest to the holders of the Class H Certificates in an amount equal to all Distributable Certificate Interest in respect of such Class H Certificates for such Distribution Date and, to the extent not previously paid, for all prior Distribution Dates; |
| (35) | after all Classes of Certificates and the Class A-4FL Regular Interest or the Class A-MFL Regular Interest with an earlier priority of distribution have been retired, to distributions of principal to the holders of the Class H Certificates in an amount (not to exceed the then outstanding Certificate Balance of the Class H Certificates) equal to the Principal Distribution Amount in respect of such Class H Certificates for such Distribution Date, less any portion thereof distributed in respect of all Classes of Certificates and/or the Class A-4FL Regular Interest or the Class A-MFL Regular Interest with an earlier priority of distribution on such Distribution Date; |
| (36) | to distributions to the holders of the Class H Certificates to reimburse such holders for all Realized Losses and Additional Trust Fund Expenses, if any, previously allocated to such Class H Certificates and for which no reimbursement has previously been received; |
| (37) | to distributions of interest to the holders of the Class J Certificates in an amount equal to all Distributable Certificate Interest in respect of such Class J Certificates for such Distribution Date and, to the extent not previously paid, for all prior Distribution Dates; |
S-173
| (38) | after all Classes of Certificates and the Class A-4FL Regular Interest or the Class A-MFL Regular Interest with an earlier priority of distribution have been retired, to distributions of principal to the holders of the Class J Certificates in an amount (not to exceed the then outstanding Certificate Balance of the Class J Certificates) equal to the Principal Distribution Amount in respect of such Class J Certificates for such Distribution Date, less any portion thereof distributed in respect of all Classes of Certificates and/or the Class A-4FL Regular Interest or the Class A-MFL Regular Interest with an earlier priority of distribution on such Distribution Date; |
| (39) | to distributions to the holders of the Class J Certificates to reimburse such holders for all Realized Losses and Additional Trust Fund Expenses, if any, previously allocated to such Class J Certificates and for which no reimbursement has previously been received; |
| (40) | to distributions of interest to the holders of the Class K Certificates in an amount equal to all Distributable Certificate Interest in respect of such Class K Certificates for such Distribution Date and, to the extent not previously paid, for all prior Distribution Dates; |
| (41) | after all Classes of Certificates and the Class A-4FL Regular Interest or the Class A-MFL Regular Interest with an earlier priority of distribution have been retired, to distributions of principal to the holders of the Class K Certificates in an amount (not to exceed the then outstanding Certificate Balance of the Class K Certificates) equal to the Principal Distribution Amount in respect of such Class K Certificates for such Distribution Date, less any portion thereof distributed in respect of all Classes of Certificates and/or the Class A-4FL Regular Interest or the Class A-MFL Regular Interest with an earlier priority of distribution on such Distribution Date; |
| (42) | to distributions to the holders of the Class K Certificates to reimburse such holders for all Realized Losses and Additional Trust Fund Expenses, if any, previously allocated to such Class K Certificates and for which no reimbursement has previously been received; |
| (43) | to distributions of interest to the holders of the Class L Certificates in an amount equal to all Distributable Certificate Interest in respect of such Class L Certificates for such Distribution Date and, to the extent not previously paid, for all prior Distribution Dates; |
| (44) | after all Classes of Certificates and the Class A-4FL Regular Interest or the Class A-MFL Regular Interest with an earlier priority of distribution have been retired, to distributions of principal to the holders of the Class L Certificates in an amount (not to exceed the then outstanding Certificate Balance of the Class L Certificates) equal to the Principal Distribution Amount in respect of such Class L Certificates for such Distribution Date, less any portion thereof distributed in respect of all Classes of Certificates and/or the Class A-4FL Regular Interest or the Class A-MFL Regular Interest with an earlier priority of distribution on such Distribution Date; |
| (45) | to distributions to the holders of the Class L Certificates to reimburse such holders for all Realized Losses and Additional Trust Fund Expenses, if any, previously allocated to such Class L Certificates and for which no reimbursement has previously been received; |
| (46) | to distributions of interest to the holders of the Class M Certificates in an amount equal to all Distributable Certificate Interest in respect of such Class M Certificates for such Distribution Date and, to the extent not previously paid, for all prior Distribution Dates; |
| (47) | after all Classes of Certificates and the Class A-4FL Regular Interest or the Class A-MFL Regular Interest with an earlier priority of distribution have been retired, to distributions of principal to the holders of the Class M Certificates in an amount (not to exceed the then outstanding Certificate Balance of the Class M Certificates) equal to the Principal Distribution Amount in respect of such Class M Certificates for such Distribution Date, less any portion thereof distributed in respect of all Classes of Certificates and/or the Class A-4FL Regular Interest or the Class A-MFL Regular Interest with an earlier priority of distribution on such Distribution Date; |
S-174
| (48) | to distributions to the holders of the Class M Certificates to reimburse such holders for all Realized Losses and Additional Trust Fund Expenses, if any, previously allocated to such Class M Certificates and for which no reimbursement has previously been received; |
| (49) | to distributions of interest to the holders of the Class N Certificates in an amount equal to all Distributable Certificate Interest in respect of such Class N Certificates for such Distribution Date and, to the extent not previously paid, for all prior Distribution Dates; |
| (50) | after all Classes of Certificates and the Class A-4FL Regular Interest or the Class A-MFL Regular Interest with an earlier priority of distribution have been retired, to distributions of principal to the holders of the Class N Certificates in an amount (not to exceed the then outstanding Certificate Balance of the Class N Certificates) equal to the Principal Distribution Amount in respect of such Class N Certificates for such Distribution Date, less any portion thereof distributed in respect of all Classes of Certificates and/or the Class A-4FL Regular Interest or the Class A-MFL Regular Interest with an earlier priority of distribution on such Distribution Date; |
| (51) | to distributions to the holders of the Class N Certificates to reimburse such holders for all Realized Losses and Additional Trust Fund Expenses, if any, previously allocated to such Class N Certificates and for which no reimbursement has previously been received; |
| (52) | to distributions of interest to the holders of the Class O Certificates in an amount equal to all Distributable Certificate Interest in respect of such Class O Certificates for such Distribution Date and, to the extent not previously paid, for all prior Distribution Dates; |
| (53) | after all Classes of Certificates and the Class A-4FL Regular Interest or the Class A-MFL Regular Interest with an earlier priority of distribution have been retired, to distributions of principal to the holders of the Class O Certificates in an amount (not to exceed the then outstanding Certificate Balance of the Class O Certificates) equal to the Principal Distribution Amount in respect of such Class O Certificates for such Distribution Date, less any portion thereof distributed in respect of all Classes of Certificates and/or the Class A-4FL Regular Interest or the Class A-MFL Regular Interest with an earlier priority of distribution on such Distribution Date; |
| (54) | to distributions to the holders of the Class O Certificates to reimburse such holders for all Realized Losses and Additional Trust Fund Expenses, if any, previously allocated to such Class O Certificates and for which no reimbursement has previously been received; |
| (55) | to distributions of interest to the holders of the Class P Certificates in an amount equal to all Distributable Certificate Interest in respect of such Class P Certificates for such Distribution Date and, to the extent not previously paid, for all prior Distribution Dates; |
| (56) | after all Classes of Certificates and the Class A-4FL Regular Interest or the Class A-MFL Regular Interest with an earlier priority of distribution have been retired, to distributions of principal to the holders of the Class P Certificates in an amount (not to exceed the then outstanding Certificate Balance of the Class P Certificates) equal to the Principal Distribution Amount in respect of such Class P Certificates for such Distribution Date, less any portion thereof distributed in respect of all Classes of Certificates and/or the Class A-4FL Regular Interest or the Class A-MFL Regular Interest with an earlier priority of distribution on such Distribution Date; |
| (57) | to distributions to the holders of the Class P Certificates to reimburse such holders for all Realized Losses and Additional Trust Fund Expenses, if any, previously allocated to such Class P Certificates and for which no reimbursement has previously been received; |
| (58) | to distributions of interest to the holders of the Class Q Certificates in an amount equal to all Distributable Certificate Interest in respect of such Class Q Certificates for such Distribution Date and, to the extent not previously paid, for all prior Distribution Dates; |
S-175
| (59) | after all Classes of Certificates and the Class A-4FL Regular Interest or the Class A-MFL Regular Interest with an earlier priority of distribution have been retired, to distributions of principal to the holders of the Class Q Certificates in an amount (not to exceed the then outstanding Certificate Balance of the Class Q Certificates) equal to the Principal Distribution Amount in respect of such Class Q Certificates for such Distribution Date, less any portion thereof distributed in respect of all Classes of Certificates and/or the Class A-4FL Regular Interest or the Class A-MFL Regular Interest with an earlier priority of distribution on such Distribution Dates; |
| (60) | to distributions to the holders of the Class Q Certificates to reimburse such holders for all Realized Losses and Additional Trust Fund Expenses, if any, previously allocated to such Class P Certificates and for which no reimbursement has been previously been received; |
| (61) | to distributions of interest to the holders of the Class S Certificates in an amount equal to all Distributable Certificate Interest in respect of such Class S Certificates for such Distribution Date and, to the extent not previously paid, for all prior Distribution Dates; |
| (62) | after all Classes of Certificates and the Class A-4FL Regular Interest or the Class A-MFL Regular Interest with an earlier priority of distribution have been retired, to distributions of principal to the holders of the Class S Certificates in an amount (not to exceed the then outstanding Certificate Balance of the Class S Certificates) equal to the Principal Distribution Amount in respect of such Class S Certificates for such Distribution Date, less any portion thereof distributed in respect of all Classes of Certificates and/or the Class A-4FL Regular Interest or the Class A-MFL Regular Interest with an earlier priority of distribution on such Distribution Date; |
| (63) | to distributions to the holders of the Class S Certificates to reimburse such holders for all Realized Losses and Additional Trust Fund Expenses, if any, previously allocated to such Class of Certificates and for which no reimbursement has previously been received; and |
| (64) | to distributions to the holders of the REMIC Residual Certificates in an amount equal to the balance, if any, of the Available Distribution Amount remaining after the distributions to be made on such Distribution Date as described in clauses (1) through (63) above; |
provided that on each Distribution Date, if any, after the aggregate of the Certificate Balances of the Subordinate Certificates and the Class A-MFL Regular Interest has been reduced to zero as a result of the allocations of Realized Losses and Additional Trust Fund Expenses, and in any event on the final Distribution Date in connection with a termination of the Trust Fund (see ‘‘—Termination’’ below), the payments of principal to be made as contemplated by clauses (3), (4), (5), (6), (7), (8) and (9) above with respect to the Class A-1 Certificates, the Class A-2 Certificates, the Class A-PB Certificates, the Class A-3 Certificates and the Class A-1A Certificates and the Class A-4FL Regular Interest will be so made to the holders of the respective Classes of such Certificates which remain outstanding up to an amount equal to, and pro rata as among such Classes in accordance with, the respective then outstanding Certificate Balances of such Classes and without regard to the Principal Distribution Amount for such date.
Distributable Certificate Interest. The ‘‘Distributable Certificate Interest’’ equals with respect to each Class of Sequential Pay Certificates and the Class A-4FL Regular Interest and the Class A-MFL Regular Interest for each Distribution Date, the Accrued Certificate Interest in respect of such Class of Certificates and the Class A-4FL Regular Interest and Class A-MFL Regular Interest for such Distribution Date, reduced (other than in the case of the Class IO Certificates) (to not less than zero) by (i) such Class’s allocable share (calculated as described below) of the aggregate of any Prepayment Interest Shortfalls resulting from principal prepayments made on the Mortgage Loans during t he related Collection Period that are not covered by the Master Servicer’s Compensating Interest Payment for such Distribution Date (the aggregate of such Prepayment Interest Shortfalls that are not so covered, as to such Distribution Date, the ‘‘Net Aggregate Prepayment Interest Shortfall’’) and (ii) any Certificate Deferred Interest allocated to such Class of Sequential Pay Certificates or the Class A-4FL Regular Interest and Class A-MFL Regular Interest.
The ‘‘Accrued Certificate Interest’’ in respect of each Class of Sequential Pay Certificates and the Class A-4FL Regular Interest and Class A-MFL Regular Interest for each Distribution Date will equal
S-176
one month’s interest at the Pass-Through Rate applicable to such Class of Certificates and the Class A-4FL Regular Interest and Class A-MFL Regular Interest for such Distribution Date accrued for the related Interest Accrual Period on the related Certificate Balance outstanding immediately prior to such Distribution Date. The Accrued Certificate Interest in respect of the Class IO Certificates for any Distribution Date will equal the amount of one month’s interest at the related Pass-Through Rate on the Notional Amount of the Class IO Certificates, as the case may be, outstanding immediately prior to such Distribution Date. Accrued Certificate Interest will be calculated on a 30/360 basis.
The portion of the Net Aggregate Prepayment Interest Shortfall for any Distribution Date that is allocable to each Class of Sequential Pay Certificates and the Class A-4FL Regular Interest and Class A-MFL Regular Interest will equal the product of (a) such Net Aggregate Prepayment Interest Shortfall, multiplied by (b) a fraction, the numerator of which is equal to the Accrued Certificate Interest in respect of such Class of Certificates for such Distribution Date, and the denominator of which is equal to the aggregate Accrued Certificate Interest in respect of all Classes of Sequential Pay Certificates and the Class A-4FL Regular Interest and Class A-MFL Regular Interest for such Distribution Date.
Any such Prepayment Interest Shortfalls allocated to the applicable Class or Classes of Certificates or to the Class A-4FL Regular Interest or Class A-MFL Regular Interest, to the extent not covered by the Master Servicer’s related Compensating Interest Payment for such Distribution Date, will reduce the Distributable Certificate Interest as described above.
With respect to each Co-Lender Loan, Prepayment Interest Shortfalls will be allocated, first, to the related Subordinate Companion Loan, if any, and, second, to the related Mortgage Loan (and any related Pari Passu Companion Loan). The portion of such Prepayment Interest Shortfall allocated to the related Mortgage Loan, net of amounts payable, if any, to the Master Servicer, will be included in the Net Aggregate Prepayment Interest Shortfall. This allocation will cause a Prepayment Interest Shortfall with respect to the Beacon D.C. & Seattle Pool Whole Loan, which shall be allocated, pro rata, among the Beacon D.C. & Seattle Pool Pari Passu Companion Loans and the Beacon D.C. & Seattle Pool Loan, with any Prepayment Interest Shortfall allocated to the Beacon D.C. & Seattle Pool Loan, net of amounts payable by the Master Servicer, to be included in the Net Aggregate Prepayment Interest Shortfall. This allocation will cause a Prepayment Interest Shortfall with respect to the ING Hospitality Pool Whole Loan, which shall be allocated, pro rata, among the ING Hospitality Pool Pari Passu Companion Loan and the ING Hospitality Pool Loan, with any Prepayment Interest Shortfall allocated to the ING Hospitality Pool Loan, net of amounts payable by the Master Servicer, to be included in the Net Aggregate Prepayment Interest Shortfall. This allocation will cause a Prepayment Inter est Shortfall with respect to the DDR Southeast Pool Whole Loan, which shall be allocated, pro rata, among the DDR Southeast Pool Pari Passu Companion Loans and the DDR Southeast Pool Loan, with any Prepayment Interest Shortfall allocated to the DDR Southeast Pool Loan, net of amounts payable by the Master Servicer, to be included in the Net Aggregate Prepayment Interest Shortfall.
Principal Distribution Amount. So long as the Class A-PB Certificates and the Class A-1A Certificates remain outstanding, the Principal Distribution Amount for each Distribution Date will be calculated on a Loan Group by Loan Group basis (with respect to Loan Group 1, the ‘‘Loan Group 1 Principal Distribution Amount’’ and with respect to Loan Group 2, the ‘‘Loan Group 2 Principal Distribution Amount’’). On each Distribution Date after the Certificate Balances of (i) the Class A-PB Certificates or (ii) the Class A-1A Certifica tes have been reduced to zero, a single Principal Distribution Amount will be calculated in the aggregate for both Loan Groups. The ‘‘Principal Distribution Amount’’ for each Distribution Date with respect to a Loan Group or the Mortgage Pool will generally equal the aggregate of the following (without duplication) to the extent paid by the related borrower during the related Collection Period or advanced by the Master Servicer or the Trustee, as applicable:
(a) the aggregate of the principal portions of all Scheduled Payments (other than Balloon Payments) and of any Assumed Scheduled Payments due or deemed due, on or in respect of the Mortgage Loans in such Loan Group or the Mortgage Pool, as applicable, for their respective Due Dates occurring during the related Collection Period, to the extent not previously paid by the related borrower or advanced by the Master Servicer or the Trustee, as applicable, prior to such Collection Period;
S-177
(b) the aggregate of all principal prepayments received on the Mortgage Loans in such Loan Group or the Mortgage Pool, as applicable, during the related Collection Period;
(c) with respect to any Mortgage Loan in such Loan Group or the Mortgage Pool, as applicable, as to which the related stated maturity date occurred during or prior to the related Collection Period, any payment of principal made by or on behalf of the related borrower during the related Collection Period (including any Balloon Payment), net of any portion of such payment that represents a recovery of the principal portion of any Scheduled Payment (other than a Balloon Payment) due, or the principal portion of any Assumed Scheduled Payment deemed due, in respect of such Mortgage Loan on a Due Date during or prior to the related Collection Period and not previously recovered;
(d) the aggregate of the principal portion of all liquidation proceeds, insurance proceeds, condemnation awards and proceeds of repurchases of Mortgage Loans in such Loan Group or the Mortgage Pool, as applicable in the Mortgage Pool, and Substitution Shortfall Amounts with respect to Mortgage Loans in the Mortgage Pool or such Loan Group, as applicable, and, to the extent not otherwise included in clause (a), (b) or (c) above, payments and other amounts that were received on or in respect of Mortgage Loans in such Loan Group or the Mortgage Pool, as applicable, during the related Collection Period and that were identified and applied by the Master Servicer as recoveries of principal, in each case net of any portion of such amounts that represents a recovery of the principal portion of any Scheduled Payment (other than a Balloon Payment) due, or of the principal portion of any Assumed Scheduled Payment deemed due, in respect of t he related Mortgage Loan on a Due Date during or prior to the related Collection Period and not previously recovered; and
(e) if such Distribution Date is subsequent to the initial Distribution Date, the excess, if any, of the Loan Group 1 Principal Distribution Amount, the Loan Group 2 Principal Distribution Amount and the Principal Distribution Amount, as the case may be, for the immediately preceding Distribution Date, over the aggregate distributions of principal made on the Certificates on such immediately preceding Distribution Date;
provided that the Principal Distribution Amount for any Distribution Date shall be reduced by the amount of any reimbursements of (i) nonrecoverable Advances plus interest on such nonrecoverable Advances that are paid or reimbursed from principal collections on the Mortgage Loans in a period during which such principal collections would have otherwise been included in the Principal Distribution Amount for such Distribution Date and (ii) Workout-Delayed Reimbursement Amounts plus interest on such amounts that are paid or reimbursed from principal collections on the Mortg age Loans in a period during which such principal collections would have otherwise been included in the Principal Distribution Amount for such Distribution Date; provided, further, in the case of clauses (i) and (ii) above, if any of the amounts that were reimbursed from principal collections on the Mortgage Loans are subsequently recovered on the related Mortgage Loan, such recovery will increase the Principal Distribution Amount for the Distribution Date related to the period in which such recovery occurs.
Notwithstanding the foregoing, unless otherwise noted, where Principal Distribution Amount is used in this prospectus supplement without specific reference to any Loan Group, it refers to the Principal Distribution Amount with respect to the entire Mortgage Pool.
Class A-PB Planned Principal Balance. The ‘‘Class A-PB Planned Principal Balance’’ for any Distribution Date is the balance shown for such Distribution Date in the table set forth in Annex F to this prospectus supplement. Such balances were calculated using, among other things, the Table Assumptions. Based on these assumptions, the Certificate Balance of the Class A-PB Certificates on each Distribution Date would be reduced to the balance indicated for that Distribution Date on the table. There is no assurance, however, that the Mortgage Loans will perform in conformity with the Table Assumptions. Therefore, there can be no assurance that the balance of the Class A-PB Certificates on an y Distribution Date will be equal to the balance that is specified for such Distribution Date in the table. In particular, once the Certificate Balances of the Class A-1A Certificates, the Class A-1 Certificates and the Class A-2 Certificates have been reduced to zero, any remaining portion on any Distribution Date of the Loan Group 1 Principal Distribution Amount and/or Loan Group 2 Principal Distribution Amount, as
S-178
applicable, will be distributed on the Class A-PB Certificates until the Certificate Balance of the Class A-PB Certificates is reduced to zero.
The ‘‘Scheduled Payment’’ due on any Mortgage Loan on any related Due Date is the amount of the Periodic Payment (including Balloon Payments) that is or would have been, as the case may be, due thereon on such date, without regard to any waiver, modification or amendment of such Mortgage Loan granted or agreed to by the Special Servicer or otherwise resulting from a bankruptcy or similar proceeding involving the related borrower, without regard to the accrual of Additional Interest on or the application of any Excess Cash Flow to pay principal on an ARD Loan, without regard to any acceleration of principal by reason of default, and with the assumption that each prior Scheduled Payment has been made in a timely manner. The ‘‘Assumed Scheduled Payment’’ is an amount deemed due (i) on any Balloon Loan that is delinquent in respect of its Balloon Payment beyond the first Determination Date that follows its stated maturity date and (ii) on an REO Loan. The Assumed Scheduled Payment deemed due on any such Balloon Loan on its stated maturity date and on each successive related Due Date that it remains or is deemed to remain outstanding will equal the Scheduled Payment that would have been due thereon on such date if the related Balloon Payment had not come due but rather such Mortgage Loan had continued to amortize in accordance with such loan’s amortization schedule, if any, and to accrue interest at the Mortgage Rate in effect as of the Closing Date. The Assumed Scheduled Payment deemed due on any REO Loan on each Due Date that the related REO Property remains part of the Trust Fund will equal the Scheduled Payment that would have been due in respect of such Mortgage Loan on such D ue Date had it remained outstanding (or, if such Mortgage Loan was a Balloon Loan and such Due Date coincides with or follows what had been its stated maturity date, the Assumed Scheduled Payment that would have been deemed due in respect of such Mortgage Loan on such Due Date had it remained outstanding).
Distributions of the Principal Distribution Amount will constitute the only distributions of principal on the Certificates. Reimbursements of previously allocated Realized Losses and Additional Trust Fund Expenses will not constitute distributions of principal for any purpose and will not result in an additional reduction in the Certificate Balance of the Class of Certificates in respect of which any such reimbursement is made.
Treatment of REO Properties. Notwithstanding that any Mortgaged Property (other than the Mortgaged Property related to the Beacon D.C. & Seattle Pool Loan and, after the securitization of the DDR Southeast Pool Pari Passu Note A-1 Companion Loan, the DDR Southeast Pool Loan) may be acquired as part of the Trust Fund through foreclosure, deed in lieu of foreclosure or otherwise, the related Mortgage Loan will be treated, for purposes of determining (i) distributions on the Certificates, (ii) allocations of Realized Losses and Additional Trust Fund Expenses to the Certificates, and (iii) the amount of Trustee Fees and Servicing Fees payable under the Pooling and Servicing Agreement, as having remained outstanding until such REO Property is liquidated. In connection therewith, operating revenues and other proceeds derived from such REO Property (net of related operating costs) will be ‘‘applied’’ by the Master Servicer as principal, interest and other amounts that would have been ‘‘due’’ on such Mortgage Loan, and the Master Servicer will be required to make P&I Advances in respect of such Mortgage Loan, in all cases as if such Mortgage Loan had remained outstanding. References to ‘‘Mortgage Loan’’ or ‘‘Mortgage Loans’’ in the definitions of ‘‘Principal Distribution Amount’’ and ‘‘Weighted Average Net Mortgage Rate’’ are intended to include any Mortgage Loan as to which the related Mortgaged Property has become an REO Property (an ‘‘REO Loan’’). For purposes of this paragraph, the term Mortgage Loan includes the Whole Loans.
Allocation of Prepayment Premiums and Yield Maintenance Charges. In the event a borrower is required to pay any Prepayment Premium or Yield Maintenance Charge, the amount of such payments actually collected (and, in the case of a Co-Lender Loan, payable with respect to the related Mortgage Loan pursuant to the related Intercreditor Agreement) will be distributed in respect of the Offered Certificates, the Class A-4FL Regular Interest and Class A-MFL Regular Interest and the Class G Certificates, Class H Certificates, Class J Certificates and Class K Certificates as set forth below. ‘‘Yield Maintenance Charges’’ are fees paid or payable, as the context requires, as a result of a prepayme nt of principal on a Mortgage Loan, which fees have been calculated (based on Scheduled Payments on such Mortgage Loan) to compensate the holder of the Mortgage for reinvestment losses based on the value of
S-179
a discount rate at or near the time of prepayment; provided that in most cases, a minimum fee is required by the Mortgage Loan documents (usually calculated as a percentage of the outstanding principal balance of the Mortgage Loan). Any other fees paid or payable, as the context requires, as a result of a prepayment of principal on a Mortgage Loan, which are calculated based upon a specified percentage (which may decline over time) of the amount prepaid are considered ‘‘Prepayment Premiums’’.
Any Prepayment Premiums or Yield Maintenance Charges collected on a Mortgage Loan during the related Collection Period will be distributed as follows: on each Distribution Date and with respect to the collection of any Prepayment Premiums or Yield Maintenance Charges on the Mortgage Loans, the holders of each Class of Offered Certificates, the Class A-4FL Regular Interest and Class A-MFL Regular Interest and the Class G Certificates, Class H Certificates, Class J Certificates and Class K Certificates then entitled to distributions of principal with respect to the related Loan Group on such Distribution Date will be entitled to an amount of Prepayment Premiums or Yield Maintenance Charges equal to the product of (a) the amount of such Prepayment Premiums or Yield Maintenance Charges; (b) a fraction (which in no event may be greater than one), the numerator of which is equal to the excess, if any, of the Pass-Through Rate of such Class of Certificates or the Class A-4FL Regular Interest or the Class A-MFL Regular Interest over the relevant Discount Rate (as defined below), and the denominator of which is equal to the excess, if any, of the Mortgage Rate of the prepaid Mortgage Loan over the relevant Discount Rate; and (c) a fraction, the numerator of which is equal to the amount of principal distributable on such Class of Certificates or the Class A-4FL Regular Interest or the Class A-MFL Regular Interest on such Distribution Date with respect to the applicable Loan Group, and the denominator of which is the Principal Distribution Amount with respect to the applicable Loan Group for such Distribution Date.
If there is more than one such Class of Certificates or the Class A-4FL Regular Interest or Class A-MFL Regular Interest entitled to distributions of principal with respect to the related Loan Group, as applicable, on any particular Distribution Date on which a Prepayment Premium or Yield Maintenance Charge is distributable, the aggregate amount of such Prepayment Premium or Yield Maintenance Charge will be allocated among all such Classes of Certificates or the Class A-4FL Regular Interest or the Class A-MFL Regular Interest up to, and on a pro rata basis in accordance with, their respective entitlements thereto in accordance with, the first sentence of this paragraph. The portion, if any, of the Prepayment Premiums or Yield Maintenance Charges remaining after any such payments described above will be dist ributed to the holders of the Class IO Certificates.
The ‘‘Discount Rate’’ applicable to any Class of Offered Certificates, the Class A-4FL Regular Interest and Class A-MFL Regular Interest and the Class G Certificates, Class H Certificates, Class J Certificates and Class K Certificates will be equal to the discount rate stated in the related Mortgage Loan documents used in calculating the Yield Maintenance Charge with respect to such principal prepayment. To the extent that a discount rate is not stated therein, the Discount Rate will equal the yield (when compounded monthly) on the U.S. Treasury issue with a maturity date closest to the maturity date for the prepaid Mortgage Loan or REO Loan. In the event that there are two or more such U.S. Treasury issues (a) with the same coupon, the issue with the lowest yield will be utilized, and (b) w ith maturity dates equally close to the maturity date for the prepaid Mortgage Loan or REO Loan, the issue with the earliest maturity date will be utilized.
For an example of the foregoing allocation of Prepayment Premiums and Yield Maintenance Charges, see ‘‘SUMMARY OF PROSPECTUS SUPPLEMENT’’ in this prospectus supplement. The Depositor makes no representation as to the enforceability of the provision of any Mortgage Note requiring the payment of a Prepayment Premium or Yield Maintenance Charge, or of the collectibility of any Prepayment Premium or Yield Maintenance Charge. See ‘‘DESCRIPTION OF THE MORTGAGE POOL—Certain Terms and Conditions of the Mortgage Loans—Prepayment Provisions’’ in this prospectus supplement.
Distributions of Additional Interest. On each Distribution Date, any Additional Interest collected on an ARD Loan (and, with respect to any Co-Lender Loan, payable on the related Mortgage Loan pursuant to the terms of the related Intercreditor Agreement) during the related Collection Period will be distributed to the holders of the Class Z Certificates. There can be no assurance that any Additional Interest will be collected on the ARD Loans.
S-180
Subordination; Allocation of Losses and Certain Expenses
The rights of holders of the Subordinate Certificates and the Class A-MFL Regular Interest to receive distributions of amounts collected or advanced on the Mortgage Loans will be subordinated, to the extent described in this prospectus supplement, to the rights of holders of the Class A Certificates and the Class A-4FL Regular Interest and the Class IO Certificates and each other such Class of Subordinate Certificates or the Class A-MFL Regular Interest, if any, with a higher payment priority. This subordination provided by the Subordinate Certificates and the Class A-MFL Regular Interest is intended to enhance the likelihood of timely receipt by the holders of the Class A Certificates and the Class A-4FL Regular Interest and the Class IO Certificates of the full amount of Distributable Certificate Interest payable in respect of such Classes of Certificates on each Distribution Date, and the ultimate receipt by the holders of e ach Class of the Class A Certificates and the Class A-4FL Regular Interest of principal in an amount equal to the entire related Certificate Balance. Similarly, but to decreasing degrees, this subordination is also intended to enhance the likelihood of timely receipt by the holders of the Class A-MFL Regular Interest, Class A-J Certificates, Class B Certificates, Class C Certificates, Class D Certificates, Class E Certificates and Class F Certificates of the full amount of Distributable Certificate Interest payable in respect of such Classes of Certificates and the Class A-MFL Regular Interest on each Distribution Date and the ultimate receipt by the holders of such Certificates or Class A-MFL Regular Interest of, in the case of each such Class or Class A-MFL Regular Interest, principal equal to the entire related Certificate Balance. The protection afforded (a) to the holders of the Class F Certificates by means of the subordination of the Non - -Offered Certificates and (b) to the holders of the Class E Certificates by means of the subordination of the Non-Offered Certificates and the Class F Certificates and (c) to the holders of the Class D Certificates by means of the subordination of the Class E Certificates, the Class F Certificates and the Non-Offered Certificates and (d) to the holders of the Class C Certificates by means of the subordination of the Class D Certificates, the Class E Certificates, the Class F Certificates and the Non-Offered Certificates and (e) to the holders of the Class B Certificates by means of the subordination of the Class C Certificates, the Class D Certificates, the Class E Certificates, the Class F Certificates and the Non-Offered Certificates and (f) to the holders of the Class A-J Certificates, by means of the subordination of the Class B Certificates, the Class C Certificates, the Class D Certificate s, the Class E Certificates, the Class F Certificates and the Non-Offered Certificates and (g) to the holders of the Class A-MFL Regular Interest by means of the subordination of the Class A-J Certificates, the Class B Certificates, the Class C Certificates, the Class D Certificates, the Class E Certificates, the Class F Certificates and the Non-Offered Certificates and (h) to the holders of the Class A Certificates and the Class A-4FL Regular Interest and the Class IO Certificates by means of the subordination of the Subordinate Certificates and the Class A-MFL Regular Interest, will be accomplished by (i) the application of the Available Distribution Amount on each Distribution Date in accordance with the order of priority described under ‘‘—Distributions—Application of the Available Distribution Amount’’ above and (ii) the allocation of Realized Losses and Additional Trust Fund Expenses as described below. Until the first Distribution Date after the aggregate of the Certificate Balances of the Subordinate Certificates and the Class A-MFL Regular Interest have been reduced to zero, the Class A-4FL Regular Interest will receive principal payments only after the Certificate Balance of each of the Class A-1 Certificates, the Class A-2 Certificates, the Class A-PB Certificates and the Class A-3 Certificates has been reduced to zero, the Class A-3 Certificates will receive principal payments only after the Certificate Balance of each of the Class A-1 Certificates, the Class A-2 Certificates and the Class A-PB Certificates has been reduced to zero, the Class A-PB will receive principal payments (other than planned principal payments as described in this prospectus supplement) only after the Certificate Balance of each of the Class A-1 Certificates and the Class A-2 Certificates has been reduced to zero, the Class A-2 Certificates will re ceive principal payments only after the Certificate Balance of the Class A-1 Certificates has been reduced to zero and the Certificate Balance of the Class A-PB Certificates has been reduced to the Class A-PB Planned Principal Balance, and the Class A-1 Certificates will receive principal payments only after the Certificate Balance of the Class A-PB Certificates has been reduced to the Class A-PB Planned Principal Balance. However, after the Distribution Date on which the Certificate Balances of the Subordinate Certificates and the Class A-MFL Regular Interest have been reduced to zero, the Class A Certificates and the Class A-4FL Regular Interest, to the extent such Classes of Certificates remain outstanding, will bear shortfalls in collections and losses incurred in respect of the Mortgage Loans pro rata in respect of
S-181
distributions of principal and then the Class A Certificates and the Class A-4FL Regular Interest and Class IO Certificates, to the extent such Classes remain outstanding, will bear such shortfalls pro rata in respect of distributions of interest. No other form of credit support will be available for the benefit of the holders of the Offered Certificates.
Allocation to the Class A Certificates and the Class A-4FL Regular Interest, for so long as they are outstanding, of the entire Principal Distribution Amount with respect to the related Loan Group for each Distribution Date in accordance with the priorities described under ‘‘—Distributions—Application of the Available Distribution Amount’’ above will have the effect of reducing the aggregate Certificate Balance of the Class A Certificates and the Class A-4FL Regular Interest at a proportionately faster rate than the rate at which the aggregate Stated Principal Balance of the Mortgage Pool will reduce. Thus, as principal is distributed to the holders of such Class A Certificates and the Class A-4FL Regular Interest, the percentage interest in the Trust Fund evidence d by such Class A Certificates and the Class A-4FL Regular Interest will be decreased (with a corresponding increase in the percentage interest in the Trust Fund evidenced by the Subordinate Certificates and the Class A-MFL Regular Interest), thereby increasing, relative to their respective Certificate Balances, the subordination afforded such Class A Certificates or the Class A-4FL Regular Interest by the Subordinate Certificates and the Class A-MFL Regular Interest.
On each Distribution Date, following all distributions on the Certificates and the Class A-4FL Regular Interest and Class A-MFL Regular Interest to be made on such date, the aggregate of all Realized Losses and Additional Trust Fund Expenses related to all Mortgage Loans (without regard to Loan Groups) that have been incurred since the Cut-Off Date through the end of the related Collection Period and that have not previously been allocated as described below will be allocated among the respective Classes of Sequential Pay Certificates and the Class A-4FL Regular Interest and Class A-MFL Regular Interest, in each case, in reduction of their respective Certificate Balances as follows, but, with respect to the Classes of Sequential Pay Certificates and the Class A-4FL Regular Interest and Class A-MFL Regular Interest, in the aggregate only to the extent the aggregate Certificate Balance of all Classes of Sequential Pay Certificates and the Class A-4F L Regular Interest and Class A-MFL Regular Interest remaining outstanding after giving effect to the distributions on such Distribution Date exceeds the aggregate Stated Principal Balance of the Mortgage Pool that will be outstanding immediately following such Distribution Date: first, to the Class S Certificates, until the remaining Certificate Balance of such Class of Certificates is reduced to zero; second, to the Class Q Certificates, until the remaining Certificate Balance of such Class of Certificates is reduced to zero; third, to the Class P Cert ificates, until the remaining Certificate Balance of such Class of Certificates is reduced to zero; fourth, to the Class O Certificates, until the remaining Certificate Balance of such Class of Certificates is reduced to zero: fifth, to the Class N Certificates, until the remaining Certificate Balance of such Class of Certificates is reduced to zero; sixth, to the Class M Certificates, until the remaining Certificate Balance of such Class of Certificates is reduced to zero; seventh, to the Class L Certificates, until the remaining Certificate Balance of such Class of Certificates is reduced to zero; eighth, to the Class K Certificates, until the remaining Certificate Balance of such Class of Certificates is reduced to zero; ninth, to the Class J Certificates, until the remaining Certificate Balance of such Class of Certificates is reduced to zero; tenth, to the Class H Certificates, until the remaining Certificate Balance of such Class of Certificates is reduce d to zero; eleventh, to the Class G Certificates, until the remaining Certificate Balance of such Class of Certificates is reduced to zero; twelfth, to the Class F Certificates, until the remaining Certificate Balance of such Class of Certificates is reduced to zero; thirteenth, to the Class E Certificates, until the remaining Certificate Balance of such Class of Certificates is reduced to zero; fourteenth, to th e Class D Certificates, until the remaining Certificate Balance of such Class of Certificates is reduced to zero; fifteenth, to the Class C Certificates, until the remaining Certificate Balance of such Class of Certificates is reduced to zero; sixteenth, to the Class B Certificates, until the remaining Certificate Balance of such Class of Certificates is reduced to zero; seventeenth, to the Class A-J Certificates, until the remaining Certificate Balance of such Class of Certificates is reduced to zero; eighteenth, to the Class A-MFL Regular Interest until the remaining Certificate Balance of the Class A-MFL Regular Interest is reduced to zero; and last, to the Class A Certificates and the Class A-4FL Regular Interest, pro rata, in proportion to their respective outstanding Certificate Balances, until the remaining Certificate Balances of such Classes of Certificates are reduced to zero.
S-182
Generally, any losses and expenses that are associated with the Co-Lender Loans with Subordinate Companion Loans will be allocated in accordance with the terms of the related Intercreditor Agreement first, to the related Subordinate Companion Loan and second, to other related Mortgage Loan. The portion of those losses and expenses allocated to each of the related Mortgage Loans will be allocated among the Certificates in the manner described above. Any losses and expenses with respect to the Beacon D.C. & Seattle Pool Whole Loan will be allocated pro rata to the Beacon D.C. & Seattle Pool Loan, and the Beacon D.C. & Seattle Pool Pari Passu Companion Loans. Any losses and expenses with respect to the ING Hospitality Pool Whole Loan will be allocated, first, to the ING Hospitality Pool Subordinate Companion Loan, and then pro rata to the ING Hospitality Pool Loan, and the ING Hospitality Pool Pari Passu Companion Loan. Any losses and expenses with respect to the DDR Southeast Pool Whole Loan will be allocated pro rata to the DDR Southeast Pool Loan, and the DDR Southeast Pool Pari Pas su Companion Loans.
‘‘Realized Losses’’ are losses arising from the inability to collect all amounts due and owing under any defaulted Mortgage Loan, including by reason of the fraud or bankruptcy of the borrower or a casualty of any nature at the related Mortgaged Property, to the extent not covered by insurance. The Realized Loss in respect of a liquidated Mortgage Loan is an amount generally equal to the excess, if any, of (a) the outstanding principal balance of such Mortgage Loan as of the date of liquidation, together with (i) all accrued and unpaid interest thereon to but not including the Due Date in the Collection Period in which the liquidation occurred (exclusive of any related default interest in excess of the Mortgage Rate, Additional Interest, Prepayment Premium or Yield Maintenance Charges) and (ii) certain related unreimbursed servicing expenses (including any unreimbursed interest on any Advances), over (b) the aggregate amount of liquidation proceeds, if any, recovered in connection with such liquidation. If any portion of the debt due under a Mortgage Loan (other than Additional Interest and default interest in excess of the Mortgage Rate) is forgiven, whether in connection with a modification, waiver or amendment granted or agreed to by the Special Servicer or in connection with the bankruptcy or similar proceeding involving the related borrower, the amount so forgiven also will be treated as a Realized Loss. The Realized Loss in respect of a Mortgage Loan for which a Final Recovery Determination has been made includes nonrecoverable Advances (in each case, including interest on that nonrecoverable Advance) to the extent amounts have been paid from the Principal Distribution Amount pursuant to the Pooling and Servicing Agreement.
‘‘Additional Trust Fund Expenses’’ include, among other things, (i) any Special Servicing Fees, Liquidation Fees, Determination Party fees (in certain circumstances) or Workout Fees paid to the Special Servicer, (ii) any interest paid to the Master Servicer and/or the Trustee in respect of unreimbursed Advances (to the extent not otherwise offset by penalty interest and late payment charges) and amounts payable to the Special Servicer in connection with certain inspections of Mortgaged Properties required pursuant to the Pooling and Servicing Agreement (to the extent not otherwise offset by penalty interest and late payment charges otherwise payable to the Special Servicer and received in the Collection Period during which such inspection related expenses were incurred) and (iii) any of certain unanticipated ex penses of the Trust Fund, including certain indemnities and reimbursements to the Trustee of the type described under ‘‘DESCRIPTION OF THE POOLING AND SERVICING AGREEMENTS—Certain Matters Regarding the Trustee’’ in the accompanying prospectus, certain indemnities and reimbursements to the Master Servicer, the Special Servicer and the Depositor of the type described under ‘‘DESCRIPTION OF THE POOLING AND SERVICING AGREEMENTS—Certain Matters Regarding the Master Servicer and the Depositor’’ in the accompanying prospectus (the Special Servicer having the same rights to indemnity and reimbursement as described thereunder with respect to the Master Servicer), certain Rating Agency fees to the extent such fees are not paid by any other party and certain federal, state and local taxes and certain tax related expenses, payable from the assets of the Trust Fund and described under ‘‘MATERIAL FEDERAL INCOME TAX CONSEQUENCES&mda sh;Federal Income Tax Consequences for REMIC Certificates—Taxation of Owners of REMIC Residual Certificates’’ and ‘‘—Prohibited Transactions Tax and Other Taxes’’ in the accompanying prospectus and ‘‘SERVICING OF THE MORTGAGE LOANS—Defaulted Mortgage Loans; REO Properties; Purchase Option’’ in this prospectus supplement. Additional Trust Fund Expenses shall not include costs or fees incurred with respect to any swap contract.
S-183
Additional Trust Fund Expenses will reduce amounts payable to Certificateholders and, subject to the distribution priorities described above, may result in a loss on one or more Classes of Offered Certificates.
P&I Advances
On or about each Distribution Date, the Master Servicer is obligated, subject to the recoverability determination described below (and any other applicable limitations), to make advances (each, a ‘‘P&I Advance’’) out of its own funds or, subject to the replacement thereof as provided in the Pooling and Servicing Agreement, from funds held in the Certificate Account that are not required to be distributed to Certificateholders (or paid to any other Person pursuant to the Pooling and Servicing Agreement) on such Distribution Date, in an amount that is generally equal to the aggregate of all Periodic Payments (other than Balloon Payments) and any Assumed Scheduled Payments, net of related Master Servicing Fees in respect of the Mortgage Loans, as provided below, that are being serviced by the Master Servicer and the Special Servicer, as applicable and any REO Loans during the related Collection Period, in each case to the extent such amount was not paid by or on behalf of the related borrower or otherwise collected (or previously advanced by the Master Servicer) as of the close of business on the last day of the Collection Period. P&I Advances are intended to maintain a regular flow of scheduled interest and principal payments to the holders of the Class or Classes of Certificates entitled thereto, rather than to insure against losses. The Master Servicer’s obligations to make P&I Advances in respect of any Mortgage Loan, subject to the recoverability determination, will continue until liquidation of such Mortgage Loan or disposition of any REO Property acquired in respect thereof. However, if the Periodic Payment on any Mortgage Loan has been reduced in connection with a bankruptcy or similar proceeding or a modification, waiver or amendment granted or agreed to by the Special Servicer, the Master Servicer will b e required to advance only the amount of the reduced Periodic Payment (net of related Servicing Fees) in respect of subsequent delinquencies. In addition, if it is determined that an Appraisal Reduction Amount exists with respect to any Required Appraisal Loan (as defined below), then, with respect to the Distribution Date immediately following the date of such determination and with respect to each subsequent Distribution Date for so long as such Appraisal Reduction Amount exists, the Master Servicer or the Trustee, as applicable will be required in the event of subsequent delinquencies to advance in respect of such Mortgage Loan only an amount equal to the sum of (i) the amount of the interest portion of the P&I Advance that would otherwise be required without regard to this sentence, minus the product of (a) such Appraisal Reduction Amount and (b) the per annum Pass-Through Rate (i.e., for any month, one twelfth of the Pass-Through Rate) applicable to the Class of Certificates, to which such Appraisal Reduction Amount is allocated as described in ‘‘—Appraisal Reductions’’ below and (ii) the amount of the principal portion of the P&I Advance that would otherwise be required without regard to this sentence. Pursuant to the terms of the Pooling and Servicing Agreement, if the Master Servicer fails to make a P&I Advance required to be made, the Trustee will then be required to make such P&I Advance, in each such case, subject to the recoverability standard described below. Neither the Master Servicer nor the Trustee will be required to make a P&I Advance or any other advance for any Balloon Payments, default interest, late payment charges, Prepayment Pr emiums, Yield Maintenance Charges or Additional Interest. Neither the Master Servicer nor the Trustee will be required to make any P&I Advance with respect to any Subordinate Companion Loan. Neither the Master Servicer nor the Trustee will be required to make any P&I Advances with respect to any Companion Loan. The Master Servicer and Trustee will be required to make P&I Advances with respect to the Beacon D.C. & Seattle Pool Loan, the ING Hospitality Pool Loan and the DDR Southeast Pool Loan, subject to the same limitations, and with the same rights, as described above.
The Master Servicer (or the Trustee) is entitled to recover any P&I Advance made out of its own funds from any amounts collected in respect of the Mortgage Loan (net of related Master Servicing Fees with respect to collections of interest and net of related Liquidation Fees and Workout Fees with respect to collections of principal) as to which such P&I Advance was made whether such amounts are collected in the form of late payments, insurance and condemnation proceeds or liquidation proceeds, or any other recovery of the related Mortgage Loan or REO Property (‘‘Related Proceeds’’). Neither the Master Servicer nor the Trustee is obligated to make any P&I Advance that it or the Special Servicer determines, in accordance with the Servicing Standard (in the case of the Master Servicer and Special Servicer) or its good faith business judgment (in the case of the Trustee), would, if made, not be recoverable from Related
S-184
Proceeds (a ‘‘Nonrecoverable P&I Advance’’), and the Master Servicer (or the Trustee) is entitled to recover, from general funds on deposit in the Certificate Account, any P&I Advance made that it determines to be a Nonrecoverable P&I Advance plus interest at the Reimbursement Rate. In addition, both the Master Servicer and the Trustee will be entitled to recover any Advance (together with interest thereon) that is outstanding at the time that the related Mortgage Loan is modified in connection with such Mortgage Loan becoming a Corrected Mortgage Loan and is not repaid in full in connection with such modification but instead becomes an obligation of the borrower to pay such amounts in the future (such Advance, a ‘‘Workout-Delayed Reimbursement Amount’’) out of principal collections in the Certificate Account. Any amount that constitutes all or a portion of any Workout-Delayed Reimbursement Amount may at any time be determined to constitute a nonrecoverable Advance and thereafter shall be recoverable as any other nonrecoverable Advance. A Workout-Delayed Reimbursement Amount will constitute a nonrecoverable Advance when the person making such determination, and taking into account factors such as all other outstanding Advances, either (a) has determined in accordance with the Servicing Standard (in the case of the Master Servicer or the Special Servicer) or its good faith business judgment (in the case of the Trustee) that such Workout-Delayed Reimbursement Amount would not ultimately be recoverable from Related Proceeds, or (b) has determined in accordance with the Servicing Standard (in the case of the Master Servicer or the Special Servicer) or its good faith business judgment (in the case of the Trustee) that suc h Workout-Delayed Reimbursement Amount, along with any other Workout-Delayed Reimbursement Amounts and nonrecoverable Advances, would not ultimately be recoverable out of principal collections in the Certificate Account. In addition, any such person may update or change its recoverability determinations (but not reverse any other person’s determination that an Advance is nonrecoverable) at any time and may obtain at the expense of the Trust Fund any analysis, appraisals or market value estimates or other information for such purposes. Absent bad faith, any such determination that an Advance is nonrecoverable will be conclusive and binding on the Certificateholders, the Master Servicer and the Trustee. Any requirement of the Master Servicer or the Trustee to make an Advance in the Pooling and Servicing Agreement is intended solely to provide liquidity for the benefit of the Certificateholders and not as credit support or otherwise to impose on any such person the risk of loss with respect to o ne or more Mortgage Loans. See ‘‘DESCRIPTION OF THE CERTIFICATES—Advances in Respect of Delinquencies’’ and ‘‘DESCRIPTION OF THE POOLING AND SERVICING AGREEMENTS—Certificate Account’’ in the accompanying prospectus.
In connection with the recovery by the Master Servicer or the Trustee of any P&I Advance made by it or the recovery by the Master Servicer or the Trustee of any reimbursable servicing expense (which may include nonrecoverable advances to the extent deemed to be in the best interest of the Certificateholders) incurred by it (each such P&I Advance or expense, an ‘‘Advance’’), the Master Servicer or the Trustee, as applicable, is entitled to be paid interest compounded annually at a per annum rate equal to the Reimbursement Rate. Such interest will be paid contemporaneously with the reimbursement of the related Advance first out of late payment charges and default interest re ceived on the related Mortgage Loan in the Collection Period in which such reimbursement is made and then from general collections on the Mortgage Loans then on deposit in the Certificate Account; provided, however, no P&I Advance shall accrue interest until after the expiration of any applicable grace period for the related Periodic Payment. In addition, to the extent the Master Servicer receives late payment charges or default interest on a Mortgage Loan for which interest on Advances related to such Mortgage Loan has been paid from general collections on deposit in the Certificate Account and not previously reimbursed to the Trust Fund, such late payment charges or default interest will be used to reimburse the Trust Fund for such payment of interest. The ‘‘Reimbursement Rate’’ is equal to the ‘‘prime rate’’ published in the ‘‘Money Rates’’ Section of The Wall Street Journal, as such ‘‘prime rate’’ may change from time to time, accrued on the amount of such Advance from the date made to but not including the date of reimbursement. To the extent not offset or covered by amounts otherwise payable on the Non-Offered Certificates, interest accrued on outstanding Advances will result in a reduction in amounts payable on the Offered Certificates, subject to the distribution priorities described in this prospectus supplement.
Upon a determination that a previously made Advance is not recoverable, instead of obtaining reimbursement out of general collections immediately, the Master Servicer or the Trustee, as applicable, may, in its sole discretion, elect to obtain reimbursement for such nonrecoverable Advance over time (not
S-185
to exceed 12 months or such longer period of time as agreed to by the Master Servicer and the Controlling Class Representative, each in its sole discretion) and the unreimbursed portion of such Advance will accrue interest at the prime rate. At any time after such a determination to obtain reimbursement over time, the Master Servicer, the Special Servicer or the Trustee, as applicable, may, in its sole discretion, decide to obtain reimbursement immediately. The fact that a decision to recover such nonrecoverable Advances over time, or not to do so, benefits some Classes of Certificateholders to the detriment of other Classes shall not, with respect to the Master Servicer or the Special Servicer, constitute a violation of the Servicing Standard or contractual duty under the Pooling and Servicing Agreement and/or with respect to the Trustee, constitute a violation of any fiduciary duty to Certificateholders or contractual duty under the Pooling and Servicing Agreement. In the event that the Master Service r or the Trustee, as applicable, elects not to recover such non-recoverable advances over time, the Master Servicer or the Trustee, as applicable, will be required to give S&P and Moody’s at least 15 days’ notice prior to any such reimbursement to it of nonrecoverable Advances from amounts in the Certificate Account allocable to interest on the Mortgage Loans, unless the Master Servicer or the Trustee, as applicable, makes a determination not to give such notice in accordance with the terms of the Pooling and Servicing Agreement.
If the Master Servicer, the Trustee or the Special Servicer, as applicable, reimburses itself out of general collections on the Mortgage Pool for any Advance that it has determined is not recoverable out of collections on the related Mortgage Loan or reimburses itself out of general collections, related to principal only, on the Mortgage Pool for any Workout-Delayed Reimbursement Amount, then that Advance or Workout-Delayed Reimbursement Amount (together, in each case, with accrued interest thereon) will be deemed, to the fullest extent permitted pursuant to the terms of the Pooling and Servicing Agreement, to be reimbursed first out of the Principal Distribution Amount otherwise distributable on the applicable Certificates (prior to, in the case of nonrecoverable Advances only, being deemed reimbursed out of payments and other collections of interest on the underlying Mortgage Loans otherwise distributable on the applicable Certificates), thereby reducing the P rincipal Distribution Amount of such Certificates. To the extent any Advance is determined to be nonrecoverable and to the extent of each Workout-Delayed Reimbursement Amount, if the Advance or Workout-Delayed Reimbursement Amount is reimbursed out of the Principal Distribution Amount as described above and the item for which the Advance or Workout-Delayed Reimbursement Amount was originally made is subsequently collected from payments or other collections on the related Mortgage Loan, then the Principal Distribution Amount for the Distribution Date corresponding to the Collection Period in which this item was recovered will be increased by the lesser of (a) the amount of the item and (b) any previous reduction in the Principal Distribution Amount for a prior Distribution Date pursuant to this paragraph.
Appraisal Reductions
Other than with respect to the Beacon D.C. & Seattle Pool Loan and, after the securitization of the DDR Southeast Pool Pari Passu Note A-1 Companion Loan, the DDR Southeast Pool Loan, upon the earliest of the date (each such date, a ‘‘Required Appraisal Date’’) that (1) any Mortgage Loan is 60 days delinquent in respect of any Periodic Payments, (2) any REO Property is acquired on behalf of the Trust Fund in respect of any Mortgage Loan, (3) any Mortgage Loan has been modified by the Special Servicer to reduce the amount of any Periodic Payment, other than a Balloon Payment, (4) a receiver is appointed and continues in such capacity in respect of the related Mortgaged Property, (5) a borrower with respect to any Mortgage Loan becomes subject to any bankruptcy proceeding, (6) a Balloon Pa yment with respect to any Mortgage Loan has not been paid on its scheduled maturity date; provided, however, if the borrower continues to make its Assumed Scheduled Payment and diligently pursues refinancing, such Mortgage Loan will not become a Required Appraisal Loan until 60 days following such default or, if the Master Servicer has, within 60 days after the Due Date of such Balloon Payment, received written evidence from an institutional lender of such lender’s binding commitment (which is reasonably acceptable to the Special Servicer and the Controlling Class Representative has given its consent (which consent shall be deemed denied if not granted within 10 Business Days)) to refinance such Mortga ge Loan, 120 days following such default (provided that if such refinancing does not occur during such time specified in the commitment, the related Mortgage Loan will immediately become a Required Appraisal Loan) or (7) any Mortgage Loan is outstanding 60 days after the third anniversary of an extension of its
S-186
scheduled maturity date (each such Mortgage Loan, including an REO Loan, a ‘‘Required Appraisal Loan’’), the Special Servicer is required to obtain (within 60 days of the applicable Required Appraisal Date) an appraisal of the related Mortgaged Property prepared in accordance with 12 CFR Section 225.62 and conducted in accordance with the standards of the Appraisal Institute by a Qualified Appraiser (or with respect to any Mortgage Loan with an outstanding principal balance less than $2 million, an internal valuation performed by the Special Servicer), unless such an appraisal had previously been obtained within the prior twelve months. A ‘‘Qualified Appraiser’’ is an independent appraiser, selected by the Special Servic er or the Master Servicer, that is a member in good standing of the Appraisal Institute, and that, if the state in which the subject Mortgaged Property is located certifies or licenses appraisers, is certified or licensed in such state, and in each such case, who has a minimum of five years’ experience in the subject property type and market. The cost of such appraisal will be advanced by the Master Servicer, subject to the Master Servicer’s right to be reimbursed therefor out of Related Proceeds or, if not reimbursable therefrom, out of general funds on deposit in the Certificate Account. As a result of any such appraisal, it may be determined that an ‘‘Appraisal Reduction Amount’’ exists with respect to the related Required Appraisal Loan, such determination to be made by the Master Servicer on a monthly basis as described below. The Appraisal Reduction Amou nt for any Required Appraisal Loan will be calculated by the Master Servicer and will equal the excess, if any, of (a) the sum (without duplication), as of the first Determination Date immediately succeeding the Master Servicer’s obtaining knowledge of the occurrence of the Required Appraisal Date if no new appraisal is required or the date on which the appraisal or internal valuation, if applicable, is obtained and each Determination Date thereafter so long as the related Mortgage Loan remains a Required Appraisal Loan, of (i) the Stated Principal Balance of such Required Appraisal Loan and any Companion Loans related thereto, (ii) to the extent not previously advanced by or on behalf of the Master Servicer or the Trustee, all unpaid interest on the Required Appraisal Loan and any related Companion Loans, through the most recent Due Date prior to such Determination Date at a per annum rate equal to the related Net Mortgage Rate for the Required Appraisal Loan and the related fixed annualized rate of interest scheduled to accrue for the related Companion Loans (exclusive of any portion thereof that constitutes Additional Interest), (iii) all accrued but unpaid Servicing Fees and all accrued but unpaid Additional Trust Fund Expenses in respect of such Required Appraisal Loan and any related Companion Loans, plus, with respect to any Pari Passu Companion Loan, similar fees and expenses, (iv) all related unreimbursed Advances (plus accrued interest thereon) made by or on behalf of the Master Servicer, the Special Servicer or the Trustee with respec t to such Required Appraisal Loan and any related Companion Loan and (v) all currently due and unpaid real estate taxes and reserves owed for improvements and assessments, insurance premiums, and, if applicable, ground rents in respect of the related Mortgaged Property, over (b) an amount equal to the sum of (i) all escrows, reserves and letters of credit held for the purposes of reserves (provided that such letters of credit may be drawn upon for reserve purposes under the related Mortgage Loan documents) held with respect to such Required Appraisal Loan, plus (ii) 90% of the appraised value (net of any prior liens and estimated liquidation expenses) of the related Mortgaged Property as determined by such appraisal less any downward adjustments made by the Special Servicer (without implying any obligation to do so) based upon its review of the Appraisal and such other information as the Special Servicer deems appropriate. If the Special Servicer has not obtained a new appraisal (or performed an internal valuation, if applicable) within the time limit described above, the Appraisal Reduction Amount for the related Mortgage Loan will equal 25% of the principal balance of such Mortgage Loan, to be adjusted upon receipt of the new appraisal (or internal valuation, if applicable).
As a result of calculating an Appraisal Reduction Amount with respect to a Mortgage Loan, the interest portion of a P&I Advance for such Mortgage Loan for the related Distribution Date will be reduced, which will have the effect of reducing the amount of interest available for distribution to the Subordinate Certificates and the Class A-4FL Regular Interest and Class A-MFL Regular Interest in reverse order of entitlement to distribution with respect to such Classes. See ‘‘—P&I Advances’’ above. Any such Appraisal Reduction Amounts on Mortgage Loans with Subordinate Companion Loans will generally be allocated first, to the Subordinate Companion Loan, and second, to the related Mortgage Loan. For the purpose of calculating P&I Advances only, the aggregate Appraisal Reduction Amounts will be allocated to the Certificate Balance of each Class of Sequential Pay Certificates and the Class A-4FL Regular Interest and Class A-MFL Regular Interest in reverse order of payment priorities. With
S-187
respect to the Beacon D.C. & Seattle Pool Loan, the appraisal reduction amount will be calculated under the Morgan Stanley 2007-IQ14 Pooling and Servicing Agreement in a manner generally the same as an Appraisal Reduction Amount as described above. See ‘‘—Servicing of the Beacon D.C. & Seattle Pool Loan’’ in this prospectus supplement. With respect to the DDR Southeast Pool Loan, after the securitization of the DDR Southeast Pool Pari Passu Note A-1 Companion Loan, the appraisal reduction amount is expected to be calculated under the CGCMT 2007-C6 Pooling and Servicing Agreement in a manner generally the same as an Appraisal Reduction Amount as described above. See ‘‘—Servicing of the DDR Southeast Pool Loan’’ in this prospectus supplement.
Reports to Certificateholders; Available Information
Trustee Reports. Based solely on information provided in monthly reports prepared by the Master Servicer and the Special Servicer (and subject to the limitations with respect thereto) and delivered to the Trustee, the Trustee is required to provide or make available electronically (on the Trustee’s internet website initially located at www.ctslink.com) on each Distribution Date to the general public:
(a) A statement (a ‘‘Distribution Date Statement’’), substantially in the form of Annex C to this prospectus supplement, setting forth, among other things, for each Distribution Date:
(i) the amount of the distribution to the holders of each Class of Regular Certificates and the Class A-4FL and Class A-MFL Regular Interests in reduction of the Certificate Balance thereof;
(ii) the amount of the distribution to the holders of each Class of Regular Certificates and the Class A-4FL Regular Interest and Class A-MFL Regular Interest allocable to Distributable Certificate Interest and the applicable Interest Distribution Amount;
(iii) the amount of the distribution to the holders of each Class of Regular Certificates and the Class A-4FL Regular Interest and Class A-MFL Regular Interest allocable to Prepayment Premiums and Yield Maintenance Charges;
(iv) the amount of the distribution to the holders of each Class of Regular Certificates and the Class A-4FL Regular Interest and Class A-MFL Regular Interest in reimbursement of previously allocated Realized Losses and Additional Trust Fund Expenses;
(v) the Available Distribution Amount for such Distribution Date;
(vi) (a) the aggregate amount of P&I Advances made (including any such advance made on the Beacon D.C. & Seattle Pool Loan and, after the securitization of the DDR Southeast Pool Pari Passu Note A-1 Companion Loan, the DDR Southeast Pool Loan as required by the Morgan Stanley 2007-IQ14 Pooling and Servicing Agreement or the CGCMT 2007-C6 Pooling and Servicing Agreement, as applicable) in respect of such Distribution Date with respect to the Mortgage Pool and each Loan Group, and (b) the aggregate amount of servicing advances with respect to the Mortgage Pool and each Loan Group as of the close of business on the related Determination Date;
(vii) the aggregate unpaid principal balance of the Mortgage Pool and each Loan Group outstanding as of the close of business on the related Determination Date;
(viii) the aggregate Stated Principal Balance of the Mortgage Pool and each Loan Group outstanding immediately before and immediately after such Distribution Date;
(ix) the number, aggregate unpaid principal balance, weighted average remaining term to maturity or Anticipated Repayment Date and weighted average Mortgage Rate of the Mortgage Loans in the Mortgage Pool and each Loan Group as of the close of business on the related Determination Date;
(x) the number of Mortgage Loans and the aggregate Stated Principal Balance (immediately after such Distribution Date) of the Mortgage Loans (a) delinquent 30-59 days, (b) delinquent 60-89 days, (c) delinquent 90 days or more, (d) as to which foreclosure proceedings have been commenced and (e) with respect to each Specially Serviced Mortgage
S-188
Loan, the Mortgaged Property type and a brief description of the reason for delinquency and the Mortgage Loan’s status, if known by the Master Servicer or Special Servicer, as applicable, and provided to the Trustee;
(xi) as to each Mortgage Loan referred to in the preceding clause (x) above: (a) the loan number thereof, (b) the Stated Principal Balance thereof immediately following such Distribution Date and (c) a brief description of any loan modification;
(xii) with respect to any Mortgage Loan as to which a liquidation event occurred during the related Collection Period (other than a payment in full), (a) the loan number thereof, (b) the aggregate of all liquidation proceeds and other amounts received in connection with such liquidation event (separately identifying the portion thereof allocable to distributions on the Certificates), and (c) the amount of any Realized Loss in connection with such liquidation event;
(xiii) with respect to any REO Property included in the Trust Fund as to which the Special Servicer has determined, in accordance with the Servicing Standard, that all payments or recoveries with respect to such property have been ultimately recovered (a ‘‘Final Recovery Determination’’) was made during the related Collection Period, (a) the loan number of the related Mortgage Loan, (b) the aggregate of all liquidation proceeds and other amounts received in connection with such Final Recovery Determination (separately identifying the portion thereof allocable to distributions on the Certificates), and (c) the amount of any Realized Loss in respect of the related REO Property in connection with such Final Recovery Determination;
(xiv) the Accrued Certificate Interest in respect of each Class of Regular Certificates and the Class A-4FL Regular Interest and the Class A-MFL Regular Interest for such Distribution Date;
(xv) any unpaid Distributable Certificate Interest in respect of each Class of Regular Certificates and the Class A-4FL Regular Interest and the Class A-MFL Regular Interest after giving effect to the distributions made on such Distribution Date;
(xvi) the Pass-Through Rate for each Class of Regular Certificates and the Class A-4FL Regular Interest and the Class A-MFL Regular Interest for such Distribution Date;
(xvii) the Principal Distribution Amount;
(xviii) the Principal Distribution Amount, the Loan Group 1 Principal Distribution Amount and the Loan Group 2 Principal Distribution Amount for such Distribution Date (and, in the case of any principal prepayment or other unscheduled collection of principal received during the related Collection Period, the loan number for the related Mortgage Loan and the amount of such prepayment or other collection of principal);
(xix) the aggregate of all Realized Losses incurred during the related Collection Period and all Additional Trust Fund Expenses incurred during the related Collection Period;
(xx) the aggregate of all Realized Losses and Additional Trust Fund Expenses that were allocated to each Class of Certificates and the Class A-4FL Regular Interest and the Class A-MFL Regular Interest on such Distribution Date;
(xxi) the Certificate Balance of each Class of Regular Certificates (other than the Class IO Certificates) and the Class A-4FL Regular Interest and the Class A-MFL Regular Interest and the Notional Amount of the Class IO Certificates immediately before and immediately after such Distribution Date, separately identifying any reduction therein due to the allocation of Realized Losses and Additional Trust Fund Expenses on such Distribution Date;
(xxii) the certificate factor for each Class of Regular Certificates immediately following such Distribution Date;
(xxiii) the aggregate amount of interest on P&I Advances paid to the Master Servicer or the Trustee with respect to the Mortgage Pool and on an aggregate basis with respect to each Loan Group during the related Collection Period;
S-189
(xxiv) the aggregate amount of interest on servicing advances paid to the Master Servicer, the Special Servicer and the Trustee (or, with respect to the Beacon D.C. & Seattle Pool Loan, the Morgan Stanley 2007 IQ14 Master Servicer and, with respect to the DDR Southeast Loan after the securitization of the DDR Southeast Pool Pari Passu Note A-1 Companion Loan, the CGCMT 2007-C6 Master Servicer) with respect to the Mortgage Pool and each on an aggregate basis with respect to Loan Group during the related Collection Period;
(xxv) the aggregate amount of servicing fees and Trustee Fees paid to the Master Servicer, the Special Servicer and the Trustee, as applicable, during the related Collection Period;
(xxvi) the loan number for each Required Appraisal Loan and any related Appraisal Reduction Amount as of the related Determination Date;
(xxvii) the loan number for each Mortgage Loan which has experienced a material modification, extension or waiver;
(xxviii) the loan number for each Mortgage Loan which has experienced a breach of the representations and warranties given with respect to a Mortgage Loan by the applicable Mortgage Loan Seller, as provided by the Master Servicer or the Depositor;
(xxix) the original and, thereafter, the current credit support levels for each Class of Regular Certificates;
(xxx) the original and, thereafter, the current ratings for each Class of Regular Certificates;
(xxxi) the aggregate amount of Prepayment Premiums and Yield Maintenance Charges collected with respect to the Mortgage Pool and each Loan Group during the related Collection Period;
(xxxii) the amounts, if any, actually distributed with respect to the Class R-I Certificates, Class R-II Certificates and Class Z Certificates on such Distribution Date; and
(xxxiii) the value of any REO Property included in the Trust Fund as of the end of the Collection Period, based on the most recent appraisal or valuation.
(b) A ‘‘CMSA Loan Periodic Update File’’ and a ‘‘CMSA Property File’’ (in electronic form and substance as provided by the Master Servicer and/or the Special Servicer) setting forth certain information (with respect to CMSA Loan Periodic Update File, as of the related Determination Date) with respect to the Mortgage Loans and the Mortgaged Properties, respectively.
(c) A ‘‘CMSA Collateral Summary File’’ and a ‘‘CMSA Bond File’’ setting forth certain information with respect to the Mortgage Loans and the Certificates, respectively.
(d) A ‘‘CMSA Reconciliation of Funds Report’’ setting forth certain information with respect to the Mortgage Loans and the Certificates.
Copies of each Distribution Date Statement will be filed with the Securities and Exchange Commission (‘‘SEC’’) through its EDGAR system located at www.sec.gov under the name of the Issuing Entity for so long as the Issuing Entity is subject to the reporting requirement of the Securities Exchange Act of 1934, as amended. The public also may read and copy any materials filed with the SEC at its Public Reference Room located at 100 F Street, NE, Washington, DC 20549. The public may obtain information on the operation of the Public Reference Room by calling the SEC at 1-800-SEC-0330.
The Master Servicer and/or the Special Servicer is required to deliver (in electronic format acceptable to the Trustee and Master Servicer) to the Trustee prior to each Distribution Date and the Trustee is required to provide or make available electronically to each Certificateholder, the Depositor, the Underwriters and each Rating Agency on each Distribution Date, the following reports:
(a) CMSA Delinquent Loan Status Report;
(b) CMSA Historical Loan Modification and Corrected Mortgage Loan Report;
(c) CMSA REO Status Report;
S-190
(d) CMSA Servicer Watch List/Portfolio Review Guidelines;
(e) CMSA Operating Statement Analysis Report;
(f) CMSA NOI Adjustment Worksheet;
(g) CMSA Comparative Financial Status Report;
(h) CMSA Loan Level Reserve/LOC Report; and
(i) CMSA Advance Recovery Report.
Each of the reports referenced as CMSA reports will be in the form prescribed in the standard Commercial Mortgage Securities Association (‘‘CMSA’’) investor reporting package. Forms of these reports are available at the CMSA’s website located at www.cmbs.org.
The reports identified in clauses (a), (b), (c), (h) and (i) above are referred to in this prospectus supplement as the ‘‘Unrestricted Servicer Reports’’, and the reports identified in clauses (d), (e), (f) and (g) above are referred to in this prospectus supplement as the ‘‘Restricted Servicer Reports’’.
In addition, within a reasonable period of time after the end of each calendar year, the Trustee is required to send to each person who at any time during the calendar year was a Certificateholder of record, a report summarizing on an annual basis (if appropriate) certain items provided to Certificateholders in the monthly Distribution Date Statements and such other information as may be required to enable such Certificateholders to prepare their federal income tax returns. Such information is required to include the amount of original issue discount accrued on each Class of Certificates and information regarding the expenses of the Trust Fund. Such requirements shall be deemed to be satisfied to the extent such information is provided pursuant to applicable requirements of the Code in force from time to time.
The information that pertains to Specially Serviced Mortgage Loans reflected in reports will be based solely upon the reports delivered by the Special Servicer or the Master Servicer to the Trustee prior to the related Distribution Date. Absent manifest error, none of the Master Servicer, the Special Servicer or the Trustee will be responsible for the accuracy or completeness of any information supplied to it by a mortgagor or third party that is included in any reports, statements, materials or information prepared or provided by the Master Servicer, the Special Servicer or the Trustee, as applicable.
The Trustee is responsible for the preparation of tax returns on behalf of the Trust Fund and the preparation of monthly reports on Form 10-D (based on information included in the monthly Distribution Date Statements and other information provided by other transaction parties) and annual reports on Form 10-K that are required to be filed with the SEC on behalf of the Trust Fund.
The Trustee will make the Distribution Date Statement available each month to the general public via the Trustee’s internet website. The Trustee will also make the periodic reports described in the prospectus under ‘‘WHERE YOU CAN FIND MORE INFORMATION’’ and ‘‘INCORPORATION OF CERTAIN INFORMATION BY REFERENCE’’ relating to the Issuing Entity available through its website on the same date they are filed with the SEC. The Trustee’s internet website will initially be located at www.ctslink.com. Assistance in using the website can be obtained by calling the Trustee’s customer service desk at (866) 846-4526. Parties that are unable to use the website are entitled to have a paper copy mailed to them at no charge via first class mail by calling the customer service desk.
Book-Entry Certificates. Until such time as definitive Offered Certificates are issued in respect of the Book-Entry Certificates, the foregoing information will be available to the holders of the Book-Entry Certificates only to the extent it is forwarded by or otherwise available through DTC and its Participants. Any beneficial owner of a Book-Entry Certificate who does not receive information through DTC or its Participants may request that the Trustee reports be mailed directly to it by written request to the Trustee (accompanied by evidence of such beneficial ownership) at the Corporate Trust Office of the Trustee. The manner in which notices and other communications are conveyed by DTC to its Participants, and by its Participants to the holders of the Book-Entry Certificates, will be governed by arrangements among them, subject to any statutor y or regulatory requirements as may be in effect from time to time. The Master Servicer, the Special Servicer, the Trustee and the Depositor are required to recognize as Certificateholders only those persons in whose names the Certificates are registered on the books and records of the Certificate Registrar.
S-191
Information Available Electronically. On or prior to each Distribution Date, the Trustee will make available to the general public via its internet website, initially located at www.ctslink.com, (i) the related Distribution Date Statement, (ii) the CMSA Loan Periodic Update File, CMSA Loan Setup File, CMSA Bond File and CMSA Collateral Summary File, (iii) the Unrestricted Servicer Reports, (iv) as a convenience for the general public (and not in furtherance of the distribution thereof under the securities laws), this prospectus supplement, the accompanying prospectus and the Pooling and Servicing Agreement, and (v) any other items at the request of the Depositor.
In addition, on each Distribution Date, the Trustee will make available via its internet website, on a restricted basis, (i) the Restricted Servicer Reports and (ii) the CMSA Property File. The Trustee shall provide access to such restricted reports, upon receipt of a certification in the form attached to the Pooling and Servicing Agreement, to Certificate Owners and prospective transferees, and upon request to any other Privileged Person and to any other person upon the direction of the Depositor.
The Trustee and Master Servicer make no representations or warranties as to the accuracy or completeness of any report, document or other information made available on its internet website and assumes no responsibility therefor. In addition, the Trustee and the Master Servicer may disclaim responsibility for any information distributed by the Trustee or the Master Servicer, as the case may be, for which it is not the original source.
The Master Servicer may make available each month via the Master Servicer’s internet website, initially located at www.wachovia.com (i) to any interested party, the Unrestricted Servicer Reports, the CMSA Loan Setup File and the CMSA Loan Periodic Update File, and (ii) to any Privileged Person, with the use of a password provided by the Master Servicer to such Privileged Person, the Restricted Servicer Reports and the CMSA Property File. For assistance with the Master Servicer’s internet website, investors may call (800) 326-1334.
‘‘Privileged Person’’ means any Certificateholder or any person identified to the Trustee or the Master Servicer, as applicable, as a prospective transferee of an Offered Certificate or any interests therein (that, with respect to any such holder or Certificate Owner or prospective transferee, has provided to the Trustee or the Master Servicer, as applicable, a certification in the form attached to the Pooling and Servicing Agreement), any Rating Agency, the Mortgage Loan Sellers, any holder of a Companion Loan, the Depositor and its designees, the Underwriters or any party to the Pooling and Servicing Agreement.
In connection with providing access to the Trustee’s internet website or the Master Servicer’s internet website, the Trustee or the Master Servicer, as applicable, may require registration and the acceptance of a disclaimer. Neither the Trustee nor the Master Servicer shall be liable for the dissemination of information in accordance with the Pooling and Servicing Agreement.
Other Information. The Pooling and Servicing Agreement requires that the Master Servicer or the Special Servicer make available at its offices primarily responsible for administration of the Trust Fund, during normal business hours, or send the requesting party at the expense of such requesting party, for review by any holder or Certificate Owner owning an Offered Certificate or an interest therein or any person identified by the Trustee to the Master Servicer or Special Servicer, as the case may be, as a prospective transferee of an Offered Certificate or an interest therein, originals or copies of, among other things, the following items: (a) the Pooling and Servicing Agreement and any amendments thereto, (b) all Distribution Date Statements delivered to holders of the relevant Class of Offered Certificates since th e Closing Date, (c) all officers’ certificates delivered by the Master Servicer since the Closing Date as described under ‘‘DESCRIPTION OF THE POOLING AND SERVICING AGREEMENTS—Evidence as to Compliance’’ in the accompanying prospectus, (d) all accountants’ reports delivered with respect to the Master Servicer since the Closing Date as described under ‘‘DESCRIPTION OF THE POOLING AND SERVICING AGREEMENTS—Evidence as to Compliance’’ in the accompanying prospectus, (e) the most recent property inspection report prepared by or on behalf of the Master Servicer in respect of each Mortgaged Property, (f) the most recent Mortgaged Property annual operating statements and rent roll, if any, collected by or on behalf of the Master Servicer, (g) any and all modifications, waivers and amendments of the terms of a Mortgage Loan entered into by the Special Servicer, (h) the Mortgage File relating to ea ch Mortgage Loan, and (i) any and all officers’ certificates and other evidence prepared by the Master Servicer or the Special Servicer to support its
S-192
determination that any Advance was or, if made, would not be recoverable from Related Proceeds. Copies of any and all of the foregoing items will be available from the Master Servicer or Special Servicer, as the case may be, upon request; however, the Master Servicer or Special Servicer, as the case may be, will be permitted to require (other than from the Rating Agencies) a certification from the person seeking such information (covering, among other matters, confidentiality) and payment of a sum sufficient to cover the reasonable costs and expenses of providing such information to Certificateholders, Certificate Owners and their prospective transferees, including, without limitation, copy charges and reasonable fees for employee time and for space.
Assumed Final Distribution Date; Rated Final Distribution Date
The ‘‘Assumed Final Distribution Date’’ with respect to any Class of Regular Certificates is the Distribution Date on which the Certificate Balance of such Class of Certificates would be reduced to zero based on the assumption that no Mortgage Loan is voluntarily prepaid prior to its stated maturity date (except for the ARD Loans which are assumed to be paid in full on their respective Anticipated Repayment Dates) and otherwise based on the ‘‘Table Assumptions’’ set forth under ‘‘YIELD AND MATURITY CONSIDERATIONS—Weighted Average Life’’ in this prospectus supplement, which Distribution Date shall in each case be as follows:
| Class Designation | Assumed Final Distribution Date | ||
| Class A-1 | March 15, 2012 | ||
| Class A-2 | June 15, 2012 | ||
| Class A-PB | February 15, 2017 | ||
| Class A-3 | May 15, 2017 | ||
| Class A-1A | May 15, 2017 | ||
| Class IO | N/A | ||
| Class A-J | June 15, 2017 | ||
| Class B | June 15, 2017 | ||
| Class C | June 15, 2017 | ||
| Class D | July 15, 2017 | ||
| Class E | July 15, 2017 | ||
| Class F | July 15, 2017 |
The Assumed Final Distribution Dates set forth above were calculated without regard to any delays in the collection of Balloon Payments and without regard to a reasonable liquidation time with respect to any Mortgage Loans that may be delinquent. Accordingly, in the event of defaults on the Mortgage Loans, the actual final Distribution Date for one or more Classes of the Offered Certificates may be later, and could be substantially later, than the related Assumed Final Distribution Date(s).
In addition, the Assumed Final Distribution Dates set forth above were calculated on the basis of a 0% CPR (as defined in this prospectus supplement) (except that it is assumed that the ARD Loans pay their respective principal balances on their related Anticipated Repayment Dates) and no losses on the Mortgage Loans. Because the rate of principal payments (including prepayments) on the Mortgage Loans can be expected to exceed the scheduled rate of principal payments, and could exceed such scheduled rate by a substantial amount, and because losses may occur in respect of the Mortgage Loans, the actual final Distribution Date for one or more Classes of the Offered Certificates may be earlier, and could be substantially earlier, than the related Assumed Final Distribution Date(s). The rate of principal payments (including prepayments) on the Mortgage Loans will depend on the characteristics of the Mortgage Loans, as well as on the prevailing level of interest rates and other economic factors, and no assurance can be given as to actual principal payment experience. Finally, the Assumed Final Distribution Dates were calculated assuming there would not be an early termination of the Trust Fund. See ‘‘YIELD AND MATURITY CONSIDERATIONS’’ and ‘‘DESCRIPTION OF THE MORTGAGE POOL’’ in this prospectus supplement and ‘‘YIELD CONSIDERATIONS’’ and ‘‘DESCRIPTION OF THE TRUST FUNDS’’ in the accompanying prospectus.
S-193
The ‘‘Rated Final Distribution Date’’ with respect to each Class of Offered Certificates is the Distribution Date in June, 2049, the first Distribution Date that follows the second anniversary of the end of the amortization term for the Mortgage Loan that, as of the Cut-Off Date, has the longest remaining amortization term. The rating assigned by a Rating Agency to any Class of Offered Certificates entitled to receive distributions in respect of principal reflects an assessment of the likelihood that Certificateholders of such Class will receive, on or before the Rated Final Distribution Date, all principal distributions to which they are entitled. See ‘‘RATINGS’’ in this prospectus supplement.
Voting Rights
At all times during the term of the Pooling and Servicing Agreement, 100% of the voting rights for the Certificates (the ‘‘Voting Rights’’) will be allocated among the respective Classes of Certificates as follows: (i) 4.0% in the case of the Class IO Certificates and (ii) in the case of any Class of Sequential Pay Certificates, a percentage equal to the product of 96.0% and a fraction, the numerator of which is equal to the aggregate Certificate Balance of such Class of Certificates (as adjusted by treating any Appraisal Reduction Amount as a Realized Loss solely for the purposes of adjusting Voting Rights) and the denominator of which is equal to the aggregate Certificate Balances of all Classes of Sequential Pay Certificates, determined as of the Distribution Date immediately preceding such time; provided, however, the treatment of any Appraisal Reduction Amount as a Realized Loss shall not reduce the Certificate Balances of any Class for the purpose of determining the Controlling Class, the Controlling Class Representative or the Majority Subordinate Certificateholder. The holders of the Class R-I Certificates, Class R-II Certificates and Class Z Certificates will not be entitled to any Voting Rights. Voting Rights allocated to a Class of Certificates will be allocated among the related Certificateholders in proportion to the percentage interests in such Class evidenced by their respective Certificates. The Class A-1 Certificates, Class A-2 Certificates, Class A-PB Certificates, Class A-3 C ertificates and Class A-1A Certificates will be treated as one Class for determining the Controlling Class. In addition, if either the Master Servicer or the Special Servicer is the holder of any Sequential Pay Certificate, neither the Master Servicer nor Special Servicer, in its capacity as a Certificateholder, will have Voting Rights with respect to matters concerning compensation affecting the Master Servicer or the Special Servicer. See ‘‘DESCRIPTION OF THE CERTIFICATES—Voting Rights’’ in the accompanying prospectus.
Termination
The obligations created by the Pooling and Servicing Agreement will terminate following the earlier of (i) the final payment (or advance in respect thereof) or other liquidation of the last Mortgage Loan or REO Property, and (ii) the purchase of all of the Mortgage Loans and all of the REO Properties, if any, remaining in the Trust Fund by the Master Servicer, the Special Servicer or any single Certificateholder (so long as such Certificateholder is not an affiliate of the Depositor or a Mortgage Loan Seller) that is entitled to greater than 50% of the Voting Rights allocated to the Class of Sequential Pay Certificates with the lowest payment priority then outstanding (or if no Certificateholder is entitled to greater than 50% of the Voting Rights of such Class, the Certificateholder with the largest percentage of Voting Rights allocated to such Class) (the ‘‘Majority Subordinate Cert ificateholder’’) and distribution or provision for distribution thereof to the Certificateholders. Certain of the parties purchasing the assets of the Trust Fund mentioned above may be affiliates of the Depositor, the Sponsors, the Master Servicer, the Special Servicer or the Trustee. Written notice of termination of the Pooling and Servicing Agreement will be given to each Certificateholder, and the final distribution will be made only upon surrender and cancellation of the Certificates at the office of the Trustee or other registrar for the Certificates or at such other location as may be specified in such notice of termination.
Any such purchase by the Master Servicer, the Special Servicer or the Majority Subordinate Certificateholder of all the Mortgage Loans and all of the REO Properties, if any, remaining in the Trust Fund is required to be made at a price equal to (i) the aggregate Purchase Price of all the Mortgage Loans (other than REO Loans) then included in the Trust Fund, plus (ii) the fair market value of all REO Properties then included in the Trust Fund, as determined by an independent appraiser selected by the Master Servicer and approved by the Trustee (which may be less than the Purchase Price for the corresponding REO Loan), minus (iii) if the purchaser is the Mast er Servicer, the aggregate of amounts
S-194
payable or reimbursable to the Master Servicer under the Pooling and Servicing Agreement. Such purchase will effect early retirement of the then outstanding Offered Certificates, but the right of the Master Servicer, the Special Servicer or the Majority Subordinate Certificateholder to effect such purchase is subject to the requirement that the aggregate principal balance of the Mortgage Loans is less than 1% of the Cut-Off Date Pool Balance.
The purchase price paid in connection with the purchase of all Mortgage Loans and REO Properties remaining in the Trust Fund, exclusive of any portion thereof payable or reimbursable to any person other than the Certificateholders, will constitute part of the Available Distribution Amount for the final Distribution Date. The Available Distribution Amount for the final Distribution Date will be distributed by the Trustee generally as described under ‘‘—Distributions—Application of the Available Distribution Amount’’ in this prospectus supplement, except that the distributions of principal on any Class of Sequential Pay Certificates and the Class A-4FL and Class A-MFL Regular Interests described thereunder will be made, subject to available funds and the distribution priorities described thereunder, in an amount equal to the entire Certificate Balance of such Class of Certificates or the Class A-4FL and Class A-MFL Reg ular Interests remaining outstanding.
An exchange by any Certificateholder of all of the then outstanding Certificates (other than the Class Z Certificates and the REMIC Residual Certificates) for all of the Mortgage Loans and each REO Property remaining in the Trust Fund may be made: (i) if the then outstanding Certificates (other than the Class Z Certificates and the REMIC Residual Certificates) are held by a single Certificateholder, (ii) after the Class A-1 Certificates, Class A-2 Certificates, Class A-PB Certificates, Class A-3 Certificates, Class A-1A Certificates, Class A-J Certificates, Class B Certificates, Class C Certificates, Class D Certificates, Class E Certificates and Class F Certificates and the Class A-4FL Regular Interest and Class A-MFL Regular Interest have been paid in full, and (iii) by giving written notice to each of the parties to the Pooling and Servicing Agreement no later than 30 da ys prior to the anticipated date of exchange. In the event that such Certificateholder elects to exchange its Certificates for all of the Mortgage Loans and each REO Property remaining in the Trust Fund, such Certificateholder must deposit in the Certificate Account, in immediately available funds, an amount equal to all amounts then due and owing to the Master Servicer, the Special Servicer, the Trustee, the Certificate Registrar, the REMIC Administrator and their respective agents under the Pooling and Servicing Agreement.
For purposes of the foregoing provisions relating to termination of the Trust Fund, with respect to the Beacon D.C. & Seattle Pool Loan and the DDR Southeast Pool Loan, the term REO Property refers to the Trust Fund’s beneficial interest in the related REO Property under the Morgan Stanley 2007-IQ14 Pooling and Servicing Agreement and, after the securitization of the DDR Southeast Pool Pari Passu Note A-1 Companion Loan, the CGCMT 2007-C6 Pooling and Servicing Agreement.
The Trustee
Wells Fargo Bank, N.A. (‘‘Wells Fargo Bank’’) is acting as trustee (the ‘‘Trustee’’) pursuant to the Pooling and Servicing Agreement. See ‘‘DESCRIPTION OF THE POOLING AND SERVICING AGREEMENTS—The Trustee’’, ‘‘—Duties of the Trustee’’, ‘‘—Certain Matters Regarding the Trustee’’ and ‘‘—Resignation and Removal of the Trustee’’ in the accompanying prospectus. Any expenses incurred in removing the Trustee and/or appointing a successor trustee will be Additional Trust Fund Expenses; provided, however, in the event that the Trustee is removed pursuant to the terms of the Pooling and Servicing Agreement, or resigns or transfers its business, the Trustee shall bear all such expenses incurred by the Trust Fund in appointing a successor trustee; provided, however, if the Trustee is removed without cause, the removing party shall pay the expenses of appointing a successor trustee. As compensation for its services, the Trustee will be entitled to receive monthly, from general funds on deposit in the Di stribution Account, the Trustee Fee. The ‘‘Trustee Fee’’ for each Mortgage Loan and each REO Loan for any Distribution Date equals one month’s interest for the most recently ended calendar month (calculated on the basis of a 360 day year consisting of twelve 30 day months), accrued at the ‘‘Trustee Fee Rate’’ on the Stated Principal Balance of such Mortgage Loan or REO Loan, as the case may be, outstanding immediately following the prior Distribution Date (or, in the case of the initial Distribution Date, as of the Closing Date). The Trustee Fee Rate is a per annum rate set forth in the Pooling and Servicing Agreement. In addition, the Trustee will be entitled to recover from the Trust Fund all
S-195
reasonable unanticipated expenses and disbursements incurred or made by the Trustee in accordance with any of the provisions of the Pooling and Servicing Agreement, but not including expenses incurred in the ordinary course of performing its duties as Trustee under the Pooling and Servicing Agreement, and not including any such expense, disbursement or advance as may arise from its willful misconduct, negligence or bad faith. The Trustee will not be entitled to any fee with respect to any Companion Loan. The Trustee also has certain duties with respect to REMIC Administration (in such capacity, the ‘‘REMIC Administrator’’). See ‘‘MATERIAL FEDERAL INCOME TAX CONSEQUENCES—Federal Income Tax Consequences for REMIC Certificates—Taxation of Owners of REMIC Residual Certificates’’ and ‘‘—Reporting and Other Administrative Ma tters’’ in the accompanying prospectus.
The Trustee and any director, officer, employee, affiliate, agent or ‘‘control’’ person within the meaning of the Securities Act of the Trustee will be entitled to be indemnified for and held harmless by the Trust Fund against any loss, liability or reasonable ‘‘out of pocket’’ expense (including, without limitation, costs and expenses of litigation, and of investigation, counsel fees, damages, judgments and amounts paid in settlement) arising out of, or incurred in connection with the Pooling and Servicing Agreement, the Mortgage Loans or the Certificates or any act of the Master Servicer or the Special Servicer taken on behalf of the Trustee as provided for in the Pooling and Servicing Agreement; provided that such expense is an ‘‘unanticipated expense inc urred by the REMIC’’ within the meaning of Treasury Regulations Section 1.860G-1(b)(3)(ii); provided, further, neither the Trustee, nor any of the other above specified persons will be entitled to indemnification pursuant to the Pooling and Servicing Agreement for (1) any liability specifically required to be borne thereby pursuant to the terms of the Pooling and Servicing Agreement, or (2) any loss, liability or expense incurred by reason of willful misfeasance, bad faith or negligence in the performance of the Trustee’s obligations and duties under the Pooling and Servicing Agreement, or by reason of its negligent disregard of such obligations and duties, or as may arise from a breac h of any representation, warranty or covenant of the Trustee, as applicable, made in the Pooling and Servicing Agreement.
Wells Fargo Bank will act as Trustee and Custodian under the Pooling and Servicing Agreement. Wells Fargo Bank is a national banking association and a wholly owned subsidiary of Wells Fargo & Company, a diversified financial services company with approximately $482 billion in assets, 23 million customers and 158,000 employees as of December 31, 2006. Wells Fargo & Company is a U.S. bank holding company, providing banking, insurance, trust, mortgage and consumer finance services throughout the United States. Wells Fargo Bank provides retail and commercial banking services and corporate trust, custody, securities lending, securities transfer, cash management, investment management and other financial and fiduciary services. The Depositor, the Sponsors, the Mortgage Loan Sellers, the Master Servicer and the Special Servicer may maintain banking and other commercial relationships with Wells Fargo Bank and its affiliates. The Trustee has served as l oan file custodian for various mortgage loans owned by the Sponsors, including for Mortgage Loans included in the Trust Fund. The terms of the custodial agreements are customary for the commercial mortgage backed securities industry and provide for the delivery, receipt, review and safekeeping of mortgage loan files. The terms of the Pooling and Servicing Agreement with respect to the custody of the Mortgage Loans supersede any such custodial agreement. Wells Fargo Bank’s principal corporate trust offices are located at 9062 Old Annapolis Road, Columbia, Maryland 21045-1951 and its office for certificate transfer services is located at Sixth Street and Marquette Avenue, Minneapolis, Minnesota 55479-0113.
Wells Fargo Bank has provided corporate trust services since 1934. Wells Fargo Bank acts as trustee with respect to a variety of transactions and asset types including corporate and municipal bonds, mortgage backed and asset backed securities and collateralized debt obligations. As of December 31, 2006, Wells Fargo Bank was acting as trustee on more than 285 series of commercial mortgage backed securities with an aggregate principal balance of over $290 billion.
In its capacity as trustee on commercial mortgage securitizations, Wells Fargo Bank is generally required to make an advance if the related master servicer or special servicer fails to make a required advance. In the past three years, Wells Fargo Bank has not been required to make an advance on a commercial mortgage backed securities transaction.
Under the terms of the Pooling and Servicing Agreement, the Trustee is responsible for securities administration, which includes pool performance calculations, distribution calculations and the preparation
S-196
of monthly distribution reports. As securities administrator, the Trustee is responsible for the preparation of all REMIC tax returns on behalf of the REMICs and the preparation of monthly reports on Form 10-D (in regards to distribution and pool performance information) and annual reports on Form 10-K that are required to be filed with the SEC on behalf of the Trust Fund. Wells Fargo Bank has been engaged in the business of securities administration in connection with mortgage backed securities in excess of 20 years and in connection with commercial mortgage backed securities since 1997. It has acted as securities administrator with respect to more than 360 series of commercial mortgage backed securities, and, as of December 31, 2006, was acting as securities administrator with respect to more than $340 billion of outstanding commercial mortgage backed securities.
Wells Fargo Bank’s assessment of compliance with applicable servicing criteria for the twelve months ended December 31, 2006, furnished pursuant to Item 1122 of Regulation AB, discloses that it was not in compliance with the 1122(d)(3)(i) servicing criterion during that reporting period. The assessment of compliance indicates that certain monthly investor or remittance reports included errors in the calculation and/or the reporting of delinquencies for the related pool assets, which errors may or may not have been material, and that all such errors were the result of data processing errors and/or the mistaken interpretation of data provided by other parties participating in the servicing function. The assessment further states that all necessary adjustments to Wells Fargo Bank’s data processing systems and/or interpretive clarifications have been made to correct those errors and to remedy related procedures. Despite the fact that the platform of tran sactions to which such assessment of compliance relates included commercial mortgage-backed securities transactions, the errors described above did not occur with respect to any such commercial mortgage-backed securities transactions.
There have been no material changes to Wells Fargo Bank’s policies or procedures with respect to its securities administration function other than changes required by applicable laws.
In the past three years, Wells Fargo Bank has not materially defaulted in its securities administration obligations under any pooling and servicing agreement or caused an early amortization or other performance triggering event because of servicing by Wells Fargo Bank with respect to commercial mortgage backed securities.
The Trustee is also authorized to invest or direct the investment of funds held in the Distribution Account, the Floating Rate Account, the Interest Reserve Account, the Additional Interest Account and the Gain on Sale Reserve Account maintained by it that relate to the Mortgage Loans and REO Properties, as the case may be, in certain short term United States government securities and certain other permitted investment grade obligations, and the Trustee will be entitled to retain any interest or other income earned on such funds held in those accounts maintained by it, but shall be required to cover any losses on investments of funds held in those accounts maintained by it, from its own funds without any right to reimbursement, except in certain limited circumstances described in the Pooling and Servicing Agreement.
S-197
Yield and Maturity Considerations
Yield Considerations
General. The yield on any Offered Certificate will depend on, among other things, (a) the price at which such Certificate is purchased by an investor and (b) the rate, timing and amount of distributions on such Certificate. The rate, timing and amount of distributions on any Offered Certificate will in turn depend on, among other things, (i) the Pass-Through Rate for such Certificate, (ii) the rate and timing of principal payments (including principal prepayments) and other principal collections on the Mortgage Loans and the extent to which such amounts are to be applied in reduction of the Certificate Balance, (iii) the rate, timing and severity of Realized Losses and Additional Trust Fund Expenses and the extent to which such losses and expenses are allocable in reduction of the Certificate Balance, and (iv) the tim ing and severity of any Net Aggregate Prepayment Interest Shortfalls and the extent to which such shortfalls allocable are in reduction of the Distributable Certificate Interest payable on the related Class.
Rate and Timing of Principal Payment. The yield to holders of any Offered Certificates purchased at a discount or premium will be affected by the rate and timing of principal payments made in reduction of the Certificate Balance of any Class of Sequential Pay Certificates. As described in this prospectus supplement, the Loan Group 1 Principal Distribution Amount (and, after the Class A-1A Certificates have been retired, any remaining Loan Group 2 Principal Distribution Amount) for each Distribution Date will generally be distributable first to reduce the Certificate Balance of the Class A-PB Certificates to the Class A-PB Planned Principal Balance, then, to the Class A-1 Certificates until the Certificate Balance thereof is reduced to zero, then, to the Class A-2 Certificates until the Certificate Balance thereof is reduced to zero, then to the Class A-PB Certificates until the Certificate Balance thereof is reduced to zero, then, to the Class A-3 Certificates until the Certificate Balance thereof is reduced to zero, and then, to the Class A-4FL Regular Interest until the Certificate Balance thereof is reduced to zero. The Loan Group 2 Principal Distribution Amount (and, after the Class A-4FL Regular Interest has been retired, any remaining Loan Group 1 Principal Distribution Amount) for each Distribution Date will generally be distributable first to the Class A-1A Certificates. After those distributions, the remaining Principal Distribution Amount with respect to the Mortgage Pool will generally be distributable entirely in respect of the Class A-MFL Regular Interest and then to the Class A-J Certificates, Class B Certificates, Class C Certificates, Class D Certificates, Class E Certificates, Class F Certificates and then the Non-Offered Certificates (othe r than the Class R and Class Z Certificates), in that order, in each case until the Certificate Balance of such Class of Certificates or the Class A-4FL Regular Interest or the Class A-MFL Regular Interest is reduced to zero. Consequently, the rate and timing of principal payments that are distributed or otherwise result in reduction of the Certificate Balance of any Class of Offered Certificates will be directly related to the rate and timing of principal payments on or in respect of the Mortgage Loans, which will in turn be affected by the amortization schedules thereof, the dates on which Balloon Payments are due, any extension of maturity dates by the Master Servicer, the Morgan Stanley 2007-IQ14 Master Servicer or the Morgan Stanley 2007-IQ14 Special Servicer or the CGCMT 2007-C6 Master Servicer or the CGCMT 2007-C6 Special Servicer and the rate and timing of principal prepayments and other unscheduled collections thereon (including for this purpose, collections made in connection with li quidations of Mortgage Loans due to defaults, casualties or condemnations affecting the Mortgaged Properties, or purchases of Mortgage Loans out of the Trust Fund). Furthermore, because the amount of principal that will be distributed to the Class A-1 Certificates, Class A-2 Certificates, Class A-PB Certificates, Class A-3 Certificates and Class A-1A Certificates and the Class A-4FL Regular Interest will generally be based upon the particular Loan Group that the related Mortgage Loan is deemed to be in, the yield on the Class A-1 Certificates, Class A-2 Certificates, Class A-PB Certificates, Class A-3 Certificates and the Class A-4FL Regular Interest will be particularly sensitive to prepayments on Mortgage Loans in Loan Group 1 and the yield on the Class A-1A Certificates will be particularly sensitive to prepayments on Mortgage Loans in Loan Group 2. With respect to the Class A-PB Certificates, the extent to which the planned principal balanc es are achieved and the sensitivity of the Class A-PB Certificates to principal prepayments on the Mortgage Loans will depend in part on the period of time during which the Class A-1 Certificates, Class A-2 Certificates and Class A-1A Certificates remain outstanding. In particular, once such Classes of Certificates are no longer outstanding, any remaining portion on any Distribution Date of the Loan Group 1 Principal Distribution Amount and/or
S-198
Loan Group 2 Principal Distribution Amount, as applicable, will generally be distributed to the Class A-PB Certificates until the Certificate Balance of the Class A-PB Certificates is reduced to zero. Accordingly, the Class A-PB Certificates will become more sensitive to the rate of prepayments on the Mortgage Loans than they were when the Class A-1 Certificates, Class A-2 Certificates and Class A-1A Certificates were outstanding. In addition, although the borrowers under ARD Loans may have certain incentives to repay ARD Loans on their Anticipated Repayment Dates, there can be no assurance that the related borrowers will be able to repay the ARD Loans on their Anticipated Repayment Date. The failure of a borrower to repay the ARD Loans on their Anticipated Repayment Dates will not be an event of default under the terms of the ARD Loans, and pursuant to the terms of the Pooling and Servicing Agreement, neither the Master Servicer nor the Special Servicer will be permitted t o take any enforcement action with respect to a borrower’s failure to pay Additional Interest or principal in excess of the principal component of the constant Periodic Payment, other than requests for collection, until the scheduled maturity of the ARD Loans; provided that the Master Servicer or the Special Servicer, as the case may be, may take action to enforce the Trust Fund’s right to apply Excess Cash Flow to principal in accordance with the terms of the related Mortgage Loan documents.
In addition, if the Master Servicer or the Trustee, as applicable, reimburses itself out of general collections on the Mortgage Pool for any Advance that it or the Special Servicer has determined is not recoverable out of collections on the related Mortgage Loan, then that Advance (together with accrued interest thereon) will be deemed, to the fullest extent permitted, to be reimbursed first out of the Principal Distribution Amount otherwise distributable on the Certificates (prior to being deemed reimbursed out of payments and other collections of interest on the underlying Mortgage Loans otherwise distributable on the Certificates), thereby reducing the Principal Distribution Amount of the Offered Certificates. Any such reduction in the amount distributed as principal of the Certificates may adversely affect the weighted average lives and yields to maturity of one or more Classes of Certificates and, after a Final Recovery Determination has been made, will cre ate Realized Losses.
Prepayments and, assuming the respective stated maturity dates therefor have not occurred, liquidations and purchases of the Mortgage Loans, will result in distributions on the Offered Certificates of amounts that would otherwise be distributed over the remaining terms of the Mortgage Loans. Defaults on the Mortgage Loans, particularly at or near their stated maturity dates, may result in significant delays in payments of principal on the Mortgage Loans (and, accordingly, on the Offered Certificates that are Sequential Pay Certificates) while work-outs are negotiated or foreclosures are completed. See ‘‘SERVICING OF THE MORTGAGE LOANS—Modifications, Waivers and Amendments’’ in this prospectus supplement and ‘‘DESCRIPTION OF THE POOLING AND SERVICING AGREEMENTS —Realization Upon Defaulted Mortgage Loans’’ and ‘‘CERTAIN LEGAL ASPECTS OF MORTGAGE LOANS AND LEASES—Foreclosure’’ in the accompanying prospectus.
The extent to which the yield to maturity of any Class of Offered Certificates (other than the Class IO Certificates) may vary from the anticipated yield will depend upon the degree to which such Certificates are purchased at a discount or premium and when, and to what degree, payments of principal on the Mortgage Loans (and which of the Loan Groups such Mortgage Loan is deemed to be in) with respect to the Class A-1 Certificates, Class A-2 Certificates, Class A-PB Certificates, Class A-3 Certificates and Class A-1A Certificates and the Class A-4FL Regular Interest in turn are distributed or otherwise result in reduction of the Certificate Balance of such Certificates. An investor should consider, in the case of any Offered Certificate (other than the Class IO Certificates) purchased at a discount, the risk that a slower than anticipated rate of principal payments on the Mortgage Loans could result in an actual yield to such investor tha t is lower than the anticipated yield and, in the case of any Offered Certificate (other than the Class IO Certificates) purchased at a premium, the risk that a faster than anticipated rate of principal payments could result in an actual yield to such investor that is lower than the anticipated yield. In general, the earlier a payment of principal on the Mortgage Loans is distributed to or otherwise results in reduction of the principal balance of an Offered Certificate purchased at a discount or premium, the greater will be the effect on an investor’s yield to maturity. As a result, the effect on an investor’s yield of principal payments on the Mortgage Loans and in particular in the case of the Class A-1A Certificates, on the Mortgage Loans in Loan Group 2 occurring at a rate higher (or lower) than the rate anticipated by the investor during any particular period would not be fully offset by a
S-199
subsequent like reduction (or increase) in the rate of such principal payments. Because the rate of principal payments on the Mortgage Loans will depend on future events and a variety of factors (as described more fully below), no assurance can be given as to such rate or the rate of principal prepayments in particular. The Depositor is not aware of any relevant publicly available or authoritative statistics with respect to the historical prepayment experience of a large group of mortgage loans comparable to the Mortgage Loans.
Losses and Shortfalls. The yield to holders of the Offered Certificates will also depend on the extent to which such holders are required to bear the effects of any losses or shortfalls on the Mortgage Loans. Losses and other shortfalls on the Mortgage Loans will, with the exception of any Net Aggregate Prepayment Interest Shortfalls, generally be borne by the holders of the respective Classes of Sequential Pay Certificates (other than the Class A-1 Certificates, Class A-2 Certificates, Class A-PB Certificates, Class A-3 Certificates and Class A-1A Certificates and Class A-4FL Regular Interest, which share such losses and shortfalls, pro rata) and the Class A-MFL Regular Intere st to the extent of amounts otherwise distributable in respect of such Certificates, in reverse order of payment priority. Realized Losses and Additional Trust Fund Expenses will be allocated, as and to the extent described in this prospectus supplement, to the holders of the respective Classes of Sequential Pay Certificates (other than the Class A-1 Certificates, Class A-2 Certificates, Class A-PB Certificates, Class A-3 Certificates and Class A-1A Certificates and the Class A-4FL Regular Interest, which share such Realized Losses and Additional Trust Fund Expenses pro rata) and the Class A-MFL Regular Interest (in reduction of the Certificate Balance of each such Class), in reverse payment priorities. In the event of a reduction of the Certificate Balances of all such Classes of Certificates and the Class A-MFL Regular Interest, su ch losses and shortfalls will then be borne, pro rata, by the Class A-1 Certificates, Class A-2 Certificates, Class A-PB Certificates, Class A-3 Certificates and Class A-1A Certificates and the Class A-4FL Regular Interest (and the Class IO Certificates with respect to shortfalls of interest). As more fully described under ‘‘DESCRIPTION OF THE CERTIFICATES—Distributions—Distributable Certificate Interest’’ in this prospectus supplement, Net Aggregate Prepayment Interest Shortfalls will generally be borne by the respective Classes of Regular Certificates (other than the Class IO Certificates) and the Class A-4FL Regular Interest and Class A-MFL Regular Interest on a pro rata basis.
Pass-Through Rate. The yield on the Class A-2 Certificates, Class A-PB Certificates, Class A-3 Certificates, Class A-1A Certificates, Class A-J Certificates, Class B Certificates, Class C Certificates, Class D Certificates, Class E Certificates and Class F Certificates could be adversely affected if Mortgage Loans with higher interest rates pay faster than Mortgage Loans with lower interest rates since these Classes bear interest at a rate limited by, based upon, or equal to, the Weighted Average Net Mortgage Rate of the Mortgage Loans.
Certain Relevant Factors. The rate and timing of principal payments and defaults and the severity of losses on the Mortgage Loans may be affected by a number of factors, including, without limitation, prevailing interest rates, the terms of the Mortgage Loans (for example, due-on-sale clauses, Lockout Periods, provisions requiring the payment of Prepayment Premiums, Yield Maintenance Charges and amortization terms that require Balloon Payments), the demographics and relative economic vitality of the areas in which the Mortgaged Properties are located and the general supply and demand for rental units, hotel/motel guest rooms, health care facility beds, manufactured housing pads or comparable commercial space, as applicable, in such areas, the quality of management of the Mortgaged Properties, the servicing of the Mortgage Loans, possible changes i n tax laws and other opportunities for investment. See ‘‘RISK FACTORS—The Offered Certificates—Prepayments Will Affect Your Yield’’ and ‘‘DESCRIPTION OF THE MORTGAGE POOL’’ in this prospectus supplement and ‘‘YIELD CONSIDERATIONS—Prepayment Considerations’’ in the accompanying prospectus.
The rate of prepayment on the Mortgage Pool is likely to be affected by prevailing market interest rates for mortgage loans of a comparable type, term and risk level. When the prevailing market interest rate is below a mortgage interest rate, the related borrower may have an incentive to refinance its mortgage loan. As of the Cut-Off Date, all of the Mortgage Loans (except 19 Mortgage Loans, representing 26.2% of the Cut-Off Date Pool Balance, which may be prepaid with a Yield Maintenance Charge as of the Closing Date) may be prepaid at any time after the expiration of any applicable Lockout Period, subject, in some cases, to the payment of a Prepayment Premium or a Yield Maintenance Charge.
S-200
A requirement that a prepayment be accompanied by a Prepayment Premium or Yield Maintenance Charge may not provide a sufficient economic disincentive to deter a borrower from refinancing at a more favorable interest rate.
See ‘‘—Weighted Average Life’’ in this prospectus supplement.
Depending on prevailing market interest rates, the outlook for market interest rates and economic conditions generally, some borrowers may sell or refinance Mortgaged Properties in order to realize their equity therein, to meet cash flow needs or to make other investments. In addition, some borrowers may be motivated by federal and state tax laws (which are subject to change) to sell Mortgaged Properties prior to the exhaustion of tax depreciation benefits.
The Depositor makes no representation as to the particular factors that will affect the rate and timing of prepayments and defaults on the Mortgage Loans, as to the relative importance of such factors, as to the percentage of the principal balance of the Mortgage Loans that will be prepaid or as to whether a default will have occurred as of any date or as to the overall rate of prepayment or default on the Mortgage Loans.
Delay in Payment of Distributions. Because monthly distributions will not be made to Certificateholders until a date that is scheduled to be up to 15 days following the Due Dates for the Mortgage Loans during the related Collection Period, the effective yield to the holders of the Offered Certificates will be lower than the yield that would otherwise be produced by the applicable Pass-Through Rates and purchase prices (assuming such prices did not account for such delay).
Unpaid Distributable Certificate Interest. As described under ‘‘DESCRIPTION OF THE CERTIFICATES—Distributions—Application of the Available Distribution Amount’’ in this prospectus supplement, if the portion of the Available Distribution Amount distributable in respect of interest on any Class of Offered Certificates on any Distribution Date is less than the Distributable Certificate Interest then payable for such Class of Certificates, the shortfall will be distributable to holders of such Class of Certificates on subsequent Distribution Dates, to the extent of available funds. Any such shortfall will not bear interest, however, and will therefore negatively affect the yield to maturity of such Class of Certificates for so long as it is outstanding.
Optional Termination. Any optional termination of the Trust Fund would have an effect similar to a prepayment in full of the Mortgage Loans (without, however, the payment of any Prepayment Premiums or Yield Maintenance Charges) and, as a result, investors in any Certificates purchased at a premium might not fully recoup their initial investment. See ‘‘DESCRIPTION OF THE CERTIFICATES —Termination’’ in this prospectus supplement.
Yield Sensitivity of the Class IO Certificates. The yield to maturity on the Class IO Certificates will be extremely sensitive to the rate and timing of principal payments (including by reason of prepayments, defaults and liquidations) to the extent deemed to reduce the components comprising the Notional Amount of such Class and interest rate reductions on the Mortgage Loans. Accordingly, investors in the Class IO Certificates should fully consider the associated risks, including the risk that a rapid rate of prepayment of the Mortgage Loans could result in the failure of such investors to fully recoup their initial investments. The allocation of a portion of collected Yield Maintenance Charges and Prepayment Premiums to the Class IO Certificates is intended to reduce those risks with respect to such Class; however, such allocation may be insuffic ient to offset fully the adverse effects on the yields on such Class of Certificates that the related prepayments may otherwise have. See ‘‘DESCRIPTION OF THE MORTGAGE POOL—Certain Terms and Conditions of the Mortgage Loans—Prepayment Provisions’’ in this prospectus supplement.
Any optional termination of the Trust Fund would result in prepayment in full of the Certificates and would have an adverse effect on the yield of the Class IO Certificates to the extent the related components remained outstanding because a termination would have an effect similar to a prepayment in full of the Mortgage Loans (without, however, the payment of any Yield Maintenance Charges or Prepayment Premiums) and, as a result, investors in the Class IO Certificates might not fully recoup their initial investment. See ‘‘DESCRIPTION OF THE CERTIFICATES—Termination’’ in this prospectus supplement.
S-201
The table below indicates the sensitivity of the pre-tax corporate bond equivalent yields to maturity of the Class IO Certificates at various prices and constant prepayment rates. The allocation and calculations take account of any Prepayment Premiums or Yield Maintenance Charges. The yields set forth in the table were calculated by determining the monthly discount rates that, when applied to the assumed stream of cash flows to be paid on the Class IO Certificates, would cause the discounted present value of such assumed stream of cash flows to equal the assumed purchase prices plus accrued interest of the Class IO Certificates and converting such monthly rates to corporate bond equivalent rates. Such calculations do not take into account variations that may occur in the interest rates at which investors may be able to reinvest funds received by them as distributions on the Class IO Certificates and consequently do not purport to reflect the return on any invest ment in such Class of Certificates when such reinvestment rates are considered.
The table below has been prepared based on the assumption that distributions are made in accordance with ‘‘DESCRIPTION OF THE CERTIFICATES—Distributions’’ in this prospectus supplement and on the Table Assumptions and with the assumed respective purchase prices (as a percentage of the Notional Amount of the Class IO Certificates) of the Class IO Certificates set forth in the table relating to such Class, plus accrued interest thereon from June 1, 2007, to the Closing Date and on the additional assumption that the Pass-Through Rates for all of the Sequential Pay Certificates and the Class A-4FL Regular Interest and the Class A-MFL Regular Interest are as stated on page S-7 of this prospectus supplement and that the maturity of the Class IO Certificates will occur on the first Distribution Date on which the Trust Fund is subject to early termination.
Sensitivity to Principal Prepayments of the Pre-Tax Yields to Maturity of the Class IO Certificates
| 0% CPR During Lockout, Defeasance and Yield Maintenance Otherwise at Indicated CPR | ||||||||||||||||||||||||||||||
| Assumed Purchase Price (32nds) | 0% CPR CBE Yield | 25% CPR CBE Yield | 50% CPR CBE Yield | 75% CPR CBE Yield | 100% CPR CBE Yield | |||||||||||||||||||||||||
| 0-02 | 49.6310 | % | 48.9372 | % | 48.5401 | % | 48.2420 | % | 47.5939 | % | ||||||||||||||||||||
| 0-03 | 29.7183 | % | 29.1200 | % | 28.8128 | % | 28.6072 | % | 28.1328 | % | ||||||||||||||||||||
| 0-04 | 19.4099 | % | 18.8649 | % | 18.6014 | % | 18.4380 | % | 18.0137 | % | ||||||||||||||||||||
| 0-05 | 12.8003 | % | 12.2891 | % | 12.0510 | % | 11.9113 | % | 11.5017 | % | ||||||||||||||||||||
| 0-06 | 8.0578 | % | 7.5702 | % | 7.3487 | % | 7.2240 | % | 6.8161 | % | ||||||||||||||||||||
| 0-07 | 4.4138 | % | 3.9436 | % | 3.7338 | % | 3.6194 | % | 3.2078 | % | ||||||||||||||||||||
| 0-08 | 1.4825 | % | 1.0259 | % | 0.8249 | % | 0.7178 | % | 0.3003 | % | ||||||||||||||||||||
| Weighted Average Life (in years) | 8.44 | 8.37 | 8.32 | 8.28 | 8.04 | |||||||||||||||||||||||||
There can be no assurance that the Mortgage Loans will prepay at any of the rates shown in the table or at any other particular rate, that the cash flows on the Class IO Certificates will correspond to the cash flows assumed for purposes of the above table or that the aggregate purchase price of the Class IO Certificates will be as assumed. In addition, it is unlikely that the Mortgage Loans will prepay at any of the specified percentages of CPR until maturity or that all the Mortgage Loans will so prepay at the same rate. Timing of changes in the rate of prepayments may significantly affect the actual yield to maturity to investors, even if the average rate of principal prepayments is consistent with the expectations of investors. Investors must make their own decisions as to the appropriate prepayment assumption to be used in deciding whether to purchase the Class IO Certificates. See ‘‘RISK FACTORS—The Offered Certificates—Prepayments Will Affect Your Yield’’ in this prospectus supplement.
Weighted Average Life
The weighted average life of any Class A-1 Certificates, Class A-2 Certificates, Class A-PB Certificates, Class A-3 Certificates, Class A-1A Certificates, Class A-J Certificates, Class B Certificates, Class C Certificates, Class D Certificates, Class E Certificates and Class F Certificates refers to the average amount of time that will elapse from the assumed Closing Date until each dollar allocable to principal of such Offered Certificate is distributed to the investor. The weighted average life of any such Offered Certificate will be influenced by, among other things, the rate at which principal on the Mortgage Loans
S-202
is paid or otherwise collected or advanced and applied to pay principal of such Offered Certificate, which may be in the form of scheduled amortization, voluntary prepayments, insurance and condemnation proceeds and liquidation proceeds. As described in this prospectus supplement, the Loan Group 1 Principal Distribution Amount (and, after the Class A-1A Certificates have been retired, any remaining Loan Group 2 Principal Distribution Amount) for each Distribution Date will generally be distributable first to reduce the Certificate Balance of the Class A-PB Certificates to the Class A-PB Planned Principal Balance, then, to the Class A-1 Certificates until the Certificate Balance thereof is reduced to zero, then, to the Class A-2 Certificates until the Certificate Balance thereof is reduced to zero, then, to the Class A-PB Certificates until the Certificate Balance thereof is reduced to zero, then, to the Class A-3 Certificates until the Certificate Balance thereof is reduced to zero and, then, to the Class A-4FL Regular Interest until the Certificate Balance thereof is reduced to zero. The Loan Group 2 Principal Distribution Amount for each Distribution Date will generally be distributable first to the Class A-1A Certificates. After those distributions, the remaining Principal Distribution Amount with respect to the Mortgage Pool will generally be distributable entirely in respect of the Class A-MFL Regular Interest, the Class A-J Certificates, the Class B Certificates, the Class C Certificates, the Class D Certificates, the Class E Certificates and the Class F Certificates in that order, in each case until the Certificate Balance of each such Class of Certificates and the Class A-MFL Regular Interest, is reduced to zero.
The tables below indicate the percentage of the initial Certificate Balance of each Class of Offered Certificates that would be outstanding after each of the dates shown and the corresponding weighted average life of each such Class of Offered Certificates. To the extent that the Mortgage Loans or the Certificates have characteristics that differ from those assumed in preparing the tables, the Class A-1 Certificates, the Class A-2 Certificates, the Class A-PB Certificates, the Class A-3 Certificates, the Class A-1A Certificates, the Class A-J Certificates, the Class B Certificates, the Class C Certificates, the Class D Certificates, the Class E Certificates and the Class F Certificates may mature earlier or later than indicated by the tables. With respect to the Class A-PB Certificates, although based on the Table Assumptions (as defined below), the Certificate Balance of the Class A-PB Certificate s on each Distribution Date would be reduced to the Class A-PB Planned Principal Balance for such Distribution Date, there is no assurance that the Mortgage Loans will perform in conformity with the Table Assumptions. Therefore, there can be no assurance that the Certificate Balance of the Class A-PB Certificates on any Distribution Date will be equal to the balance that is specified for such Distribution Date in the table. In particular, once the Certificate Balances of the Class A-1A Certificates, the Class A-1 Certificates and the Class A-2 Certificates, have been reduced to zero, any remaining portion on any Distribution Date of the Loan Group 1 Principal Distribution Amount and/or Loan Group 2 Principal Distribution Amount, as applicable, will be distributed to the Class A-PB Certificates until the Certificate Balance of the Class A-PB Certificates are reduced to zero. Accordingly, the Mortgage Loans will not prepay at any constant rate nor will the Mortgage Loans prepay at the same rate, and it is highly unlikely that the Mortgage Loans will prepay in a manner consistent with the assumptions described above. In addition, variations in the actual prepayment experience and in the balance of the Mortgage Loans that actually prepay may increase or decrease the percentages of initial Certificate Balances (and shorten or extend the weighted average lives) shown in the following tables. Investors are urged to conduct their own analyses of the rates at which the Mortgage Loans may be expected to prepay.
Prepayments on mortgage loans may be measured by a prepayment standard or model. The model used in this prospectus supplement is the ‘‘Constant Prepayment Rate’’ or ‘‘CPR’’ model. The CPR model represents an assumed constant annual rate of prepayment each month, expressed as a per annum percentage of the then scheduled principal balance of the pool of mortgage loans. As used in the tables set forth below, the column headed ‘‘0% CPR’’ assumes that none of the Mortgage Loans is prepaid in whole or in part before maturity o r the Anticipated Repayment Date, as the case may be. The columns headed ‘‘25% CPR’’, ‘‘50% CPR’’, ‘‘75% CPR’’ and ‘‘100% CPR’’, respectively, assume that prepayments are made each month at those levels of CPR on the Mortgage Loans that are eligible for prepayment under the Table Assumptions set forth in the next paragraph (each such scenario, a ‘‘Scenario’’). There is no assurance, however, that prepayments on the Mortgage Loans will conform to any level of CPR, and no representation is made that the Mortgage Loans will prepay at the levels of CPR shown or at any other prepayment rate.
S-203
The tables below were derived from calculations based on the following assumptions (the ‘‘Table Assumptions’’): (i) no Mortgage Loan prepays during any applicable Lockout Period or any period during which Defeasance Collateral is permitted or required to be pledged or any period during which a yield maintenance charge is required (otherwise, in the case of each table, each Mortgage Loan is assumed to prepay at the indicated level of CPR, with each prepayment being applied on the first day of the applicable month in which it is assumed to be received), (ii) the Pass-Through Rates and initial Certificate Balances of the respective Classes of Sequential Pay Certificates are as described in this prospectus supplement, (iii) there are no delinquencies or defaults with respect to, and no modifications, waivers or ame ndments of the terms of, the Mortgage Loans, (iv) there are no Realized Losses, Additional Trust Fund Expenses or Appraisal Reduction Amounts with respect to the Mortgage Loans or the Trust Fund, (v) scheduled interest and principal payments on the Mortgage Loans are timely received, (vi) ARD Loans pay in full on their Anticipated Repayment Dates, (vii) all Mortgage Loans have Due Dates on the first day of each month and accrue interest on the respective basis described in this prospectus supplement (i.e., a 30/360 basis or an Actual/360 basis), (viii) all prepayments are accompanied by a full month’s interest and there are no Prepayment Interest Shortfalls, (ix) there are no breaches of the Mortgage Loan Sellers’ representations and warranties regarding its Mortgage Loans, (x) all applicable Prepayment Premiums and Yield Maintenance Charges are collected, (xi) no party entitled thereto exercises its right of optional termination of the Trust Fund and no party entitled thereto will exercise its option to purchase any Mortgage Loan from the Trust Fund described in this prospectus supplement, (xii) the borrowers under any Mortgage Loans which permit the borrower to choose between defeasance or a yield maintenance charge choose to be subject to a yield maintenance charge (assuming that the borrower under loan number 3 exercises its prepayment rights to prepay up to the maximum of 10.0% of the original loan amount without a prepayment premium as stated in the related Mortgage Loan documents), (xiii) holdbacks and/or reserves held by the mortgagee are not applied to the prepayment of the related Mortgage Loan, (xiv) distributions on the Certificates are made on the 15th day (each assumed to be a business day) of each month, commencing in July, 2007 and (xv) the Closing Date for the sale of the Offered Cer tificates is June 28, 2007.
The tables set forth below indicate the resulting weighted average lives of each Class of Offered Certificates and set forth the percentages of the initial Certificate Balance of such Class of Offered Certificates that would be outstanding after each of the dates shown in each case assuming the indicated level of CPR. For purposes of the following tables, the weighted average life of an Offered Certificate is determined by (i) multiplying the amount of each principal distribution thereon by the number of years from the assumed Closing Date of such Certificate to the related Distribution Date, (ii) summing the results and (iii) dividing the sum by the aggregate amount of the reductions in the principal balance of such Certificate.
Percentages of the Closing Date Certificate Balance of the Class A-1 Certificates
| 0% CPR During Lockout, Defeasance and Yield Maintenance Otherwise at Indicated CPR | ||||||||||||||||||||||||||||||
| Distribution Date | 0% CPR | 25% CPR | 50% CPR | 75% CPR | 100% CPR | |||||||||||||||||||||||||
| Initial Date | 100 | 100 | 100 | 100 | 100 | |||||||||||||||||||||||||
| 06/15/08 | 92 | 72 | 51 | 30 | 6 | |||||||||||||||||||||||||
| 06/15/09 | 77 | 36 | 5 | 0 | 0 | |||||||||||||||||||||||||
| 06/15/10 | 56 | 0 | 0 | 0 | 0 | |||||||||||||||||||||||||
| 06/15/11 | 33 | 0 | 0 | 0 | 0 | |||||||||||||||||||||||||
| 06/15/12 | 0 | 0 | 0 | 0 | 0 | |||||||||||||||||||||||||
| Weighted Average Life (in years) | 3.04 | 1.56 | 1.07 | 0.75 | 0.23 | |||||||||||||||||||||||||
S-204
Percentages of the Closing Date Certificate Balance of the Class A-2 Certificates
| 0% CPR During Lockout, Defeasance and Yield Maintenance Otherwise at Indicated CPR | ||||||||||||||||||||||||||||||
| Distribution Date | 0% CPR | 25% CPR | 50% CPR | 75% CPR | 100% CPR | |||||||||||||||||||||||||
| Initial Date | 100 | 100 | 100 | 100 | 100 | |||||||||||||||||||||||||
| 06/15/08 | 100 | 100 | 100 | 100 | 100 | |||||||||||||||||||||||||
| 06/15/09 | 100 | 100 | 100 | 99 | 98 | |||||||||||||||||||||||||
| 06/15/10 | 100 | 100 | 98 | 98 | 97 | |||||||||||||||||||||||||
| 06/15/11 | 100 | 98 | 97 | 97 | 96 | |||||||||||||||||||||||||
| 06/15/12 | 0 | 0 | 0 | 0 | 0 | |||||||||||||||||||||||||
| Weighted Average Life (in years) | 4.90 | 4.84 | 4.78 | 4.71 | 4.42 | |||||||||||||||||||||||||
Percentages of the Closing Date Certificate Balance of the Class A-PB Certificates
| 0% CPR During Lockout, Defeasance and Yield Maintenance Otherwise at Indicated CPR | ||||||||||||||||||||||||||||||
| Distribution Date | 0% CPR | 25% CPR | 50% CPR | 75% CPR | 100% CPR | |||||||||||||||||||||||||
| Initial Date | 100 | 100 | 100 | 100 | 100 | |||||||||||||||||||||||||
| 06/15/08 | 100 | 100 | 100 | 100 | 100 | |||||||||||||||||||||||||
| 06/15/09 | 100 | 100 | 100 | 100 | 100 | |||||||||||||||||||||||||
| 06/15/10 | 100 | 100 | 100 | 100 | 100 | |||||||||||||||||||||||||
| 06/15/11 | 100 | 100 | 100 | 100 | 100 | |||||||||||||||||||||||||
| 06/15/12 | 100 | 62 | 49 | 46 | 46 | |||||||||||||||||||||||||
| 06/15/13 | 85 | 44 | 33 | 32 | 32 | |||||||||||||||||||||||||
| 06/15/14 | 46 | 2 | 0 | 0 | 0 | |||||||||||||||||||||||||
| 06/15/15 | 29 | 0 | 0 | 0 | 0 | |||||||||||||||||||||||||
| 06/15/16 | 11 | 0 | 0 | 0 | 0 | |||||||||||||||||||||||||
| 06/15/17 | 0 | 0 | 0 | 0 | 0 | |||||||||||||||||||||||||
| Weighted Average Life (in years) | 7.29 | 5.83 | 5.62 | 5.58 | 5.41 | |||||||||||||||||||||||||
Percentages of the Closing Date Certificate Balance of the Class A-3 Certificates
| 0% CPR During Lockout, Defeasance and Yield Maintenance Otherwise at Indicated CPR | ||||||||||||||||||||||||||||||
| Distribution Date | 0% CPR | 25% CPR | 50% CPR | 75% CPR | 100% CPR | |||||||||||||||||||||||||
| Initial Date | 100 | 100 | 100 | 100 | 100 | |||||||||||||||||||||||||
| 06/15/08 | 100 | 100 | 100 | 100 | 100 | |||||||||||||||||||||||||
| 06/15/09 | 100 | 100 | 100 | 100 | 100 | |||||||||||||||||||||||||
| 06/15/10 | 100 | 100 | 100 | 100 | 100 | |||||||||||||||||||||||||
| 06/15/11 | 100 | 100 | 100 | 100 | 100 | |||||||||||||||||||||||||
| 06/15/12 | 100 | 100 | 100 | 100 | 100 | |||||||||||||||||||||||||
| 06/15/13 | 100 | 100 | 100 | 100 | 100 | |||||||||||||||||||||||||
| 06/15/14 | 100 | 100 | 100 | 100 | 100 | |||||||||||||||||||||||||
| 06/15/15 | 100 | 99 | 98 | 98 | 98 | |||||||||||||||||||||||||
| 06/15/16 | 100 | 98 | 97 | 97 | 97 | |||||||||||||||||||||||||
| 06/15/17 | 0 | 0 | 0 | 0 | 0 | |||||||||||||||||||||||||
| Weighted Average Life (in years) | 9.83 | 9.75 | 9.70 | 9.65 | 9.46 | |||||||||||||||||||||||||
S-205
Percentages of the Closing Date Certificate Balance of the Class A-1A Certificates
| 0% CPR During Lockout, Defeasance and Yield Maintenance Otherwise at Indicated CPR | ||||||||||||||||||||||||||||||
| Distribution Date | 0% CPR | 25% CPR | 50% CPR | 75% CPR | 100% CPR | |||||||||||||||||||||||||
| Initial Date | 100 | 100 | 100 | 100 | 100 | |||||||||||||||||||||||||
| 06/15/08 | 100 | 100 | 100 | 100 | 100 | |||||||||||||||||||||||||
| 06/15/09 | 100 | 100 | 100 | 100 | 100 | |||||||||||||||||||||||||
| 06/15/10 | 100 | 100 | 100 | 100 | 100 | |||||||||||||||||||||||||
| 06/15/11 | 100 | 100 | 99 | 99 | 94 | |||||||||||||||||||||||||
| 06/15/12 | 75 | 75 | 75 | 75 | 75 | |||||||||||||||||||||||||
| 06/15/13 | 75 | 75 | 75 | 75 | 75 | |||||||||||||||||||||||||
| 06/15/14 | 74 | 74 | 74 | 74 | 74 | |||||||||||||||||||||||||
| 06/15/15 | 74 | 74 | 74 | 74 | 74 | |||||||||||||||||||||||||
| 06/15/16 | 74 | 74 | 74 | 74 | 74 | |||||||||||||||||||||||||
| 06/15/17 | 0 | 0 | 0 | 0 | 0 | |||||||||||||||||||||||||
| Weighted Average Life (in years) | 8.59 | 8.57 | 8.55 | 8.53 | 8.31 | |||||||||||||||||||||||||
Percentages of the Closing Date Certificate Balance of the Class A-J Certificates
| 0% CPR During Lockout, Defeasance and Yield Maintenance Otherwise at Indicated CPR | ||||||||||||||||||||||||||||||
| Distribution Date | 0% CPR | 25% CPR | 50% CPR | 75% CPR | 100% CPR | |||||||||||||||||||||||||
| Initial Date | 100 | 100 | 100 | 100 | 100 | |||||||||||||||||||||||||
| 06/15/08 | 100 | 100 | 100 | 100 | 100 | |||||||||||||||||||||||||
| 06/15/09 | 100 | 100 | 100 | 100 | 100 | |||||||||||||||||||||||||
| 06/15/10 | 100 | 100 | 100 | 100 | 100 | |||||||||||||||||||||||||
| 06/15/11 | 100 | 100 | 100 | 100 | 100 | |||||||||||||||||||||||||
| 06/15/12 | 100 | 100 | 100 | 100 | 100 | |||||||||||||||||||||||||
| 06/15/13 | 100 | 100 | 100 | 100 | 100 | |||||||||||||||||||||||||
| 06/15/14 | 100 | 100 | 100 | 100 | 100 | |||||||||||||||||||||||||
| 06/15/15 | 100 | 100 | 100 | 100 | 100 | |||||||||||||||||||||||||
| 06/15/16 | 100 | 100 | 100 | 100 | 100 | |||||||||||||||||||||||||
| 06/15/17 | 0 | 0 | 0 | 0 | 0 | |||||||||||||||||||||||||
| Weighted Average Life (in years) | 9.96 | 9.96 | 9.96 | 9.93 | 9.71 | |||||||||||||||||||||||||
Percentages of the Closing Date Certificate Balance of the Class B Certificates
| 0% CPR During Lockout, Defeasance and Yield Maintenance Otherwise at Indicated CPR | ||||||||||||||||||||||||||||||
| Distribution Date | 0% CPR | 25% CPR | 50% CPR | 75% CPR | 100% CPR | |||||||||||||||||||||||||
| Initial Date | 100 | 100 | 100 | 100 | 100 | |||||||||||||||||||||||||
| 06/15/08 | 100 | 100 | 100 | 100 | 100 | |||||||||||||||||||||||||
| 06/15/09 | 100 | 100 | 100 | 100 | 100 | |||||||||||||||||||||||||
| 06/15/10 | 100 | 100 | 100 | 100 | 100 | |||||||||||||||||||||||||
| 06/15/11 | 100 | 100 | 100 | 100 | 100 | |||||||||||||||||||||||||
| 06/15/12 | 100 | 100 | 100 | 100 | 100 | |||||||||||||||||||||||||
| 06/15/13 | 100 | 100 | 100 | 100 | 100 | |||||||||||||||||||||||||
| 06/15/14 | 100 | 100 | 100 | 100 | 100 | |||||||||||||||||||||||||
| 06/15/15 | 100 | 100 | 100 | 100 | 100 | |||||||||||||||||||||||||
| 06/15/16 | 100 | 100 | 100 | 100 | 100 | |||||||||||||||||||||||||
| 06/15/17 | 0 | 0 | 0 | 0 | 0 | |||||||||||||||||||||||||
| Weighted Average Life (in years) | 9.96 | 9.96 | 9.96 | 9.96 | 9.71 | |||||||||||||||||||||||||
S-206
Percentages of the Closing Date Certificate Balance of the Class C Certificates
| 0% CPR During Lockout, Defeasance and Yield Maintenance Otherwise at Indicated CPR | ||||||||||||||||||||||||||||||
| Distribution Date | 0% CPR | 25% CPR | 50% CPR | 75% CPR | 100% CPR | |||||||||||||||||||||||||
| Initial Date | 100 | 100 | 100 | 100 | 100 | |||||||||||||||||||||||||
| 06/15/08 | 100 | 100 | 100 | 100 | 100 | |||||||||||||||||||||||||
| 06/15/09 | 100 | 100 | 100 | 100 | 100 | |||||||||||||||||||||||||
| 06/15/10 | 100 | 100 | 100 | 100 | 100 | |||||||||||||||||||||||||
| 06/15/11 | 100 | 100 | 100 | 100 | 100 | |||||||||||||||||||||||||
| 06/15/12 | 100 | 100 | 100 | 100 | 100 | |||||||||||||||||||||||||
| 06/15/13 | 100 | 100 | 100 | 100 | 100 | |||||||||||||||||||||||||
| 06/15/14 | 100 | 100 | 100 | 100 | 100 | |||||||||||||||||||||||||
| 06/15/15 | 100 | 100 | 100 | 100 | 100 | |||||||||||||||||||||||||
| 06/15/16 | 100 | 100 | 100 | 100 | 100 | |||||||||||||||||||||||||
| 06/15/17 | 0 | 0 | 0 | 0 | 0 | |||||||||||||||||||||||||
| Weighted Average Life (in years) | 9.96 | 9.96 | 9.96 | 9.96 | 9.71 | |||||||||||||||||||||||||
Percentages of the Closing Date Certificate Balance of the Class D Certificates
| 0% CPR During Lockout, Defeasance and Yield Maintenance Otherwise at Indicated CPR | ||||||||||||||||||||||||||||||
| Distribution Date | 0% CPR | 25% CPR | 50% CPR | 75% CPR | 100% CPR | |||||||||||||||||||||||||
| Initial Date | 100 | 100 | 100 | 100 | 100 | |||||||||||||||||||||||||
| 06/15/08 | 100 | 100 | 100 | 100 | 100 | |||||||||||||||||||||||||
| 06/15/09 | 100 | 100 | 100 | 100 | 100 | |||||||||||||||||||||||||
| 06/15/10 | 100 | 100 | 100 | 100 | 100 | |||||||||||||||||||||||||
| 06/15/11 | 100 | 100 | 100 | 100 | 100 | |||||||||||||||||||||||||
| 06/15/12 | 100 | 100 | 100 | 100 | 100 | |||||||||||||||||||||||||
| 06/15/13 | 100 | 100 | 100 | 100 | 100 | |||||||||||||||||||||||||
| 06/15/14 | 100 | 100 | 100 | 100 | 100 | |||||||||||||||||||||||||
| 06/15/15 | 100 | 100 | 100 | 100 | 100 | |||||||||||||||||||||||||
| 06/15/16 | 100 | 100 | 100 | 100 | 100 | |||||||||||||||||||||||||
| 06/15/17 | 97 | 0 | 0 | 0 | 0 | |||||||||||||||||||||||||
| 06/15/18 | 0 | 0 | 0 | 0 | 0 | |||||||||||||||||||||||||
| Weighted Average Life (in years) | 10.04 | 9.96 | 9.96 | 9.96 | 9.71 | |||||||||||||||||||||||||
S-207
Percentages of the Closing Date Certificate Balance of the Class E Certificates
| 0% CPR During Lockout, Defeasance and Yield Maintenance Otherwise at Indicated CPR | ||||||||||||||||||||||||||||||
| Distribution Date | 0% CPR | 25% CPR | 50% CPR | 75% CPR | 100% CPR | |||||||||||||||||||||||||
| Initial Date | 100 | 100 | 100 | 100 | 100 | |||||||||||||||||||||||||
| 06/15/08 | 100 | 100 | 100 | 100 | 100 | |||||||||||||||||||||||||
| 06/15/09 | 100 | 100 | 100 | 100 | 100 | |||||||||||||||||||||||||
| 06/15/10 | 100 | 100 | 100 | 100 | 100 | |||||||||||||||||||||||||
| 06/15/11 | 100 | 100 | 100 | 100 | 100 | |||||||||||||||||||||||||
| 06/15/12 | 100 | 100 | 100 | 100 | 100 | |||||||||||||||||||||||||
| 06/15/13 | 100 | 100 | 100 | 100 | 100 | |||||||||||||||||||||||||
| 06/15/14 | 100 | 100 | 100 | 100 | 100 | |||||||||||||||||||||||||
| 06/15/15 | 100 | 100 | 100 | 100 | 100 | |||||||||||||||||||||||||
| 06/15/16 | 100 | 100 | 100 | 100 | 100 | |||||||||||||||||||||||||
| 06/15/17 | 100 | 0 | 0 | 0 | 0 | |||||||||||||||||||||||||
| 06/15/18 | 0 | 0 | 0 | 0 | 0 | |||||||||||||||||||||||||
| Weighted Average Life (in years) | 10.05 | 9.96 | 9.96 | 9.96 | 9.71 | |||||||||||||||||||||||||
Percentages of the Closing Date Certificate Balance of the Class F Certificates
| 0% CPR During Lockout, Defeasance and Yield Maintenance Otherwise at Indicated CPR | ||||||||||||||||||||||||||||||
| Distribution Date | 0% CPR | 25% CPR | 50% CPR | 75% CPR | 100% CPR | |||||||||||||||||||||||||
| Initial Date | 100 | 100 | 100 | 100 | 100 | |||||||||||||||||||||||||
| 06/15/08 | 100 | 100 | 100 | 100 | 100 | |||||||||||||||||||||||||
| 06/15/09 | 100 | 100 | 100 | 100 | 100 | |||||||||||||||||||||||||
| 06/15/10 | 100 | 100 | 100 | 100 | 100 | |||||||||||||||||||||||||
| 06/15/11 | 100 | 100 | 100 | 100 | 100 | |||||||||||||||||||||||||
| 06/15/12 | 100 | 100 | 100 | 100 | 100 | |||||||||||||||||||||||||
| 06/15/13 | 100 | 100 | 100 | 100 | 100 | |||||||||||||||||||||||||
| 06/15/14 | 100 | 100 | 100 | 100 | 100 | |||||||||||||||||||||||||
| 06/15/15 | 100 | 100 | 100 | 100 | 100 | |||||||||||||||||||||||||
| 06/15/16 | 100 | 100 | 100 | 100 | 100 | |||||||||||||||||||||||||
| 06/15/17 | 100 | 88 | 0 | 0 | 0 | |||||||||||||||||||||||||
| 06/15/18 | 0 | 0 | 0 | 0 | 0 | |||||||||||||||||||||||||
| Weighted Average Life (in years) | 10.05 | 10.04 | 9.96 | 9.96 | 9.71 | |||||||||||||||||||||||||
Effect of Loan Groups
Generally, the Class A-1, Class A-2, Class A-PB and Class A-3 Certificates and Class A-4FL Regular Interest will only be entitled to receive distributions of principal collected or advanced with respect to the Mortgage Loans in Loan Group 1 until the Certificate Principal Balance of the Class A-1A Certificates has been reduced to zero, and the Class A-1A Certificates will only be entitled to receive distributions of principal collected or advanced in respect of the Mortgage Loans in Loan Group 2 until the Certificate Principal Balance of the Class A-4FL Regular Interest has been reduced to zero. Accordingly, holders of the Class A-1A Certificates will be greatly affected by the rate and timing of payments and other collections of principal on the Mortgage Loans in Loan Group 2 and, in the absence of losses, should be largely unaffected by the rate and timing of payments and other collections of principal on the M ortgage Loans in Loan Group 1. Investors should take this into account when reviewing this ‘‘YIELD AND MATURITY CONSIDERATIONS’’ section.
S-208
Material Federal Income Tax Consequences
General
The following summary of the anticipated material federal income tax consequences of the purchase, ownership and disposition of Offered Certificates is based on the advice of Cadwalader, Wickersham & Taft LLP, counsel to the Depositor. This summary is based on laws, regulations, including the REMIC regulations promulgated by the Treasury Department (the ‘‘REMIC Regulations’’), rulings and decisions now in effect or (with respect to the regulations) proposed, all of which are subject to change either prospectively or retroactively. This summary does not address the federal income tax consequences of an investment in Offered Certificates applicable to all categories of investors, some of which (for example, banks and insurance companies) may be subject to special rules. Prospective investors should consult their tax advisor s regarding the federal, state, local and other tax consequences to them of the purchase, ownership and disposition of Offered Certificates.
For federal income tax purposes, two separate REMIC elections (‘‘REMIC I’’ and ‘‘REMIC II’’) will be made with respect to segregated asset pools that make up the Trust Fund, other than any Additional Interest on the ARD Loans. Upon the issuance of the Offered Certificates, Cadwalader, Wickersham & Taft LLP will deliver its opinion generally to the effect that, assuming (1) the making of appropriate elections, (2) compliance with all provisions of the Pooling and Servicing Agreement, (3) compliance with the Morgan Stanley 2007-IQ14 Pooling and Servicing Agreement and the CGCMT 2007-C6 Pooling and Servicing Agreement and other related documents and any amendments thereto a nd the continued qualification of the REMICs formed thereunder, and (4) compliance with applicable changes in the Code, for federal income tax purposes, each such REMIC will qualify as a REMIC under the Code. For federal income tax purposes, the Regular Certificates and the Class A-4FL and Class A-MFL Regular Interests will represent ‘‘regular interests’’ in REMIC II and generally will be treated as newly originated debt instruments of such REMIC. See ‘‘MATERIAL FEDERAL INCOME TAX CONSEQUENCES—Federal Income Tax Consequences for REMIC Certificates—REMICs’’ in the accompanying prospectus. The portion of the Trust Fund consisting of Additional Interest and the Additional Interest Account will be treated as a grantor trust for federal income tax purposes, and the Class Z Certificates will represent undivided beneficial interests in such portion of the grantor trust. Furthermore, the respective portions of the Trust Fund consisting of the Class A-4FL and Class A-MFL Regular Interest, the related swap contract and the related floating rate account will each be treated as a grantor trust for federal income tax purposes. See ‘‘MATERIAL FEDERAL INCOME TAX CONSEQUENCES—Federal Income Tax Consequences for REMIC Certificates—REMICs’’ and ‘‘—Federal Income Tax Consequences for Certificates as to Which No REMIC Election Is Made’’ in the accompanying prospectus.
Taxation of the Offered Certificates
Based on expected issue prices, it is anticipated that the Class A-1 and Class A-2 Certificates will be treated as having been issued at a premium, that the Class A-PB, Class A-3, Class A-1A and Class A-J Certificates will be issued with de minimis original issue discount and that the Class IO, Class B, Class C, Class D, Class E, and Class F Certificates will be issued with original issue discount for federal income tax purposes.
Whether any holder of a Class of Offered Certificates will be treated as holding a Certificate with amortizable bond premium will depend on such Certificateholder’s purchase price and the distributions remaining to be made on such Certificate at the time of its acquisition by such Certificateholder. Holders of each such Class of Certificates should consult their own tax advisors regarding the possibility of making an election to amortize such premium. See ‘‘MATERIAL FEDERAL INCOME TAX CONSEQUENCES —Federal Income Tax Consequences for REMIC Certificates—Taxation of Owners of Regular Certificates—Premium’’ in the accompanying prospectus.
The prepayment assumption that will be used in determining the rate of accrual of original issue discount, if any, or amortization of amortizable bond premium for federal income tax purposes will be based on the assumption that subsequent to the date of any determination the Mortgage Loans will pay at a rate equal to a CPR of 0%, except that it is assumed that the ARD Loans will pay their respective
S-209
outstanding principal balances on their related Anticipated Repayment Dates. No representation is made that the Mortgage Loans will pay at that rate or at any other rate. Sec ‘‘MATERIAL FEDERAL INCOME TAX CONSEQUENCES—Federal Income Tax Consequences for REMIC Certificates—REMICs’’ and ‘‘—Taxation of Owners of Regular Certificates— Original Issue Discount’’ in the accompanying prospectus.
The Internal Revenue Service (the ‘‘IRS’’) has issued regulations (the ‘‘OID Regulations’’) under Sections 1271 to 1275 of the Code generally addressing the treatment of debt instruments issued with original issue discount. Purchasers of the Offered Certificates should be aware that the OID Regulations and Section 1272(a)(6) of the Code do not adequately address certain issues relevant to, or are not applicable to, securities such as the Offered Certificates. Prospective purchasers of Offered Certificates are advised to consult their tax advisors concerning the tax treatment of such Certificates.
Each holder of a Class IO Certificate will be required to accrue original issue discount in each taxable year on a current basis and on the assumption that no defaults, delinquencies or Realized Losses on Mortgage Loans will occur in any future period. As a result, the taxable original issue discount income reported by the holder of a Class IO Certificate could exceed the economic income actually received by the holder in a given taxable year, particularly in the early taxable years of the term of the Class IO Certificates. Although the holder of a Class IO Certificate would eventually recognize a loss or a reduction in income attributable to previously included interest and/or original issue discount income that, as the result of the subsequent occurrence of any defaults, delinquencies and Realized Losses, is ultimately not received, the law is unclear as to the timing and the character of any such eventual loss, deduction or reduction in income. Moreover, the present value of the taxes payable on such income may exceed the present value of the tax benefits associated with any such eventual loss, deduction or reduction in income, assuming no changes in tax rates, even if the income and loss are both ordinary in character.
The Offered Certificates will be treated as ‘‘real estate assets’’ within the meaning of Section 856(c)(5)(B) of the Code for a ‘‘real estate investment trust’’ (‘‘REIT’’). In addition, interest (including original issue discount) on the Offered Certificates will be interest described in Section 856(c)(3)(B) of the Code for a REIT. However, the Offered Certificates will generally only be considered assets described in Section 7701(a)(19)(C) of the Code for a domestic building and loan association to the extent that the Mortgage Loans are secured by multifamily properties (approximately 11.6% of the Cut-Off Date Pool Balance) and, accordingly, investment in the Offered Certificates may not be suitable for certain thrift institutions. Holders of the Offered Certific ates should consult their own tax advisors as to whether the foregoing percentage or some other percentage applies to their Certificates. The Offered Certificates will not qualify under the foregoing sections to the extent of any Mortgage Loan that has been defeased with U.S, government obligations.
A portion of the Prepayment Premiums and Yield Maintenance Charges actually collected will be distributed to the holders of the Offered Certificates as described in this prospectus supplement. It is not entirely clear under the Code when the amount of a Yield Maintenance Charge or Prepayment Premium should be taxed to the holder of an Offered Certificate, but it is not expected, for federal income tax reporting purposes, that Yield Maintenance Charges or Prepayment Premiums will be treated as giving rise to any income to the holders of the Offered Certificates prior to the Master Servicer’s actual receipt of a Yield Maintenance Charge or Prepayment Premium, as the case may be. It is not entirely clear whether Yield Maintenance Charges or Prepayment Premiums give rise to ordinary income or capital gains and Certificateholders should consult their own tax advisors concerning this character issue and the treatment of Yield Maintenance Charges and Prepayment P remiums in general.
Reporting and Other Administrative Matters
For further information regarding the federal income tax reporting requirements and other administrative matters, see ‘‘MATERIAL FEDERAL INCOME TAX CONSEQUENCES—Federal Income Tax Consequences for REMIC Certificates—Reporting and Other Administrative Matters’’ and ‘‘—Backup Withholding with Respect to REMIC Certificates’’ in the accompanying prospectus.
For further information regarding the federal income tax consequences of investing in the Offered Certificates, see ‘‘MATERIAL FEDERAL INCOME TAX CONSEQUENCES—Federal Income Tax Consequences for REMIC Certificates—REMICs’’ in the accompanying prospectus.
S-210
Erisa Considerations
The following description is general in nature, is not intended to be all-inclusive, is based on the law and practice in force at the date of this document and is subject to any subsequent changes therein. In view of the individual nature of the Employee Retirement Income Security Act of 1974, as amended (‘‘ERISA’’), and Code consequences, each potential investor that is a Plan (as described below) is advised to consult its own legal advisor with respect to the specific ERISA and Code consequences of investing in the Offered Certificates and to make its own independent decision. The following is merely a summary and should not be construed as legal advice.
A fiduciary of any employee benefit plan or other retirement plan or arrangement, including individual retirement accounts and annuities, Keogh plans and collective investment funds, separate accounts and general accounts in which such plans, accounts or arrangements are invested, that is subject to ERISA or Section 4975 of the Code (a ‘‘Plan’’) should carefully review with its legal advisors whether the purchase or holding of Offered Certificates could give rise to a transaction that is prohibited or is not otherwise permitted either under ERISA or Section 4975 of the Code or whether there exists any statutory or administrative exemption applicable thereto. Other employee benefit plans, including governmental plans (as defined in Section 3(32) of ERISA) and church plans (as defined in Section 3(33) of ERI SA and provided no election has been made under Section 410(d) of the Code), while not subject to the foregoing provisions of ERISA or the Code, may be subject to materially similar provisions of applicable federal, state or local law (‘‘Similar Law’’).
The US Department of Labor has issued individual exemptions to each of the Underwriters (Prohibited Transaction Exemption (‘‘PTE’’) 96-22 (April 3, 1996) to Wachovia Corporation, and its subsidiaries and its affiliates, which include Wachovia Capital Markets, LLC (‘‘Wachovia Securities’’), 2004-03E (February 4, 2004) to Barclays Capital Inc. (‘‘Barclays Capital’’) and PTE 89-88 (October 17, 1989) to Goldman, Sachs & Co. (‘‘Goldman Sachs’’) (each, an ‘‘Exemption’’ and collectively, the ‘‘Exemptions’’)), each of which, generally exempts from the application of the prohibited transaction provisions of Sections 406(a) and (b) and 407(a) of ERISA, and the excise taxes imposed on such prohibited transactions pursuant to Sections 4975(a) and (b) of the Code, the purchase, sale and holding of mortgage pass-through certificates underwritten by an Underwriter, as hereinafter defined; provided that certain conditions set forth in the Exemptions are satisfied. For purposes of this discussion, the term ‘‘Underwriter’’ shall include (a) Wachovia Securities, (b) Barclays Capital, (c) Goldman Sachs, (d) any person directly or indirectly, through one or more intermediaries, controlling, controlled by or under common control with Wachovia Securities, Barclays Capital or Goldman Sachs and (e) any member of the underwriting syndicate or selling group of which Wachovia Securities, Barclays Capital and Goldman Sachs or a person described in (d) is a manager or co-manager with respect to the Offered Certificates.
The obligations covered by the Exemptions include mortgage loans such as the Mortgage Loans. The Exemptions would apply to the acquisition, holding and resale of the Offered Certificates by a Plan only if specific conditions (certain of which are described below) are met. The Exemptions would not apply directly to governmental plans, certain church plans and other employee benefit plans that are not subject to the prohibited transaction provisions of ERISA or the Code but that may be subject to Similar Law.
The Exemptions set forth five general conditions that, among others, must be satisfied for a transaction involving the purchase, sale and holding of the Offered Certificates by a Plan to be eligible for exemptive relief thereunder. First, the acquisition of the Offered Certificates by a Plan must be on terms, including the price paid for the Certificates, that are at least as favorable to the Plan as they would be in an arm’s-length transaction with an unrelated party. Second, the Offered Certificates at the time of acquisition by the Plan must be rated in one of the four highest generic rating categories by Standard & Poor’s Ratings Services, a division o f The McGraw-Hill Companies, Inc. (‘‘S&P’’). Moody’s Investors Service, Inc. (‘‘Moody’s’’) or Fitch, Inc. (‘‘Fitch’’) or any successor thereto (each, an ‘‘NRSRO’’). Third, the Trustee cannot be an affiliate of any other member of the Restricted Group, other than an Underwriter. The &lsqu o;‘Restricted Group’’ consists of each of the Underwriters, the Depositor, the Master Servicer, the Special Servicer, the Trustee, the Swap Counterparty any sub-servicer and any obligor with respect to Mortgage Loans constituting more than 5.0% of the aggregate unamortized principal balance of the Mortgage Loans as of the date of initial issuance of the Offered Certificates, and any of their
S-211
affiliates. Fourth, the sum of all payments made to and retained by any Underwriter in connection with the distribution or placement of the Offered Certificates must represent not more than reasonable compensation for underwriting such Certificates; the sum of all payments made to and retained by the Depositor pursuant to the assignment of the Mortgage Loans to the Trust Fund must represent not more than the fair market value of such obligations; and the sum of all payments made to and retained by the Master Servicer, the Special Servicer or any sub-servicer must represent not more than reasonable compensation for such person’s services under the Pooling and Servicing Agreement and reimbursement of such person’s reasonable expenses in connection therewith. Fi fth, the investing Plan must be an accredited investor as defined in Rule 501(a)(1) of Regulation D of the Securities and Exchange Commission under the Securities Act.
A fiduciary of a Plan contemplating purchasing any Class of the Offered Certificates must make its own determination that, at the time of such purchase, such Certificates satisfy the general conditions set forth above.
The Exemptions also require that the Trust Fund meet the following requirements: (i) the Trust Fund must consist solely of assets of the type that have been included in other investment pools; (ii) certificates in such other investment pools must have been rated in one of the four highest generic rating categories by S&P, Moody’s or Fitch for at least one year prior to the Plan’s acquisition of the Offered Certificates; and (iii) certificates in such other investment pools must have been purchased by investors other than Plans for at least one year prior to any Plan’s acquisition of the Offered Certificates.
If the general conditions of the Exemptions are satisfied, the Exemptions may provide an exemption from the restrictions imposed by Sections 406(a) and 407(a) of ERISA (as well as the excise taxes imposed by Sections 4975(a) and (b) of the Code by reason of Sections 4975(c)(1)(A) through (D) of the Code) in connection with (i) the direct or indirect sale, exchange or transfer of the Offered Certificates in the initial issuance of Certificates between the Depositor or an Underwriter and a Plan when the Depositor, an Underwriter, the Trustee, the Master Servicer, the Special Servicer, a sub-servicer or an obligor with respect to Mortgage Loans is a ‘‘Party in Interest,’’ as defined in the accompanying prospectus, with respect to the investing Plan, (ii) the direct or indirect acquisition or disposition in the secondary market of the Offered Certificates by a Plan and (iii) the holding of Offered Certi ficates by a Plan. However, no exemption is provided from the restrictions of Sections 406(a)(1)(E), 406(a)(2) and 407 of ERISA for the acquisition or holding of the Offered Certificate on behalf of an ‘‘Excluded Plan’’ by any person who has discretionary authority or renders investment advice with respect to the assets of such Excluded Plan. For purposes hereof, an ‘‘Excluded Plan’’ is a Plan sponsored by any member of the Restricted Group.
If certain specific conditions of the Exemptions are also satisfied, each such Exemption may provide relief from the restrictions imposed by reason of Sections 406(b)(1) and (b)(2) of ERISA and the taxes imposed by Section 4975(c)(1)(E) of the Code to an obligor with respect to Mortgage Loans acting as a fiduciary with respect to the investment of a Plan’s assets in the Offered Certificates (or such obligor’s affiliate) only if, among other requirements, (i) such obligor is an obligor with respect to 5% or less of the fair market value of the obligations or receivables contained in the Trust Fund, (ii) the investing Plan is not an Excluded Plan, (iii) a Plan’s investment in each Class of the Offered Certificates does not exceed 25% of all of the Certificates of that Class outstanding at the time of the acquisition, (iv) immediately after the acquisition, no more than 25% of the assets of the Plan are invested in ce rtificates representing an interest in trusts (including the Trust Fund) containing assets sold or serviced by the Depositor or the Master Servicer and (v) in the case of the acquisition of the Offered Certificates in connection with their initial issuance, at least 50% of each Class of Offered Certificates in which Plans have invested and at least 50% of the aggregate interest in the Trust Fund is acquired by persons independent of the Restricted Group.
The Exemptions also apply to transactions in connection with the servicing, management and operation of the Trust Fund; provided that, in addition to the general requirements described above, (a) such transactions are carried out in accordance with the terms of a binding pooling and servicing agreement, (b) the pooling and servicing agreement is provided to, or described in all material respects in the accompanying prospectus or private placement memorandum provided to, investing Plans before their purchase of Certificates issued by the Trust Fund and (c) the terms and conditions for the defeasance
S-212
of a mortgage obligation and substitution of a new mortgage obligation, as so described, have been approved by an NRSRO and do not result in any Offered Certificates receiving a lower credit rating from the NRSRO than the current rating. The Pooling and Servicing Agreement is a pooling and servicing agreement as defined in the Exemptions. The Pooling and Servicing Agreement provides that all transactions relating to the servicing, management and operations of the Trust Fund must be carried out in accordance with the Pooling and Servicing Agreement.
Before purchasing any Class of Offered Certificate, a fiduciary of a Plan should itself confirm that the specific and general conditions of the Exemptions and the other requirements set forth in the Exemptions would be satisfied.
In addition, Plan fiduciaries should note that an affiliate of the Trustee is the master servicer under the pooling and servicing agreement for the Morgan Stanley Capital I Trust Commercial Mortgage Pass-Through Certificates, Series 2007-IQ14, pursuant to which the Beacon D.C. & Seattle Pool Whole Loan will be serviced. See ‘‘DESCRIPTION OF THE MORTGAGE POOL—Co-Lender Loans—The Beacon D.C. and Seattle Pool Loan’’ and ‘‘SERVICING OF THE MORTGAGE LOANS— Servicing of the Beacon D.C. & Seattle Pool Loan’’ in this prospectus supplement. Under the terms of such pooling and servicing agreement, the actions of the Morgan Stanley 2007-IQ14 master servicer will be subject to oversight by the Bank of New York in its capacity as the trustee for the Morgan Stanley Capital I Trust Commercial Mortgage Pass-Through Certificates, Series 2007-IQ14. In addition, under the terms of the Beacon D.C. & Seatt le Pool Loan Pari Passu Intercreditor Agreement, the holders of the Morgan Stanley 2007-IQ14 certificates, by virtue of their ownership of one of the Beacon D.C. & Seattle Pari Passu Companion Loans, have the sole and exclusive authority with respect to the administration of, and exercise of rights and remedies with respect to, the Beacon D.C. & Seattle Pool Whole Loan. Although there is little authority in this regard, and therefore it is not free from doubt, the Depositor believes that this arrangement satisfies the requirement of the Exemptions for an independent trustee. Plan fiduciaries should consult with their advisors in this regard.
Persons who have an ongoing relationship with the Detroit Police and Fire Retirement Systems, which is a governmental plan, should note that this plan owns an interest in the borrower under the Glenwood Plaza Loan. Such persons should consult with counsel regarding whether this relationship would affect their ability to purchase and hold Offered Certificates.
Such fiduciaries should note that the mortgaged property securing the Westin Casuarina Resort & Spa – Cayman Islands mortgage loan is located in the Cayman Islands. Fiduciaries should consult with their advisors regarding any applicable plan’s continued ability to hold ERISA eligible certificates if the mortgaged property securing the Westin Casuarina Resort & Spa – Cayman Islands mortgage loan were acquired by the trust as a result of foreclosure.
Any Plan fiduciary considering the purchase of Offered Certificates should consult with its counsel with respect to the applicability of the Exemptions and other issues and determine on its own whether all conditions have been satisfied and whether the Offered Certificates are an appropriate investment for a Plan under ERISA and the Code (or, in the case of governmental plans and certain church plans, under Similar Law) with regard to ERISA’s general fiduciary requirements, including investment prudence and diversification and the exclusive benefit rule. Each purchaser of the Offered Certificates with the assets of one or more Plans shall be deemed to represent that each such Plan qualifies as an ‘‘accredited investor’’ as defined in Rule 501(a)(1) of Regulation D under the Securities Act. No Plan may purchase or hold an interest in any Class of Offered Certificates unless (a) such Certificates are rated in one of the top four generic rating categories by at least one NRSRO at the time of such purchase or (b) such Plan is an insurance company general account that represents and warrants that it is eligible for, and meets all of the requirements of, Sections I and III of Prohibited Transaction Class Exemption 95-60.
THE SALE OF OFFERED CERTIFICATES TO A PLAN IS IN NO RESPECT A REPRESENTATION OR WARRANTY BY THE DEPOSITOR, THE UNDERWRITERS OR ANY OTHER PERSON THAT THIS INVESTMENT MEETS ALL RELEVANT LEGAL REQUIREMENTS WITH RESPECT TO INVESTMENTS BY PLANS GENERALLY OR ANY PARTICULAR PLAN, THAT THE EXEMPTIONS WOULD APPLY TO THE ACQUISITION OF
S-213
THIS INVESTMENT BY PLANS IN GENERAL OR ANY PARTICULAR PLAN, OR THAT THIS INVESTMENT IS APPROPRIATE FOR PLANS GENERALLY OR ANY PARTICULAR PLAN.
Legal Investment
The Offered Certificates will not constitute ‘‘mortgage related securities’’ for purposes of the Secondary Mortgage Market Enhancement Act of 1984, as amended. The appropriate characterization of the Offered Certificates under various legal investment restrictions, and thus the ability of investors subject to these restrictions to purchase the Offered Certificates, is subject to significant interpretive uncertainties. No representations are made as to the proper characterization of the Offered Certificates for legal investment, financial institution regulatory, or other purposes, or as to the ability of particular investors to purchase the Offered Certificates under applicable legal investment restrictions. The uncertainties described above (and any unfavorable future determinations concerning the legal investment or financial institution regulatory characteristics of the Offered Certificates) may adversely affect the liquidity of the Off ered Certificates. Accordingly, all investors whose investment activities are subject to legal investment laws and regulations, regulatory capital requirements or review by regulatory authorities should consult with their own legal advisors in determining whether and to what extent the Offered Certificates will constitute legal investments for them or are subject to investment, capital or other restrictions. Sec ‘‘LEGAL INVESTMENT’’ in the accompanying prospectus.
METHOD OF DISTRIBUTION
Subject to the terms and conditions set forth in the underwriting agreement (the ‘‘Underwriting Agreement’’) among the Depositor and Wachovia Securities, Barclays Capital and Goldman Sachs (collectively, the ‘‘Underwriters’’) and Wachovia, the Depositor has agreed to sell to each of the Underwriters, and each of the Underwriters has agreed to purchase, severally but not jointly, the respective Certificate Balances or Notional Amount, as applicable, of each Class of the Offered Certificates as set forth below, subject in each case to a variance of 5%.
| Class | Wachovia Securities | Barclays Capital | Goldman Sachs | |||||||||||||||
| Class A-1 | $ | 25,707,000 | ||||||||||||||||
| Class A-2 | $ | 946,379,000 | ||||||||||||||||
| Class A-PB | $ | 62,827,000 | ||||||||||||||||
| Class A-3* | $ | 946,589,000 | $ | 1,000,000 | $ | 1,000,000 | ||||||||||||
| Class A-1A | $ | 443,196,000 | ||||||||||||||||
| Class IO | $ | 3,823,853,068 | ||||||||||||||||
| Class A-J | $ | 253,330,000 | ||||||||||||||||
| Class B | $ | 43,019,000 | ||||||||||||||||
| Class C | $ | 47,798,000 | ||||||||||||||||
| Class D | $ | 28,679,000 | ||||||||||||||||
| Class E | $ | 28,679,000 | ||||||||||||||||
| Class F | $ | 38,238,000 | ||||||||||||||||
| * | It is expected that approximately $375 million of the initial Certificate Balance of the Class A-3 Certificates will be sold on the Closing Date to Wachovia Capital Markets, LLC or an affiliate. Wachovia Capital Markets, LLC is one of the underwriters and also an affiliate of the Depositor. It is anticipated such Class A-3 Certificates will thereafter be sold for inclusion in a collateralized debt obligation transaction. |
Wachovia Securities is acting as lead manager for this offering and Barclays Capital and Goldman Sachs are acting as co-managers for this offering. Wachovia Securities is acting as sole bookrunner with respect to all of the Offered Certificates. It is intended that Wachovia Securities International Limited will act as a member of the selling group on behalf of Wachovia Securities in certain jurisdictions. Wachovia Securities International Limited is a United Kingdom firm and is regulated by the Financial Services Authority.
Proceeds to the Depositor from the sale of the Offered Certificates, before deducting expenses payable by the Depositor, will be approximately $2,855,402,973 which includes accrued interest.
S-214
Distribution of the Offered Certificates will be made by each Underwriter from time to time in negotiated transactions or otherwise at varying prices to be determined at the time of sale. Wachovia Securities or one of its affiliates may purchase a portion of certain Classes of the Offered Certificates, purchase certain Offered Certificates for its own account or sell certain Offered Certificates to one of its affiliates. Sales of the Offered Certificates may also occur on the Closing Date and other dates after the Closing Date, as agreed upon in negotiated transactions with various purchasers. Each Underwriter may effect such transactions by selling the Offered Certificates to or through dealers, and such dealers may receive compensation in the form of underwriting discounts, concessions or commissions from such Underwriter, in connection with the purchase and sale of the Offered Certificates, each Underwriter may be deemed to have received compensation from the Depositor in the form of underwriting discounts. Each Underwriter and any dealers that participate with any Underwriter in the distribution of the Offered Certificates may be deemed to be underwriters and any profit on the resale of the Offered Certificates positioned by them may be deemed to be underwriting discounts and commissions under the Securities Act.
Purchasers of the Offered Certificates, including dealers, may, depending on the facts and circumstances of such purchases, be deemed to be ‘‘underwriters’’ within the meaning of the Securities Act in connection with reoffers and sales by them of Offered Certificates. Certificateholders should consult with their legal advisors in this regard prior to any such reoffer or sale.
The Depositor also has been advised by the Underwriters that each of them, through one or more of its affiliates, currently intends to make a market in the Offered Certificates; however, none of the Underwriters has any obligation to do so, any market making may be discontinued at any time and there can be no assurance that an active secondary market for the Offered Certificates will develop. See ‘‘RISK FACTORS—Liquidity for Certificates May Be Limited’’ in this, prospectus supplement and ‘‘RISK FACTORS—Your Ability to Resell Certificates May Be Limited Because of Their Characteristics’’ in the accompanying prospectus.
This prospectus supplement and the accompanying prospectus may be used by the Depositor. Wachovia Securities, an affiliate of the Depositor. and any other affiliate of the Depositor when required under the federal securities laws in connection with offer and sales of the Offered Certificates or in furtherance of market-making activities in the Offered Certificates. Wachovia Securities or any such other affiliate may act as principal or agent in such transactions. Such sales will be made at prices related to prevailing market prices at the time of sale or otherwise.
The Depositor has agreed to indemnify each Underwriter and each person, if any, who controls any Underwriter within the meaning of Section 15 of the Securities Act against, or make contributions to each Underwriter and each such controlling person with respect to, certain liabilities, including liabilities under the Securities Act.
Wachovia Securities, one of the Underwriters, is an affiliate of the Depositor and Wachovia Bank National Association, which is one of the Mortgage Loan Sellers, a Sponsor, the Master Servicer and the swap counterparty.
Certain Relationships Among Parties
This prospectus supplement and the accompanying prospectus may be used by the Depositor, Wachovia Securities, an affiliate of the Depositor, and any other affiliate of the Depositor when required under the federal securities laws in connection with offers and sales of the Offered Certificates or in furtherance of market-making activities in the Offered Certificates. Wachovia Securities or any such other affiliate may act as principal or agent in such transactions. Such sales will be made at prices related to prevailing market prices at the time of sale or otherwise. The Depositor has agreed to indemnify each Underwriter and each person, if any, who controls any Underwriter within the meaning of Section 15 of the Securities Act against, or make contributions to each Underwriter and each such controlling person with respect to, certain liabilities, including liabilities under the Securities Act.
Wachovia Securities, one of the Underwriters, is an affiliate of the Depositor and of Wachovia Bank, National Association, which is one of the Mortgage Loan Sellers, a Sponsor, the Master Servicer and one
S-215
of the Morgan Stanley 2007-C6 Master Servicers. This may result in a conflict of interest between the interests of Wachovia Securities and/or its affiliates and the interests of the holders of the Certificates.
It is expected that approximately $375 million of the initial Certificate Balance of the Class A-3 Certificates will be sold on the Closing Date to Wachovia Securities or an affiliate. Wachovia Securities is one of the underwriters and also an affiliate of the Depositor. It is anticipated such Class A-3 Certificates will thereafter be sold for inclusion in a collateralized debt obligation transaction.
Wachovia Bank, National Association, the master servicer, a sponsor and one of the mortgage loan sellers, may finance the acquisition of certain of the certificates by one or more investors from time to time.
Legal Matters
Certain legal matters will be passed upon for the Depositor by Cadwalader, Wickersham & Taft LLP, Charlotte, North Carolina. Certain legal matters will be passed upon for the Underwriters by Dewey Ballantine LLP, Charlotte, North Carolina.
Ratings
The Offered Certificates are required as a condition of their issuance to have received the following ratings from Moody’s and S&P (together, the ‘‘Rating Agencies’’):
| Class | Expected Ratings from Moody’s/S&P | ||
| Class A-1 | Aaa/AAA | ||
| Class A-2 | Aaa/AAA | ||
| Class A-PB | Aaa/AAA | ||
| Class A-3 | Aaa/AAA | ||
| Class A-1A | Aaa/AAA | ||
| Class IO | Aaa/AAA | ||
| Class A-J | Aaa/AAA | ||
| Class B | Aa1/AA+ | ||
| Class C | Aa2/AA | ||
| Class D | Aa3/AA− | ||
| Class E | A1/A+ | ||
| Class F | A2/A |
The ratings on the Offered Certificates address the likelihood of timely receipt by holders thereof of all distributions of interest to which they are entitled and, except in the case of the Class IO Certificates, distributions of principal by the Rated Final Distribution Date set forth on the cover page of this prospectus supplement. The ratings take into consideration the credit quality of the Mortgage Pool, structural and legal aspects associated with the Offered Certificates, and the extent to which the payment stream from the Mortgage Pool is adequate to make payments required under the Offered Certificates. In addition, rating adjustments may result from a change in the financial position of the Trustee as back up liquidity provider. A security rating does not represent any assessment of the yield to maturity that investors may experience or the possibility that the holders of the Class IO Certificates might not fully recover their investment in the event of rapid prepayments of the Mortgage Loans (including both voluntary and involuntary prepayments). In addition, a rating does not address (i) the likelihood or frequency of voluntary or mandatory prepayments of Mortgage Loans, (ii) the degree to which such prepayments might differ from those originally anticipated, (iii) payment of net default interest or Additional Interest, (iv) whether and to what extent payments of Yield Maintenance Charges or Prepayment Premiums will be received or the corresponding effect on yield to investors, or (v) whether and to what extent Net Aggregate Prepayment Interest Shortfalls will be realized or allocated to Certificateholders. As described in this prospectus supplement, the amounts payable with respect to the Class IO Certificates consist only of interest. If the entire Mortgage Pool were to prepay in the initial
S-216
month, with the result that the holders of the Class IO Certificates receive only a single month’s interest and thus suffer a nearly complete loss of their investment, all amounts ‘‘due’’ to such Certificateholders will nevertheless have been paid, and such result is consistent with the ratings received on the Class IO Certificates. The Class IO Certificates’ Notional Amount upon which interest is calculated is reduced by the allocation of Realized Losses, Additional Trust Fund Expenses and prepayments, whether voluntary or involuntary to the extent described herein. The rating does not address the timing or magnitude of reductions of the Notional Amount of the Class IO Certificates, but only the obligation to pay interest timely on the Notional Amount as reduced from time to time. Accordingly, the ratings of the Class IO Certificates should be evaluated independently from similar ratings on other types of securities.
There can be no assurance that any rating agency not requested to rate the Offered Certificates will nonetheless issue a rating to any or all Classes thereof and, if so, what such rating or ratings would be. A rating assigned to any Class of Offered Certificates by a rating agency that has not been requested by the Depositor to do so may be lower than the rating assigned thereto by any of the Rating Agencies.
The ratings on the Offered Certificates should be evaluated independently from similar ratings on other types of securities. A security rating is not a recommendation to buy, sell or hold securities and may be subject to revision or withdrawal at any time by the assigning Rating Agency. See ‘‘RISK FACTORS —Ratings Do Not Guarantee Payment and Do Not Address Prepayment Risks’’ in the accompanying prospectus.
Pursuant to an agreement between the Depositor and each of the Rating Agencies, the Rating Agencies will provide ongoing ratings feedback with respect to the Offered Certificates for as long as they remain issued and outstanding.
S-217
INDEX OF DEFINED TERMS
| 17 Battery Place South Loan | S-97 | ||
| 17 Battery Place South Subordinate Companion Loan | S-98 | ||
| 30/360 basis | S-90 | ||
| 30/360 Mortgage Loan | S-90 | ||
| A/B Loan Control Appraisal Period | S-101 | ||
| A/B Loan Intercreditor Agreement | S-100 | ||
| A/B Loan Intercreditor Agreements | S-100 | ||
| A/B Loans | S-99 | ||
| Accrued Certificate Interest | S-176 | ||
| Actual/360 basis | S-90 | ||
| Additional Interest | S-91 | ||
| Additional Interest Account | S-169 | ||
| Additional Trust Fund Expenses | S-183 | ||
| Administrative Cost Rate | S-111 | ||
| Advance | S-185 | ||
| Anticipated Repayment Date | S-91 | ||
| Appraisal Reduction Amount | S-187 | ||
| ARD Loans | S-91 | ||
| Artesia | S-90, S-120 | ||
| Artesia Mortgage Loans | S-126 | ||
| Assumed Final Distribution Date | S-193 | ||
| Assumed Scheduled Payment | S-179 | ||
| Available Distribution Amount | S-167 | ||
| Balloon Loans | S-90 | ||
| Balloon Payment | S-90 | ||
| Barclays Capital | S-211 | ||
| Beacon D.C. & Seattle Pool Loan | S-97 | ||
| Beacon D.C. & Seattle Pool Pari Passu Companion Loans | S-97 | ||
| Beacon D.C. & Seattle Pool Pari Passu Intercreditor Agreement | S-99 | ||
| Beacon D.C. & Seattle Pool Whole Loan | S-97 | ||
| Breach | S-133 | ||
| Bunge North America Loan | S-97 | ||
| Capital Imp. Reserve | S-112 | ||
| Caplease | S-99 | ||
| Caplease Intercreditor Agreement | S-100 | ||
| Caplease Junior Subordinate Companion Loan | S-105 | ||
| Caplease Loan | S-99 | ||
| Caplease Senior Subordinate Companion Loan | S-105 | ||
| Caplease Subordinate Companion Loans | S-99 | ||
| Caplease Whole Loan | S-99 | ||
| Centerside II Intercreditor Agreement | S-100 | ||
| Centerside II Loan | S-97 | ||
| Centerside II Subordinate Companion Loan | S-98 | ||
| Certificate Account | S-168 | ||
| Certificate Deferred Interest | S-165 | ||
| Certificateholders | S-167 | ||
| Certificates | S-162 | ||
| Class | S-162 | ||
| Class A Certificates | S-162 | ||
| Class A-4FL Regular Interest | S-162 | ||
| Class A-MFL Regular Interest | S-162 | ||
| Class A-PB Planned Principal Balance | S-178 | ||
| CMSA | S-191 | ||
| CMSA Bond File | S-190 | ||
| CMSA Collateral Summary File | S-190 | ||
| CMSA Loan Periodic Update File | S-190 | ||
| CMSA Property File | S-190 | ||
| CMSA Reconciliation of Funds Report | S-190 | ||
| Code | S-128 | ||
| Co-Lender Loans | S-97 | ||
| Collection Period | S-166 | ||
| Companion Loans | S-99 | ||
| Compensating Interest Payment | S-153 | ||
| Component | S-164 | ||
| Component Balance | S-164 | ||
| Components | S-165 | ||
| Constant Prepayment Rate | S-203 | ||
| Contract Rent | S-113 | ||
| Controlling Class | S-140 | ||
| Controlling Class Representative | S-140 | ||
| Core Material Documents | S-128 | ||
| Corrected Mortgage Loan | S-142 | ||
| Courtyard by Marriott – Philadelphia, PA Loan | S-97 | ||
| Courtyard by Marriott – Philadelphia, PA Subordinate Companion Loan | S-98 | ||
| CPR | S-203 | ||
| Credit Lease | S-65 | ||
| Credit Lease Loan | S-65 | ||
| Cross Collateralized and Cross Defaulted Loan Flag | S-107 | ||
| Crossed Group | S-133 | ||
| Crossed Loan | S-133 | ||
| Custodian | S-127 | ||
| Cut-Off Date Group 1 Balance | S-88 | ||
| Cut-Off Date Group 2 Balance | S-88 | ||
| Cut-Off Date Group Balances | S-88 |
S-218
| Cut-Off Date LTV | S-109 | ||
| Cut-Off Date LTV Ratio | S-109 | ||
| Cut-Off Date Pool Balance | S-88 | ||
| DDR Southeast Pool Intercreditor Agreement | S-99 | ||
| DDR Southeast Pool Loan | S-97 | ||
| DDR Southeast Pool Pari Passu Companion Loans | S-98 | ||
| DDR Southeast Pool Pari Passu Note A-1 Companion Loan | S-98 | ||
| DDR Southeast Pool Pari Passu Note A-2 Companion Loan | S-98 | ||
| DDR Southeast Pool Whole Loan | S-98 | ||
| Defaulted Lease Claim | S-99 | ||
| Defaulted Mortgage Loan | S-158 | ||
| Defeasance | S-112 | ||
| Defeasance Collateral | S-92 | ||
| Defect | S-133 | ||
| Depositor | S-115 | ||
| Determination Date | S-167 | ||
| Determination Party | S-133 | ||
| Discount Rate | S-180 | ||
| Distributable Certificate Interest | S-176 | ||
| Distribution Account | S-168 | ||
| Distribution Date | S-167 | ||
| Distribution Date Statement | S-188 | ||
| DSC Ratio | S-107 | ||
| DSCR | S-107 | ||
| DTC | S-163 | ||
| Due Date | S-90 | ||
| ERISA | S-211 | ||
| Excess Cash Flow | S-91 | ||
| Excluded Plan | S-212 | ||
| Exemption | S-211 | ||
| Exemptions | S-211 | ||
| Final Recovery Determination | S-189 | ||
| Fitch | S-211 | ||
| Form 8-K | S-134 | ||
| FSMA | S-2 | ||
| Gain-on-Sale Reserve Account | S-169 | ||
| Goldman Sachs | S-211 | ||
| ING Hospitality Pool Intercreditor Agreement | S-99 | ||
| ING Hospitality Pool Loan | S-97 | ||
| ING Hospitality Pool Pari Passu Companion Loan | S-97 | ||
| ING Hospitality Pool Whole Loan | S-98 | ||
| Intercreditor Agreement | S-100 | ||
| Intercreditor Agreements | S-100 | ||
| Interest Accrual Period | S-166 | ||
| Interest Reserve Account | S-168 | ||
| Interest Reserve Amount | S-168 | ||
| Interest Reserve Loans | S-168 | ||
| IRS | S-210 | ||
| La Jolla Centre I Intercreditor Agreement | S-100 | ||
| La Jolla Centre I Loan | S-97 | ||
| La Jolla Centre I Loan Subordinate Companion Loan | S-98 | ||
| La Jolla Centre II Intercreditor Agreement | S-100 | ||
| La Jolla Centre II Loan | S-97 | ||
| La Jolla Centre II Loan Subordinate Companion Loan | S-98 | ||
| Liquidation Fee | S-152 | ||
| Loan Group 1 | S-88 | ||
| Loan Group 1 Principal Distribution Amount | S-177 | ||
| Loan Group 2 | S-88 | ||
| Loan Group 2 Principal Distribution Amount | S-177 | ||
| Loan Groups | S-88 | ||
| Loan Pair | S-135 | ||
| Loan per Sq. Ft., Unit, Pad, Room or Bed | S-111 | ||
| Lockout | S-112 | ||
| Lockout Period | S-112 | ||
| LTV at ARD or Maturity | S-110 | ||
| Majority Subordinate Certificateholder | S-194 | ||
| Master Servicer | S-136 | ||
| Master Servicing Fee | S-151 | ||
| Master Servicing Fee Rate | S-152 | ||
| Maturity Date LTV Ratio | S-110 | ||
| Monthly Rental Payment | S-65 | ||
| Moody’s | S-211 | ||
| Morgan Stanley 2007-IQ14 Master Servicer | S-143 | ||
| Morgan Stanley 2007-IQ14 Pooling and Servicing Agreement | S-143 | ||
| Morgan Stanley 2007-IQ14 Special Servicer | S-143 | ||
| Morgan Stanley 2007-IQ14 Trustee | S-143 | ||
| Mortgage | S-88 | ||
| Mortgage Deferred Interest | S-165 | ||
| Mortgage File | S-127 | ||
| Mortgage Loan | S-179 | ||
| Mortgage Loan Purchase Agreement | S-126 | ||
| Mortgage Loan Purchase Agreements | S-126 | ||
| Mortgage Loans | S-88, S-152, S-179 |
S-219
| Mortgage Note | S-88 | ||
| Mortgage Pool | S-88 | ||
| Mortgage Rate | S-90 | ||
| Mortgaged Property | S-88 | ||
| NA | S-112 | ||
| NAV | S-112 | ||
| Net Aggregate Prepayment Interest Shortfall | S-176 | ||
| Net Cash Flow | S-107 | ||
| Net Mortgage Rate | S-166 | ||
| Non-Offered Certificates | S-162 | ||
| Nonrecoverable P&I Advance | S-185 | ||
| Notional Amount | S-164 | ||
| NRSRO | S-211 | ||
| Occupancy Percentage | S-112 | ||
| Offered Certificates | S-162 | ||
| OID Regulations | S-210 | ||
| Open Period | S-112 | ||
| Option Price | S-159 | ||
| Original Term to Maturity | S-112 | ||
| Pari Passu Companion Loans | S-99 | ||
| Pari Passu Loans | S-99 | ||
| Periodic Payments | S-90 | ||
| Plan | S-211 | ||
| Pooling and Servicing Agreement | S-162 | ||
| PPA | S-137 | ||
| Prepayment Interest Excess | S-153 | ||
| Prepayment Interest Shortfall | S-152 | ||
| Prepayment Premiums | S-180 | ||
| Primary Collateral | S-134 | ||
| Privileged Person | S-192 | ||
| Prospectus Directive | S-2 | ||
| PTE | S-211 | ||
| Purchase Option | S-159 | ||
| Purchase Price | S-128 | ||
| P&I | S-137 | ||
| P&I Advance | S-184 | ||
| Qualified Appraiser | S-187 | ||
| Qualified Substitute Mortgage Loan | S-129 | ||
| Rated Final Distribution Date | S-194 | ||
| Rating Agencies | S-216 | ||
| Realized Losses | S-183 | ||
| Regular Certificates | S-162 | ||
| Reimbursement Rate | S-185 | ||
| REIT | S-210 | ||
| Related Proceeds | S-184 | ||
| Relevant Implementation Date | S-2 | ||
| Relevant Member State | S-2 | ||
| Relevant Persons | S-2 | ||
| Remaining Amortization Term | S-112 | ||
| Remaining Term to Maturity | S-112 | ||
| REMIC | S-36 | ||
| REMIC Administrator | S-196 | ||
| REMIC I | S-36, S-209 | ||
| REMIC II | S-36, S-209 | ||
| REMIC Regulations | S-209 | ||
| REMIC Residual Certificates | S-162 | ||
| Rental Property | S-107 | ||
| REO Extension | S-159 | ||
| REO Loan | S-179 | ||
| REO Property | S-142 | ||
| Replacement Reserve | S-112 | ||
| Required Appraisal Date | S-186 | ||
| Required Appraisal Loan | S-187 | ||
| Restricted Group | S-211 | ||
| Restricted Servicer Reports | S-191 | ||
| Scenario | S-203 | ||
| Scheduled Payment | S-179 | ||
| SEC | S-190 | ||
| Securities Act | S-162 | ||
| Sequential Pay Certificates | S-162 | ||
| Servicing Fees | S-152 | ||
| Servicing Standard | S-135 | ||
| Servicing Transfer Event | S-142 | ||
| Similar Law | S-211 | ||
| SMMEA | S-37 | ||
| Special Servicing Fee | S-152 | ||
| Special Servicing Fee Rate | S-152 | ||
| Specially Serviced Mortgage Loans | S-142 | ||
| Stated Principal Balance | S-166 | ||
| Strip Rate | S-165 | ||
| Subordinate Certificates | S-162 | ||
| Subordinate Companion Loans | S-99 | ||
| Substitution Shortfall Amount | S-128 | ||
| S&P | S-211 | ||
| Table Assumptions | S-193, S-204 | ||
| TI/LC Reserve | S-113 | ||
| Transfer Affidavit and Agreement | S-162 | ||
| Trust Fund | S-162 | ||
| Trustee | S-195 | ||
| Trustee Fee | S-151, S-195 | ||
| Trustee Fee Rate | S-195 | ||
| Two Herald Square Loan | S-97 | ||
| Two Herald Square Subordinate Companion Loan | S-98 | ||
| Underwriter | S-211 | ||
| Underwriters | S-214 | ||
| Underwriting Agreement | S-214 |
S-220
| Underwritten Replacement Reserves | S-111 | ||
| Unrestricted Servicer Reports | S-191 | ||
| UPB | S-137 | ||
| Voting Rights | S-194 | ||
| WA | S-111 | ||
| Wachovia | S-90, S-114 | ||
| Wachovia Mortgage Loans | S-126 | ||
| Wachovia Securities | S-211 | ||
| Weighted Average Net Mortgage Rate | S-166 | ||
| Wells Fargo Bank | S-195 | ||
| Whole Loan | S-99 | ||
| Whole Loans | S-99 | ||
| Workout Fee | S-152 | ||
| Workout-Delayed Reimbursement Amount | S-185 | ||
| Year Built | S-111 | ||
| Yield Maintenance Charges | S-179 |
S-221
WACHOVIA BANK COMMERCIAL MORTGAGE TRUST SERIES 2007-C32 ANNEX A-1 CERTAIN CHARACTERISTICS OF THE MORTGAGE LOANS AND MORTGAGED PROPERTIES MORTGAGE LOAN LOAN GROUP NUMBER NUMBER PROPERTY NAME ADDRESS - ------------------------------------------------------------------------------------------------------------------------------------ 1 1 Beacon D.C. & Seattle Pool(3) Various 1.01 Market Square 701, 801 Pennsylvania Avenue NW 1.02 Polk & Taylor Buildings 2521 S Clark Street & 2530 Crystal Drive 1.03 Wells Fargo Center 999 Third Avenue 1.04 One, Two & Three Lafayette Centre 1120 20th Street NW; 1155 21st Street NW; 1133 21st Street NW 1.05 Booz Allen Complex 8251 Greensboro Drive; 8281 Greensboro Drive; 8283 Greensboro Drive 1.06 Key Center 601 108th Avenue NE 1.07 Sunset North 3060-3180, 139th Avenue SE 1.08 City Center Bellevue 500 108th Avenue NE 1.09 Plaza Center and US Bank Tower 10800 and 10900 NE 8th Street 1.10 1616 Fort Myer Drive 1616 Fort Myer Drive 1.11 American Center 8300 & 8330 Boone Boulevard 1.12 Eastgate Office Park 15325 SE 30th Place 1.13 Liberty Place 325 7th Street NW 1.14 Lincoln Executive Center Buildings 3380 146th Place Southeast, 14332 Southeast I, II, III, A&B Eastgate Way, 3245 146th Place Southeast; 3290 and 3310 146th Place Southeast 1.15 11111 Sunset Hills Road 11111 Sunset Hills Road 1.16 Army and Navy Club Building 1627 I Street NW 1.17 Plaza East 11100 NE 8th Street 1.18 Reston Town Center 11911 Freedom Drive 1.19 1300 North Seventeenth Street 1300 North 17th Street 1.20 Washington Mutual Tower 1201 Third Avenue 2 1 ING Hospitality Pool(3) Various 2.01 Residence Inn - La Jolla, CA 8901 Gilman Drive 2.02 Residence Inn Seattle East - Redmond , WA 7575 164th Avenue NE 2.03 Residence Inn - Long Beach, CA 4111 East Willow Street 2.04 Residence Inn - Costa Mesa, CA 881 West Baker Street 2.05 Residence Inn Pasadena - Arcadia, CA 321 East Huntington Drive 2.06 Residence Inn - Irvine, CA 10 Morgan Street 2.07 Homewood Suites - Herndon, VA 13460 Sunrise Valley Drive 2.08 Residence Inn Concord - Pleasant Hill, CA 700 Ellinwood Way 2.09 Residence Inn - San Ramon, CA 1071 Market Place 2.10 Homewood Suites - Linthicum, MD 1181 Winterson Road 2.11 Residence Inn - Saint Louis, MO 1100 McMorrow Avenue 2.12 Residence Inn - Bakersfield, CA 4241 Chester Lane 2.13 Residence Inn - Boulder, CO 3030 Center Green Drive 2.14 Residence Inn - Hapeville, GA 3401 International Boulevard 2.15 Residence Inn Chicago - Deerfield, IL 530 Lake Cook Road 2.16 Homewood Suites - Malvern, PA 12 East Swedesford Road 2.17 Residence Inn - Houston, TX 525 Bay Area Boulevard 2.18 Residence Inn - Santa Fe, NM 1698 Galisteo Street 2.19 Residence Inn - Placentia, CA 700 West Kimberly Avenue 2.20 Homewood Suites - Glen Allen, VA 4100 Innslake Drive 2.21 Residence Inn - Atlanta, GA (Buckhead) 2960 Piedmont Road NE 2.22 Homewood Suites - Beaverton, OR 15525 NW Gateway Court 2.23 Residence Inn - Cincinnati, OH 11689 Chester Road 2.24 Residence Inn - Lombard, IL 2001 South Highland Avenue 2.25 Residence Inn - Jacksonville, FL 8365 Dix Ellis Trail 2.26 Homewood Suites - Irving, TX 4300 Wingren Drive 2.27 Residence Inn Dallas - Irving, TX 950 Walnut Hill Lane 2.28 Homewood Suites - Clearwater, FL 2233 Ulmerton Road 2.29 Residence Inn - Boca Raton, FL 525 NW 77th Street 2.30 Residence Inn - Clearwater, FL 5050 Ulmerton Road 2.31 Residence Inn - Birmingham, AL 3 Greenhill Parkway 2.32 Residence Inn - Smyrna, GA 2771 Cumberland Boulevard 2.33 Homewood Suites - Addison, TX 4451 Beltline Road 2.34 Homewood Suites - Chesterfield, MO 840 Chesterfield Parkway 2.35 Residence Inn - Montgomery, AL 1200 Hilmar Court 2.36 Homewood Suites - Atlanta, GA (Buckhead) 3566 Piedmont Road 2.37 Residence Inn - Chesterfield, MO 15431 Conway Road 2.38 Residence Inn - Blue Ash, OH 11401 Reed Hartman Highway 2.39 Residence Inn - Berwyn, PA 600 West Swedesford Road 2.40 Residence Inn - Danvers, MA 51 Newbury Street 2.41 Homewood Suites - Midvale, UT 844 East Fort Union 2.42 Homewood Suites - Plano, TX 4705 Old Shepard Place 2.43 Homewood Suites - Atlanta, GA (Cumberland) 3200 Cobb Parkway 2.44 Residence Inn - Memphis, TN 6141 Old Poplar Pike 2.45 Residence Inn - Atlanta, GA (DeKalb) 1901 Savoy Drive 2.46 Homewood Suites - Norcross, GA 450 Technology Parkway 3 1 DDR Southeast Pool (3)(4) Various 3.01 Hilltop Plaza 3200-4200 Klose Way, 3401 Blume Drive 3.02 Largo Town Center 950 Largo Center Drive 3.03 Midway Plaza 5725 North University Drive 3.04 Riverstone Plaza 1351-1455 Riverstone Parkway 3.05 Highland Grove 10451 Indianapolis Boulevard 3.06 Riverdale Shops 935 Riverdale Street 3.07 Skyview Plaza 7801 South Orange Blossom Trail 3.08 Apple Blossom Corners 2190 South Pleasant Valley Road 3.09 Fayetteville Pavilion 2047 - 2071 Skibo Road 3.10 Creekwood Crossing 7327 52nd Place East 3.11 Flamingo Falls 2000 Flamingo Road 3.12 Harundale Plaza 7740 Ritchie Highway 3.13 Meadowmont Village Center 603 Meadowmont Village Drive 3.14 Springfield Commons Airport Highway South Holland Sylvania Road 3.15 Northlake Commons 3804-3980 Northlake Boulevard 3.16 Village Square at Golf 4707-4793 North Congress Avenue 3.17 Oviedo Park Crossing 1115 Vidina Place 3.18 Shoppes of Golden Acres 9840 Little Road 3.19 Bardmoor Shopping Center 10801 Starkey Road 3.20 Rosedale Shopping Center 9943 Gilead Road 3.21 Casselberry Commons 1455 South Semoran Boulevard 3.22 Shoppes at New Tampa 1950 Bruce B. Downs Boulevard 3.23 Crossroads Plaza Route 38 3.24 Plaza Del Paraiso 127th Avenue and 120th Street 3.25 North Pointe Plaza 15001 North Dale Mabry Highway 3.26 Melbourne Shopping Center 1301 - 1441 South Babcock Street 3.27 Market Square (DDR) 9559 Highway 5 3.28 Shoppes of Lithia 3245 Lithia-Pinecrest Road 3.29 West Oaks Towne Center 9557 West Colonial Drive 3.30 Sharon Greens 1595 Peachtree Parkway 3.31 Lakewood Ranch 1715-1795 Lakewood Ranch Boulevard 3.32 Cofer Crossing 4349-4357 Lawrenceville Highway 3.33 Clayton Corners 11721 U.S. Highway 17 West 3.34 Clearwater Crossing 7380 Spout Springs Road 3.35 Shops at Paradise Pointe 247 Miracle Strip Parkway 3.36 Killearn Center 3483 Thomasville Road 3.37 Conway Plaza 4400 Curry Ford Road 3.38 River Run Shopping Center 9981 Miramar Parkway 3.39 Aberdeen Square 4966 Le Chalet Boulevard 3.40 Derby Square 2165-2233 Stringtown Road 3.41 Chickasaw Trails Shopping Center 2160 Chickasaw Trail 3.42 Shoppes at Lake Dow 920 Highway 91 East 3.43 Shoppes of Ellenwood 2828-2844 East Atlanta Road 3.44 Shops at Oliver's Crossing 5034 Peters Creek Parkway 3.45 Southwood Village Shopping Center 3551 Blair Stone Road 3.46 Paraiso Plaza 3301 West 80th Street 3.47 Sheridan Sqaure 401 East Sheridan Street 3.48 Countryside Shopping Center 4025 Santa Barbara Boulevard 3.49 Shoppes of Citrus Hills 2699 North Forest Ridge Boulevard 3.50 Crystal Springs Shopping Center 6738-6784 West Gulf to Lake Highway 3.51 Sexton Commons 1416 North Main Street 3.52 Hairston Crossing 2071-2079 South Hairston Road 4 1 Two Herald Square 1328 Broadway 5 1 Westin Casuarina Resort & Spa - Cayman Islands 30620 Seven Mile Beach 6 1 DDR-TRT Pool Various 6.01 Centerton Square I-295 and Route NJ 38 6.02 Beaver Creek Commons 1045 Beaver Creek Commons Drive 6.03 Mount Nebo Pointe 228 Mount Nebo Road 7 1 Ashford Hospitality Pool 4 Various 7.01 Spring Hill Suites - Orlando, FL 8601 Vineland Avenue 7.02 Courtyard - Orlando, FL 8623 Vineland Avenue 7.03 Residence Inn - Atlanta, GA 2220 Lake Boulevard 7.04 Fairfield Inn - Orlando, FL 8615 Vineland Avenue 7.05 Courtyard by Marriott - Edison, NJ 3105 Woodbridge Avenue 8 1 17 Battery Place South 17 Battery Place South 9 1 Rockvale Square 35 South Willowdale Drive 10 1 Centerside II 3131 Camino del Rio North 11 1 Citadel Mall 2070 Sam Rittenburg Boulevard 12 1 Port Chester Shopping Center 421-575 Boston Post Road - U.S. Route 1 13 1 60 Madison Avenue 60 Madison Avenue 14 1 3600 Wilshire Boulevard 3600 Wilshire Boulevard 15 1 La Jolla Centre I 4660 La Jolla Village Drive 16 1 450-460 Park Avenue South 450-460 Park Avenue South 17 1 Stadium Crossings 2125 East Katella Avenue 18 1 La Jolla Centre II 9255 Towne Centre Drive 19 1 Roosevelt Square 4535 Roosevelt Boulevard 20 1 Marriott - Mobile, AL 3101 Airport Boulevard 21 2 Little Rock Pool Various 21.01 Chenal Lakes Apartments 13500 Chenal Parkway 21.02 Brightwaters Apartments 2420 Riverfront Drive 22 1 Jamison Valley Holdings Pool Various 22.01 Sherman Oaks Atrium 15315 Magnolia Boulevard 22.02 West Hills Plaza 20700 Ventura Boulevard 23 1 Portofino Inn & Suites - Anaheim, CA 1831 South Harbor Boulevard 24 1 Barrington Business Center 1 Commerce Drive 25 2 Mountain Shadow Apartments 695 East Patriot Boulevard 26 1 Courtyard by Marriott - Philadelphia, PA 21 North Juniper Street 27 2 Town Center Apartments 2727 Bens Branch Drive 28 2 The Gates at Citiplace Apartments 2500 Gates Circle 29 Reserved(5) 30 2 Environs Residential Rental Community 3323 West 96th Circle 31 2 Summit Trails Apartments 1350 Grand Summit Drive 32 1 Wellington Market Place 13833-13897 Wellington Trace 33 1 Sheraton West - Richmond, VA 6624 West Broad Street 34 1 Franklin Square III 3648-3740 East Franklin Boulevard 35 1 Siena Office Park (6) 2850 West Horizon Ridge Parkway & 861 Coronado Center Drive 36 1 Columbus Park Crossing Shopping Center 5550 Whittlesey Boulevard 37 1 Vestal Park 4700 Vestal Parkway 38 2 Amber Place 6080 Lakeview Road 39 1 Wyndham - Atlanta, GA 125 10th Street NE 40 1 141 5th Avenue 141 5th Avenue 41 1 Marietta Trade Center 200 Cobb Parkway 42 1 Majestic Square 211 King Street 43 1 138 Spring Street 138 Spring Street 44 1 72 Madison Avenue 72 Madison Avenue 45 2 The Centre Apartments 5200 Croyden Avenue 46 1 Pompano Plaza 1401-1405 South Federal Highway; 947-951 SE 15th Street 47 1 Wildwood North Shopping Center 146 Wildwood Parkway 48 1 Federal Law Center 101 South Edgeworth Street 49 2 Estancia Apartments 1720 East D Street 50 1 Colonial Promenade Bear Lake 3010-3060 East Semoran Boulevard 51 1 Mercury Computer 199 & 201 Riverneck Road 52 2 Villa del Oso 4217 Louisiana Boulevard NE 53 1 Mount Pleasant Square 1440 Ben Sawyer Boulevard 54 1 65 West 36th Street 65 West 36th Street 55 1 Lazy Days Marina 6700 Holiday Road 56 1 Athens West 3190 Atlanta Highway 57 1 Peachtree Medical Office Pool Various 57.01 Yorktown Medical Center 101 Yorktown Drive 57.02 Shakerag Medical Center 4000 Shakerag Hill 58 1 BPRE Pool Various 58.01 11820 Pierce Street 11820 Pierce Street 58.02 8131 East Indian Bend Road 8131 East Indian Bend Road 58.03 8111 East Indian Bend Road 8111 East Indian Bend Road 58.04 8115 East Indian Bend Road 8115 East Indian Bend Road 58.05 7328 East Stetson Drive 7328 East Stetson Drive 59 2 Porto Bella 10853 Firestone Boulevard 60 1 Shoppes at Woodhill 6090 Garners Ferry Road 61 2 Le Coeur du Monde Apartments 2035 Clermont Crossing Drive 62 1 Barrington Terrace 1425 South Congress Avenue 63 1 Sunset Commons 925 Seaside Road SW 64 1 XSport Fitness - Downers Grove, IL 3200 Finley Road 65 1 Topsham Crossing Center 129-131 Topsham Fair Mall Road 66 2 Chartwell Court Apartments 15100 Ella Boulevard 67 1 Cupertino Town Center 20380,20370,20410 Town Center Lane 68 1 One Front Street 251 East Front Street 69 2 Pine Winds Apartments 1301 Pine Winds Drive 70 2 The Arbors at Port Warwick 1100 William Styron Square South 71 1 Michael's Warehouse & Distribution Facility 9200 West Beaver Street 72 1 Parmer-McNeil Plaza Shopping Center 6201-6315 North Parmer Lane 73 1 159-181 Second Avenue 159-181 Second Avenue 74 1 Midtown Square(7) 112-116 10th Street 75 2 Vista Montana 8000 Montgomery Boulevard NE 76 1 1500 West Park Drive 1500 West Park Drive 77 2 Colony Grove Apartments 1145 West Baseline Road 78 1 Glenwood Plaza 3605 Glenwood Avenue 79 1 Mayfaire Towne Center 1060 International Drive 80 2 Deerwood Crossing Apartments 1710 Franciscan Terrace 81 1 English Village 2812 Spring Avenue 82 1 The Village at Heather Ridge Pool Various 82.01 Heather Ridge Bank Building 6100 South Old Village Place 82.02 Heather Ridge Office Building 6300 South Old Village Place 83 2 Sunnygate Village Apartments 10120 Woodbury Drive 84 1 Coddle Creek Shopping Center 358 George Liles Parkway 85 1 Commons V Medical Office 800 Goodlette Road 86 1 Plaza 57 7301 SW 57th Court 87 1 8300 East Raintree Drive 8300 East Raintree Drive 88 1 Bella Piazza 40230 & 40250 Murrieta Hot Springs Road 89 1 17000 Ventura Boulevard 17000 Ventura Boulevard 90 1 Willimantic Plaza 1601 West Main Street 91 2 Imperial Towers Apartments 3801 Conshohocken Avenue 92 1 Cardiff Plaza Shopping Center 6701 Black Horse Pike 93 1 Medical Office Building 50 Sewall Street 94 1 Bath Shopping Center 1-5 Chandler Road (US Route 1) 95 2 7400 Apartments 7400 Roosevelt Boulevard 96 2 Dutch Village Apartments 1500 Zuider Zee Drive 97 1 Hampton Inn - Bennington, VT 51 Hannaford Square 98 1 Lantern Bend Medical 411 Lantern Bend Drive 99 2 Fountain Park Apartments 12525 South Kirkwood Road 100 1 Bunge North America 6700 Snowden Road 101 1 Shoppes at Pennington 21 Route 31 North 102 1 Columbia Summit 731 North Columbia Center Boulevard 103 1 Galleria Shopping Center 100 Route 9 North 104 1 Sunset Ridge Center 7020, 7040 & 7060 West Sunset Road 105 1 Barchester Pool (8) Various 105.01 Mansion House Center Ground Lease 300 North 4th Street 105.02 Pinewood Estates Apartments Ground Lease 1401 Pennsylvania Street, NE 105.03 Winrock Villas Condominiums Ground Lease 1601 Pennsylvania Street, NE 105.04 National City Bank Building Ground Lease 110 West Berry Street 105.05 Albuquerque Plaza Ground Lease 201 Third Streest N.W. 106 1 Shoppes at Indian Trail 14045 U.S. Highway 74 107 1 Summerlin Office Building 9500 Hillwood Drive 108 2 Village Square Apartments 100 Tonto Trail 109 1 The Timmons Place Office Building 3701 West Alabama Street 110 1 1331 Gemini Building 1331 Gemini Avenue 111 1 Village Pavilion 300 Village Green Circle 112 2 The Apartments at 1515 West Morse Avenue 1515 West Morse Avenue 113 2 5724-32 South Blackstone Avenue 5724-32 South Blackstone Avenue 114 2 Stanford Place II Apartments 37 Van Mark Way 115 1 Rockbridge Place 5723 Rockbridge Road 116 1 Schertz Retail Center 6000 & 6018 FM 3009 117 1 Holiday Inn Express - Heber City , UT 1268 South Main Street 118 1 Shops at East-West Connector 4425 South Cobb Drive 119 1 The Timmons Square Office Building 3637 West Alabama Street 120 2 Clearwater Estates III and IV 6887 and 6889 Clearwater Road 121 1 North Tucker Garage 310 North Tucker Boulevard 122 1 SilverLeaf Suites - Eagle, CO 315 Chambers Avenue 123 1 Warehouse Terminal - Manitowac, WI 1946 South 23rd Street 124 1 701 Interstate 20 East 701 Interstate 20 East 125 1 Ridge Road Shopping Center 1107-1125A Ridge Road 126 1 OfficeMax - Eden Prairie, MN 8595 Columbine Road 127 2 4717 North Winthrop Apartments 4717 North Winthrop Avenue 128 1 Pay Low - Gary, IN 6010 West Ridge Road 129 1 Wiseway 999 West Old Ridge Road 130 1 Walgreens - Ozark, MO 1675 West South Street 131 1 Warehouse Terminal - Menominee, MI 5311 & 5611 13th Street 132 1 Raintree Building 8150 East Raintree Road 133 1 Tractor Supply - Rutland, VT 1177 US Route 7 South 134 1 Tractor Supply - Watertown, WI 1911 Market Way 135 1 Archives One - Malvern, PA 6 Lee Boulevard 136 1 Village Square 4025 9th Avenue South 137 1 Baseline Industrial Buildings 416-418 East Baseline Road 138 1 Ocean Rose Inn - Narragansett, RI 113 Ocean Road 139 1 Archives One - Greensboro, NC 2729 Patterson Street 140 1 IHOP - Pearland, TX 2829 East Broadway Street 141 1 National Tire & Battery at Greens Landing 11017 North Freeway 142 1 Archives One - Essex Junction, VT 3 Bushey Lane 143 1 Comerica Bank at Preston Center 6033 Berkshire Lane MORTGAGE LOAN CROSS COLLATERALIZED AND CROSS LOAN NUMBER CITY STATE ZIP CODE DEFAULTED LOAN FLAG PURPOSE - ------------------------------------------------------------------------------------------------------------------------------ 1 Various Various Various Acquisition 1.01 Washington DC 20004 1.02 Arlington VA 22202 1.03 Seattle WA 98104 1.04 Washington DC 20036 1.05 Mc Lean VA 22102 1.06 Bellevue WA 98004 1.07 Bellevue WA 98005 1.08 Bellevue WA 98004 1.09 Bellevue WA 98004 1.10 Arlington VA 22209 1.11 Vienna VA 22182 1.12 Bellevue WA 98007 1.13 Washington DC 20004 1.14 Bellevue WA 98007 1.15 Reston VA 20190 1.16 Washington DC 20006 1.17 Bellevue WA 98004 1.18 Reston VA 20190 1.19 Arlington VA 22209 1.20 Seattle WA 98101 2 Various Various Various Acquisition 2.01 La Jolla CA 92037 2.02 Redmond WA 98052 2.03 Long Beach CA 90815 2.04 Costa Mesa CA 92626 2.05 Arcadia CA 91006 2.06 Irvine CA 92618 2.07 Herndon VA 20171 2.08 Pleasant Hill CA 94523 2.09 San Ramon CA 94583 2.10 Linthicum MD 21090 2.11 Saint Louis MO 63117 2.12 Bakersfield CA 93309 2.13 Boulder CO 80301 2.14 Hapeville GA 30354 2.15 Deerfield IL 60015 2.16 Malvern PA 19355 2.17 Houston TX 77058 2.18 Santa Fe NM 87505 2.19 Placentia CA 92870 2.20 Glen Allen VA 23060 2.21 Atlanta GA 30305 2.22 Beaverton OR 97006 2.23 Cincinnati OH 45246 2.24 Lombard IL 60148 2.25 Jacksonville FL 32256 2.26 Irving TX 75093 2.27 Irving TX 75038 2.28 Clearwater FL 33762 2.29 Boca Raton FL 33487 2.30 Clearwater FL 33760 2.31 Birmingham AL 35242 2.32 Smyrna GA 30080 2.33 Addison TX 75001 2.34 Chesterfield MO 63017 2.35 Montgomery AL 36117 2.36 Atlanta GA 30305 2.37 Chesterfield MO 63017 2.38 Blue Ash OH 45241 2.39 Berwyn PA 19312 2.40 Danvers MA 01923 2.41 Midvale UT 84047 2.42 Plano TX 75093 2.43 Atlanta GA 30339 2.44 Memphis TN 38119 2.45 Atlanta GA 30341 2.46 Norcross GA 30092 3 Various Various Various Acquisition 3.01 Richmond CA 94806 3.02 Largo MD 20774 3.03 Tamarac FL 33321 3.04 Canton GA 30114 3.05 Highland IN 46322 3.06 West Springfield MA 01089 3.07 Orlando FL 32809 3.08 Winchester VA 22601 3.09 Fayetteville NC 28314 3.10 Bradenton FL 34203 3.11 Pembroke Pines FL 33028 3.12 Glen Burnie MD 21061 3.13 Chapel Hill NC 27517 3.14 Toledo OH 43528 3.15 Palm Beach Gardens FL 33403 3.16 Boynton Beach FL 33437 3.17 Oviedo FL 32756 3.18 New Port Richey FL 34654 3.19 Largo FL 33777 3.20 Huntersville NC 28078 3.21 Casselberry FL 32707 3.22 Wesley Chapel FL 33543 3.23 Lumberton NJ 08048 3.24 Miami FL 33186 3.25 Tampa FL 33618 3.26 Melbourne FL 32901 3.27 Douglasville GA 30135 3.28 Valrico FL 33594 3.29 Ocoee FL 34761 3.30 Cumming GA 30041 3.31 Bradenton FL 34211 3.32 Tucker GA 30084 3.33 Clayton NC 27520 3.34 Flowery Branch GA 30542 3.35 Fort Walton Beach FL 32548 3.36 Tallahassee FL 32309 3.37 Orlando FL 32812 3.38 Miramar FL 33025 3.39 Boynton Beach FL 33436 3.40 Grove City OH 43123 3.41 Orlando FL 32825 3.42 McDonough GA 30252 3.43 Ellenwood GA 30294 3.44 Winston Salem NC 27127 3.45 Tallahassee FL 32311 3.46 Hialeah FL 33018 3.47 Dania FL 33004 3.48 Naples FL 34104 3.49 Hernando FL 34442 3.50 Crystal River FL 34429 3.51 Fuquay Varina NC 27526 3.52 Decatur GA 30035 4 New York NY 10001 Acquisition 5 George Town Cayman Islands NA Refinance 6 Various Various Various Acquisition 6.01 Mount Laurel NJ 08054 6.02 Apex NC 27502 6.03 Ohio Township PA 15237 7 Various Various Various Acquisition 7.01 Orlando FL 32821 7.02 Orlando FL 32821 7.03 Atlanta GA 30319 7.04 Orlando FL 32821 7.05 Edison NJ 08837 8 New York NY 10004 Refinance 9 Lancaster PA 17602 Refinance 10 San Diego CA 92108 Acquisition 11 Charleston SC 29407 Refinance 12 Port Chester NY 10573 Refinance 13 New York NY 10010 Refinance 14 Los Angeles CA 90010 Refinance 15 San Diego CA 92122 Acquisition 16 New York NY 10016 Refinance 17 Anaheim CA 92806 Acquisition 18 San Diego CA 92121 Acquisition 19 Jacksonville FL 32210 Refinance 20 Mobile AL 36606 Refinance 21 Little Rock AR Various Acquisition 21.01 Little Rock AR 72211 21.02 Little Rock AR 72202 22 Various CA Various Refinance 22.01 Sherman Oaks CA 91403 22.02 Woodland Hills CA 91364 23 Anaheim CA 92802 Refinance 24 Barrington NJ 08007 Acquisition 25 Reno NV 89511 Acquisition 26 Philadelphia PA 19107 Acquisition 27 Kingwood TX 77339 Acquisition 28 Baton Rouge LA 70809 Acquisition 29 30 Westminster CO 80031 Acquisition 31 Reno NV 89523 Acquisition 32 Wellington FL 33414 Refinance 33 Richmond VA 23230 Refinance 34 Gastonia NC 28054 Acquisition 35 Henderson NV 89052 Acquisition 36 Columbus GA 31909 Refinance 37 Vestal NY 13850 Refinance 38 Warner Robins GA 31088 Refinance 39 Atlanta GA 30309 Refinance 40 New York NY 10010 Refinance 41 Marietta GA 30060 Acquisition 42 Charleston SC 29401 Refinance 43 New York NY 10012 Refinance 44 New York NY 10016 Refinance 45 Kalamazoo MI 49009 Refinance 46 Pompano Beach FL 33062 Refinance 47 Birmingham AL 35209 Refinance 48 Greensboro NC 27401 Acquisition 49 Ontario CA 91764 Acquisition 50 Apopka FL 32703 Acquisition 51 Chelmsford MA 01824 Acquisition 52 Albuquerque NM 87109 Albuquerque Multifamily Portfolio Acquisition 53 Mount Pleasant SC 29464 Refinance 54 New York NY 10018 Refinance 55 Buford GA 30518 Acquisition 56 Athens GA 30606 Refinance 57 Various GA Various Acquisition 57.01 Fayetteville GA 30214 57.02 Peachtree City GA 30269 58 Various Various Various Refinance 58.01 Riverside CA 92505 58.02 Scottsdale AZ 85250 58.03 Scottsdale AZ 85250 58.04 Scottsdale AZ 85250 58.05 Scottsdale AZ 85251 59 Norwalk CA 90650 Refinance 60 Columbia SC 29209 Acquisition 61 Saint Louis MO 63146 Acquisition 62 Boynton Beach FL 33426 Acquisition 63 Ocean Isle Beach NC 28469 Refinance 64 Downers Grove IL 60515 Refinance 65 Topsham ME 04086 Acquisition 66 Houston TX 77090 Acquisition 67 Cupertino CA 95014 Refinance 68 Boise ID 83702 Acquisition 69 Garner NC 27603 Refinance 70 Newport News VA 23606 Refinance 71 Jacksonville FL 32220 Refinance 72 Austin TX 78729 Acquisition 73 San Mateo CA 94401 Refinance 74 Atlanta GA 30309 Refinance 75 Albuquerque NM 87109 Albuquerque Multifamily Portfolio Acquisition 76 Westborough MA 01581 Refinance 77 Tempe AZ 85283 Acquisition 78 Raleigh NC 27612 Acquisition 79 Wilmington NC 28405 Refinance 80 Winston-Salem NC 27127 Refinance 81 Decatur AL 35603 Refinance 82 Sioux Falls SD 57108 Refinance 82.01 Sioux Falls SD 57108 82.02 Sioux Falls SD 57108 83 Manassas VA 20109 Acquisition 84 Concord NC 28027 Refinance 85 Naples FL 34102 Acquisition 86 Miami FL 33143 Refinance 87 Scottsdale AZ 85254 Refinance 88 Murrieta CA 92563 Refinance 89 Los Angeles CA 91316 Refinance 90 Willimantic CT 06226 Acquisition 91 Philadelphia PA 19131 Refinance 92 Egg Harbor NJ 08234 Refinance 93 Portland ME 04101 Refinance 94 Bath ME 04530 Acquisition 95 Philadelphia PA 19152 Refinance 96 Winston-Salem NC 27127 Refinance 97 Bennington VT 05201 Refinance 98 Houston TX 77090 Acquisition 99 Stafford TX 77477 Refinance 100 Fort Worth TX 76140 Acquisition 101 Pennington NJ 08534 Refinance 102 Kennewick WA 99336 Acquisition 103 Manalapan NJ 07726 Refinance 104 Las Vegas NV 89113 Refinance 105 Various Various Various Refinance 105.01 Saint Louis MO 63102 105.02 Albuquerque NM 87110 105.03 Albuquerque NM 87110 105.04 Fort Wayne IN 46802 105.05 Albuquerque NM 87102 106 Indian Trail NC 28079 Refinance 107 Las Vegas NV 89134 Refinance 108 Lafayette IN 47905 Acquisition 109 Houston TX 77027 Acquisition 110 Houston TX 77058 Acquisition 111 Smyrna GA 30080 Refinance 112 Chicago IL 60626 Refinance 113 Chicago IL 60637 Refinance 114 Saint Louis MO 63144 Refinance 115 Stone Mountain GA 30087 Acquisition 116 Schertz TX 78154 Refinance 117 Heber City UT 84032 Acquisition 118 Smyrna GA 30080 Refinance 119 Houston TX 77027 Acquisition 120 Baxter MN 56425 Refinance 121 Saint Louis MO 63101 Acquisition 122 Eagle CO 81613 Refinance 123 Manitowoc WI 54220 Warehouse Terminal Portfolio Refinance 124 Arlington TX 76014 Acquisition 125 Rockwall TX 75087 Refinance 126 Eden Prairie MN 55344 Refinance 127 Chicago IL 60640 Refinance 128 Gary IN 46408 Refinance 129 Hobart IN 46342 Refinance 130 Ozark MO 65721 Acquisition 131 Menominee MI 49858 Warehouse Terminal Portfolio Refinance 132 Scottsdale AZ 85260 Refinance 133 Rutland VT 05701 Acquisition 134 Watertown WI 53094 Acquisition 135 Malvern PA 19355 Archives One Portfolio Acquisition 136 Fargo ND 58103 Refinance 137 Mesa AZ 85204 Refinance 138 Narragansett RI 02882 Refinance 139 Greensboro NC 27407 Archives One Portfolio Acquisition 140 Pearland TX 77581 Refinance 141 Houston TX 77038 Acquisition 142 Essex Junction VT 05452 Archives One Portfolio Acquisition 143 Dallas TX 75225 Acquisition MORTGAGE LOAN MORTGAGE GENERAL SPECIFIC ORIGINAL LOAN CUT-OFF DATE LOAN NUMBER LOAN SELLER PROPERTY TYPE PROPERTY TYPE BALANCE ($) BALANCE ($) - ----------------------------------------------------------------------------------------------------------------------------------- 1 Wachovia Various Various 414,000,000 414,000,000 1.01 Office CBD 63,968,572 1.02 Office Suburban 50,666,978 1.03 Office CBD 47,643,889 1.04 Office CBD 43,060,885 1.05 Office Suburban 36,313,350 1.06 Office CBD 24,269,362 1.07 Office Suburban 22,552,247 1.08 Office CBD 22,389,000 1.09 Office CBD 18,356,199 1.10 Office Suburban 16,929,301 1.11 Office Suburban 12,817,899 1.12 Office Suburban 11,197,523 1.13 Office CBD 10,641,275 1.14 Office Suburban 10,338,966 1.15 Office Suburban 9,093,453 1.16 Office CBD 7,678,647 1.17 Office CBD 6,082,456 1.18 Mixed Use Office/Retail 1.19 Office Suburban 1.20 Office CBD 2 Wachovia Hospitality Extended Stay 283,850,000 283,850,000 2.01 Hospitality Extended Stay 28,759,000 2.02 Hospitality Extended Stay 17,819,000 2.03 Hospitality Extended Stay 15,324,000 2.04 Hospitality Extended Stay 13,578,000 2.05 Hospitality Extended Stay 11,760,500 2.06 Hospitality Extended Stay 10,620,000 2.07 Hospitality Extended Stay 10,156,500 2.08 Hospitality Extended Stay 9,337,000 2.09 Hospitality Extended Stay 7,982,500 2.10 Hospitality Extended Stay 7,662,000 2.11 Hospitality Extended Stay 6,842,500 2.12 Hospitality Extended Stay 6,272,000 2.13 Hospitality Extended Stay 6,022,500 2.14 Hospitality Extended Stay 5,951,500 2.15 Hospitality Extended Stay 5,951,500 2.16 Hospitality Extended Stay 5,916,000 2.17 Hospitality Extended Stay 5,630,500 2.18 Hospitality Extended Stay 5,559,500 2.19 Hospitality Extended Stay 5,452,500 2.20 Hospitality Extended Stay 5,132,000 2.21 Hospitality Extended Stay 5,096,000 2.22 Hospitality Extended Stay 4,918,000 2.23 Hospitality Extended Stay 4,739,500 2.24 Hospitality Extended Stay 4,561,500 2.25 Hospitality Extended Stay 4,526,000 2.26 Hospitality Extended Stay 4,419,000 2.27 Hospitality Extended Stay 4,383,500 2.28 Hospitality Extended Stay 4,383,500 2.29 Hospitality Extended Stay 4,027,000 2.30 Hospitality Extended Stay 3,920,000 2.31 Hospitality Extended Stay 3,813,000 2.32 Hospitality Extended Stay 3,670,500 2.33 Hospitality Extended Stay 3,528,000 2.34 Hospitality Extended Stay 3,385,500 2.35 Hospitality Extended Stay 3,350,000 2.36 Hospitality Extended Stay 3,314,500 2.37 Hospitality Extended Stay 3,029,000 2.38 Hospitality Extended Stay 3,029,000 2.39 Hospitality Extended Stay 2,993,500 2.40 Hospitality Extended Stay 2,922,000 2.41 Hospitality Extended Stay 2,886,500 2.42 Hospitality Extended Stay 2,744,000 2.43 Hospitality Extended Stay 2,530,000 2.44 Hospitality Extended Stay 2,245,000 2.45 Hospitality Extended Stay 2,067,000 2.46 Hospitality Extended Stay 1,639,500 3 Wachovia Retail Anchored 221,250,000 221,250,000 3.01 Retail Anchored 9,527,500 3.02 Retail Anchored 9,067,500 3.03 Retail Anchored 8,652,500 3.04 Retail Anchored 8,495,000 3.05 Retail Anchored 8,382,500 3.06 Retail Anchored 8,082,500 3.07 Retail Anchored 7,382,500 3.08 Retail Anchored 7,305,000 3.09 Retail Anchored 7,000,000 3.10 Retail Anchored 6,667,500 3.11 Retail Anchored 6,272,500 3.12 Retail Anchored 6,177,500 3.13 Retail Anchored 6,132,500 3.14 Retail Anchored 6,017,500 3.15 Retail Anchored 5,275,000 3.16 Retail Anchored 4,937,500 3.17 Retail Anchored 4,922,500 3.18 Retail Anchored 4,787,500 3.19 Retail Anchored 4,762,500 3.20 Retail Anchored 4,382,500 3.21 Retail Anchored 4,325,000 3.22 Retail Anchored 4,200,000 3.23 Retail Anchored 3,762,500 3.24 Retail Anchored 3,360,000 3.25 Retail Anchored 3,335,000 3.26 Retail Anchored 3,335,000 3.27 Retail Anchored 3,175,000 3.28 Retail Anchored 3,150,000 3.29 Retail Anchored 3,095,000 3.30 Retail Anchored 3,017,500 3.31 Retail Anchored 3,000,000 3.32 Retail Anchored 2,985,000 3.33 Retail Anchored 2,937,500 3.34 Retail Anchored 2,875,000 3.35 Retail Anchored 2,765,000 3.36 Retail Anchored 2,762,500 3.37 Retail Anchored 2,700,000 3.38 Retail Anchored 2,652,500 3.39 Retail Anchored 2,540,000 3.40 Retail Anchored 2,477,500 3.41 Retail Anchored 2,477,500 3.42 Retail Anchored 2,342,500 3.43 Retail Anchored 2,230,000 3.44 Retail Anchored 2,142,500 3.45 Retail Anchored 2,127,500 3.46 Retail Anchored 2,117,500 3.47 Retail Anchored 2,062,500 3.48 Retail Anchored 1,905,000 3.49 Retail Anchored 1,905,000 3.50 Retail Anchored 1,872,500 3.51 Retail Anchored 1,785,000 3.52 Retail Anchored 1,602,500 4 Wachovia Mixed Use Office/Retail 200,000,000 200,000,000 5 Wachovia Hospitality Full Service 140,000,000 140,000,000 6 Wachovia Retail Anchored 110,000,000 110,000,000 6.01 Retail Anchored 67,800,000 6.02 Retail Anchored 26,200,000 6.03 Retail Anchored 16,000,000 7 Wachovia Hospitality Various 103,906,000 103,906,000 7.01 Hospitality Limited Service 30,213,037 7.02 Hospitality Limited Service 29,189,965 7.03 Hospitality Extended Stay 15,932,504 7.04 Hospitality Limited Service 15,930,493 7.05 Hospitality Limited Service 12,640,000 8 Wachovia Office CBD 95,000,000 95,000,000 9 Wachovia Retail Outlet 92,400,000 92,400,000 10 Wachovia Office Suburban 89,300,000 89,300,000 11 Wachovia Retail Anchored 75,200,000 75,040,500 12 Wachovia Retail Anchored 70,000,000 70,000,000 13 Wachovia Office CBD 66,500,000 66,500,000 14 Wachovia Office CBD 64,000,000 64,000,000 15 Wachovia Office Suburban 60,000,000 60,000,000 16 Wachovia Office CBD 54,000,000 54,000,000 17 Wachovia Mixed Use Office/Retail 47,000,000 47,000,000 18 Wachovia Office Suburban 46,000,000 46,000,000 19 Wachovia Retail Anchored 46,000,000 46,000,000 20 Wachovia Hospitality Full Service 44,000,000 44,000,000 21 Wachovia Multifamily Conventional 40,000,000 40,000,000 21.01 Multifamily Conventional 21.02 Multifamily Conventional 22 Wachovia Office Suburban 38,000,000 38,000,000 22.01 Office Suburban 22.02 Office Suburban 23 Wachovia Hospitality Limited Service 36,750,000 36,750,000 24 Wachovia Industrial Flex 36,100,000 36,100,000 25 Wachovia Multifamily Conventional 35,572,500 35,572,500 26 Wachovia Hospitality Full Service 35,000,000 35,000,000 27 Wachovia Multifamily Conventional 34,000,000 34,000,000 28 Wachovia Multifamily Conventional 33,700,000 33,700,000 29 30 Wachovia Multifamily Single Family/Conventional/Townhomes 31,000,000 31,000,000 31 Wachovia Multifamily Conventional 30,175,000 30,175,000 32 Wachovia Retail Anchored 30,000,000 30,000,000 33 Wachovia Hospitality Full Service 29,500,000 29,500,000 34 Wachovia Retail Anchored 29,400,000 29,400,000 35 Wachovia Office Suburban 28,620,000 28,620,000 36 Wachovia Retail Anchored 28,000,000 28,000,000 37 Wachovia Mixed Use Student Housing/Retail/Office 27,000,000 27,000,000 38 Wachovia Multifamily Conventional 26,000,000 26,000,000 39 Wachovia Hospitality Full Service 26,000,000 26,000,000 40 Wachovia Retail Single Tenant 25,000,000 25,000,000 41 Wachovia Retail Anchored 25,000,000 25,000,000 42 Wachovia Mixed Use Retail/Office 23,850,000 23,850,000 43 Wachovia Mixed Use Office/Retail 23,500,000 23,500,000 44 Wachovia Office CBD 22,000,000 22,000,000 45 Wachovia Multifamily Student Housing 19,875,000 19,875,000 46 Wachovia Retail Anchored 18,850,000 18,850,000 47 Wachovia Retail Anchored 18,700,000 18,700,000 48 Wachovia Office Suburban 17,800,000 17,800,000 49 Wachovia Multifamily Conventional 17,650,000 17,650,000 50 Wachovia Retail Anchored 16,720,000 16,720,000 51 Wachovia Office Suburban 16,200,000 16,200,000 52 Wachovia Multifamily Conventional 16,180,000 16,180,000 53 Wachovia Retail Anchored 15,500,000 15,500,000 54 Wachovia Office CBD 14,750,000 14,750,000 55 Wachovia Special Purpose Marina Park 14,000,000 14,000,000 56 Wachovia Retail Anchored 13,760,000 13,760,000 57 Wachovia Office Medical 13,530,000 13,530,000 57.01 Office Medical 57.02 Office Medical 58 Wachovia Office Suburban 13,200,000 13,200,000 58.01 Office Suburban 4,160,000 58.02 Office Suburban 2,720,000 58.03 Office Suburban 2,720,000 58.04 Office Suburban 1,840,000 58.05 Office Suburban 1,760,000 59 Wachovia Multifamily Conventional 13,200,000 13,200,000 60 Wachovia Retail Shadow Anchored 13,100,000 13,100,000 61 Wachovia Multifamily Conventional 13,056,000 13,056,000 62 Wachovia Healthcare Assisted Living 13,000,000 13,000,000 63 Wachovia Retail Anchored 13,000,000 12,988,766 64 Wachovia Retail Single Tenant 13,000,000 12,936,479 65 Wachovia Retail Anchored 12,720,000 12,720,000 66 Wachovia Multifamily Conventional 12,450,000 12,450,000 67 Wachovia Office Suburban 12,400,000 12,400,000 68 Wachovia Office CBD 11,800,000 11,800,000 69 Wachovia Multifamily Conventional 11,600,000 11,600,000 70 Wachovia Multifamily Independent Living 11,300,000 11,278,294 71 Wachovia Industrial Warehouse/Distribution 11,200,000 11,200,000 72 Wachovia Retail Unanchored 11,050,000 11,050,000 73 Wachovia Office CBD 11,000,000 11,000,000 74 Wachovia Mixed Use Retail/Parking Garage/Industrial 11,000,000 11,000,000 75 Wachovia Multifamily Conventional 10,820,000 10,820,000 76 Wachovia Office Suburban 10,800,000 10,800,000 77 Wachovia Multifamily Conventional 10,700,000 10,700,000 78 Wachovia Office Suburban 10,550,000 10,550,000 79 Wachovia Retail Anchored 10,500,000 10,490,379 80 Wachovia Multifamily Conventional 10,400,000 10,400,000 81 Wachovia Retail Anchored 10,400,000 10,400,000 82 Artesia Office Suburban 10,400,000 10,400,000 82.01 Office Suburban 82.02 Office Suburban 83 Artesia Multifamily Conventional 10,250,000 10,250,000 84 Wachovia Retail Anchored 10,050,000 10,050,000 85 Wachovia Office Medical 10,000,000 10,000,000 86 Wachovia Mixed Use Retail/Office 9,250,000 9,250,000 87 Wachovia Mixed Use Office/Warehouse 9,200,000 9,200,000 88 Artesia Retail Unanchored 9,000,000 9,000,000 89 Wachovia Mixed Use Office/Retail 8,800,000 8,800,000 90 Wachovia Retail Anchored 8,800,000 8,800,000 91 Wachovia Multifamily Conventional 8,080,000 8,080,000 92 Wachovia Retail Unanchored 8,000,000 8,000,000 93 Wachovia Office Medical 8,000,000 8,000,000 94 Wachovia Retail Anchored 7,920,000 7,920,000 95 Wachovia Multifamily Conventional 7,400,000 7,400,000 96 Wachovia Multifamily Conventional 7,100,000 7,100,000 97 Wachovia Hospitality Limited Service 7,000,000 6,994,335 98 Artesia Office Medical 6,728,000 6,728,000 99 Artesia Multifamily Conventional 6,700,000 6,700,000 100 Wachovia Industrial Warehouse/Distribution 6,262,000 6,262,000 101 Wachovia Mixed Use Retail/Office 6,100,000 6,100,000 102 Artesia Retail Anchored 6,000,000 6,000,000 103 Wachovia Retail Unanchored 6,000,000 6,000,000 104 Artesia Retail Unanchored 6,000,000 6,000,000 105 Wachovia Land Various 5,900,000 5,900,000 105.01 Land Mixed Use 2,630,000 105.02 Land Multifamily 1,255,000 105.03 Land Multifamily 1,050,000 105.04 Land Office 815,000 105.05 Land Mixed Use 150,000 106 Wachovia Retail Shadow Anchored 5,650,000 5,650,000 107 Artesia Office Suburban 5,600,000 5,600,000 108 Wachovia Multifamily Conventional 5,560,000 5,560,000 109 Wachovia Office Suburban 5,350,000 5,350,000 110 Wachovia Office Suburban 5,250,000 5,250,000 111 Wachovia Retail Unanchored 5,000,000 5,000,000 112 Wachovia Multifamily Conventional 4,700,000 4,700,000 113 Wachovia Multifamily Conventional 4,600,000 4,600,000 114 Wachovia Multifamily Conventional 4,350,000 4,350,000 115 Wachovia Retail Anchored 4,300,000 4,300,000 116 Artesia Retail Shadow Anchored 4,250,000 4,250,000 117 Wachovia Hospitality Limited Service 4,200,000 4,200,000 118 Artesia Retail Unanchored 4,140,000 4,140,000 119 Wachovia Office Suburban 3,850,000 3,850,000 120 Artesia Multifamily Conventional 3,700,000 3,700,000 121 Wachovia Special Purpose Parking Garage/Retail 3,500,000 3,500,000 122 Wachovia Hospitality Extended Stay 3,500,000 3,500,000 123 Wachovia Industrial Warehouse 3,500,000 3,478,302 124 Wachovia Office Medical 3,412,500 3,412,500 125 Wachovia Retail Shadow Anchored 3,400,000 3,400,000 126 Wachovia Retail Single Tenant 3,200,000 3,197,148 127 Wachovia Multifamily Conventional 3,100,000 3,100,000 128 Wachovia Retail Single Tenant 2,750,000 2,747,709 129 Wachovia Retail Single Tenant 2,750,000 2,747,709 130 Wachovia Retail Single Tenant 2,399,000 2,399,000 131 Wachovia Industrial Warehouse 2,400,000 2,385,121 132 Artesia Industrial Warehouse 2,100,000 2,100,000 133 Wachovia Retail Single Tenant 2,095,000 2,095,000 134 Wachovia Retail Single Tenant 1,994,000 1,994,000 135 Wachovia Industrial Warehouse 1,860,000 1,856,544 136 Artesia Office Suburban 1,750,000 1,750,000 137 Artesia Industrial Flex 1,700,000 1,700,000 138 Wachovia Hospitality Limited Service 1,571,000 1,571,000 139 Wachovia Industrial Warehouse 1,120,000 1,117,872 140 Artesia Retail Single Tenant 1,100,000 1,100,000 141 Artesia Retail Single Tenant 1,100,000 1,100,000 142 Wachovia Industrial Warehouse 1,100,000 1,097,910 143 Artesia Retail Single Tenant 1,000,000 1,000,000 MORTGAGE % OF AGGREGATE % OF AGGREGATE % OF AGGREGATE MATURITY LOAN CUT-OFF DATE CUT-OFF DATE CUT-OFF DATE ORIGINATION DATE NUMBER BALANCE GROUP 1 BALANCE GROUP 2 BALANCE DATE FIRST PAY DATE OR ARD - ------------------------------------------------------------------------------------------------------------------------------------ 1 10.8% 12.2% 4/10/2007 6/7/2007 5/7/2012 1.01 1.02 1.03 1.04 1.05 1.06 1.07 1.08 1.09 1.10 1.11 1.12 1.13 1.14 1.15 1.16 1.17 1.18 1.19 1.20 2 7.4% 8.4% 5/23/2007 7/11/2007 6/11/2012 2.01 2.02 2.03 2.04 2.05 2.06 2.07 2.08 2.09 2.10 2.11 2.12 2.13 2.14 2.15 2.16 2.17 2.18 2.19 2.20 2.21 2.22 2.23 2.24 2.25 2.26 2.27 2.28 2.29 2.30 2.31 2.32 2.33 2.34 2.35 2.36 2.37 2.38 2.39 2.40 2.41 2.42 2.43 2.44 2.45 2.46 3 5.8% 6.5% 6/7/2007 8/5/2007 7/5/2017 3.01 3.02 3.03 3.04 3.05 3.06 3.07 3.08 3.09 3.10 3.11 3.12 3.13 3.14 3.15 3.16 3.17 3.18 3.19 3.20 3.21 3.22 3.23 3.24 3.25 3.26 3.27 3.28 3.29 3.30 3.31 3.32 3.33 3.34 3.35 3.36 3.37 3.38 3.39 3.40 3.41 3.42 3.43 3.44 3.45 3.46 3.47 3.48 3.49 3.50 3.51 3.52 4 5.2% 5.9% 4/9/2007 5/11/2007 4/11/2017 5 3.7% 4.1% 5/31/2007 7/11/2007 6/11/2017 6 2.9% 3.3% 5/11/2007 7/11/2007 6/11/2017 6.01 6.02 6.03 7 2.7% 3.1% 4/11/2007 5/11/2007 4/11/2017 7.01 7.02 7.03 7.04 7.05 8 2.5% 2.8% 4/24/2007 6/11/2007 5/11/2012 9 2.4% 2.7% 4/20/2007 6/11/2007 5/11/2017 10 2.3% 2.6% 3/29/2007 5/11/2007 10/11/2017 11 2.0% 2.2% 3/5/2007 5/1/2007 4/1/2017 12 1.8% 2.1% 5/23/2007 7/11/2007 6/11/2017 13 1.7% 2.0% 4/24/2007 6/11/2007 5/11/2017 14 1.7% 1.9% 5/16/2007 7/11/2007 6/11/2017 15 1.6% 1.8% 3/29/2007 5/11/2007 10/11/2017 16 1.4% 1.6% 4/24/2007 6/11/2007 5/11/2012 17 1.2% 1.4% 4/19/2007 6/11/2007 5/11/2017 18 1.2% 1.4% 3/29/2007 5/11/2007 10/11/2017 19 1.2% 1.4% 5/3/2007 6/11/2007 5/11/2017 20 1.2% 1.3% 5/8/2007 6/11/2007 5/11/2017 21 1.0% 9.0% 5/9/2007 6/11/2007 5/11/2017 21.01 21.02 22 1.0% 1.1% 5/3/2007 6/11/2007 5/11/2017 22.01 22.02 23 1.0% 1.1% 4/25/2007 6/11/2007 5/11/2017 24 0.9% 1.1% 3/29/2007 5/11/2007 4/11/2017 25 0.9% 8.0% 5/29/2007 7/11/2007 6/11/2012 26 0.9% 1.0% 4/11/2007 5/11/2007 4/11/2017 27 0.9% 7.7% 5/10/2007 6/11/2007 5/11/2017 28 0.9% 7.6% 5/7/2007 6/11/2007 5/11/2017 29 30 0.8% 7.0% 4/25/2007 6/11/2007 5/11/2017 31 0.8% 6.8% 5/25/2007 7/11/2007 6/11/2012 32 0.8% 0.9% 4/30/2007 6/11/2007 5/11/2017 33 0.8% 0.9% 4/3/2007 5/11/2007 4/11/2017 34 0.8% 0.9% 5/10/2007 6/11/2007 5/11/2017 35 0.7% 0.8% 6/4/2007 7/11/2007 6/11/2017 36 0.7% 0.8% 4/26/2007 6/1/2007 5/1/2017 37 0.7% 0.8% 4/3/2007 5/11/2007 4/11/2017 38 0.7% 5.9% 4/27/2007 6/11/2007 5/11/2017 39 0.7% 0.8% 5/4/2007 6/11/2007 5/11/2012 40 0.7% 0.7% 6/1/2007 7/11/2007 6/11/2017 41 0.7% 0.7% 5/10/2007 6/11/2007 5/11/2017 42 0.6% 0.7% 4/26/2007 6/11/2007 5/11/2017 43 0.6% 0.7% 5/15/2007 7/11/2007 6/11/2017 44 0.6% 0.7% 5/1/2007 6/11/2007 5/11/2012 45 0.5% 4.5% 2/28/2007 4/11/2007 3/11/2017 46 0.5% 0.6% 4/26/2007 6/11/2007 5/11/2017 47 0.5% 0.6% 4/16/2007 6/11/2007 5/11/2017 48 0.5% 0.5% 4/18/2007 6/11/2007 5/11/2017 49 0.5% 4.0% 4/30/2007 6/11/2007 5/11/2012 50 0.4% 0.5% 4/23/2007 6/11/2007 5/11/2017 51 0.4% 0.5% 4/20/2007 6/11/2007 5/11/2017 52 0.4% 3.7% 4/30/2007 6/11/2007 5/11/2012 53 0.4% 0.5% 6/11/2007 7/11/2007 6/11/2017 54 0.4% 0.4% 4/25/2007 6/11/2007 5/11/2014 55 0.4% 0.4% 4/4/2007 5/11/2007 4/11/2012 56 0.4% 0.4% 4/16/2007 6/11/2007 5/11/2017 57 0.4% 0.4% 5/1/2007 6/11/2007 5/11/2017 57.01 57.02 58 0.3% 0.4% 4/19/2007 6/11/2007 5/11/2017 58.01 58.02 58.03 58.04 58.05 59 0.3% 3.0% 4/30/2007 6/11/2007 5/11/2017 60 0.3% 0.4% 5/10/2007 6/11/2007 5/11/2017 61 0.3% 2.9% 4/24/2007 6/11/2007 5/11/2017 62 0.3% 0.4% 3/1/2007 4/11/2007 3/11/2012 63 0.3% 0.4% 5/10/2007 6/11/2007 5/11/2017 64 0.3% 0.4% 1/30/2007 3/11/2007 2/11/2017 65 0.3% 0.4% 5/16/2007 7/11/2007 6/11/2017 66 0.3% 2.8% 5/25/2007 7/11/2007 6/11/2017 67 0.3% 0.4% 3/8/2007 4/11/2007 3/11/2017 68 0.3% 0.3% 5/8/2007 6/11/2007 5/11/2017 69 0.3% 2.6% 3/29/2007 5/11/2007 4/11/2017 70 0.3% 2.5% 4/11/2007 5/11/2007 4/11/2017 71 0.3% 0.3% 5/8/2007 6/11/2007 5/11/2017 72 0.3% 0.3% 5/8/2007 6/11/2007 5/11/2017 73 0.3% 0.3% 5/18/2007 7/11/2007 6/11/2017 74 0.3% 0.3% 5/4/2007 6/11/2007 5/11/2017 75 0.3% 2.4% 4/30/2007 6/11/2007 5/11/2012 76 0.3% 0.3% 5/25/2007 7/11/2007 6/11/2017 77 0.3% 2.4% 5/18/2007 7/11/2007 6/11/2017 78 0.3% 0.3% 4/25/2007 6/11/2007 5/11/2012 79 0.3% 0.3% 5/11/2007 6/11/2007 5/11/2017 80 0.3% 2.3% 4/30/2007 6/11/2007 5/11/2017 81 0.3% 0.3% 4/12/2007 6/11/2007 5/11/2017 82 0.3% 0.3% 6/7/2007 7/11/2007 6/11/2017 82.01 82.02 83 0.3% 2.3% 6/1/2007 7/11/2007 6/11/2017 84 0.3% 0.3% 5/4/2007 6/11/2007 5/11/2017 85 0.3% 0.3% 5/14/2007 7/11/2007 6/11/2017 86 0.2% 0.3% 5/17/2007 7/11/2007 6/11/2017 87 0.2% 0.3% 5/4/2007 6/11/2007 5/11/2017 88 0.2% 0.3% 5/16/2007 7/11/2007 6/11/2017 89 0.2% 0.3% 5/3/2007 6/11/2007 5/11/2017 90 0.2% 0.3% 5/10/2007 6/11/2007 5/11/2017 91 0.2% 1.8% 4/30/2007 6/11/2007 5/11/2017 92 0.2% 0.2% 5/15/2007 7/11/2007 6/11/2017 93 0.2% 0.2% 5/10/2007 6/11/2007 5/11/2017 94 0.2% 0.2% 5/3/2007 6/11/2007 4/11/2017 95 0.2% 1.7% 4/30/2007 6/11/2007 5/11/2017 96 0.2% 1.6% 4/30/2007 6/11/2007 5/11/2017 97 0.2% 0.2% 4/20/2007 6/11/2007 5/11/2017 98 0.2% 0.2% 2/27/2007 4/11/2007 3/11/2017 99 0.2% 1.5% 5/22/2007 7/11/2007 6/11/2017 100 0.2% 0.2% 4/19/2007 6/11/2007 5/11/2017 101 0.2% 0.2% 4/24/2007 6/11/2007 5/11/2017 102 0.2% 0.2% 5/17/2007 7/11/2007 6/11/2017 103 0.2% 0.2% 5/15/2007 7/11/2007 6/11/2017 104 0.2% 0.2% 6/8/2007 7/11/2007 6/11/2017 105 0.2% 0.2% 5/1/2007 6/11/2007 5/11/2017 105.01 105.02 105.03 105.04 105.05 106 0.1% 0.2% 4/16/2007 6/11/2007 5/11/2017 107 0.1% 0.2% 6/7/2007 7/11/2007 6/11/2017 108 0.1% 1.3% 4/18/2007 6/11/2007 5/11/2017 109 0.1% 0.2% 4/13/2007 6/11/2007 5/11/2012 110 0.1% 0.2% 4/25/2007 6/11/2007 5/11/2017 111 0.1% 0.1% 4/13/2007 6/11/2007 5/11/2017 112 0.1% 1.1% 5/10/2007 6/11/2007 5/11/2017 113 0.1% 1.0% 5/3/2007 6/11/2007 5/11/2017 114 0.1% 1.0% 3/29/2007 5/11/2007 4/11/2017 115 0.1% 0.1% 11/7/2006 12/11/2006 11/11/2011 116 0.1% 0.1% 5/11/2007 7/11/2007 6/11/2017 117 0.1% 0.1% 3/30/2007 5/11/2007 4/11/2017 118 0.1% 0.1% 2/20/2007 4/11/2007 3/11/2017 119 0.1% 0.1% 4/13/2007 6/11/2007 5/11/2012 120 0.1% 0.8% 6/6/2007 7/11/2007 6/11/2017 121 0.1% 0.1% 4/27/2007 6/11/2007 5/11/2017 122 0.1% 0.1% 5/18/2007 7/11/2007 6/11/2017 123 0.1% 0.1% 2/23/2007 4/11/2007 3/11/2017 124 0.1% 0.1% 5/2/2007 6/11/2007 5/11/2017 125 0.1% 0.1% 5/15/2007 7/11/2007 6/11/2012 126 0.1% 0.1% 4/13/2007 6/11/2007 5/11/2017 127 0.1% 0.7% 5/15/2007 7/11/2007 6/11/2017 128 0.1% 0.1% 5/3/2007 6/11/2007 5/11/2017 129 0.1% 0.1% 5/3/2007 6/11/2007 5/11/2017 130 0.1% 0.1% 1/30/2007 3/11/2007 2/11/2017 131 0.1% 0.1% 2/23/2007 4/11/2007 3/11/2017 132 0.1% 0.1% 6/11/2007 8/11/2007 7/11/2017 133 0.1% 0.1% 2/7/2007 3/11/2007 2/11/2017 134 0.1% 0.1% 2/7/2007 3/11/2007 2/11/2017 135 0.0% 0.1% 3/13/2007 5/11/2007 4/11/2017 136 0.0% 0.1% 6/6/2007 7/11/2007 6/11/2017 137 0.0% 0.1% 6/11/2007 8/11/2007 7/11/2017 138 0.0% 0.0% 5/10/2007 6/11/2007 5/11/2017 139 0.0% 0.0% 3/13/2007 5/11/2007 4/11/2017 140 0.0% 0.0% 5/24/2007 7/11/2007 6/11/2017 141 0.0% 0.0% 5/9/2007 7/11/2007 6/11/2017 142 0.0% 0.0% 3/13/2007 5/11/2007 4/11/2017 143 0.0% 0.0% 5/8/2007 7/11/2007 6/11/2017 INTEREST ORIGINAL REMAINING MORTGAGE LOAN INTEREST ACCURAL TERM TO TERM TO LOAN ADMINISTRATIVE ACCRUAL METHOD MATURITY OR MATURITY OR NUMBER MORTGAGE RATE COST RATE METHOD DURING IO ARD (MOS.) ARD (MOS.) - ----------------------------------------------------------------------------------------------------------------------------------- 1 5.797% 0.02058% Actual/360 Actual/360 60 59 1.01 1.02 1.03 1.04 1.05 1.06 1.07 1.08 1.09 1.10 1.11 1.12 1.13 1.14 1.15 1.16 1.17 1.18 1.19 1.20 2 5.663% 0.02058% Actual/360 Actual/360 60 60 2.01 2.02 2.03 2.04 2.05 2.06 2.07 2.08 2.09 2.10 2.11 2.12 2.13 2.14 2.15 2.16 2.17 2.18 2.19 2.20 2.21 2.22 2.23 2.24 2.25 2.26 2.27 2.28 2.29 2.30 2.31 2.32 2.33 2.34 2.35 2.36 2.37 2.38 2.39 2.40 2.41 2.42 2.43 2.44 2.45 2.46 3 5.600% 0.02058% Actual/360 Actual/360 120 120 3.01 3.02 3.03 3.04 3.05 3.06 3.07 3.08 3.09 3.10 3.11 3.12 3.13 3.14 3.15 3.16 3.17 3.18 3.19 3.20 3.21 3.22 3.23 3.24 3.25 3.26 3.27 3.28 3.29 3.30 3.31 3.32 3.33 3.34 3.35 3.36 3.37 3.38 3.39 3.40 3.41 3.42 3.43 3.44 3.45 3.46 3.47 3.48 3.49 3.50 3.51 3.52 4 5.920% 0.02058% Actual/360 Actual/360 120 118 5 6.380% 0.02058% Actual/360 Actual/360 120 120 6 5.510% 0.02058% Actual/360 Actual/360 120 120 6.01 6.02 6.03 7 5.9523333333% 0.02058% Actual/360 Actual/360 120 118 7.01 7.02 7.03 7.04 7.05 8 5.681% 0.02058% Actual/360 Actual/360 60 59 9 5.755% 0.02058% Actual/360 Actual/360 120 119 10 5.645% 0.02058% Actual/360 Actual/360 126 124 11 5.680% 0.02058% 30/360 120 118 12 5.310% 0.02058% Actual/360 Actual/360 120 120 13 5.753% 0.02058% Actual/360 Actual/360 120 119 14 5.980% 0.02058% Actual/360 Actual/360 120 120 15 5.645% 0.02058% Actual/360 Actual/360 126 124 16 5.695% 0.02058% Actual/360 Actual/360 60 59 17 5.590% 0.02058% Actual/360 Actual/360 120 119 18 5.645% 0.02058% Actual/360 Actual/360 126 124 19 5.550% 0.02058% Actual/360 Actual/360 120 119 20 5.890% 0.02058% Actual/360 Actual/360 120 119 21 5.480% 0.02058% Actual/360 Actual/360 120 119 21.01 21.02 22 5.980% 0.02058% Actual/360 Actual/360 120 119 22.01 22.02 23 5.780% 0.02058% Actual/360 Actual/360 120 119 24 5.970% 0.02058% Actual/360 Actual/360 120 118 25 5.810% 0.02058% Actual/360 Actual/360 60 60 26 5.907% 0.02058% Actual/360 Actual/360 120 118 27 5.680% 0.02058% Actual/360 Actual/360 120 119 28 5.650% 0.02058% Actual/360 Actual/360 120 119 29 30 5.830% 0.02058% Actual/360 Actual/360 120 119 31 5.810% 0.02058% Actual/360 Actual/360 60 60 32 5.640% 0.02058% Actual/360 Actual/360 120 119 33 6.050% 0.06058% Actual/360 Actual/360 120 118 34 5.590% 0.02058% Actual/360 Actual/360 120 119 35 5.575% 0.02058% Actual/360 Actual/360 120 120 36 5.840% 0.02058% Actual/360 Actual/360 120 119 37 5.680% 0.02058% Actual/360 Actual/360 120 118 38 5.800% 0.02058% Actual/360 Actual/360 120 119 39 5.770% 0.02058% Actual/360 Actual/360 60 59 40 5.700% 0.02058% Actual/360 Actual/360 120 120 41 5.590% 0.02058% Actual/360 Actual/360 120 119 42 5.520% 0.02058% Actual/360 Actual/360 120 119 43 5.740% 0.02058% Actual/360 Actual/360 120 120 44 5.717% 0.02058% Actual/360 Actual/360 60 59 45 5.600% 0.02058% Actual/360 Actual/360 120 117 46 5.810% 0.02058% Actual/360 Actual/360 120 119 47 5.760% 0.02058% Actual/360 Actual/360 120 119 48 5.680% 0.02058% Actual/360 Actual/360 120 119 49 6.150% 0.02058% Actual/360 Actual/360 60 59 50 5.668% 0.02058% Actual/360 Actual/360 120 119 51 5.650% 0.02058% Actual/360 Actual/360 120 119 52 5.790% 0.02058% Actual/360 Actual/360 60 59 53 5.700% 0.02058% Actual/360 Actual/360 120 120 54 5.810% 0.02058% Actual/360 Actual/360 84 83 55 6.580% 0.02058% Actual/360 Actual/360 60 58 56 5.780% 0.02058% Actual/360 Actual/360 120 119 57 5.520% 0.02058% Actual/360 Actual/360 120 119 57.01 57.02 58 5.770% 0.02058% Actual/360 Actual/360 120 119 58.01 58.02 58.03 58.04 58.05 59 5.650% 0.05058% Actual/360 Actual/360 120 119 60 5.590% 0.02058% Actual/360 Actual/360 120 119 61 5.650% 0.05058% Actual/360 Actual/360 120 119 62 6.030% 0.02058% Actual/360 Actual/360 60 57 63 5.840% 0.02058% Actual/360 120 119 64 7.130% 0.02058% Actual/360 120 116 65 5.730% 0.02058% Actual/360 Actual/360 120 120 66 5.180% 0.02058% Actual/360 Actual/360 120 120 67 5.810% 0.02058% Actual/360 Actual/360 120 117 68 5.880% 0.04058% Actual/360 Actual/360 120 119 69 5.660% 0.02058% Actual/360 Actual/360 120 118 70 5.780% 0.02058% Actual/360 120 118 71 5.650% 0.02058% Actual/360 Actual/360 120 119 72 5.900% 0.02058% Actual/360 Actual/360 120 119 73 5.560% 0.02058% Actual/360 Actual/360 120 120 74 5.550% 0.02058% Actual/360 Actual/360 120 119 75 5.790% 0.02058% Actual/360 Actual/360 60 59 76 6.228% 0.02058% Actual/360 Actual/360 120 120 77 5.750% 0.02058% Actual/360 Actual/360 120 120 78 5.560% 0.02058% Actual/360 Actual/360 60 59 79 5.610% 0.02058% Actual/360 120 119 80 5.720% 0.02058% Actual/360 Actual/360 120 119 81 5.760% 0.02058% Actual/360 Actual/360 120 119 82 6.080% 0.02058% Actual/360 120 120 82.01 82.02 83 5.630% 0.02058% Actual/360 Actual/360 120 120 84 5.600% 0.02058% Actual/360 Actual/360 120 119 85 5.540% 0.02058% Actual/360 Actual/360 120 120 86 5.890% 0.02058% Actual/360 Actual/360 120 120 87 5.680% 0.04058% Actual/360 Actual/360 120 119 88 5.790% 0.02058% Actual/360 Actual/360 120 120 89 5.980% 0.02058% Actual/360 Actual/360 120 119 90 5.590% 0.02058% Actual/360 Actual/360 120 119 91 5.550% 0.02058% Actual/360 Actual/360 120 119 92 5.961% 0.02058% Actual/360 Actual/360 120 120 93 5.664% 0.02058% Actual/360 Actual/360 120 119 94 5.550% 0.02058% Actual/360 Actual/360 119 118 95 5.550% 0.02058% Actual/360 Actual/360 120 119 96 5.720% 0.02058% Actual/360 Actual/360 120 119 97 6.090% 0.02058% Actual/360 120 119 98 5.920% 0.02058% Actual/360 Actual/360 120 117 99 5.730% 0.02058% Actual/360 120 120 100 5.450% 0.02058% Actual/360 Actual/360 120 119 101 5.930% 0.02058% Actual/360 Actual/360 120 119 102 5.780% 0.02058% Actual/360 Actual/360 120 120 103 5.941% 0.02058% Actual/360 Actual/360 120 120 104 5.900% 0.02058% Actual/360 Actual/360 120 120 105 5.980% 0.02058% Actual/360 Actual/360 120 119 105.01 105.02 105.03 105.04 105.05 106 5.800% 0.02058% Actual/360 Actual/360 120 119 107 6.190% 0.02058% Actual/360 Actual/360 120 120 108 5.740% 0.07058% Actual/360 Actual/360 120 119 109 5.850% 0.07058% Actual/360 Actual/360 60 59 110 5.650% 0.07058% Actual/360 Actual/360 120 119 111 5.690% 0.02058% Actual/360 Actual/360 120 119 112 5.930% 0.02058% Actual/360 Actual/360 120 119 113 5.780% 0.02058% Actual/360 Actual/360 120 119 114 5.570% 0.09058% Actual/360 Actual/360 120 118 115 6.020% 0.02058% Actual/360 Actual/360 60 53 116 5.710% 0.02058% Actual/360 Actual/360 120 120 117 6.060% 0.02058% Actual/360 Actual/360 120 118 118 5.770% 0.02058% Actual/360 Actual/360 120 117 119 6.580% 0.07058% Actual/360 Actual/360 60 59 120 6.060% 0.02058% Actual/360 120 120 121 5.790% 0.02058% Actual/360 Actual/360 120 119 122 5.960% 0.02058% Actual/360 120 120 123 5.990% 0.02058% Actual/360 120 117 124 5.890% 0.02058% Actual/360 Actual/360 120 119 125 6.053% 0.02058% Actual/360 Actual/360 60 60 126 5.720% 0.02058% Actual/360 120 119 127 5.750% 0.02058% Actual/360 Actual/360 120 120 128 5.980% 0.02058% Actual/360 120 119 129 5.980% 0.02058% Actual/360 120 119 130 5.460% 0.02058% Actual/360 Actual/360 120 116 131 5.990% 0.02058% Actual/360 120 117 132 6.270% 0.02058% Actual/360 120 120 133 5.670% 0.02058% Actual/360 Actual/360 120 116 134 5.670% 0.02058% Actual/360 Actual/360 120 116 135 5.930% 0.02058% Actual/360 120 118 136 6.290% 0.02058% Actual/360 120 120 137 6.270% 0.02058% Actual/360 120 120 138 6.020% 0.07058% Actual/360 Actual/360 120 119 139 5.830% 0.02058% Actual/360 120 118 140 5.890% 0.02058% Actual/360 120 120 141 5.780% 0.02058% Actual/360 Actual/360 120 120 142 5.830% 0.02058% Actual/360 120 118 143 5.780% 0.02058% Actual/360 120 120 MORTGAGE MATURITY DATE OR LOAN REMAINING IO ORIGINAL AMORT REMAINING AMORT MONTHLY P&I ARD BALLOON NUMBER PERIOD (MOS.) TERM (MOS.) TERM (MOS.) PAYMENTS ($) BALANCE ($) ARD LOAN - ------------------------------------------------------------------------------------------------------------------------------------ 1 59 IO IO IO 414,000,000 N 1.01 1.02 1.03 1.04 1.05 1.06 1.07 1.08 1.09 1.10 1.11 1.12 1.13 1.14 1.15 1.16 1.17 1.18 1.19 1.20 2 60 IO IO IO 283,850,000 N 2.01 2.02 2.03 2.04 2.05 2.06 2.07 2.08 2.09 2.10 2.11 2.12 2.13 2.14 2.15 2.16 2.17 2.18 2.19 2.20 2.21 2.22 2.23 2.24 2.25 2.26 2.27 2.28 2.29 2.30 2.31 2.32 2.33 2.34 2.35 2.36 2.37 2.38 2.39 2.40 2.41 2.42 2.43 2.44 2.45 2.46 3 120 IO IO IO 221,250,000 N 3.01 3.02 3.03 3.04 3.05 3.06 3.07 3.08 3.09 3.10 3.11 3.12 3.13 3.14 3.15 3.16 3.17 3.18 3.19 3.20 3.21 3.22 3.23 3.24 3.25 3.26 3.27 3.28 3.29 3.30 3.31 3.32 3.33 3.34 3.35 3.36 3.37 3.38 3.39 3.40 3.41 3.42 3.43 3.44 3.45 3.46 3.47 3.48 3.49 3.50 3.51 3.52 4 118 IO IO IO 200,000,000 N 5 18 360 360 873,876 123,890,434 N 6 120 IO IO IO 110,000,000 N 6.01 6.02 6.03 7 58 360 360 619,788 97,136,972 N 7.01 7.02 7.03 7.04 7.05 8 59 IO IO IO 95,000,000 N 9 119 IO IO IO 92,400,000 N 10 124 IO IO IO 89,300,000 N 11 360 358 435,508 62,385,433 N 12 120 IO IO IO 70,000,000 N 13 119 IO IO IO 66,500,000 N 14 120 IO IO IO 64,000,000 N 15 124 IO IO IO 60,000,000 N 16 59 IO IO IO 54,000,000 N 17 119 IO IO IO 47,000,000 N 18 124 IO IO IO 46,000,000 N 19 119 IO IO IO 46,000,000 N 20 17 360 360 260,699 38,475,264 N 21 119 IO IO IO 40,000,000 N 21.01 21.02 22 119 IO IO IO 38,000,000 N 22.01 22.02 23 119 IO IO IO 36,750,000 N 24 118 IO IO IO 36,100,000 N 25 60 IO IO IO 35,572,500 N 26 58 360 360 207,755 32,699,946 N 27 119 IO IO IO 34,000,000 N 28 119 IO IO IO 33,700,000 N 29 30 119 IO IO IO 31,000,000 N 31 60 IO IO IO 30,175,000 N 32 119 IO IO IO 30,000,000 N 33 58 360 360 177,817 27,614,142 N 34 119 IO IO IO 29,400,000 N 35 120 IO IO IO 28,620,000 N 36 119 IO IO IO 28,000,000 N 37 82 360 360 156,366 25,954,794 N 38 119 IO IO IO 26,000,000 N 39 59 IO IO IO 26,000,000 N 40 120 IO IO IO 25,000,000 N 41 119 IO IO IO 25,000,000 N 42 119 IO IO IO 23,850,000 N 43 120 IO IO IO 23,500,000 N 44 59 IO IO IO 22,000,000 N 45 117 IO IO IO 19,875,000 N 46 119 IO IO IO 18,850,000 N 47 119 IO IO IO 18,700,000 N 48 119 IO IO IO 17,800,000 N 49 59 IO IO IO 17,650,000 N 50 59 360 360 96,704 15,570,611 N 51 119 IO IO IO 16,200,000 N 52 59 IO IO IO 16,180,000 N 53 120 IO IO IO 15,500,000 N 54 83 IO IO IO 14,750,000 N 55 22 360 360 89,227 13,550,037 N 56 119 IO IO IO 13,760,000 N 57 35 360 360 76,992 12,111,542 N 57.01 57.02 58 119 IO IO IO 13,200,000 N 58.01 58.02 58.03 58.04 58.05 59 119 IO IO IO 13,200,000 N 60 119 IO IO IO 13,100,000 N 61 119 IO IO IO 13,056,000 N 62 9 360 360 78,192 12,354,282 N 63 360 359 76,609 10,976,121 N 64 300 296 92,962 10,438,494 N 65 60 360 360 74,069 11,855,312 N 66 60 360 360 68,211 11,512,823 N 67 117 IO IO IO 12,400,000 N 68 119 IO IO IO 11,800,000 N 69 118 IO IO IO 11,600,000 N 70 360 358 66,159 9,522,785 N 71 59 360 360 64,650 10,427,458 N 72 119 IO IO IO 11,050,000 Y 73 120 IO IO IO 11,000,000 N 74 119 IO IO IO 11,000,000 N 75 59 IO IO IO 10,820,000 N 76 120 IO IO IO 10,800,000 N 77 120 IO IO IO 10,700,000 N 78 59 IO IO IO 10,550,000 N 79 360 359 60,345 8,803,573 N 80 59 360 360 60,494 9,692,060 N 81 119 IO IO IO 10,400,000 N 82 360 360 62,889 8,842,652 N 82.01 82.02 83 60 360 360 59,037 9,539,960 N 84 119 IO IO IO 10,050,000 N 85 12 360 360 57,030 8,571,363 N 86 60 420 420 52,061 8,831,453 N 87 119 IO IO IO 9,200,000 N 88 120 IO IO IO 9,000,000 N 89 119 IO IO IO 8,800,000 N 90 119 IO IO IO 8,800,000 N 91 119 IO IO IO 8,080,000 N 92 60 360 360 47,764 7,479,632 N 93 11 360 360 46,250 6,880,764 N 94 118 IO IO IO 7,920,000 N 95 119 IO IO IO 7,400,000 N 96 59 360 360 41,298 6,616,695 N 97 360 359 42,374 5,954,183 N 98 69 360 360 39,992 6,386,505 N 99 360 360 39,014 5,637,602 N 100 119 IO IO IO 6,262,000 Y 101 11 360 360 36,299 5,283,801 N 102 36 360 360 35,129 5,399,034 N 103 60 360 360 35,746 5,608,219 N 104 120 IO IO IO 6,000,000 N 105 23 360 360 35,298 5,227,023 N 105.01 105.02 105.03 105.04 105.05 106 11 360 360 33,152 4,877,259 N 107 24 360 360 34,262 4,984,270 N 108 119 IO IO IO 5,560,000 N 109 59 IO IO IO 5,350,000 N 110 119 IO IO IO 5,250,000 N 111 119 IO IO IO 5,000,000 N 112 119 IO IO IO 4,700,000 N 113 119 IO IO IO 4,600,000 N 114 118 IO IO IO 4,350,000 N 115 53 IO IO IO 4,300,000 N 116 36 360 360 24,694 3,818,957 N 117 10 360 360 25,343 3,650,080 N 118 57 360 360 24,213 3,860,881 N 119 59 IO IO IO 3,850,000 N 120 360 360 22,326 3,144,101 N 121 59 360 360 20,514 3,264,896 N 122 300 300 22,465 2,707,341 N 123 240 237 25,055 2,294,897 N 124 23 360 360 20,219 3,017,052 N 125 60 IO IO IO 3,400,000 N 126 360 359 18,613 2,692,034 N 127 120 IO IO IO 3,100,000 N 128 360 359 16,452 2,331,583 N 129 360 359 16,452 2,331,583 N 130 116 IO IO IO 2,399,000 Y 131 240 237 17,181 1,573,643 N 132 360 360 12,957 1,795,558 N 133 116 IO IO IO 2,095,000 Y 134 116 IO IO IO 1,994,000 Y 135 360 358 11,068 1,574,527 N 136 360 360 10,821 1,497,016 N 137 360 360 10,489 1,453,546 N 138 59 360 360 9,439 1,470,032 N 139 360 358 6,593 945,274 N 140 360 360 6,517 930,045 N 141 120 IO IO IO 1,100,000 N 142 360 358 6,475 928,394 N 143 360 360 5,855 842,708 N MORTGAGE LOAN NUMBER PREPAYMENT PROVISIONS APPRAISED VALUE ($) APPRAISAL DATE DSCR (X)(1) - ------------------------------------------------------------------------------------------------------------------------------------ 1 GRTR1%orYM(53),O(7) or L(25),D(28),O(7) 3,432,650,000 Various 1.27 1.01 529,000,000 3/1/2007 1.02 419,000,000 3/15/2007 1.03 394,000,000 3/1/2007 1.04 356,100,000 3/1/2007 1.05 300,300,000 3/15/2007 1.06 200,700,000 3/1/2007 1.07 186,500,000 3/1/2007 1.08 182,150,000 3/1/2007 1.09 151,800,000 3/1/2007 1.10 144,000,000 3/15/2007 1.11 106,000,000 3/15/2007 1.12 92,600,000 3/1/2007 1.13 96,000,000 3/1/2007 1.14 85,500,000 3/1/2007 1.15 75,200,000 3/15/2007 1.16 63,500,000 3/1/2007 1.17 50,300,000 3/1/2007 1.18 440,000,000 3/15/2007 1.19 200,000,000 3/15/2007 1.20 378,684,000 3/1/2007 2 GRTR1%orYM(54),O(6) 890,300,000 5/1/2009 2.14 2.01 86,700,000 5/1/2009 2.02 52,600,000 5/1/2009 2.03 45,400,000 5/1/2009 2.04 39,600,000 5/1/2009 2.05 35,800,000 5/1/2009 2.06 32,700,000 5/1/2009 2.07 29,900,000 5/1/2009 2.08 30,700,000 5/1/2009 2.09 26,300,000 5/1/2009 2.10 23,000,000 5/1/2009 2.11 20,300,000 5/1/2009 2.12 18,800,000 5/1/2009 2.13 19,400,000 5/1/2009 2.14 20,800,000 5/1/2009 2.15 18,300,000 5/1/2009 2.16 19,700,000 5/1/2009 2.17 20,200,000 5/1/2009 2.18 16,500,000 5/1/2009 2.19 17,600,000 5/1/2009 2.20 15,400,000 5/1/2009 2.21 16,700,000 5/1/2009 2.22 15,100,000 5/1/2009 2.23 14,800,000 5/1/2009 2.24 14,300,000 5/1/2009 2.25 15,400,000 5/1/2009 2.26 13,500,000 5/1/2009 2.27 14,600,000 5/1/2009 2.28 13,100,000 5/1/2009 2.29 13,100,000 5/1/2009 2.30 12,300,000 5/1/2009 2.31 12,500,000 5/1/2009 2.32 11,800,000 5/1/2009 2.33 10,900,000 5/1/2009 2.34 10,500,000 5/1/2009 2.35 10,500,000 5/1/2009 2.36 9,900,000 5/1/2009 2.37 9,500,000 5/1/2009 2.38 9,700,000 5/1/2009 2.39 11,000,000 5/1/2009 2.40 10,900,000 5/1/2009 2.41 8,800,000 5/1/2009 2.42 9,400,000 5/1/2009 2.43 7,900,000 5/1/2009 2.44 7,200,000 5/1/2009 2.45 12,000,000 5/1/2009 2.46 5,200,000 5/1/2009 3 L(23),GRTR1%orYM(90),O(7) 1,393,500,000 Various 1.51 3.01 60,000,000 3/11/2007 3.02 57,100,000 6/1/2007 3.03 54,500,000 3/14/2007 3.04 53,500,000 3/27/2007 3.05 52,800,000 3/30/2007 3.06 50,900,000 6/1/2007 3.07 46,500,000 3/19/2007 3.08 46,000,000 6/1/2007 3.09 40,000,000 3/20/2007 3.10 42,000,000 3/13/2007 3.11 39,500,000 6/1/2007 3.12 38,900,000 3/21/2007 3.13 35,000,000 3/15/2007 3.14 37,900,000 4/1/2007 3.15 40,500,000 3/14/2007 3.16 31,100,000 3/14/2007 3.17 31,000,000 3/13/2007 3.18 31,800,000 3/13/2007 3.19 30,000,000 3/13/2007 3.20 27,600,000 3/24/2007 3.21 37,700,000 3/19/2007 3.22 24,000,000 3/13/2007 3.23 21,500,000 6/1/2007 3.24 19,200,000 6/1/2007 3.25 21,000,000 3/13/2007 3.26 21,000,000 3/24/2007 3.27 20,000,000 3/28/2007 3.28 18,000,000 3/13/2007 3.29 19,500,000 3/13/2007 3.30 19,000,000 3/27/2007 3.31 18,900,000 3/13/2007 3.32 18,800,000 4/5/2007 3.33 18,500,000 3/15/2007 3.34 18,100,000 3/27/2007 3.35 15,800,000 6/1/2007 3.36 17,400,000 3/11/2007 3.37 17,000,000 3/19/2007 3.38 16,700,000 6/1/2007 3.39 16,000,000 3/14/2007 3.40 15,600,000 4/1/2007 3.41 15,600,000 3/19/2007 3.42 14,750,000 3/19/2007 3.43 14,050,000 4/5/2007 3.44 13,500,000 3/19/2007 3.45 13,400,000 3/11/2007 3.46 12,100,000 6/1/2007 3.47 13,700,000 6/1/2007 3.48 12,000,000 6/1/2007 3.49 12,000,000 3/16/2007 3.50 11,800,000 3/16/2007 3.51 10,200,000 3/26/2007 3.52 10,100,000 4/5/2007 4 L(26),D(90),O(4) 300,000,000 4/1/2007 1.25 5 L(24),D(89),O(7) 196,000,000 1/1/2007 1.25 6 L(23),GRTR1%orYM(90),O(7) 164,100,000 Various 1.50 6.01 106,500,000 3/19/2007 6.02 35,000,000 3/20/2007 6.03 22,600,000 6/1/2007 7 L(26),D(92),O(2) 139,900,000 Various 1.36 7.01 40,300,000 2/15/2007 7.02 39,800,000 2/15/2007 7.03 21,000,000 2/15/2007 7.04 23,000,000 2/15/2007 7.05 15,800,000 2/16/2007 8 L(25),D(32),O(3) 135,000,000 4/1/2007 1.54 9 L(25),D(91),O(4) 115,500,000 3/1/2008 1.38 10 L(23),GRTR1%orYM(96),O(7) or L(26),D(93),O(7) 159,100,000 3/1/2010 1.66 11 L(24),GRTR1%orYM(92),O(4) or L(26),D(90),O(4) 94,000,000 1/22/2007 1.22 12 L(24),D(92),O(4) 125,000,000 3/9/2007 2.46 13 L(25),D(92),O(3) 84,000,000 3/19/2007 1.27 14 L(24),D(91),O(5) 85,700,000 4/12/2007 1.20 15 L(23),GRTR1%orYM(96),O(7) or L(26),D(93),O(7) 113,700,000 3/19/2010 1.74 16 L(25),D(32),O(3) 70,000,000 4/1/2007 1.35 17 L(23),GRTR1%orYM(93),O(4) 61,800,000 2/23/2007 1.30 18 L(23),GRTR1%orYM(96),O(7) or L(26),D(93),O(7) 100,700,000 3/19/2010 2.11 19 GRTR1%orYM(116),O(4) 59,000,000 4/1/2007 1.20 20 L(25),D(90),O(5) 58,500,000 4/3/2007 1.31 21 L(25),D(91),O(4) 50,000,000 4/5/2007 1.42 21.01 34,000,000 4/5/2007 21.02 16,000,000 4/5/2007 22 L(25),D(90),O(5) 45,900,000 4/6/2007 1.22 22.01 25,000,000 4/6/2007 22.02 20,900,000 4/6/2007 23 L(25),D(91),O(4) 46,000,000 4/9/2007 1.40 24 L(26),D(90)or(GRTR1%orYM(90)),O(4) 41,000,000 2/1/2007 1.39 25 GRTR1%orYM(56),O(4) 46,200,000 10/1/2008 1.29 26 L(26),D(92),O(2) 101,000,000 3/16/2007 2.60 27 L(25),D(92),O(3) 42,561,000 4/4/2007 1.42 28 L(25),D(92),O(3) 42,500,000 1/27/2007 1.50 29 30 GRTR1%orYM(116),O(4) 39,700,000 1/29/2007 1.27 31 GRTR1%orYM(56),O(4) 38,500,000 10/1/2008 1.25 32 L(25),D(91),O(4) 38,100,000 3/1/2008 1.22 33 L(4),GRTR1%orYM(113),O(3) 40,000,000 1/17/2007 1.27 34 L(25),D(88)or(GRTR1%orYM(88)),O(7) 38,000,000 3/4/2007 1.45 35 L(24),D(92),O(4) 36,600,000 3/28/2007 1.44 36 L(25),D(90),O(5) 35,100,000 8/1/2007 1.20 37 L(26),D(91),O(3) 36,000,000 2/9/2007 1.12 38 L(25),D(92),O(3) 32,475,000 3/8/2007 1.20 39 GRTR1%orYM(56),O(4) 32,900,000 5/1/2007 1.44 40 L(24),D(92),O(4) or GRTR1%orYM(116),O(4) 31,000,000 4/1/2007 1.08 41 L(25),D(88)or(GRTR1%orYM(88)),O(7) 39,200,000 3/2/2007 1.19 42 L(25),D(92)or(GRTR1%orYM(92)),O(3) 31,200,000 3/5/2007 1.58 43 L(24),D(92),O(4) 29,400,000 4/17/2007 1.24 44 L(25),D(32),O(3) 28,000,000 3/19/2007 1.29 45 L(27),D(89),O(4) 24,900,000 2/2/2007 1.32 46 L(25),D(92)or(GRTR1%orYM(92)),O(3) 25,000,000 2/27/2007 1.46 47 L(25),D(92)or(GRTR1%orYM(92)),O(3) 23,400,000 2/27/2007 1.28 48 L(25),D(92),O(3) 22,500,000 3/7/2007 1.33 49 L(24),GRTR1%orYM(33),O(3) 24,430,000 2/9/2009 1.20 50 L(25),D(90),O(5) 20,900,000 3/12/2007 1.20 51 GRTR1.75%orYM(24),GRTR1%orYM(89),O(7) 27,100,000 3/20/2007 1.62 52 L(25),D(23),O(12) 20,400,000 4/6/2007 1.35 53 GRTR1%orYM(116),O(4) 19,600,000 5/1/2008 1.29 54 L(25),D(55),O(4) 26,000,000 3/16/2007 1.21 55 L(26),GRTR1%orYM(30),O(4) 23,550,000 4/1/2008 1.69 56 L(25),D(92)or(GRTR1%orYM(92)),O(3) 17,500,000 1/17/2007 1.42 57 L(25),D(91),O(4) 23,500,000 5/1/2007 1.72 57.01 18,734,020 5/1/2007 57.02 4,765,980 5/1/2007 58 L(25),D(92),O(3) 16,500,000 Various 1.46 58.01 5,200,000 3/30/2007 58.02 3,400,000 3/27/2007 58.03 3,400,000 3/27/2007 58.04 2,300,000 3/27/2007 58.05 2,200,000 3/27/2007 59 L(25),D(92),O(3) 16,500,000 4/1/2008 1.20 60 L(25),D(88)or(GRTR1%orYM(88)),O(7) 18,700,000 3/6/2007 1.50 61 L(24),GRTR1%orYM(92),O(4) 16,500,000 4/2/2007 1.28 62 L(25),GRTR1%orYM(31),O(4) 18,800,000 2/20/2007 1.37 63 L(25),D(92),O(3) 16,800,000 10/1/2007 1.21 64 GRTR1%orYM(25),O(95) 17,500,000 1/25/2007 1.25 65 L(24),D(93),O(3) 15,900,000 3/20/2007 1.16 66 L(24),D(92),O(4) 16,600,000 4/9/2007 1.29 67 L(27),D(89),O(4) 16,500,000 11/9/2006 1.23 68 L(25),GRTR1%orYM(90),O(5) 14,800,000 3/21/2007 1.41 69 L(26),D(91),O(3) 14,500,000 3/2/2007 1.35 70 L(26),D(91),O(3) 21,000,000 3/1/2007 1.42 71 L(25),D(90),O(5) 17,300,000 12/31/2006 1.31 72 L(25),GRTR1%orYM(92),O(3) 17,000,000 3/15/2007 1.58 73 L(24),D(93),O(3) 17,100,000 4/16/2007 1.47 74 GRTR1%orYM(116),O(4) 44,400,000 4/19/2007 1.15 75 L(25),D(23),O(12) 13,500,000 4/6/2007 1.40 76 GRTR1%orYM(116),O(4) 14,300,000 4/18/2007 1.32 77 GRTR1%orYM(116),O(4) 14,000,000 4/10/2007 1.28 78 L(12),GRTR1.0%orYM(45),O(3) 20,800,000 4/3/2007 1.86 79 L(25),D(92),O(3) 13,150,000 4/4/2007 1.16 80 GRTR1%orYM(116),O(4) 13,000,000 4/4/2007 1.29 81 L(25),D(92)or(GRTR1%orYM(92)),O(3) 13,000,000 2/9/2007 1.43 82 L(24),D(93),O(3) 13,770,000 3/22/2007 1.16 82.01 8,860,000 3/22/2007 82.02 4,910,000 3/22/2007 83 L(24),D(93),O(3) 14,500,000 4/12/2007 1.15 84 L(25),D(91),O(4) 13,840,000 1/18/2007 1.49 85 L(24),D(92),O(4) 14,700,000 4/2/2007 1.36 86 L(24),D(93),O(3) 11,600,000 3/27/2007 1.28 87 L(25),GRTR1%orYM(90),O(5) 13,000,000 3/19/2007 1.41 88 L(60),GRTR1%orYM(57),O(3) 15,460,000 4/10/2007 1.29 89 L(25),D(90),O(5) 11,300,000 4/6/2007 1.23 90 L(25),D(88)or(GRTR1%orYM(88)),O(7) 11,200,000 2/20/2007 1.43 91 L(25),D(91),O(4) 12,600,000 2/1/2007 1.33 92 GRTR1%orYM(116),O(4) 12,900,000 3/15/2007 1.30 93 L(25),D(92),O(3) 10,000,000 3/21/2007 1.23 94 L(25),D(90),O(4) 10,000,000 2/28/2007 1.48 95 L(25),D(91),O(4) 11,750,000 2/1/2007 1.73 96 GRTR1%orYM(116),O(4) 8,950,000 4/4/2007 1.22 97 L(25),D(91),O(4) 9,500,000 4/1/2007 1.59 98 L(27),D(89),O(4) 11,400,000 11/1/2006 1.30 99 L(24),D(93),O(3) 8,380,000 3/20/2007 1.17 100 L(25),D(92),O(3) 10,100,000 3/30/2007 1.88 101 L(25),GRTR1%orYM(92),O(3) 7,800,000 1/19/2007 1.26 102 L(24),D(93),O(3) 8,300,000 4/7/2007 1.36 103 GRTR1%orYM(116),O(4) 9,200,000 3/23/2007 1.29 104 L(24),D(93),O(3) 8,100,000 9/12/2007 1.30 105 L(25),D(92),O(3) 13,380,000 Various 1.20 105.01 5,450,000 3/21/2007 105.02 3,500,000 3/23/2007 105.03 2,500,000 3/23/2007 105.04 1,630,000 3/15/2007 105.05 300,000 3/23/2007 106 L(25),D(92),O(3) 7,100,000 6/1/2007 1.20 107 L(24),D(93),O(3) 8,000,000 4/5/2007 1.26 108 L(25),D(92),O(3) 7,000,000 2/21/2007 1.45 109 L(25),D(32),O(3) 7,900,000 3/22/2007 1.28 110 L(25),D(92),O(3) 6,580,000 3/6/2007 1.20 111 L(23),GRTR1%orYM(36), 6,800,000 2/26/2007 1.25 LSR5%orYM(12), LSR4%orYM(12), LSR3%orYM(12), LSR2%orYM(12), LSR1%orYM(7),O(6) 112 L(25),D(92),O(3) 6,200,000 4/16/2007 1.27 113 L(25),D(92),O(3) 6,300,000 3/9/2008 1.22 114 L(26),GRTR1%orYM(90),O(4) 5,450,000 2/26/2007 1.35 115 L(31),D(4),O(25) 5,350,000 8/16/2006 1.62 116 L(60),GRTR1%orYM(57),O(3) 5,600,000 4/5/2007 1.16 117 L(26),D(90),O(4) 5,600,000 3/2/2007 1.32 118 L(27),D(89),O(4) 6,900,000 11/1/2006 1.46 119 L(24),O(36) 5,100,000 3/22/2007 1.23 120 L(24),D(93),O(3) 4,725,000 3/30/2007 1.15 121 L(25),D(91),O(4) 4,400,000 3/13/2007 1.18 122 L(24),GRTR1%orYM(89),O(7) 7,600,000 4/3/2007 1.76 123 L(27),D(90),O(3) 5,300,000 12/14/2006 1.35 124 L(25),D(92),O(3) 4,600,000 3/1/2007 1.30 125 GRTR1%orYM(56),O(4) 6,300,000 3/30/2007 1.97 126 L(25),D(92),O(3) 4,150,000 3/1/2007 1.32 127 L(24),D(93),O(3) 3,900,000 3/19/2007 1.20 128 L(25),D(92),O(3) 3,910,000 4/15/2007 1.28 129 L(25),D(92),O(3) 3,710,000 3/29/2007 1.26 130 L(48),D(68),O(4) 3,700,000 11/27/2006 1.87 131 L(27),D(90),O(3) 3,500,000 12/12/2006 1.33 132 L(23),D(94),O(3) 2,800,000 4/27/2007 1.19 133 L(48),D(68),O(4) 3,800,000 12/4/2006 2.15 134 L(48),D(68),O(4) 3,630,000 12/8/2006 2.05 135 L(26),D(91),O(3) 2,325,000 2/12/2007 1.25 136 L(24),D(93),O(3) 2,600,000 4/12/2007 1.20 137 L(23),D(94),O(3) 2,220,000 4/27/2007 1.25 138 L(6),GRTR1%orYM(111),O(3) 2,100,000 1/19/2007 1.20 139 L(26),D(91),O(3) 1,400,000 2/5/2007 1.28 140 L(60),GRTR1%orYM(57),O(3) 2,450,000 4/22/2007 1.96 141 L(24),D(93),O(3) 2,960,000 4/12/2007 2.55 142 L(26),D(91),O(3) 1,375,000 2/6/2007 1.35 143 L(60),GRTR1%orYM(57),O(3) 2,410,000 4/10/2007 1.89 MORTGAGE LOAN CUT-OFF DATE LTV RATIO AT YEAR UNIT OF NUMBER LTV RATIO(1)(2) MATURITY OR ARD BUILT YEAR RENOVATED NUMBER OF UNITS MEASURE - ------------------------------------------------------------------------------------------------------------------------------- 1 78.7% 78.7% Various Various 9,848,341 Sq. Ft. 1.01 1991 678,348 Sq. Ft. 1.02 1970 2003 904,226 Sq. Ft. 1.03 1983 944,141 Sq. Ft. 1.04 1980 1993 711,495 Sq. Ft. 1.05 1980 731,234 Sq. Ft. 1.06 2000 473,988 Sq. Ft. 1.07 1999 463,182 Sq. Ft. 1.08 1986 465,765 Sq. Ft. 1.09 1978 466,948 Sq. Ft. 1.10 1975 294,521 Sq. Ft. 1.11 1985 329,695 Sq. Ft. 1.12 1985 251,088 Sq. Ft. 1.13 1991 163,936 Sq. Ft. 1.14 1984 277,672 Sq. Ft. 1.15 2000 216,469 Sq. Ft. 1.16 1913 1987 102,822 Sq. Ft. 1.17 1987 148,952 Sq. Ft. 1.18 1988 764,103 Sq. Ft. 1.19 1980 380,743 Sq. Ft. 1.20 1988 1,079,013 Sq. Ft. 2 63.8% 63.8% Various Various 5,796 Rooms 2.01 1986 2003 288 Rooms 2.02 1999 180 Rooms 2.03 1987 2006 216 Rooms 2.04 1986 144 Rooms 2.05 1989 120 Rooms 2.06 1989 2003 112 Rooms 2.07 1998 2006 109 Rooms 2.08 1989 126 Rooms 2.09 1989 106 Rooms 2.10 1998 2006 147 Rooms 2.11 1988 2005 152 Rooms 2.12 1990 2004 114 Rooms 2.13 1986 2003 128 Rooms 2.14 1990 126 Rooms 2.15 1989 2004 128 Rooms 2.16 1998 123 Rooms 2.17 1989 2003 110 Rooms 2.18 1986 2006 120 Rooms 2.19 1988 2003 112 Rooms 2.20 1998 123 Rooms 2.21 1987 2004 136 Rooms 2.22 1998 123 Rooms 2.23 1985 144 Rooms 2.24 1987 2006 144 Rooms 2.25 1986 2004 112 Rooms 2.26 1989 2005 136 Rooms 2.27 1989 2007 120 Rooms 2.28 1998 2006 112 Rooms 2.29 1988 2005 120 Rooms 2.30 1986 2004 88 Rooms 2.31 1986 2004 128 Rooms 2.32 1986 2006 130 Rooms 2.33 1989 2006 120 Rooms 2.34 1999 145 Rooms 2.35 1990 2006 94 Rooms 2.36 1997 2006 92 Rooms 2.37 1986 2006 104 Rooms 2.38 1989 2006 118 Rooms 2.39 1988 2003 88 Rooms 2.40 1989 2006 96 Rooms 2.41 1996 98 Rooms 2.42 1996 2006 99 Rooms 2.43 1990 2006 124 Rooms 2.44 1986 2007 105 Rooms 2.45 1984 2002 144 Rooms 2.46 1989 92 Rooms 3 63.5% 63.5% Various Various 7,297,943 Sq. Ft. 3.01 1997 245,774 Sq. Ft. 3.02 1991 260,797 Sq. Ft. 3.03 1990 227,209 Sq. Ft. 3.04 1998 307,716 Sq. Ft. 3.05 1996 312,546 Sq. Ft. 3.06 1985 2003 273,307 Sq. Ft. 3.07 1994 1998 281,244 Sq. Ft. 3.08 1999 2004 240,560 Sq. Ft. 3.09 1998 272,385 Sq. Ft. 3.10 2001 227,085 Sq. Ft. 3.11 2001 108,565 Sq. Ft. 3.12 1999 217,619 Sq. Ft. 3.13 2002 132,745 Sq. Ft. 3.14 1999 2000 271,729 Sq. Ft. 3.15 1987 2003 149,658 Sq. Ft. 3.16 1983 2002 126,486 Sq. Ft. 3.17 1999 2004 186,212 Sq. Ft. 3.18 2002 130,609 Sq. Ft. 3.19 1981 152,667 Sq. Ft. 3.20 2000 119,197 Sq. Ft. 3.21 1973 1998 243,176 Sq. Ft. 3.22 2002 158,222 Sq. Ft. 3.23 2003 89,627 Sq. Ft. 3.24 2003 82,441 Sq. Ft. 3.25 1990 2004 104,460 Sq. Ft. 3.26 1959 204,216 Sq. Ft. 3.27 1974 1990 121,766 Sq. Ft. 3.28 2003 71,430 Sq. Ft. 3.29 2001 2004 66,539 Sq. Ft. 3.30 2001 98,317 Sq. Ft. 3.31 2001 69,471 Sq. Ft. 3.32 1999 137,757 Sq. Ft. 3.33 1999 125,653 Sq. Ft. 3.34 2003 90,566 Sq. Ft. 3.35 1987 2000 83,929 Sq. Ft. 3.36 1980 95,229 Sq. Ft. 3.37 1985 1999 117,723 Sq. Ft. 3.38 1989 93,643 Sq. Ft. 3.39 1990 70,555 Sq. Ft. 3.40 1989 128,210 Sq. Ft. 3.41 1994 75,492 Sq. Ft. 3.42 2002 73,271 Sq. Ft. 3.43 2003 67,721 Sq. Ft. 3.44 2002 76,512 Sq. Ft. 3.45 2003 62,840 Sq. Ft. 3.46 1997 60,712 Sq. Ft. 3.47 1991 67,475 Sq. Ft. 3.48 1997 73,986 Sq. Ft. 3.49 1994 68,927 Sq. Ft. 3.50 1994 66,986 Sq. Ft. 3.51 2002 49,097 Sq. Ft. 3.52 2002 57,884 Sq. Ft. 4 66.7% 66.7% 1909 2005 354,298 Sq. Ft. 5 71.4% 63.2% 1994 343 Rooms 6 67.0% 67.0% 2005 678,553 Sq. Ft. 6.01 2005 432,327 Sq. Ft. 6.02 2005 143,129 Sq. Ft. 6.03 2005 103,097 Sq. Ft. 7 74.3% 69.4% Various Various 1,396 Rooms 7.01 2000 400 Rooms 7.02 2000 2007 312 Rooms 7.03 1997 150 Rooms 7.04 2000 2006 388 Rooms 7.05 2002 146 Rooms 8 70.4% 70.4% 1903 1995 413,828 Sq. Ft. 9 80.0% 80.0% 1986 539,661 Sq. Ft. 10 56.1% 56.1% 1987 287,494 Sq. Ft. 11 79.8% 66.4% 1981 2000 296,707 Sq. Ft. 12 56.0% 56.0% 1970 2007 524,479 Sq. Ft. 13 79.2% 79.2% 1910 186,575 Sq. Ft. 14 74.7% 74.7% 1961 1998 414,202 Sq. Ft. 15 52.8% 52.8% 1986 165,184 Sq. Ft. 16 77.1% 77.1% 1913 166,761 Sq. Ft. 17 76.1% 76.1% 1970/1999 165,662 Sq. Ft. 18 45.7% 45.7% 1989 147,047 Sq. Ft. 19 78.0% 78.0% 1961 1998 309,360 Sq. Ft. 20 75.2% 65.8% 1979 2001 251 Rooms 21 80.0% 80.0% Various 712 Units 21.01 1986 456 Units 21.02 1984 256 Units 22 82.8% 82.8% Various 1994 176,977 Sq. Ft. 22.01 1985 1994 92,996 Sq. Ft. 22.02 1987 83,981 Sq. Ft. 23 79.9% 79.9% 1978 2000 190 Rooms 24 88.1% 88.1% 1956 2000 931,560 Sq. Ft. 25 77.0% 77.0% 1984 404 Units 26 34.7% 32.4% 1999 498 Rooms 27 79.9% 79.9% 1994 518 Units 28 79.3% 79.3% 1996 369 Units 29 30 78.1% 78.1% 1984 318 Units 31 78.4% 78.4% 1991 318 Units 32 78.7% 78.7% 1988 171,955 Sq. Ft. 33 73.8% 69.0% 1974 2001 372 Rooms 34 77.4% 77.4% 1998 272,181 Sq. Ft. 35 78.2% 78.2% 2002 101,278 Sq. Ft. 36 79.8% 79.8% 2006 225,922 Sq. Ft. 37 75.0% 72.1% 1962 2004 441,648 Sq. Ft. 38 80.1% 80.1% 2005 2007 392 Units 39 79.0% 79.0% 1987 191 Rooms 40 80.7% 80.7% 1902 2007 6,000 Sq. Ft. 41 63.8% 63.8% 1988 2005 316,576 Sq. Ft. 42 76.4% 76.4% 1995 74,786 Sq. Ft. 43 79.9% 79.9% 1920 17,000 Sq. Ft. 44 78.6% 78.6% 1911 1955 54,000 Sq. Ft. 45 79.8% 79.8% 2003 232 Units 46 75.4% 75.4% 1972 2006 127,484 Sq. Ft. 47 79.9% 79.9% 1995 168,791 Sq. Ft. 48 79.1% 79.1% 1996 93,665 Sq. Ft. 49 72.3% 72.3% 1988 152 Units 50 80.0% 74.5% 1988 131,317 Sq. Ft. 51 59.8% 59.8% 1985 1999 185,327 Sq. Ft. 52 79.3% 79.3% 1972 312 Units 53 79.1% 79.1% 2004 89,004 Sq. Ft. 54 56.7% 56.7% 1924 2002 60,000 Sq. Ft. 55 59.5% 57.5% 1976 924 Units 56 78.6% 78.6% 1988 180,990 Sq. Ft. 57 57.6% 51.5% Various 1995 114,971 Sq. Ft. 57.01 1987 1995 91,654 Sq. Ft. 57.02 1984 1995 23,317 Sq. Ft. 58 80.0% 80.0% Various 43,028 Sq. Ft. 58.01 2006 13,356 Sq. Ft. 58.02 2003 8,902 Sq. Ft. 58.03 2007 9,010 Sq. Ft. 58.04 2004 6,000 Sq. Ft. 58.05 1985 5,760 Sq. Ft. 59 80.0% 80.0% 1971 2006 104 Units 60 70.1% 70.1% 1978 2004 85,277 Sq. Ft. 61 79.1% 79.1% 1989 192 Units 62 69.2% 65.7% 1998 2006 139 Beds 63 77.3% 65.3% 2006 67,922 Sq. Ft. 64 73.9% 59.7% 2006 41,400 Sq. Ft. 65 80.0% 74.6% 2006 85,636 Sq. Ft. 66 75.0% 69.4% 1995 243 Units 67 75.2% 75.2% 1975 56,351 Sq. Ft. 68 79.7% 79.7% 2001 70,722 Sq. Ft. 69 80.0% 80.0% 1987 216 Units 70 53.7% 45.4% 2003 96 Units 71 64.7% 60.3% 1993 506,828 Sq. Ft. 72 65.0% 65.0% 2005 50,962 Sq. Ft. 73 64.3% 64.3% 1968 2007 69,043 Sq. Ft. 74 24.8% 24.8% 1910 27,715 Sq. Ft. 75 80.2% 80.2% 1972 216 Units 76 75.5% 75.5% 1989 80,201 Sq. Ft. 77 76.4% 76.4% 1982 169 Units 78 50.7% 50.7% 1986 1997 131,572 Sq. Ft. 79 79.8% 67.0% 2005 52,441 Sq. Ft. 80 80.0% 74.6% 1973 285 Units 81 80.0% 80.0% 2000 103,429 Sq. Ft. 82 75.5% 64.2% Various 57,753 Sq. Ft. 82.01 2006 35,404 Sq. Ft. 82.02 2005 22,349 Sq. Ft. 83 70.7% 65.8% 1985 2006 132 Units 84 72.6% 72.6% 2004 79,546 Sq. Ft. 85 68.0% 58.3% 1990 55,132 Sq. Ft. 86 79.7% 76.1% 2005 17,207 Sq. Ft. 87 70.8% 70.8% 1985 2006 61,896 Sq. Ft. 88 58.2% 58.2% 2007 27,954 Sq. Ft. 89 77.9% 77.9% 1960 35,113 Sq. Ft. 90 78.6% 78.6% 1969 1998 125,626 Sq. Ft. 91 64.1% 64.1% 1964 186 Units 92 62.0% 58.0% 1963 1994 139,456 Sq. Ft. 93 80.0% 68.8% 2006 39,935 Sq. Ft. 94 79.2% 79.2% 2003 2006 43,677 Sq. Ft. 95 63.0% 63.0% 1973 196 Units 96 79.3% 73.9% 1970 203 Units 97 73.6% 62.7% 2005 80 Rooms 98 59.0% 56.0% 2003 48,750 Sq. Ft. 99 80.0% 67.3% 1970 176 Units 100 62.0% 62.0% 2005 107,520 Sq. Ft. 101 78.2% 67.7% 2006 26,489 Sq. Ft. 102 72.3% 65.0% 1990 88,577 Sq. Ft. 103 65.2% 61.0% 1987 38,247 Sq. Ft. 104 74.1% 74.1% 2007 19,600 Sq. Ft. 105 44.1% 39.1% NA 621,847 Sq. Ft. 105.01 NA 104,315 Sq. Ft. 105.02 NA 254,850 Sq. Ft. 105.03 NA 218,100 Sq. Ft. 105.04 NA 35,870 Sq. Ft. 105.05 NA 8,712 Sq. Ft. 106 79.6% 68.7% 2006 33,586 Sq. Ft. 107 70.0% 62.3% 1996 19,891 Sq. Ft. 108 79.4% 79.4% 1973 204 Units 109 67.7% 67.7% 1970 48,998 Sq. Ft. 110 79.8% 79.8% 1985 59,709 Sq. Ft. 111 73.5% 73.5% 1996 34,767 Sq. Ft. 112 75.8% 75.8% 1972 66 Units 113 73.0% 73.0% 1926 63 Units 114 79.8% 79.8% 1965 83 Units 115 80.4% 80.4% 1984 71,268 Sq. Ft. 116 75.9% 68.2% 2006 19,715 Sq. Ft. 117 75.0% 65.2% 1997 75 Rooms 118 60.0% 56.0% 2005 32,009 Sq. Ft. 119 75.5% 75.5% 1975 30,772 Sq. Ft. 120 78.3% 66.5% 2005 60 Units 121 79.6% 74.2% 1967 177,865 Sq. Ft. 122 46.1% 35.6% 1997 2006 118 Rooms 123 65.6% 43.3% 1970 229,500 Sq. Ft. 124 74.2% 65.6% 1986 2006 26,552 Sq. Ft. 125 54.0% 54.0% 1978 64,197 Sq. Ft. 126 77.0% 64.9% 2007 18,000 Sq. Ft. 127 79.5% 79.5% 1947 51 Units 128 70.3% 59.6% 1971 2003 68,750 Sq. Ft. 129 74.1% 62.9% 1968 53,763 Sq. Ft. 130 64.8% 64.8% 2006 14,820 Sq. Ft. 131 68.2% 45.0% 1992 141,916 Sq. Ft. 132 75.0% 64.1% 1985 16,488 Sq. Ft. 133 55.1% 55.1% 2005 21,688 Sq. Ft. 134 54.9% 54.9% 2005 23,627 Sq. Ft. 135 79.9% 67.7% 1963 32,416 Sq. Ft. 136 67.3% 57.6% 1984 41,593 Sq. Ft. 137 76.6% 65.5% 1987 23,286 Sq. Ft. 138 74.8% 70.0% 1900 1999 31 Rooms 139 79.9% 67.5% 1966 40,025 Sq. Ft. 140 44.9% 38.0% 2001 4,022 Sq. Ft. 141 37.2% 37.2% 2006 8,064 Sq. Ft. 142 79.9% 67.5% 2003 20,000 Sq. Ft. 143 41.5% 35.0% 1953 2006 3,608 Sq. Ft. MORTGAGE CUT-OFF DATE LOAN LOAN AMOUNT OCCUPANCY MOST RECENT MOST RECENT NUMBER PER (UNIT) ($) OCCUPANCY RATE "AS OF" DATE MOST RECENT PERIOD REVENUES ($) EXPENSES ($) - ------------------------------------------------------------------------------------------------------------------------------------ 1 274 96.9% 4/1/2007 Oct-06 TTM 327,007,470 119,187,137 1.01 95.4% 4/1/2007 Oct-06 TTM 33,873,597 14,508,771 1.02 100.0% 4/1/2007 Oct-06 TTM 28,418,173 8,034,399 1.03 92.8% 4/1/2007 Oct-06 TTM 24,851,252 9,376,395 1.04 91.3% 4/1/2007 Oct-06 TTM 28,239,791 12,135,536 1.05 99.5% 4/1/2007 Oct-06 TTM 23,650,430 8,244,888 1.06 97.9% 4/1/2007 Oct-06 TTM 15,713,099 5,874,901 1.07 100.0% 4/1/2007 Oct-06 TTM 13,455,754 4,880,754 1.08 95.6% 4/1/2007 Oct-06 TTM 15,314,056 4,751,796 1.09 95.8% 4/1/2007 Oct-06 TTM 10,742,669 3,908,408 1.10 97.8% 4/1/2007 Oct-06 TTM 8,387,241 3,753,307 1.11 94.8% 4/3/2007 Oct-06 TTM 6,896,599 3,157,440 1.12 100.0% 4/1/2007 Oct-06 TTM 5,303,800 2,416,168 1.13 99.4% 4/1/2007 Oct-06 TTM 7,429,280 3,101,959 1.14 96.8% 4/1/2007 Oct-06 TTM 5,660,488 2,477,344 1.15 100.0% 4/1/2007 Oct-06 TTM 5,493,256 1,938,481 1.16 100.0% 4/1/2007 Oct-06 TTM 5,354,835 2,454,415 1.17 91.5% 4/1/2007 Oct-06 TTM 3,482,935 1,329,274 1.18 98.3% 4/1/2007 Oct-06 TTM 31,813,392 10,101,895 1.19 99.4% 4/1/2007 Oct-06 TTM 13,540,261 4,431,668 1.20 96.9% 4/1/2007 Oct-06 TTM 39,386,562 12,309,339 2 97,947 77.0% Various 2006 185,617,795 113,879,184 2.01 79.9% 12/29/2006 2006 12,612,076 5,800,501 2.02 76.5% 12/29/2006 2006 8,616,733 4,073,007 2.03 74.6% 12/29/2006 2006 7,647,078 4,504,475 2.04 82.0% 12/29/2006 2006 6,161,294 2,684,526 2.05 80.0% 12/29/2006 2006 5,278,275 2,512,512 2.06 83.9% 12/29/2006 2006 4,885,785 2,309,011 2.07 80.5% 12/31/2006 2006 5,235,788 2,709,096 2.08 87.1% 12/29/2006 2006 5,043,582 2,859,266 2.09 82.2% 12/29/2006 2006 4,292,380 2,381,543 2.10 79.3% 12/31/2006 2006 5,208,316 3,249,513 2.11 81.1% 12/29/2006 2006 4,980,051 2,946,067 2.12 83.9% 12/29/2006 2006 3,901,364 2,271,640 2.13 76.4% 12/29/2006 2006 4,290,751 2,457,019 2.14 79.8% 12/29/2006 2006 4,184,440 2,587,892 2.15 77.5% 12/29/2006 2006 4,187,184 2,398,939 2.16 86.9% 12/31/2006 2006 4,278,611 2,737,401 2.17 81.3% 12/29/2006 2006 3,552,120 2,048,070 2.18 68.7% 12/29/2006 2006 3,101,717 2,276,987 2.19 81.7% 12/29/2006 2006 3,580,110 2,171,991 2.20 74.0% 12/31/2006 2006 3,387,747 2,161,803 2.21 74.1% 12/29/2006 2006 4,119,775 2,665,098 2.22 79.0% 12/31/2006 2006 3,309,720 2,030,035 2.23 78.6% 12/29/2006 2006 3,799,806 2,385,464 2.24 76.9% 12/29/2006 2006 3,877,769 2,699,175 2.25 77.8% 12/29/2006 2006 3,400,312 2,195,932 2.26 78.8% 12/31/2006 2006 3,794,503 2,776,177 2.27 72.1% 12/31/2006 2006 3,400,739 2,383,471 2.28 77.7% 12/31/2006 2006 3,414,367 2,283,949 2.29 70.6% 12/29/2006 2006 3,205,027 2,493,316 2.30 79.6% 12/29/2006 2006 2,996,167 2,006,385 2.31 72.8% 12/29/2006 2006 3,250,667 2,097,424 2.32 75.6% 12/29/2006 2006 3,205,292 2,232,690 2.33 74.6% 12/31/2006 2006 3,091,887 2,193,857 2.34 69.7% 12/31/2006 2006 3,190,243 2,289,119 2.35 77.9% 12/29/2006 2006 2,574,005 1,638,468 2.36 75.2% 12/31/2006 2006 2,901,976 2,055,485 2.37 77.0% 12/29/2006 2006 2,792,823 1,881,322 2.38 73.6% 12/29/2006 2006 3,085,810 2,247,448 2.39 69.2% 12/29/2006 2006 2,852,658 1,960,913 2.40 79.9% 12/31/2006 2006 2,954,113 2,044,506 2.41 75.0% 12/31/2006 2006 2,472,859 1,631,748 2.42 78.0% 12/31/2006 2006 2,800,042 2,036,979 2.43 67.3% 12/31/2006 2006 2,952,312 2,388,444 2.44 67.5% 12/29/2006 2006 2,520,133 2,143,806 2.45 66.2% 12/31/2006 2006 3,066,217 2,266,351 2.46 78.2% 12/31/2006 2006 2,163,171 1,710,363 3 121 95.9% Various 2006 111,004,336 36,540,626 3.01 97.7% 5/31/2007 2006 4,996,521 1,726,895 3.02 96.2% 6/4/2007 2006 4,243,511 1,061,435 3.03 97.7% 5/31/2007 2006 3,635,889 1,621,233 3.04 94.2% 5/31/2007 2006 4,134,977 999,435 3.05 98.8% 5/31/2007 2006 4,565,789 1,266,383 3.06 90.7% 5/31/2007 2006 5,186,962 2,370,999 3.07 98.7% 5/31/2007 2006 3,283,027 1,046,097 3.08 99.5% 5/31/2007 2006 2,844,107 495,019 3.09 100.0% 5/31/2007 2006 3,685,112 738,132 3.10 100.0% 5/31/2007 2006 2,899,310 1,058,243 3.11 98.6% 5/31/2007 2006 3,322,064 1,173,499 3.12 100.0% 5/31/2007 2006 3,204,851 703,595 3.13 92.8% 5/31/2007 2006 3,094,664 1,043,637 3.14 99.3% 5/31/2007 2006 3,284,157 746,428 3.15 72.7% 5/31/2007 2006 2,305,810 1,005,817 3.16 92.3% 5/31/2007 2006 2,273,709 974,290 3.17 100.0% 5/31/2007 2006 2,749,548 937,520 3.18 89.8% 5/31/2007 2006 2,053,160 687,453 3.19 98.5% 5/31/2007 2006 2,393,097 845,106 3.20 98.3% 5/31/2007 2006 2,057,016 432,248 3.21 84.7% 5/31/2007 2006 2,572,504 1,282,072 3.22 93.7% 5/31/2007 2006 2,472,558 1,200,085 3.23 100.0% 5/31/2007 2006 2,109,963 853,916 3.24 100.0% 5/31/2007 2006 1,727,072 563,725 3.25 96.2% 5/31/2007 2006 1,820,279 663,203 3.26 98.5% 5/31/2007 2006 1,589,480 633,042 3.27 89.3% 5/31/2007 2006 1,636,068 326,373 3.28 100.0% 5/31/2007 2006 1,489,075 484,684 3.29 95.2% 5/31/2007 2006 1,529,467 422,278 3.30 96.3% 5/31/2007 2006 1,360,570 392,880 3.31 96.7% 5/31/2007 2006 1,312,805 510,816 3.32 96.4% 5/31/2007 2006 1,673,240 514,562 3.33 92.3% 5/31/2007 2006 1,602,337 427,103 3.34 96.9% 5/31/2007 2006 1,267,403 263,425 3.35 96.8% 5/31/2007 2006 1,379,738 454,432 3.36 97.8% 5/31/2007 2006 1,361,881 418,895 3.37 100.0% 5/31/2007 2006 1,301,489 466,377 3.38 97.9% 5/31/2007 2006 1,626,655 786,523 3.39 97.3% 5/31/2007 2006 1,149,587 433,712 3.40 87.1% 5/31/2007 2006 1,501,675 580,298 3.41 93.3% 5/31/2007 2006 1,188,273 378,649 3.42 88.8% 5/31/2007 2006 950,456 293,059 3.43 94.3% 5/31/2007 2006 1,010,614 267,148 3.44 96.3% 5/31/2007 2006 1,194,957 289,354 3.45 98.1% 5/31/2007 2006 975,775 393,116 3.46 100.0% 5/31/2007 2006 1,172,191 484,778 3.47 96.2% 5/31/2007 2006 978,421 501,833 3.48 100.0% 5/31/2007 2006 1,119,010 360,118 3.49 100.0% 5/31/2007 2006 947,622 300,470 3.50 100.0% 5/31/2007 2006 980,243 265,626 3.51 100.0% 5/31/2007 2006 868,538 151,784 3.52 95.6% 5/31/2007 2006 921,110 242,826 4 564 99.3% 12/11/2006 2006 24,576,147 7,933,976 5 408,163 47.9% 12/31/2006 T12 36,704,754 21,530,835 6 162 99.4% 3/21/2007 2006 13,612,534 3,708,183 6.01 99.0% 3/21/2007 2006 9,056,660 2,612,651 6.02 100.0% 3/21/2007 2006 2,888,532 625,938 6.03 100.0% 3/21/2007 4/06-12/06 Ann'l 1,667,342 469,594 7 74,431 76.7% 12/29/2006 TTM 02/2007 38,882,045 28,164,161 7.01 77.2% 12/29/2006 TTM 02/2007 10,544,174 7,370,491 7.02 80.5% 12/29/2006 TTM 02/2007 10,480,343 7,267,250 7.03 73.5% 12/29/2006 TTM 02/2007 4,381,889 2,846,914 7.04 77.6% 12/29/2006 TTM 02/2007 9,168,166 7,519,849 7.05 68.5% 12/29/2006 TTM 02/2007 4,307,473 3,159,657 8 230 93.6% 3/1/2007 2006 10,670,873 5,270,824 9 171 88.5% 3/22/2007 2006 10,914,183 4,604,853 10 311 88.7% 3/26/2007 Jan-Oct `06 Ann'l 8,399,873 3,084,664 11 253 81.9% 3/1/2007 2006 11,880,261 4,584,596 12 133 99.4% 2/16/2007 2006 9,588,066 2,983,210 13 356 86.5% 3/14/2007 2006 6,047,078 2,840,675 14 155 99.2% 4/1/2007 2006 7,578,203 2,693,594 15 363 88.9% 3/26/2007 Jan-Oct '06 Ann'l 5,305,758 1,986,696 16 324 99.3% 3/14/2007 2006 4,795,212 2,488,423 17 284 100.0% 4/4/2007 2006 5,074,799 1,353,054 18 313 98.0% 3/26/2007 Jan-Oct `06 Ann'l 4,202,256 1,653,283 19 149 96.0% 5/1/2007 2006 4,327,771 1,217,758 20 175,299 68.4% 12/31/2006 T-12 10,294,481 6,061,572 21 56,180 94.0% 1/31/2007 2006 5,249,158 1,929,964 21.01 92.3% 1/31/2007 2006 3,531,798 1,310,403 21.02 96.9% 1/31/2007 2006 1,717,360 619,561 22 215 95.3% 4/1/2007 2006 4,240,181 1,537,889 22.01 99.0% 4/1/2007 2006 2,265,552 801,967 22.02 91.2% 4/1/2007 2006 1,974,629 735,922 23 193,421 80.2% 3/31/2007 T-12 Mos Mar-07 6,571,032 3,260,116 24 39 94.0% 3/26/2007 2006 4,131,685 1,223,224 25 88,051 92.1% 3/8/2007 2006 3,973,756 1,667,990 26 70,281 76.6% 2/28/2007 TTM 02/2007 23,572,558 16,144,603 27 65,637 96.3% 5/7/2007 2006 5,009,887 2,281,278 28 91,328 91.3% 4/23/2007 T-12 4,287,828 1,309,008 29 30 97,484 90.6% 2/22/2007 T12 Thru 2/07 4,030,998 1,876,697 31 94,890 97.5% 3/8/2007 2006 3,223,841 1,412,709 32 174 99.2% 4/11/2007 2006 3,216,471 1,205,686 33 79,301 65.3% 12/31/2006 2006 13,751,747 10,888,743 34 108 96.6% 4/18/2007 2006 3,248,901 769,549 35 283 91.2% 3/1/2007 36 124 95.8% 4/30/2007 37 61 97.4% 3/6/2007 2006 3,298,559 1,489,804 38 66,327 83.9% 4/1/2007 39 136,126 76.3% 12/31/2006 T-12 (ending 3/07) 7,447,018 5,131,790 40 4,167 100.0% 3/4/2007 41 79 87.5% 4/18/2007 2006 2,242,874 425,880 42 319 97.4% 4/23/2007 2006 3,561,020 1,197,679 43 1,382 100.0% 5/30/2007 44 407 100.0% 3/23/2007 2006 1,393,372 666,681 45 85,668 89.9% 1/31/2007 2006 3,103,307 1,720,282 46 148 96.8% 1/1/2007 47 111 100.0% 4/12/2007 2006 2,220,930 610,922 48 190 100.0% 3/13/2007 2006 2,208,802 705,024 49 116,118 96.7% 4/30/2007 2006 1,792,447 1,018,092 50 127 88.6% 4/16/2007 2006 1,738,503 374,520 51 87 100.0% 4/20/2007 52 51,859 92.6% 4/24/2007 T12 2,138,716 692,767 53 174 91.3% 6/1/2007 54 246 95.3% 3/21/2007 2006 1,703,235 689,655 55 15,152 74.5% 3/14/2007 56 76 98.5% 4/12/2007 2006 1,541,226 386,228 57 118 86.5% 4/30/2007 2006 2,226,490 914,209 57.01 83.1% 4/30/2007 57.02 100.0% 4/30/2007 58 307 100.0% 4/16/2007 58.01 100.0% 4/16/2007 58.02 100.0% 4/16/2007 58.03 100.0% 4/16/2007 58.04 100.0% 4/16/2007 58.05 100.0% 4/16/2007 59 126,923 90.4% 3/28/2007 2006 1,239,906 549,070 60 154 100.0% 4/18/2007 2006 1,538,806 399,320 61 68,000 96.3% 3/9/2007 2006 1,915,090 885,796 62 93,525 89.7% 2/23/2007 T-12 (1/07) 6,865,453 5,646,968 63 191 91.7% 4/4/2007 64 312 100.0% 1/30/2007 65 149 100.0% 1/1/2007 66 51,235 91.4% 5/22/2007 T12 2,365,305 1,258,138 67 220 90.4% 3/7/2007 2006 1,508,820 635,691 68 167 95.4% 5/7/2007 2006 1,400,322 405,991 69 53,704 93.1% 3/27/2007 70 117,482 89.6% 2/28/2007 T-12 (ending Feb 07) 2,814,160 1,729,801 71 22 100.0% 3/13/2007 72 217 90.2% 5/7/2007 2006 1,099,418 395,753 73 159 75.9% 5/8/2007 2006 1,263,848 783,089 74 397 87.0% 5/1/2007 75 50,093 96.3% 4/24/2007 T12 1,716,140 708,899 76 135 98.5% 5/22/2007 2006 1,472,769 565,808 77 63,314 93.5% 3/28/2007 2006 1,280,400 629,573 78 80 72.9% 4/24/2007 2006 2,925,104 1,463,492 79 200 100.0% 5/1/2007 80 36,491 95.1% 3/6/2007 12 month ending May 2006 1,791,647 750,352 81 101 95.7% 3/6/2007 2006 1,161,543 232,513 82 180 90.1% 5/11/2007 82.01 100.0% 5/11/2007 82.02 74.5% 5/11/2007 83 77,652 86.4% 5/11/2007 Statement 2006 1,490,960 665,975 84 126 94.5% 4/18/2007 2006 897,850 260,762 85 181 100.0% 4/1/2007 2006 1,611,451 629,763 86 538 100.0% 5/11/2007 87 149 100.0% 4/12/2007 88 322 70.1% 5/10/2007 89 251 100.0% 4/30/2007 2006 896,636 319,878 90 70 98.9% 4/18/2007 2006 1,146,967 372,437 91 43,441 96.2% 4/24/2007 2006 1,893,370 1,291,071 92 57 93.2% 4/30/2007 2006 1,133,727 326,238 93 200 100.0% 3/6/2007 94 181 90.8% 3/15/2007 2005 1,027,907 337,580 95 37,755 99.5% 2/5/2007 2006 1,830,616 1,147,618 96 34,975 95.1% 3/6/2007 T-12 Thru June 2006 1,243,180 547,783 97 87,429 64.1% 3/31/2007 T12 1,984,116 1,445,470 98 138 100.0% 4/30/2007 Statement 2006 1,171,054 453,150 99 38,068 94.3% 5/22/2007 Statement 2006 1,159,384 620,676 100 58 100.0% 4/17/2007 101 230 81.5% 4/1/2007 102 68 100.0% 3/23/2007 Statement 2006 668,373 87,790 103 157 100.0% 4/30/2007 2006 854,351 243,106 104 306 87.8% 5/15/2007 105 9 100.0% Various 105.01 100.0% 4/16/2007 105.02 100.0% 4/16/2007 105.03 100.0% 4/16/2007 105.04 100.0% 1/29/2007 105.05 100.0% 1/29/2007 106 168 83.6% 3/22/2007 107 282 100.0% 5/30/2007 Statement 2006 621,854 163,205 108 27,255 87.7% 12/20/2006 2006 1,125,660 598,957 109 109 98.5% 4/1/2007 110 88 100.0% 5/22/2007 2006 849,276 537,078 111 144 93.1% 4/10/2007 2006 479,032 173,027 112 71,212 98.5% 4/3/2007 2006 511,978 214,052 113 73,016 95.2% 4/16/2007 114 52,410 95.2% 2/12/2007 2006 642,305 313,105 115 60 98.3% 3/23/2007 2005 682,309 191,706 116 216 85.9% 3/1/2007 117 56,000 56.2% 12/31/2006 T12 11/06 1,284,323 847,193 118 129 95.6% 1/19/2007 Statement 2006 582,048 107,886 119 125 97.9% 4/1/2007 120 61,667 91.7% 4/30/2007 Statement 2006 367,237 207,855 121 20 93.3% 4/1/2007 122 29,661 66.4% 2/28/2007 T-12 2/2007 1,421,501 771,338 123 15 100.0% 2/13/2007 2006 (w/o M.L) 524,792 53,842 124 129 100.0% 2/22/2007 125 53 95.6% 12/1/2006 2006 573,916 173,681 126 178 100.0% 3/7/2007 127 60,784 98.0% 5/7/2007 2006 353,875 162,435 128 40 100.0% 5/1/2007 2006 374,412 81,024 129 51 100.0% 5/1/2007 2006 361,905 84,605 130 162 100.0% 1/8/2007 131 17 100.0% 2/13/2007 132 127 100.0% 4/18/2007 Statement 2006 255,922 77,489 133 97 100.0% 12/7/2006 134 84 100.0% 12/7/2006 135 57 100.0% 3/5/2007 136 42 100.0% 5/17/2007 Statement 2006 291,940 77,259 137 73 100.0% 4/18/2007 Statement 2006 228,768 76,421 138 50,677 37.5% 4/30/2007 Year Ended 2006 396,170 247,713 139 28 100.0% 3/5/2007 140 273 100.0% 5/30/2007 141 136 100.0% 4/20/2007 142 55 100.0% 3/5/2007 143 277 100.0% 4/1/2007 MORTGAGE UW NET LOAN MOST RECENT MOST RECENT OPERATING UW NET NUMBER NOI ($) NCF ($) UW REVENUES ($) UW EXPENSES ($) INCOME ($) CASH FLOW ($) - -------------------------------------------------------------------------------------------------------------------------------- 1 207,820,430 207,820,429 354,178,858 112,315,490 241,811,107 198,385,886 1.01 19,364,825 19,364,825 41,074,705 14,894,479 26,180,226 25,307,068 1.02 20,383,775 20,383,775 30,545,603 7,021,511 23,524,092 22,263,095 1.03 15,474,857 15,474,857 28,071,027 8,301,024 19,770,003 18,616,234 1.04 16,104,255 16,104,255 30,980,759 12,711,966 18,268,793 17,388,129 1.05 15,405,541 15,405,541 24,118,681 7,495,676 16,623,006 15,469,519 1.06 9,838,199 9,838,198 17,634,675 5,634,675 11,838,738 11,014,878 1.07 8,575,097 8,575,097 13,695,876 4,460,723 9,235,154 8,370,682 1.08 10,562,260 10,562,260 14,212,550 4,356,452 9,856,098 9,183,434 1.09 6,834,261 6,834,261 12,942,281 3,754,953 9,187,329 8,466,919 1.10 4,633,934 4,633,934 11,000,543 3,398,937 7,701,606 7,127,979 1.11 3,739,160 3,739,160 10,080,811 2,814,064 7,266,746 6,801,602 1.12 2,887,632 2,887,632 6,306,620 2,302,082 4,004,538 3,555,517 1.13 4,327,320 4,327,320 8,901,737 3,370,195 5,531,542 5,225,760 1.14 3,183,144 3,183,144 6,692,458 2,332,365 4,360,093 3,898,128 1.15 3,554,775 3,554,775 6,512,906 1,854,476 4,667,430 4,199,874 1.16 2,900,420 2,900,420 5,101,921 2,523,180 2,578,741 2,376,221 1.17 2,153,661 2,153,661 3,941,992 1,323,042 2,618,950 2,352,485 1.18 21,711,497 21,711,497 30,503,227 8,733,694 21,769,534 8,066,030 1.19 9,108,594 9,108,594 15,077,516 3,851,100 11,226,415 5,900,879 1.20 27,077,224 27,077,224 36,782,970 11,180,896 25,602,074 12,801,453 2 71,738,611 64,867,797 198,916,263 122,171,704 76,744,559 68,787,909 2.01 6,811,575 6,180,971 13,362,517 6,847,614 6,514,903 5,980,402 2.02 4,543,726 4,112,889 9,281,728 4,852,768 4,428,960 4,057,691 2.03 3,142,603 2,760,249 8,630,194 4,706,607 3,923,587 3,578,379 2.04 3,476,768 3,168,703 6,688,290 3,199,469 3,488,821 3,221,289 2.05 2,765,763 2,501,849 5,890,566 3,037,384 2,853,183 2,617,560 2.06 2,576,774 2,332,485 5,307,789 2,813,695 2,494,093 2,281,782 2.07 2,526,692 2,526,692 5,347,165 2,662,707 2,684,458 2,470,571 2.08 2,184,316 1,932,137 5,425,496 3,086,606 2,338,890 2,121,871 2.09 1,910,837 1,696,218 4,559,692 2,582,647 1,977,045 1,794,657 2.10 1,958,803 1,958,803 5,423,525 3,395,893 2,027,632 1,810,691 2.11 2,033,984 1,784,981 5,226,109 3,120,071 2,106,038 1,896,994 2.12 1,629,724 1,434,656 4,284,333 2,525,305 1,759,028 1,587,655 2.13 1,833,732 1,619,194 4,468,235 2,660,033 1,808,202 1,629,473 2.14 1,596,548 1,387,326 4,465,316 2,677,378 1,787,937 1,609,325 2.15 1,788,245 1,578,886 4,333,173 2,606,348 1,726,825 1,553,498 2.16 1,541,210 1,541,210 4,547,066 2,865,114 1,681,952 1,500,069 2.17 1,504,050 1,326,444 3,784,645 2,158,962 1,625,683 1,474,297 2.18 824,730 669,644 4,311,475 2,657,412 1,654,063 1,481,604 2.19 1,408,119 1,229,114 3,815,526 2,413,836 1,401,690 1,249,069 2.20 1,225,944 1,225,944 3,387,422 2,156,175 1,231,248 1,095,751 2.21 1,454,677 1,248,688 4,339,613 2,781,606 1,558,008 1,384,423 2.22 1,279,685 1,279,685 3,434,208 2,130,215 1,303,993 1,166,625 2.23 1,414,342 1,224,352 3,905,154 2,535,518 1,369,637 1,213,431 2.24 1,178,594 984,706 4,200,731 2,820,756 1,379,975 1,211,946 2.25 1,204,380 1,034,364 3,659,641 2,383,942 1,275,699 1,129,314 2.26 1,018,326 1,018,326 4,036,454 2,945,363 1,091,092 929,633 2.27 1,017,268 847,231 3,827,157 2,491,969 1,335,188 1,182,102 2.28 1,130,418 1,130,418 3,414,469 2,354,908 1,059,561 922,982 2.29 711,711 551,460 3,632,414 2,491,293 1,141,121 995,824 2.30 989,782 839,974 3,263,776 2,115,378 1,148,398 1,017,847 2.31 1,153,243 990,710 3,531,032 2,368,959 1,162,073 1,020,831 2.32 972,602 812,337 3,582,407 2,408,562 1,173,845 1,030,549 2.33 898,030 898,030 3,234,583 2,298,397 936,186 806,803 2.34 901,124 901,124 3,193,404 2,332,044 861,360 733,624 2.35 935,537 806,837 2,889,331 1,775,731 1,113,600 998,027 2.36 846,491 846,491 3,094,979 2,129,166 965,813 842,014 2.37 911,501 771,860 2,897,601 1,957,932 939,669 823,765 2.38 838,362 684,071 3,289,451 2,289,917 999,534 867,956 2.39 891,745 749,112 2,899,727 2,013,536 886,191 770,202 2.40 909,607 761,901 3,138,816 2,158,271 980,545 854,993 2.41 841,111 841,111 2,578,658 1,720,716 857,942 754,796 2.42 763,063 763,063 2,800,092 2,017,501 782,592 670,588 2.43 563,868 563,868 3,287,898 2,419,981 867,917 736,401 2.44 376,327 250,320 2,662,866 2,116,875 545,991 439,476 2.45 799,866 646,555 3,304,376 2,334,618 969,758 837,583 2.46 452,808 452,808 2,277,163 1,752,528 524,635 433,548 3 74,463,711 72,954,190 119,771,771 39,393,196 80,378,575 74,964,784 3.01 3,269,626 3,183,605 5,371,612 1,865,810 3,505,803 3,254,062 3.02 3,182,076 3,124,701 4,244,565 1,033,049 3,211,516 2,983,928 3.03 2,014,656 1,991,935 4,539,104 1,735,968 2,803,136 2,605,612 3.04 3,135,541 3,021,686 4,110,269 1,006,804 3,103,466 2,849,278 3.05 3,299,406 3,196,266 4,677,930 1,294,643 3,383,287 3,080,036 3.06 2,815,963 2,774,967 5,199,994 2,447,503 2,752,491 2,603,536 3.07 2,236,930 2,208,806 3,894,125 1,312,526 2,581,599 2,360,522 3.08 2,349,088 2,281,731 2,888,591 514,871 2,373,720 2,241,995 3.09 2,946,979 2,919,741 3,700,093 786,525 2,913,568 2,745,418 3.10 1,841,067 1,818,359 3,292,012 1,119,307 2,172,704 2,046,231 3.11 2,148,565 2,137,709 3,475,766 1,214,640 2,261,127 2,162,758 3.12 2,501,256 2,429,442 3,168,325 716,434 2,451,891 2,284,906 3.13 2,051,028 2,037,753 3,461,155 991,429 2,469,726 2,388,833 3.14 2,537,729 2,464,362 3,658,269 1,046,284 2,611,985 2,410,318 3.15 1,299,993 1,283,530 2,895,472 1,131,642 1,763,830 1,663,965 3.16 1,299,419 1,286,771 2,515,288 911,090 1,604,198 1,486,528 3.17 1,812,028 1,793,407 2,830,217 1,033,884 1,796,334 1,647,125 3.18 1,365,707 1,352,646 2,314,522 737,045 1,577,477 1,503,785 3.19 1,547,992 1,499,138 2,762,973 992,068 1,770,905 1,597,905 3.20 1,624,767 1,586,624 2,218,353 401,656 1,816,697 1,720,380 3.21 1,290,432 1,198,025 2,747,816 1,378,617 1,369,199 1,144,651 3.22 1,272,473 1,256,650 2,862,276 1,350,813 1,511,463 1,433,139 3.23 1,256,047 1,239,914 2,200,779 703,766 1,497,013 1,467,579 3.24 1,163,347 1,132,020 1,718,227 639,296 1,078,930 1,023,505 3.25 1,157,076 1,113,203 1,782,001 645,821 1,136,180 1,005,755 3.26 956,438 936,017 1,929,807 825,890 1,103,917 965,314 3.27 1,309,695 1,271,948 1,743,056 356,991 1,386,065 1,265,311 3.28 1,004,391 997,248 1,728,895 601,894 1,127,002 1,100,600 3.29 1,107,189 1,100,535 1,555,630 469,631 1,085,999 1,024,459 3.30 967,691 957,859 1,586,491 442,454 1,144,037 1,097,205 3.31 801,990 795,043 1,518,667 568,507 950,161 922,830 3.32 1,158,678 1,126,994 1,701,078 575,316 1,125,761 1,050,441 3.33 1,175,234 1,162,669 1,652,632 432,603 1,220,029 1,147,357 3.34 1,003,977 994,921 1,325,129 263,403 1,061,726 1,019,035 3.35 925,306 916,913 1,500,746 499,256 1,001,491 954,995 3.36 942,987 925,845 1,368,467 456,320 912,147 819,071 3.37 835,112 810,390 1,557,232 555,600 1,001,631 915,615 3.38 840,132 827,022 1,877,001 835,019 1,041,982 954,616 3.39 715,875 699,647 1,278,934 464,938 813,996 739,001 3.40 921,377 888,042 1,621,225 631,588 989,637 895,014 3.41 809,624 783,957 1,203,641 399,406 804,235 736,595 3.42 657,397 650,070 1,084,011 316,660 767,350 742,227 3.43 743,466 736,694 1,110,109 269,508 840,600 812,970 3.44 905,603 897,952 1,183,554 304,263 879,291 842,680 3.45 582,658 576,374 1,250,722 461,142 789,580 766,910 3.46 687,413 667,985 1,324,688 527,365 797,323 741,633 3.47 476,588 450,273 1,120,103 541,680 578,423 497,588 3.48 758,892 731,517 1,242,716 451,709 791,008 721,809 3.49 647,153 623,028 1,041,732 374,634 667,097 603,747 3.50 714,617 707,918 1,025,107 346,402 678,704 651,099 3.51 716,755 711,845 892,594 159,314 733,280 715,655 3.52 678,284 672,496 818,071 250,214 567,857 549,260 4 16,642,171 16,642,171 32,095,918 17,291,686 14,804,232 14,768,802 5 15,173,919 15,173,919 36,704,491 22,115,122 14,589,369 13,121,189 6 9,904,351 9,836,496 13,558,052 4,044,281 9,513,771 9,091,455 6.01 6,444,009 6,400,776 8,641,656 2,641,223 6,000,433 5,740,205 6.02 2,262,594 2,248,281 2,708,348 596,543 2,111,804 2,018,925 6.03 1,197,748 1,187,438 2,208,048 806,514 1,401,533 1,332,324 7 10,717,884 8,667,771 40,705,261 28,471,140 12,234,121 10,136,737 7.01 3,173,683 2,541,033 10,802,352 7,380,260 3,422,093 2,773,951 7.02 3,213,093 2,689,075 10,885,934 7,239,503 3,646,431 3,102,134 7.03 1,534,975 1,315,312 4,594,477 2,812,920 1,781,556 1,551,833 7.04 1,648,317 1,189,909 9,832,261 7,763,071 2,069,190 1,577,577 7.05 1,147,816 932,442 4,590,237 3,275,386 1,314,852 1,131,242 8 5,400,049 5,337,975 14,240,763 5,399,806 8,840,957 8,317,432 9 6,309,330 6,255,364 12,402,854 4,651,922 7,750,932 7,315,068 10 5,315,209 5,315,209 13,087,597 4,608,164 8,479,433 8,385,921 11 7,295,665 7,221,489 10,792,437 4,077,457 6,714,980 6,385,216 12 6,604,856 6,399,642 11,989,446 2,616,741 9,372,704 9,155,416 13 3,206,403 3,178,417 7,975,766 2,912,651 5,063,115 4,851,193 14 4,884,609 4,830,763 7,632,647 2,619,622 5,013,025 4,605,888 15 3,319,062 3,319,062 8,995,224 2,998,683 5,996,541 5,888,017 16 2,306,789 2,281,775 6,895,234 2,574,408 4,320,826 4,139,554 17 3,721,745 3,705,179 5,453,809 1,767,014 3,686,795 3,422,168 18 2,548,973 2,548,973 8,140,927 2,659,048 5,481,878 5,481,878 19 3,110,013 3,017,205 4,453,859 1,209,707 3,244,151 3,057,096 20 4,232,909 4,232,909 10,836,965 6,189,120 4,647,845 4,105,997 21 3,319,194 3,119,154 5,238,824 1,932,576 3,306,248 3,106,208 21.01 2,221,395 2,109,675 3,481,237 1,310,548 2,170,689 2,058,969 21.02 1,097,799 1,009,479 1,757,587 622,028 1,135,559 1,047,239 22 2,702,292 2,653,398 4,507,216 1,553,847 2,953,369 2,773,048 22.01 1,463,585 1,435,686 2,342,304 805,575 1,536,729 1,441,076 22.02 1,238,707 1,217,712 2,164,912 748,272 1,416,640 1,331,972 23 3,310,916 3,048,075 6,801,705 3,535,311 3,266,394 2,983,398 24 2,908,461 2,815,305 4,243,368 1,132,113 3,111,255 2,987,936 25 2,305,766 2,305,766 4,340,233 1,680,124 2,660,109 2,660,109 26 7,427,955 6,249,327 23,625,587 15,954,085 7,671,502 6,490,223 27 2,728,609 2,650,909 5,188,212 2,367,702 2,820,510 2,742,810 28 2,978,820 2,886,570 4,422,051 1,467,381 2,954,670 2,862,420 29 30 2,154,301 2,154,301 4,238,699 1,945,535 2,293,164 2,293,164 31 1,811,132 1,811,132 3,483,525 1,296,929 2,186,596 2,186,596 32 2,010,785 1,964,357 3,565,934 1,292,519 2,273,415 2,069,224 33 2,863,004 2,312,934 14,683,795 11,395,840 3,287,955 2,700,604 34 2,479,352 2,452,134 3,323,793 779,136 2,544,658 2,378,557 35 2,847,501 531,581 2,315,920 2,300,729 36 2,562,226 592,304 1,969,922 1,954,926 37 1,808,755 1,778,441 4,798,836 2,555,763 2,243,073 2,096,343 38 3,350,566 1,446,729 1,903,837 1,805,837 39 2,315,228 2,315,228 7,446,827 4,986,962 2,459,865 2,161,992 40 1,616,840 74,538 1,542,302 1,541,642 41 1,816,994 1,785,336 2,422,057 621,289 1,800,768 1,667,763 42 2,363,341 2,355,862 3,370,378 1,177,018 2,193,360 2,076,967 43 1,994,101 299,711 1,694,390 1,673,003 44 726,691 717,391 2,487,611 740,994 1,746,617 1,623,842 45 1,383,025 1,305,326 3,181,086 1,634,053 1,547,033 1,469,333 46 2,586,156 912,808 1,673,348 1,603,024 47 1,610,008 1,545,867 2,167,791 612,698 1,555,094 1,380,817 48 1,503,778 1,494,411 2,103,526 630,914 1,472,612 1,349,091 49 774,355 736,355 2,193,310 849,979 1,343,331 1,305,331 50 1,363,983 1,335,093 1,941,639 521,476 1,420,163 1,391,273 51 2,376,822 713,745 1,663,077 1,479,048 52 1,445,949 1,383,549 2,176,924 851,287 1,325,638 1,263,238 53 1,547,438 370,431 1,177,007 1,140,680 54 1,013,580 1,004,580 1,838,371 734,419 1,103,952 1,033,017 55 2,949,088 1,098,925 1,850,163 1,809,354 56 1,154,998 1,136,899 1,648,136 413,263 1,234,873 1,127,116 57 1,312,281 1,295,035 2,586,722 859,421 1,727,301 1,593,604 57.01 57.02 58 1,492,719 349,510 1,143,209 1,115,240 58.01 498,222 146,817 351,405 342,724 58.02 311,722 75,492 236,230 230,444 58.03 304,251 64,042 240,209 234,353 58.04 191,901 30,880 161,021 157,121 58.05 186,622 32,279 154,343 150,599 59 690,836 665,044 1,348,360 429,847 918,513 892,721 60 1,139,486 1,130,958 1,572,711 395,236 1,177,474 1,100,164 61 1,029,294 970,158 1,881,000 878,238 1,002,762 943,626 62 1,218,485 1,183,735 7,498,650 6,174,693 1,323,958 1,289,208 63 1,388,950 243,107 1,145,843 1,110,929 64 1,592,740 192,999 1,399,742 1,395,602 65 1,359,634 319,141 1,040,493 1,027,648 66 1,107,167 1,046,417 2,411,711 1,293,403 1,118,308 1,057,558 67 873,129 849,462 1,511,009 568,725 942,284 887,132 68 994,331 987,258 1,424,937 419,482 1,005,455 977,219 69 1,715,574 772,060 943,514 889,514 70 1,084,359 1,060,359 3,083,375 1,931,672 1,151,703 1,127,703 71 1,146,179 11,462 1,134,717 1,013,142 72 703,665 698,569 1,437,751 356,651 1,081,100 1,028,977 73 480,759 465,569 1,797,559 817,742 979,817 896,275 74 897,169 184,205 712,964 704,404 75 1,007,241 964,041 1,687,549 769,485 918,064 874,864 76 906,961 886,911 1,696,360 710,754 985,606 888,845 77 650,827 650,827 1,349,348 561,140 788,208 788,208 78 1,461,612 1,444,507 2,717,465 1,435,397 1,282,069 1,093,433 79 1,162,104 293,841 868,263 838,090 80 1,041,295 984,295 1,795,124 801,594 993,530 936,530 81 929,030 918,630 1,151,488 234,528 916,960 857,509 82 1,278,460 337,244 941,215 877,632 82.01 826,356 213,814 612,541 581,280 82.02 452,104 123,430 328,674 296,352 83 824,985 370,327 1,491,036 644,425 846,611 811,178 84 637,088 629,133 1,158,607 282,349 876,258 836,316 85 981,688 970,662 1,668,478 675,405 993,073 929,397 86 1,172,378 349,420 822,958 802,298 87 1,223,221 421,822 801,399 736,580 88 936,057 306,687 629,369 591,406 89 576,758 567,980 1,001,593 315,305 686,288 648,927 90 774,530 754,430 1,182,476 421,983 760,492 701,827 91 602,299 533,665 1,928,169 1,261,663 666,506 597,872 92 807,489 774,020 1,223,539 379,203 844,337 744,327 93 917,496 204,220 713,276 679,917 94 690,327 683,775 980,604 297,033 683,571 650,455 95 682,998 633,998 1,821,429 1,063,562 757,867 708,867 96 695,397 654,797 1,236,944 591,358 645,586 604,986 97 538,646 535,740 2,409,952 1,531,397 878,555 806,257 98 717,904 717,904 1,155,193 490,221 664,972 621,677 99 538,708 538,708 1,202,429 605,275 597,154 548,050 100 682,869 29,408 653,461 642,709 101 809,072 248,903 560,169 547,508 102 580,583 580,583 935,090 290,804 644,286 571,391 103 611,245 605,508 835,899 247,670 588,229 553,519 104 588,450 102,518 485,932 465,378 105 533,706 25,998 507,708 507,708 105.01 209,034 2,435 206,599 206,599 105.02 122,070 21,203 100,867 100,867 105.03 86,602 1,009 85,593 85,593 105.04 98,000 1,141 96,859 96,859 105.05 18,000 210 17,790 17,790 106 733,101 224,992 508,109 476,542 107 458,649 458,649 732,185 190,244 541,941 517,615 108 526,703 470,807 1,188,106 668,297 519,809 463,913 109 873,431 414,726 458,706 399,167 110 312,198 300,199 903,614 475,429 428,186 356,648 111 306,005 301,138 571,977 181,687 390,290 355,065 112 297,926 281,426 566,064 194,515 371,549 355,049 113 544,005 206,291 337,714 325,114 114 329,200 312,766 635,454 291,898 343,556 327,122 115 490,603 479,913 698,773 246,535 452,238 418,993 116 456,234 102,921 353,313 344,442 117 437,130 385,757 1,402,854 944,188 458,666 402,552 118 474,162 452,919 549,028 120,983 428,045 423,243 119 576,280 229,238 347,042 310,803 120 159,382 159,382 518,157 198,137 320,020 308,020 121 432,535 119,367 313,168 291,506 122 650,163 593,303 1,363,505 818,978 544,527 473,845 123 470,951 448,001 455,175 4,552 450,623 404,838 124 453,034 105,003 348,031 314,808 125 400,235 387,396 708,358 223,168 485,190 406,286 126 411,801 105,037 306,764 295,851 127 191,440 181,240 384,370 159,741 224,629 214,429 128 293,388 286,513 548,128 288,895 259,232 252,357 129 277,300 271,924 357,790 102,782 255,008 249,632 130 330,675 84,241 246,434 244,952 131 306,539 3,065 303,473 274,522 132 178,434 178,434 265,456 77,718 187,738 184,441 133 260,527 2,742 257,785 255,616 134 239,400 5,040 234,360 231,997 135 184,771 5,090 179,681 166,310 136 214,681 214,681 267,167 96,648 170,519 155,346 137 152,346 152,346 244,210 77,003 167,206 157,288 138 148,457 132,457 414,065 261,496 152,569 136,006 139 116,733 1,167 115,566 101,254 140 186,782 31,066 155,716 153,557 141 219,633 53,607 166,027 164,190 142 151,961 38,439 113,522 105,272 143 178,429 39,627 138,802 133,011 MORTGAGE LOAN LARGEST TENANT LARGEST TENANT LARGEST TENANT NUMBER LARGEST TENANT NAME SQ. FT. % OF NRA EXP. DATE - ------------------------------------------------------------------------------------------------------------------------- 1 Various Various Various Various 1.01 Fulbright & Jaworski 127,804 18.8% 6/30/2015 1.02 GSA - Department of Defense 549,317 60.7% Multiple Spaces 1.03 Wells Fargo Bank, N.A. 188,141 19.9% Multiple Spaces 1.04 Commodity Future 161,785 22.7% 9/30/2015 1.05 Booz Allen Hamilton 714,237 97.7% Multiple Spaces 1.06 Infospace 130,826 27.6% 2/28/2013 1.07 Expedia 265,713 57.4% 9/30/2009 1.08 HDR Engineering 54,290 11.7% 12/31/2012 1.09 US Bank National 45,784 9.8% 12/31/2013 1.10 DHS - GS-11B-01687 72,591 24.6% Multiple Spaces 1.11 SunTrust Bank 59,533 18.1% Multiple Spaces 1.12 Fiserv Seattle 36,940 14.7% 7/31/2008 1.13 GSA - Department of Justice 69,524 42.4% 1/31/2008 1.14 High Tech Institute 31,244 11.3% 6/30/2014 1.15 XO Communications 167,495 77.4% 11/30/2007 1.16 New York Times 22,145 21.5% 12/31/2009 1.17 Serena Software 28,803 19.3% 1/31/2012 1.18 College Entrance Exam 70,834 9.3% 9/30/2009 1.19 BAE Systems 73,300 19.3% 5/31/2014 1.20 Perkins Coie 285,716 26.5% Multiple Spaces 2 2.01 2.02 2.03 2.04 2.05 2.06 2.07 2.08 2.09 2.10 2.11 2.12 2.13 2.14 2.15 2.16 2.17 2.18 2.19 2.20 2.21 2.22 2.23 2.24 2.25 2.26 2.27 2.28 2.29 2.30 2.31 2.32 2.33 2.34 2.35 2.36 2.37 2.38 2.39 2.40 2.41 2.42 2.43 2.44 2.45 2.46 3 Various Various Various Various 3.01 Century Theater 51,840 21.1% 9/30/2016 3.02 Regency Furniture 71,042 27.2% 5/31/2017 3.03 Publix 56,085 24.7% 11/3/2011 3.04 Belk 60,103 19.5% 10/9/2018 3.05 Kohl's 98,037 31.4% 1/31/2016 3.06 Kohl's 85,992 31.5% 1/31/2024 3.07 Kmart 95,810 34.1% 7/31/2009 3.08 Kohl's 84,000 34.9% 1/31/2018 3.09 Creative Basket Express 45,000 16.5% 3/15/2020 3.10 Beall's 66,700 29.4% 4/30/2016 3.11 Fresh Market 18,400 16.9% 2/28/2022 3.12 Value City 81,713 37.5% 3/31/2015 3.13 Harris Teeter 44,926 33.8% 4/30/2022 3.14 Kohl's 86,584 31.9% 2/2/2019 3.15 Ross Dress for Less 30,000 20.0% 1/31/2014 3.16 Publix 39,795 31.5% 11/30/2008 3.17 Linens 'N Things 30,700 16.5% 1/31/2011 3.18 Publix 44,271 33.9% 10/31/2022 3.19 Publix 65,537 42.9% 7/27/2011 3.20 Harris Teeter 46,750 39.2% 8/31/2020 3.21 Ross Dress for Less 42,862 17.6% 1/31/2013 3.22 Beall's 55,400 35.0% 4/30/2017 3.23 Shoprite 60,795 67.8% 6/30/2024 3.24 Publix 61,166 74.2% 5/31/2023 3.25 Publix 48,890 46.8% 8/21/2010 3.26 Big Lots 37,500 18.4% 1/31/2009 3.27 Office Depot 24,920 20.5% 12/31/2013 3.28 Publix 54,379 76.1% 7/31/2023 3.29 Michaels 23,764 35.7% 2/28/2010 3.30 Kroger 54,139 55.1% 10/31/2021 3.31 Publix 44,271 63.7% 9/30/2021 3.32 Kroger 64,905 47.1% 3/31/2019 3.33 Lowe's Foods 45,374 36.1% 9/21/2019 3.34 Kroger 54,166 59.8% 9/30/2023 3.35 Publix 44,271 52.7% 6/30/2021 3.36 Publix 53,096 55.8% 11/30/2011 3.37 Publix 37,888 32.2% 10/31/2019 3.38 Publix 42,968 45.9% 2/15/2009 3.39 Publix 48,555 68.8% 10/17/2010 3.40 Giant Eagle 70,000 54.6% 6/30/2016 3.41 Publix 47,813 63.3% 2/2/2014 3.42 Publix 44,271 60.4% 3/31/2022 3.43 Publix 44,271 65.4% 8/31/2023 3.44 Lowe's Foods 42,362 55.4% 4/15/2023 3.45 Publix 44,840 71.4% 9/30/2023 3.46 Publix 37,912 62.4% 3/13/2017 3.47 Publix 42,112 62.4% 4/17/2011 3.48 Winn-Dixie 51,261 69.3% 4/30/2017 3.49 Publix 47,814 69.4% 4/3/2014 3.50 Publix 44,271 66.1% 10/31/2021 3.51 Harris Teeter 36,000 73.3% 8/22/2021 3.52 Publix 44,271 76.5% 12/31/2022 4 Publicis 119,502 33.7% 8/30/2016 5 6 Various Various Various Various 6.01 Wegman's Food (Ground Lease) 130,000 30.1% 8/31/2024 6.02 Linens 'N Things 27,894 19.5% 1/31/2016 6.03 Sportsman's Warehouse 48,251 46.8% 11/30/2020 7 7.01 7.02 7.03 7.04 7.05 8 Continental Stock Transfer & Trust Company 35,000 8.5% 7/12/2011 9 Pottery Barn 29,850 5.5% 1/31/2018 10 AIG Marketing, Inc. 55,231 19.2% Multiple Spaces 11 Old Navy 15,023 5.1% 1/31/2009 12 Kohl's 203,000 38.7% Multiple Spaces 13 Weight Watchers Internat 30,160 16.2% 9/30/2017 14 California Family Health 20,593 5.0% 9/30/2007 15 Colliers Iliff Thorn & Company 20,707 12.5% 11/30/2016 16 WKP-Spier, LLC 26,800 16.1% 11/14/2010 17 Bally's Total Fitness 36,500 22.0% 6/30/2014 18 Chatham Capital 22,615 15.4% 2/28/2011 19 Belk 67,267 21.7% 1/31/2012 20 21 21.01 21.02 22 Various Various Various Various 22.01 Whole Foods 23,074 24.8% 2/28/2010 22.02 One Call Medical 10,350 12.3% 7/31/2009 23 24 National Distribution Centers, Inc. 525,632 56.4% 5/31/2008 25 26 27 28 29 30 31 32 Wal-Mart 46,475 27.0% 8/31/2018 33 34 Kohl's 80,684 29.6% 2/1/2019 35 HQ Global Workplaces, Inc 17,849 17.6% 12/31/2016 36 Kohl's 88,850 39.3% 10/4/2026 37 Ambling / University Park (Ground Lease) 239,556 54.2% 12/31/2049 38 39 40 HSBC USA, National Association 6,000 100.0% 10/7/2020 41 Wal-Mart 206,523 65.2% 10/25/2025 42 Saks Fifth Avenue 30,000 40.1% 8/21/2026 43 Yabu Pushelberg, Inc. 5,000 29.4% 4/30/2009 44 Wind-Up Entertainment, Inc 15,000 27.8% 9/30/2010 45 46 Publix 45,600 35.8% 12/31/2026 47 Bruno's Inc. 52,091 30.9% 5/31/2020 48 GSA (Multi TT) 93,665 100.0% 1/14/2016 49 50 Tuesday Morning 30,000 22.8% 1/15/2008 51 Mercury Computer Systems Inc. 185,327 100.0% 3/1/2017 52 53 Bi-Lo 46,904 52.7% 11/30/2024 54 Majestic Pearl & Stone 5,000 8.3% 6/30/2014 55 56 Goody's Family Clothing 40,000 22.1% 4/30/2011 57 Various Various Various Various 57.01 Piedmont Fayette Hospital 17,661 19.3% 9/30/2009 57.02 Mkt Street Mortgage 6,312 27.1% 4/30/2011 58 Various Various Various Various 58.01 RBI Southern California, Inc. 6,801 50.9% 12/31/2026 58.02 Retail Brokers, Inc. 8,902 100.0% 12/31/2026 58.03 RBI Management Services, LLC 9,010 100.0% 12/31/2026 58.04 Barness Papas Investments, LLC 6,000 100.0% 12/31/2026 58.05 Apex Architecture, LLC & Global 5,760 100.0% 12/31/2026 Retail Development Group, LLC 59 60 Bed Bath & Beyond 25,000 29.3% 1/31/2015 61 62 63 Piggly Wiggly 37,922 55.8% 5/31/2026 64 XSport Fitness 41,400 100.0% 12/31/2022 65 Dick's Sporting Goods 47,636 55.6% 1/31/2017 66 67 Skillnet Solutions 3,906 6.9% Multiple Spaces 68 Elam & Burke 16,444 23.3% 12/31/2010 69 70 71 Michaels Stores, Inc. 506,828 100.0% 6/30/2023 72 Wachovia Bank 4,200 8.2% 11/30/2020 73 Valley of California, Inc. 11,200 16.2% 1/31/2011 74 SPI Club 15,167 54.7% 11/30/2009 75 76 Health Plans 17,604 21.9% 4/30/2009 77 78 Manning, Fulton & Skinner 28,459 21.6% 9/30/2016 79 Fresh Market 21,442 40.9% 3/31/2022 80 81 Goody's Family Clothing 35,000 33.8% 10/31/2012 82 Various Various Various Various 82.01 Marshal Bank First 35,404 100.0% 11/30/2013 82.02 HDR Engineering 10,973 49.1% 7/31/2015 83 84 Harris Teeter (Ground Lease) 48,824 61.4% 8/4/2024 85 Anchor Health Centers 40,459 73.4% Multiple Spaces 86 HSBC Bank USA, National Association 3,711 21.6% 7/31/2015 87 Intrasight Tech, Inc 23,370 37.8% 9/30/2010 88 Credit Union 4,038 14.4% 7/31/2017 89 First Bank 6,529 18.6% 1/31/2017 90 BJ's Wholesale Club 68,160 54.3% 1/20/2019 91 92 Office Concepts 20,170 14.5% 12/31/2007 93 Dermatology Associates 15,900 39.8% 4/30/2016 94 CVS 9,350 21.4% 1/31/2011 95 96 97 98 Drs Aquino Coleman 22,580 46.3% 9/30/2018 99 100 Bunge Oils, Inc. 107,520 100.0% 4/30/2026 101 Barones Tuscany Grill 3,880 14.6% 1/1/2017 102 Complete Suite Furniture, Inc. 25,171 28.4% 7/31/2016 103 Lamp & Lighting of the Bower 8,578 22.4% 9/30/2014 104 Bio-Medical Applications Of NV, Inc. 9,000 45.9% 5/21/2017 105 Various Various Various Various 105.01 Value St. Louis Associates, LP 104,315 100.0% 4/30/2040 105.02 Alburquerque Plaza Office Investments, LLC 254,850 100.0% 11/30/2051 105.03 W.B.W. Partners, LLC 218,100 100.0% 3/2/2034 105.04 National City Bank 35,870 100.0% 6/10/2045 105.05 Crescent Real Estate Fund 8,712 100.0% 6/30/2051 106 Shoe Dept 4,829 14.4% 4/30/2012 107 Christopher Homes, LLC 10,492 52.7% 5/31/2012 108 109 T.N. Master Tile, LP 7,362 15.0% 12/31/2007 110 ARES Corporation 11,821 19.8% Multiple Spaces 111 GA Foot & Ankle 8,792 25.3% 5/31/2010 112 113 114 115 Food Depot 44,672 62.7% 11/30/2016 116 Washington Mutual 3,500 17.8% 3/31/2011 117 118 Isocracy Fitness, LLC 22,000 68.7% 11/30/2020 119 Cabinets & Designs 3,780 12.3% 6/30/2008 120 121 Central Parking System 161,127 90.6% 3/31/2015 122 123 K & K Integrated Logistics 229,500 100.0% 1/31/2022 124 Allied Health Professionals 13,409 50.5% 12/31/2013 125 Wallys Party Factory 12,000 18.7% 2/28/2012 126 OfficeMax 18,000 100.0% 1/31/2018 127 128 Pay Low Discount Foods 68,750 100.0% 5/31/2022 129 Wise Way 53,763 100.0% 5/31/2022 130 Walgreens 14,820 100.0% 11/30/2081 131 KK Integrated Logistics, Inc. 141,916 100.0% 1/31/2022 132 Kingswood Collision 12,743 77.3% 7/31/2014 133 Tractor Supply Company 21,688 100.0% 7/30/2020 134 Tractor Supply Company 23,627 100.0% 1/31/2021 135 Archives One, Inc. 32,416 100.0% 12/31/2021 136 Noridian 32,592 78.4% Multiple Spaces 137 Sherwin Williams Co. 8,430 36.2% 12/31/2007 138 139 ArchivesOne - Greensboro, NC 40,025 100.0% 1/31/2022 140 IHOP 4,022 100.0% 4/30/2026 141 National Tire & Battery 8,064 100.0% 11/30/2031 142 Archives One 20,000 100.0% 12/31/2021 143 Comerica Bank 3,608 100.0% 8/1/2016 MORTGAGE 2ND LARGEST 2ND LARGEST LOAN 2ND LARGEST TENANT TENANT NUMBER 2ND LARGEST TENANT NAME TENANT SQ. FT. % OF NRA EXP. DATE - ---------------------------------------------------------------------------------------------------------------- 1 Various Various Various Various 1.01 Shearman & Sterling 114,431 16.9% Multiple Spaces 1.02 Polk GSA 354,909 39.3% Multiple Spaces 1.03 King County 98,017 10.4% 7/31/2007 1.04 Jackson & Campbell 44,309 6.2% 5/31/2010 1.05 Northern VA Family Sv 3,500 0.5% 12/31/2007 1.06 Keybank National Association 103,701 21.9% 7/31/2010 1.07 Sierra Entertainment 128,040 27.6% 2/28/2010 1.08 Oracle USA 30,735 6.6% 3/31/2009 1.09 Business Service Center 35,759 7.7% 3/31/2009 1.10 GSA 47,198 16.0% 2/28/2011 1.11 HQ Global Workplaces 21,410 6.5% 3/31/2011 1.12 Orrtax Software 33,411 13.3% 9/30/2013 1.13 American Hospital Association 39,492 24.1% 8/31/2014 1.14 John L Scott Real Estate Servi 26,683 9.6% 4/30/2014 1.15 Stanley Martin 28,906 13.4% 1/31/2016 1.16 Jones Lang Lasalle 17,970 17.5% Multiple Spaces 1.17 Barclay Dean 13,148 8.8% 8/31/2012 1.18 Pfizer, Inc. 62,974 8.2% 9/30/2009 1.19 Federal Network Systems 42,802 11.2% 11/30/2008 1.20 Washington Mutual Bank 181,103 16.8% 12/31/2010 2 2.01 2.02 2.03 2.04 2.05 2.06 2.07 2.08 2.09 2.10 2.11 2.12 2.13 2.14 2.15 2.16 2.17 2.18 2.19 2.20 2.21 2.22 2.23 2.24 2.25 2.26 2.27 2.28 2.29 2.30 2.31 2.32 2.33 2.34 2.35 2.36 2.37 2.38 2.39 2.40 2.41 2.42 2.43 2.44 2.45 2.46 3 Various Various Various Various 3.01 Circuit City 38,983 15.9% 1/31/2017 3.02 Shoppers Food Warehouse 49,840 19.1% 9/30/2009 3.03 Ross Dress for Less 25,770 11.3% 1/31/2013 3.04 Publix 51,420 16.7% 2/11/2018 3.05 Marshall's 30,337 9.7% 1/31/2011 3.06 Stop & Shop 54,755 20.0% 10/31/2016 3.07 Publix 42,112 15.0% 4/6/2008 3.08 Martin's Food Store 67,656 28.1% 5/1/2040 3.09 Dick's Sporting Goods 45,000 16.5% 1/31/2017 3.10 Macy's 46,339 20.4% 3/31/2009 3.11 CVS 10,908 10.0% 10/4/2021 3.12 A & P Company 56,860 26.1% 12/31/2019 3.13 Yankelovich, Inc. 13,794 10.4% 7/31/2012 3.14 Bed Bath & Beyond 35,000 12.9% 1/31/2010 3.15 True Treasures 11,900 8.0% 12/31/2007 3.16 Anthony's 10,340 8.2% 12/31/2011 3.17 TJ Maxx 30,000 16.1% 11/30/2010 3.18 Remington Steakhouse 7,921 6.1% 8/31/2015 3.19 Home Shopping Network Out 16,619 10.9% 4/30/2009 3.20 CVS 10,125 8.5% 1/31/2021 3.21 Publix 35,930 14.8% 5/31/2012 3.22 Publix 54,379 34.4% 10/31/2022 3.23 Wawa 5,740 6.4% 8/31/2018 3.24 Hollywood Video 5,400 6.6% 7/31/2008 3.25 Fashion Bug 8,000 7.7% 1/31/2011 3.26 Publix 27,887 13.7% 12/31/2019 3.27 Petco 14,200 11.7% 9/30/2010 3.28 Natures Health Food 3,197 4.5% 9/30/2007 3.29 PetSmart 19,136 28.8% 1/31/2016 3.30 Jumpsters 5,600 5.7% 4/30/2013 3.31 Beef O'Brady's 2,625 3.8% 2/28/2012 3.32 Goody's Family Clothing 27,450 19.9% 4/30/2014 3.33 Dollar General 10,250 8.2% 4/30/2010 3.34 Green Tea Chinese Restaurant 3,150 3.5% 12/31/2008 3.35 Countrywide Home Loans 5,515 6.6% 3/31/2008 3.36 CVS 8,450 8.9% 10/31/2010 3.37 Beall's 12,000 10.2% 4/30/2010 3.38 Athlete's Foot 3,425 3.7% 3/31/2012 3.39 The REF Sports Bar & Grill 3,575 5.1% 10/31/2011 3.40 Once Upon A Child 6,400 5.0% 5/31/2008 3.41 Blockbuster 6,500 8.6% 11/30/2008 3.42 Blockbuster 4,800 6.6% 6/30/2012 3.43 Washington Mutual Bank 3,500 5.2% 10/28/2008 3.44 Dollar Tree Store 8,000 10.5% 4/30/2008 3.45 Starbucks 2,400 3.8% 2/28/2017 3.46 Hollywood Video 6,000 9.9% 10/24/2014 3.47 Dollar Tree 4,673 6.9% 2/28/2009 3.48 Advance Auto Parts 7,000 9.5% 12/31/2008 3.49 Blockbuster 4,000 5.8% 1/31/2008 3.50 Blockbuster 4,785 7.1% 12/31/2011 3.51 Italian Pie 3,054 6.2% 2/22/2012 3.52 Washington Mutual Bank 2,800 4.8% 3/31/2012 4 H&M Hennes & Mauritz 71,000 20.0% 1/30/2016 5 6 Various Various Various Various 6.01 Sports Authority 40,000 9.3% 7/31/2015 6.02 OfficeMax 20,100 14.0% 10/31/2014 6.03 Developer's Diversified-Master Lease 31,104 30.2% 11/11/2008 7 7.01 7.02 7.03 7.04 7.05 8 IT USA, Inc. 34,991 8.5% 4/30/2017 9 VF Outlet 28,585 5.3% 3/31/2012 10 Commonwealth Land Title Co 34,177 11.9% 5/6/2011 11 Finish Line 10,413 3.5% 1/31/2008 12 A & P Supermarket 51,419 9.8% 12/31/2017 13 Bilinguals, Inc. 18,850 10.1% Multiple Spaces 14 Southwestern Pacific Land Group 15,633 3.8% 6/6/2009 15 IBM 16,054 9.7% 7/31/2010 16 Mimeo.Com. Inc. 19,300 11.6% Multiple Spaces 17 Hewlett Packard 34,209 20.6% 3/31/2010 18 Marcus & Millichap Real Estate 15,256 10.4% 11/30/2010 19 Publix 51,420 16.6% 7/31/2018 20 21 21.01 21.02 22 Various Various Various Various 22.01 Ross Morgan 7,011 7.5% 7/31/2010 22.02 Rockhardbody Total Fitness 10,274 12.2% 1/15/2011 23 24 PGM Products 159,857 17.2% 12/31/2010 25 26 27 28 29 30 31 32 Wellington Theatre 8 20,490 11.9% 9/30/2008 33 34 Sports Authority 42,972 15.8% 8/31/2013 35 National University 13,157 13.0% 5/31/2012 36 Dick's Sporting Goods 45,000 19.9% 1/31/2018 37 AIG 69,298 15.7% 2/28/2009 38 39 40 41 Dollar Tree 11,007 3.5% 5/31/2009 42 The Beach Company 18,370 24.6% 3/31/2012 43 Sunglass Hut 4,500 26.5% 7/31/2019 44 Iridium Group 5,000 9.3% 2/28/2011 45 46 Marshalls 38,100 29.9% 10/31/2016 47 Gap 30,000 17.8% 1/31/2011 48 49 50 Lifestyle Family Fitness 27,662 21.1% 9/30/2010 51 52 53 West Marine 7,500 8.4% 2/28/2011 54 Graubard & Nihamin PC 5,000 8.3% 1/31/2013 55 56 Ingles Markets, Inc. 32,000 17.7% 9/30/2008 57 Various Various Various Various 57.01 PMCC - Department of Medicine 17,515 19.1% 11/30/2012 57.02 PMCC - Pediatrics 5,254 22.5% 11/30/2011 58 Various Various Various Various 58.01 RBI Management Services California, Inc. 6,555 49.1% 12/31/2026 58.02 58.03 58.04 58.05 59 60 Cost Plus World Market 18,300 21.5% 1/31/2015 61 62 63 R & A BBQ 3,200 4.7% 11/30/2011 64 65 Bed Bath & Beyond 22,000 25.7% 1/31/2017 66 67 Gerst AAP and Gerst Software 3,041 5.4% 9/30/2009 68 Perkins Cole 13,532 19.1% 6/14/2009 69 70 71 72 Las Curras Inc. 4,000 7.8% 2/28/2011 73 DAB Enterprises, Inc. 9,100 13.2% 8/31/2017 74 B&H Parking NA NA 1/1/2009 75 76 United medical 8,549 10.7% 11/30/2008 77 78 Branch Banking & Trust 27,543 20.9% 9/30/2008 79 O2 Fitness 13,842 26.4% 12/31/2013 80 81 Michaels Stores, Inc. 20,219 19.5% 8/31/2013 82 Various Various Various Various 82.01 82.02 Williams Insurance Agency, Inc. 5,687 25.4% 1/31/2015 83 84 Bio-M-Bos 3,616 4.5% 1/31/2012 85 Collier Surgery Center 9,635 17.5% 4/30/2009 86 Town Kitchen, LLC 3,705 21.5% 8/31/2015 87 Amazing Mail.com, Inc. 21,891 35.4% 7/31/2012 88 Cary Brown DDS 2,682 9.6% 9/30/2012 89 Cannon Constructors 6,481 18.5% 7/31/2011 90 Ocean State Job Lot Sotres 30,336 24.1% 1/31/2009 91 92 Goodwill Industries of SN 14,995 10.8% 4/30/2008 93 Keller Williams 10,461 26.2% 8/31/2017 94 Movie Gallery (Home Vsn) 6,000 13.7% 11/30/2009 95 96 97 98 E Cardio 11,033 22.6% 5/31/2014 99 100 101 Hip Square To The Power Of Two 2,175 8.2% 2/28/2012 102 TVI, Inc. 20,400 23.0% 11/30/2011 103 Bellini Juvenile Furniture 5,600 14.6% 12/31/2010 104 Borch Inc. "Baja Lobster" 5,800 29.6% 3/31/2017 105 105.01 105.02 105.03 105.04 105.05 106 Panera Bread 4,229 12.6% 12/31/2016 107 Nevada Title Co. 4,243 21.3% 5/31/2008 108 109 The Motherhood Center 6,862 14.0% 6/30/2009 110 Tietroniz Software 11,763 19.7% 3/1/2009 111 Center for Premier Suites 6,834 19.7% 1/31/2011 112 113 114 115 CVS 8,954 12.6% 10/31/2007 116 Don's and Ben's, Gabriel Hldgs. 2,909 14.8% 10/31/2011 117 118 Ecce Liben, Inc. 2,800 8.7% 4/4/2011 119 Jerry Pope 3,390 11.0% 10/31/2007 120 121 Perfect Pizza, Inc. 4,850 2.7% 11/23/2010 122 123 124 Tarrant County Hospital District 13,143 49.5% 8/31/2011 125 Tuesday Morning 7,300 11.4% 7/15/2012 126 127 128 129 130 131 132 Dale Husband 3,745 22.7% 9/30/2007 133 134 135 136 KVRR TV Fox 8,041 19.3% 10/31/2010 137 Mesa Lighting & Fan 7,944 34.1% 8/31/2008 138 139 140 141 142 143 MORTGAGE 3RD LARGEST 3RD LARGEST LOAN 3RD LARGEST TENANT TENANT NUMBER 3RD LARGEST TENANT NAME TENANT SQ. FT. % OF NRA EXP. DATE LOCKBOX - ------------------------------------------------------------------------------------------------------------------ 1 Various Various Various Various Day 1 1.01 Edison Electric Institute 76,793 11.3% 7/31/2015 1.02 1.03 Moss Adams 93,582 9.9% Multiple Spaces 1.04 AT&T Corp. 40,254 5.7% Multiple Spaces 1.05 YK and Wang 2,800 0.4% 10/31/2011 1.06 Symetra Finacial Corporation 71,531 16.1% 7/31/2015 1.07 American Family Mutual Insurance 28,223 6.1% Multiple Spaces 1.08 Cisco Systems 28,058 6.0% 2/28/2013 1.09 Wells Fargo Bank NA 24,608 5.3% Multiple Spaces 1.10 EADS 37,018 12.6% 8/31/2014 1.11 GSA 21,214 6.4% 8/31/2013 1.12 Great American Insurance 24,770 9.9% 12/31/2009 1.13 National Retail Federation 26,752 16.3% 3/31/2014 1.14 Peacehealth 25,881 9.3% 3/31/2014 1.15 Akamai Technologies 15,511 7.2% 5/31/2011 1.16 Constantine Cannon 12,550 12.2% 3/31/2008 1.17 National Medical Management 12,681 8.5% 7/31/2008 1.18 National Amusements 51,511 6.7% 2/28/2011 1.19 BBN Technologies 41,031 10.8% 11/30/2010 1.20 Davis Wright Tremaine 169,533 15.7% 12/31/2018 2 Springing 2.01 2.02 2.03 2.04 2.05 2.06 2.07 2.08 2.09 2.10 2.11 2.12 2.13 2.14 2.15 2.16 2.17 2.18 2.19 2.20 2.21 2.22 2.23 2.24 2.25 2.26 2.27 2.28 2.29 2.30 2.31 2.32 2.33 2.34 2.35 2.36 2.37 2.38 2.39 2.40 2.41 2.42 2.43 2.44 2.45 2.46 3 Various Various Various Various 3.01 Ross Dress For Less 27,577 11.2% 1/31/2013 3.02 Marshall's 26,975 10.3% 12/31/2011 3.03 Petco 15,324 6.7% 1/31/2014 3.04 Ross Dress for Less 30,186 9.8% 1/31/2013 3.05 Circuit City 28,010 9.0% 1/31/2016 3.06 Go 1 Dollar 11,379 4.2% 9/30/2013 3.07 Circuit City 33,000 11.7% 10/31/2008 3.08 OfficeMax 23,350 9.7% 4/30/2012 3.09 Linens 'N Things 36,000 12.8% 1/31/2016 3.10 Beall's Outlet 30,000 13.2% 4/30/2014 3.11 Ortiz-Parra Enter 10,000 9.2% 12/31/2011 3.12 A.J. Wright 25,000 11.5% 11/30/2009 3.13 B. Christopher's 5,879 4.4% 10/31/2015 3.14 Gander Mountain 31,145 11.5% 8/31/2014 3.15 Yum Yum Japanese Stakehouse 4,800 3.2% 8/31/2011 3.16 Boris International 5,522 4.4% 6/30/2011 3.17 Ross Dress For Less 29,997 16.1% 1/31/2010 3.18 Amscot Financial 5,200 4.0% 5/31/2014 3.19 Beall's 13,845 9.1% 10/31/2011 3.20 The Mindbody Experience 4,843 4.1% 1/31/2009 3.21 Stein Mart 34,423 14.2% 4/30/2015 3.22 Tropical Realty and Inves 5,400 3.4% 2/28/2008 3.23 Hallmark 4,988 5.6% 2/28/2014 3.24 Rotelli's Pizza & Pasta 1,800 2.2% 7/31/2013 3.25 S & K Famous Brands 5,040 4.8% 1/31/2011 3.26 ValueThrift 20,000 9.8% 1/31/2009 3.27 Grand Harbour Import Comp 11,910 9.8% 4/30/2010 3.28 Liquor Store 1,750 2.4% 11/30/2008 3.29 Family Christian Stores 5,000 7.5% 10/31/2010 3.30 Dollar Tree 5,400 5.5% 9/30/2011 3.31 Manhattan Liquors 2,625 3.8% 8/31/2012 3.32 Dollar & Party Store 4,200 3.0% 12/31/2008 3.33 Sherwin-Williams 5,000 4.0% 3/31/2010 3.34 BE Fitness, Inc. 2,800 3.1% 5/31/2009 3.35 Blockbuster 4,800 5.7% 7/31/2011 3.36 Bonefish Restaurant 5,320 5.6% 4/30/2013 3.37 Ross Dress for Less 10,260 8.7% 10/31/2015 3.38 RadioShack 3,000 3.2% 12/31/2010 3.39 Bikram Yoga 1,925 2.7% 9/30/2007 3.40 Play It Again Sports 4,050 3.2% 7/31/2009 3.41 Giovanni's Italian Restaurant 3,608 4.8% 11/30/2011 3.42 Los Portales Mexican Cuis 3,900 5.3% 3/31/2011 3.43 Beauty & More 2,800 4.1% 8/31/2008 3.44 Monte De Rey 4,200 5.5% 4/30/2008 3.45 Itza Pizza 2,100 3.3% 12/31/2008 3.46 Washington Mutual Bank 3,600 5.9% 8/31/2010 3.47 Pancho's Backyard 2,550 3.8% 7/31/2011 3.48 Blockbuster 6,000 8.1% 4/30/2012 3.49 Quizno's Subs 2,152 3.1% 1/31/2009 3.50 Hallmark 3,360 5.0% 2/28/2012 3.51 Fuquay Urgent Care 2,800 5.7% 9/30/2008 3.52 Jackson Hewitt Tax Service 1,432 2.5% 3/31/2012 4 Mercy College 55,000 15.5% 5/31/2022 Day 1 5 Day 1 6 Various Various Various Various 6.01 Jo-Ann Stores 35,350 8.2% 1/31/2015 6.02 PetSmart 19,107 13.3% 1/31/2020 6.03 Famous Footwear 6,400 6.2% 8/31/2016 7 Day 1 7.01 7.02 7.03 7.04 7.05 8 Wall Street Access, Inc. 33,800 8.2% 10/31/2008 Day 1 9 Calvert Retail (Reading China) 27,125 5.0% 11/30/2008 10 Health Net 29,466 10.2% 8/31/2009 Day 1 11 New York & Company 8,999 3.0% 1/31/2016 Day 1 12 Linens & Things, Inc. 49,570 9.5% 12/31/2015 Day 1 13 Mergent, Inc. 14,800 7.9% 9/30/2008 Day 1 14 The Philippine Consulate General 14,103 3.4% 9/30/2009 Day 1 15 LMA North America, Inc. 14,734 8.9% 4/30/2010 Day 1 16 Drumbeat Digital, LLC 14,000 8.4% 10/31/2012 Day 1 17 Agilent Technologies 26,107 15.8% 3/31/2010 18 Scott Wage 13,391 9.1% 12/14/2007 Day 1 19 SteinMart 46,021 14.9% 11/30/2008 20 Day 1 21 21.01 21.02 22 Various Various Various Various Day 1 22.01 Executive Financial Lending 5,793 6.2% 11/30/2008 22.02 Kaiser Foundation Health 6,284 7.5% 12/31/2009 23 Springing 24 Windspeed Pennsauken 100,000 10.7% 6/30/2012 Day 1 25 26 Day 1 27 Day 1 28 29 30 Springing 31 32 Walgreens 13,500 7.9% 8/31/2029 33 34 PetSmart 26,040 9.6% 1/31/2014 35 Countrywide Home Loan 12,057 11.9% 12/2/2009 Springing 36 T.J. Maxx 30,000 13.3% 3/31/2017 37 Nationwide Credit 54,960 12.4% 7/30/2009 Day 1 38 39 40 Day 1 41 Anna's Linens 10,000 3.2% 6/30/2015 42 RBC Dain Rauscher Inc 5,912 7.9% 7/31/2007 43 Amore Pacific, Inc. 2,500 14.7% 10/31/2012 44 Bilinguals, Inc. 5,000 9.3% 7/31/2012 Day 1 45 46 Office Depot 23,160 18.2% 12/31/2010 47 Goody's Family Clothing 30,000 17.8% 3/31/2010 48 Day 1 49 50 Blockbuster 8,158 6.2% 6/30/2009 51 52 53 Barbara Jean's 4,400 4.9% 5/31/2016 54 Hidrocj Realty Inc. 5,000 8.3% 6/30/2012 55 56 Big Lots, Inc. 29,000 16.0% 1/31/2009 57 Various Various Various Various 57.01 PMCC - Dermatology 6,690 7.3% 11/30/2013 57.02 PMCC - Dept of Medicine 5,155 22.1% 11/30/2012 58 58.01 58.02 58.03 58.04 58.05 59 Springing 60 Pier 1 Imports 10,827 12.7% 2/28/2015 61 62 63 Weichert Realtors 3,200 4.7% 12/31/2011 64 65 Petco 16,000 18.7% 2/28/2017 Day 1 66 Springing 67 Hoffman, Steven (et al) 2,506 4.4% 9/30/2007 68 George's Cycles and Fitness 9,966 14.1% 4/30/2011 69 70 71 72 WAMU 3,683 7.2% 12/31/2015 Day 1 73 Bay Area Pediatrics 4,860 7.0% 11/30/2012 74 Jocks & Jills 5,708 20.6% 12/31/2007 75 76 WFS Financial 7,920 9.9% 7/31/2011 77 Springing 78 Scott & Stringfellow, Inc. 11,084 8.4% 8/31/2024 79 Fox and Hound 8,194 15.6% 5/31/2020 80 81 Shoe Carnival, Inc. 10,000 9.7% 1/31/2011 82 Day 1 82.01 82.02 83 84 Maya Tan 2,500 3.1% 11/30/2009 85 Dr. Perlmutter 2,617 4.7% 9/30/2012 86 Fir Tree, LLC 3,472 20.2% 6/30/2012 87 Villagio Tile & Stone 10,685 17.3% 9/30/2009 Day 1 88 Wings N Things 1,825 6.5% 2/28/2017 89 Fassberg Construction 4,688 13.4% 7/31/2007 Springing 90 Family Dollar 6,400 5.1% 12/31/2008 91 92 Aaron's Rental 9,000 6.5% 8/31/2012 93 Stroudwater Associates 6,053 15.2% 3/31/2017 94 Cross Insurance 5,993 13.7% 2/28/2009 Springing 95 96 97 98 IKP Family Medicine 7,660 15.7% 9/30/2013 99 100 Day 1 101 Pool and Spa Store 2,070 7.8% 2/28/2017 102 Tuesday Morning, Inc. 9,295 10.5% 7/15/2010 103 Lamberti of Manalapan, Inc. 3,278 8.6% 2/28/2011 104 Naomi, Inc. "Naomi Dance" 2,400 12.2% 4/30/2012 105 105.01 105.02 105.03 105.04 105.05 106 Cato 3,880 11.6% 1/31/2012 107 Booz Allen Hamilton 2,412 12.1% 4/30/2010 108 109 Physical Conditioning Centre 3,512 7.2% 4/30/2009 110 Alamo Title 5,893 9.9% 3/31/2009 111 Coldwell Banker 6,834 19.7% 1/31/2008 112 113 114 115 Beauty Town 2,400 3.4% 4/30/2015 Springing 116 Tri County Dentist 1,750 8.9% 3/31/2011 117 118 Village Health Georgia, PC 1,609 5.0% 12/6/2010 119 Wayne Wicks & Associates 2,789 9.1% 9/30/2008 120 121 Springing 122 123 124 125 Dollar General 7,150 11.1% 8/1/2007 126 Springing 127 128 129 130 Springing 131 132 133 Springing 134 Springing 135 136 Ameriprise 960 2.3% 7/31/2007 137 Lindsays Auto 4,762 20.5% 12/31/2008 138 139 140 141 Springing 142 143 MORTGAGE LOAN LARGEST AFFILIATED SPONSOR FLAG NUMBER (> THAN 4% OF POOL, LOAN GROUP 1 OR LOAN GROUP 2) - ------------------------------------------------------------------------------------------------------------- 1 Beacon Capital Strategic Partners V, LP 1.01 1.02 1.03 1.04 1.05 1.06 1.07 1.08 1.09 1.10 1.11 1.12 1.13 1.14 1.15 1.16 1.17 1.18 1.19 1.20 2 ING Clarion Partners 2.01 2.02 2.03 2.04 2.05 2.06 2.07 2.08 2.09 2.10 2.11 2.12 2.13 2.14 2.15 2.16 2.17 2.18 2.19 2.20 2.21 2.22 2.23 2.24 2.25 2.26 2.27 2.28 2.29 2.30 2.31 2.32 2.33 2.34 2.35 2.36 2.37 2.38 2.39 2.40 2.41 2.42 2.43 2.44 2.45 2.46 3 Developers Diversified Realty Corporation 3.01 3.02 3.03 3.04 3.05 3.06 3.07 3.08 3.09 3.10 3.11 3.12 3.13 3.14 3.15 3.16 3.17 3.18 3.19 3.20 3.21 3.22 3.23 3.24 3.25 3.26 3.27 3.28 3.29 3.30 3.31 3.32 3.33 3.34 3.35 3.36 3.37 3.38 3.39 3.40 3.41 3.42 3.43 3.44 3.45 3.46 3.47 3.48 3.49 3.50 3.51 3.52 4 Ralph Sitt 5 Columbia Sussex Corporation 6 Developers Diversified Realty Corporation (DDR) and Divident Capital Total Realty Trust (TRT) 6.01 6.02 6.03 7 7.01 7.02 7.03 7.04 7.05 8 The Moinan Group 9 10 The Irvine Company LLC 11 12 13 The Moinan Group 14 15 The Irvine Company LLC 16 The Moinan Group 17 18 The Irvine Company LLC 19 20 21 21.01 21.02 22 22.01 22.02 23 24 25 Wachovia Development Corporation and Hamilton Zane 26 27 HGGP Capital II, LLC 28 AVR Realty Company, LLC 29 30 Anthony Zanze 31 Wachovia Development Corporation and Hamilton Zane 32 33 34 35 36 37 38 Larry Moore 39 40 41 42 43 44 The Moinan Group 45 GMH Communities Trust, (REIT) 46 47 48 49 Sol L. Rabin 50 51 52 53 54 55 56 57 57.01 57.02 58 58.01 58.02 58.03 58.04 58.05 59 60 61 62 63 64 65 66 67 68 69 70 71 72 73 74 75 76 77 78 79 80 81 82 82.01 82.02 83 84 85 86 87 88 89 90 91 92 93 94 95 96 97 98 99 100 101 102 103 104 105 105.01 105.02 105.03 105.04 105.05 106 107 108 109 110 111 112 113 114 115 116 117 118 119 120 121 122 123 124 125 126 127 128 129 130 131 132 133 134 135 136 137 138 139 140 141 142 143 See "DESCRIPTION OF THE MORTGAGED POOL - Additional Mortgage Loan Information" in the prospectus supplement. (1) Certain of the Mortgage Loans have LTV Ratios that have been calculated on an "as-stabilized" basis, or have DSC Ratios that have been adjusted to take into account certain cash reserves, holdbacks or letters of credit or were calculated based on assumptions regarding the future financial performance of the related Mortgaged Property. See "Additional Mortgage Loan Information" herein. Also, see "DESCRIPTION OF THE MORTGAGE POOL--Additional Mortgage Loan Information" and "RISK FACTORS--Risks Relating to Net Cash Flow" and "--Inspections and Appraisals May Not Accurately Reflect Value or Condition of Mortgaged Property" in the Prospectus Supplement. (2) For a description of how the LTV Ratios for the Mortgage Loans are determined, see "DESCRIPTION OF THE MORTGAGE POOL--Additional Mortgage Loan Information" and "RISK FACTORS--The Mortgage Loans--Risks Related to Property Inspections and Certain Assumptions in Appraisals" in the Prospectus Supplement. (3) Three Mortgage Loans (loan numbers 1, 2 and 3) are part of a split loan structure and the related pari passu companion loans are not included in the Trust Fund with respect to the Mortgage Loan, unless otherwise specified. With respect to these Mortgage Loans, unless otherwise specified, the calculations of LTV Ratios, DSC Ratios and Cut-Off Date Balances per unit are based on the aggregate indebtedness of or debt service on, as applicable, the related Mortgage Loan and the related pari passu companion loan. (4) With respect to the DDR Southeast Pool Loan (loan number 3), representing 5.8% of the Cut-Off Date Pool Balance (6.5% of the Cut-Off Date Group 1 Balance), an exception to the prepayment protection exists in that the borrower may voluntarily prepay up to 10.0% of the initial principal balance of such loan at any time without any obligation to pay any yield maintenance charge or prepayment premium in connection with such prepayment. (5) Loan number 29 was removed from Annex A-1 included in the Free Writing Prospectus dated June 10, 2007. (6) The interest rate with respect to the Siena Office Park Loan (loan number 35), representing 0.7% of the Cut-Off Date Pool Balance (0.8% of the Cut-Off Date Group 1 Balance) may vary during the term of the related Mortgage Loan. For purposes of the table above as well as calculations throughout the Prospectus Supplement, the mortgage rate was assumed to be the average mortgage rate over the term of the related Mortgage Loan. See "DESCRIPTION OF THE MORTGAGE POOL--Additional Mortgage Loan Information" in the Prospectus Supplement. (7) With respect to the Midtown Square Loan (loan number 74), representing 0.3% of the Cut-Off Date Pool Balance (0.3% of the Cut-Off Date Group 1 Balance), the second largest tenant was determined to be as such based on the annual base rent paid by the tenant. (8) With respect to the Barchester Pool Loan (loan number 105), representing 0.2% of the Cut-Off Date Pool Balance (0.2% of the Cut-Off Date Group 1 Balance), as of the origination of the related Mortgage Loan, one Mortgaged Property was improved with a mixed use office/retail building, one was improved with an apartment complex, one was improved with multifamily condominium complex, one was improved with a high rise office building and a seven-story parking garage and the other was improved with a mixed use project that includes an office tower, retail arcade, underground parking facilities, meeting space and a 395-room luxury hotel; however, in all cases, the improvements are not part of the collateral for the related Mortgaged Property.
WACHOVIA BANK COMMERCIAL MORTGAGE TRUST SERIES 2007-C32 ANNEX A-2 CERTAIN INFORMATION REGARDING MULTIFAMILY MORTGAGED PROPERTIES MORTGAGE LOAN LOAN GROUP LOAN NUMBER NUMBER SELLER PROPERTY NAME PROPERTY ADDRESS PROPERTY CITY - ----------------------------------------------------------------------------------------------------------------------------------- 21 2 Wachovia Little Rock Pool Various Little Rock 21.01 Chenal Lakes Apartments 13500 Chenal Parkway Little Rock 21.02 Brightwaters Apartments 2420 Riverfront Drive Little Rock 25 2 Wachovia Mountain Shadow Apartments 695 East Patriot Boulevard Reno 27 2 Wachovia Town Center Apartments 2727 Bens Branch Drive Kingwood 28 2 Wachovia The Gates at Citiplace Apartments 2500 Gates Circle Baton Rouge 30 2 Wachovia Environs Residential Rental Community 3323 West 96th Circle Westminster 31 2 Wachovia Summit Trails Apartments 1350 Grand Summit Drive Reno 38 2 Wachovia Amber Place 6080 Lakeview Road Warner Robins 45 2 Wachovia The Centre Apartments 5200 Croyden Avenue Kalamazoo 49 2 Wachovia Estancia Apartments 1720 East D Street Ontario 52 2 Wachovia Villa del Oso 4217 Louisiana Boulevard NE Albuquerque 59 2 Wachovia Porto Bella 10853 Firestone Boulevard Norwalk 61 2 Wachovia Le Coeur du Monde Apartments 2035 Clermont Crossing Drive Saint Louis 66 2 Wachovia Chartwell Court Apartments 15100 Ella Boulevard Houston 69 2 Wachovia Pine Winds Apartments 1301 Pine Winds Drive Garner 70 2 Wachovia The Arbors at Port Warwick 1100 William Styron Square South Newport News 75 2 Wachovia Vista Montana 8000 Montgomery Boulevard NE Albuquerque 77 2 Wachovia Colony Grove Apartments 1145 West Baseline Road Tempe 80 2 Wachovia Deerwood Crossing Apartments 1710 Franciscan Terrace Winston-Salem 83 2 Artesia Sunnygate Village Apartments 10120 Woodbury Drive Manassas 91 2 Wachovia Imperial Towers Apartments 3801 Conshohocken Avenue Philadelphia 95 2 Wachovia 7400 Apartments 7400 Roosevelt Boulevard Philadelphia 96 2 Wachovia Dutch Village Apartments 1500 Zuider Zee Drive Winston-Salem 99 2 Artesia Fountain Park Apartments 12525 South Kirkwood Road Stafford 108 2 Wachovia Village Square Apartments 100 Tonto Trail Lafayette 112 2 Wachovia The Apartments at 1515 West Morse Avenue 1515 West Morse Avenue Chicago 113 2 Wachovia 5724-32 South Blackstone Avenue 5724-32 South Blackstone Avenue Chicago 114 2 Wachovia Stanford Place II Apartments 37 Van Mark Way Saint Louis 120 2 Artesia Clearwater Estates III and IV 6887 and 6889 Clearwater Road Baxter 127 2 Wachovia 4717 North Winthrop Apartments 4717 North Winthrop Avenue Chicago MORTGAGE LOAN PROPERTY GENERAL CUT-OFF DATE NUMBER COUNTY PROPERTY STATE ZIP CODE PROPERTY TYPE SPECIFIC PROPERTY TYPE LOAN BALANCE ($) - ---------------------------------------------------------------------------------------------------------------------------------- 21 Pulaski AR Various Multifamily Conventional 40,000,000 21.01 Pulaski AR 72211 Multifamily Conventional 21.02 Pulaski AR 72202 Multifamily Conventional 25 Washoe NV 89511 Multifamily Conventional 35,572,500 27 Harris TX 77339 Multifamily Conventional 34,000,000 28 East Baton Rouge LA 70809 Multifamily Conventional 33,700,000 30 Adams CO 80031 Multifamily Single Family/Conventional/Townhomes 31,000,000 31 Washoe NV 89523 Multifamily Conventional 30,175,000 38 Houston GA 31088 Multifamily Conventional 26,000,000 45 Kalamazoo MI 49009 Multifamily Student Housing 19,875,000 49 San Bernardino CA 91764 Multifamily Conventional 17,650,000 52 Bernalillo NM 87109 Multifamily Conventional 16,180,000 59 Los Angeles CA 90650 Multifamily Conventional 13,200,000 61 Saint Louis MO 63146 Multifamily Conventional 13,056,000 66 Harris TX 77090 Multifamily Conventional 12,450,000 69 Wake NC 27603 Multifamily Conventional 11,600,000 70 Newport News City VA 23606 Multifamily Independent Living 11,278,294 75 Bernalillo NM 87109 Multifamily Conventional 10,820,000 77 Maricopa AZ 85283 Multifamily Conventional 10,700,000 80 Forsyth NC 27127 Multifamily Conventional 10,400,000 83 Prince William VA 20109 Multifamily Conventional 10,250,000 91 Philadelphia PA 19131 Multifamily Conventional 8,080,000 95 Philadelphia PA 19152 Multifamily Conventional 7,400,000 96 Forsyth NC 27127 Multifamily Conventional 7,100,000 99 Fort Bend TX 77477 Multifamily Conventional 6,700,000 108 Tippecanoe IN 47905 Multifamily Conventional 5,560,000 112 Cook IL 60626 Multifamily Conventional 4,700,000 113 Cook IL 60637 Multifamily Conventional 4,600,000 114 Saint Louis MO 63144 Multifamily Conventional 4,350,000 120 Crow Wing MN 56425 Multifamily Conventional 3,700,000 127 Cook IL 60640 Multifamily Conventional 3,100,000 ORIGINAL TERM TO MORTGAGE MATURITY LOAN CUT-OFF DATE LOAN MORTGAGE ORIGINATION UW NOI UW NCF CUT-OFF DATE OR ARD NUMBER AMOUNT PER (UNIT) ($) RATE DATE DSCR (X) DSCR (X) LTV RATIO (MOS.) - --------------------------------------------------------------------------------------------------------------------------------- 21 56,180 5.4800% 5/9/2007 1.51 1.42 80.0% 120 21.01 21.02 25 88,051 5.8100% 5/29/2007 1.29 1.29 77.0% 60 27 65,637 5.6800% 5/10/2007 1.46 1.42 79.9% 120 28 91,328 5.6500% 5/7/2007 1.55 1.50 79.3% 120 30 97,484 5.8300% 4/25/2007 1.27 1.27 78.1% 120 31 94,890 5.8100% 5/25/2007 1.25 1.25 78.4% 60 38 66,327 5.8000% 4/27/2007 1.26 1.20 80.1% 120 45 85,668 5.6000% 2/28/2007 1.39 1.32 79.8% 120 49 116,118 6.1500% 4/30/2007 1.24 1.20 72.3% 60 52 51,859 5.7900% 4/30/2007 1.42 1.35 79.3% 60 59 126,923 5.6500% 4/30/2007 1.23 1.20 80.0% 120 61 68,000 5.6500% 4/24/2007 1.36 1.28 79.1% 120 66 51,235 5.1800% 5/25/2007 1.37 1.29 75.0% 120 69 53,704 5.6600% 3/29/2007 1.44 1.35 80.0% 120 70 117,482 5.7800% 4/11/2007 1.45 1.42 53.7% 120 75 50,093 5.7900% 4/30/2007 1.47 1.40 80.2% 60 77 63,314 5.7500% 5/18/2007 1.28 1.28 76.4% 120 80 36,491 5.7200% 4/30/2007 1.37 1.29 80.0% 120 83 77,652 5.6300% 6/1/2007 1.20 1.15 70.7% 120 91 43,441 5.5500% 4/30/2007 1.49 1.33 64.1% 120 95 37,755 5.5500% 4/30/2007 1.85 1.73 63.0% 120 96 34,975 5.7200% 4/30/2007 1.30 1.22 79.3% 120 99 38,068 5.7300% 5/22/2007 1.28 1.17 80.0% 120 108 27,255 5.7400% 4/18/2007 1.63 1.45 79.4% 120 112 71,212 5.9300% 5/10/2007 1.33 1.27 75.8% 120 113 73,016 5.7800% 5/3/2007 1.27 1.22 73.0% 120 114 52,410 5.5700% 3/29/2007 1.42 1.35 79.8% 120 120 61,667 6.0600% 6/6/2007 1.19 1.15 78.3% 120 127 60,784 5.7500% 5/15/2007 1.26 1.20 79.5% 120 AVERAGE AVERAGE MORTGAGE ORIGINAL INTEREST- CONTRACT CONTRACT LOAN AMORT TERM ONLY NUMBER OF NUMBER OF RENT - NUMBER OF RENT - 1 BR NUMBER (MOS.) PERIOD UNITS STUDIO UNITS STUDIO UNITS 1 BR UNITS UNITS - --------------------------------------------------------------------------------------------------------------------------------- 21 IO 120 712 Various Various 21.01 456 188 508 21.02 256 176 536 25 IO 60 404 144 810 27 IO 120 518 238 695 28 IO 120 369 186 1,033 30 IO 120 318 83 849 31 IO 60 318 160 780 38 IO 120 392 96 666 45 IO 120 232 40 639 49 IO 60 152 50 947 52 IO 60 312 132 520 59 IO 120 104 104 1,125 61 IO 120 192 96 797 66 360 60 243 81 806 69 IO 120 216 72 630 70 360 96 7 1,891 49 2,445 75 IO 60 216 84 580 77 IO 120 169 6 824 82 684 80 360 60 285 76 447 83 360 60 132 44 899 91 IO 120 186 42 713 102 870 95 IO 120 196 78 800 96 360 60 203 16 446 99 360 176 8 480 104 569 108 IO 120 204 84 459 112 IO 120 66 19 547 35 677 113 IO 120 63 42 721 21 900 114 IO 120 83 1 580 20 638 120 360 60 16 699 127 IO 120 51 17 521 33 661 AVERAGE AVERAGE AVERAGE MORTGAGE CONTRACT CONTRACT CONTRACT LOAN NUMBER OF RENT - 2 BR NUMBER OF RENT - 3 BR NUMBER OF RENT - 4 BR NUMBER OF NUMBER 2 BR UNITS UNITS 3 BR UNITS UNITS 4 BR UNITS UNITS 4+ BR UNITS - --------------------------------------------------------------------------------------------------------------------------------- 21 Various Various Various Various 21.01 226 731 42 985 21.02 80 623 25 228 973 32 1,345 27 280 935 28 146 1,123 37 1,596 30 165 1,093 70 1,152 31 150 985 8 1,155 38 264 758 32 880 45 24 918 60 1,227 108 1593 49 102 1,174 52 180 635 59 61 96 962 66 162 942 69 96 720 48 810 70 40 3,094 75 108 690 24 880 77 81 805 80 135 553 74 668 83 88 1,112 91 42 1,016 95 117 850 1 925 96 169 532 18 666 99 48 710 16 835 108 98 562 22 637 112 12 846 113 114 59 717 3 997 120 40 787 4 919 127 1 790 NUMBER OF UNDER AVERAGE RENOVATION, MORTGAGE CONTRACT MODEL OR UTILITIES TOTAL LOAN RENT - 4+ BR RENTAL OCCUPANCY TENANT NUMBER NUMBER UNITS OFFICE UNITS RATE PAYS ELEVATORS OF PADS - -------------------------------------------------------------------------------------------------------------- 21 94.0% Various N 21.01 92.3% E,G,W,S N 21.02 96.9% E N 25 92.1% E,G N 27 96.3% None N 28 91.3% E N 30 90.6% E,G,W,S,T N 31 97.5% E,G N 38 83.9% E,G,S N 45 89.9% E N 49 96.7% E,G N 52 92.6% E N 59 90.4% E,G,W,S,T N 61 96.3% E,G,T N 66 91.4% E,W,S,T N 69 93.1% E,W,S N 70 89.6% E,G,W,S Y 75 96.3% None N 77 93.5% E,G,W,S,T N 80 95.1% E N 83 86.4% E N 91 96.2% E,G,W Y 95 99.5% E Y 96 95.1% E N 99 94.3% E,W N 108 87.7% E,G N 112 98.5% E Y 113 95.2% E,G,W,S N 114 95.2% E N 120 91.7% E N 127 98.0% None Y AVERAGE TOTAL GROSS MORTGAGE CONTRACT NUMBER INCOME LOAN RENT PER OF RV FROM RV UW TOTAL MORTGAGE LOAN NUMBER PADS SITES SITES REVENUES ($) NUMBER - ---------------------------------------------------------------------------------------------- 21 5,238,824 21 21.01 3,481,237 21.01 21.02 1,757,587 21.02 25 4,340,233 25 27 5,188,212 27 28 4,422,051 28 30 4,238,699 30 31 3,483,525 31 38 3,350,566 38 45 3,181,086 45 49 2,193,310 49 52 2,176,924 52 59 1,348,360 59 61 1,881,000 61 66 2,411,711 66 69 1,715,574 69 70 3,083,375 70 75 1,687,549 75 77 1,349,348 77 80 1,795,124 80 83 1,491,036 83 91 1,928,169 91 95 1,821,429 95 96 1,236,944 96 99 1,202,429 99 108 1,188,106 108 112 566,064 112 113 544,005 113 114 635,454 114 120 518,157 120 127 384,370 127
WACHOVIA BANK COMMERCIAL MORTGAGE TRUST SERIES 2007-C32 ANNEX A-3 RESERVE ACCOUNT INFORMATION LOAN MORTGAGE GROUP LOAN NUMBER NUMBER PROPERTY NAME GENERAL PROPERTY TYPE SPECIFIC PROPERTY TYPE - ---------------------------------------------------------------------------------------------------------------------------------- 1 1 Beacon D.C. & Seattle Pool Various Various 1.01 Market Square Office CBD 1.02 Polk & Taylor Buildings Office Suburban 1.03 Wells Fargo Center Office CBD 1.04 One, Two & Three Lafayette Centre Office CBD 1.05 Booz Allen Complex Office Suburban 1.06 Key Center Office CBD 1.07 Sunset North Office Suburban 1.08 City Center Bellevue Office CBD 1.09 Plaza Center and US Bank Tower Office CBD 1.10 1616 Fort Myer Drive Office Suburban 1.11 American Center Office Suburban 1.12 Eastgate Office Park Office Suburban 1.13 Liberty Place Office CBD 1.14 Lincoln Executive Center Buildings I, II, III, A&B Office Suburban 1.15 11111 Sunset Hills Road Office Suburban 1.16 Army and Navy Club Building Office CBD 1.17 Plaza East Office CBD 1.18 Reston Town Center Mixed Use Office/Retail 1.19 1300 North Seventeenth Street Office Suburban 1.20 Washington Mutual Tower Office CBD 2 1 ING Hospitality Pool Hospitality Extended Stay 2.01 Residence Inn - La Jolla, CA Hospitality Extended Stay 2.02 Residence Inn Seattle East - Redmond , WA Hospitality Extended Stay 2.03 Residence Inn - Long Beach, CA Hospitality Extended Stay 2.04 Residence Inn - Costa Mesa, CA Hospitality Extended Stay 2.05 Residence Inn Pasadena - Arcadia, CA Hospitality Extended Stay 2.06 Residence Inn - Irvine, CA Hospitality Extended Stay 2.07 Homewood Suites - Herndon, VA Hospitality Extended Stay 2.08 Residence Inn Concord - Pleasant Hill, CA Hospitality Extended Stay 2.09 Residence Inn - San Ramon, CA Hospitality Extended Stay 2.10 Homewood Suites - Linthicum, MD Hospitality Extended Stay 2.11 Residence Inn - Saint Louis, MO Hospitality Extended Stay 2.12 Residence Inn - Bakersfield, CA Hospitality Extended Stay 2.13 Residence Inn - Boulder, CO Hospitality Extended Stay 2.14 Residence Inn - Hapeville, GA Hospitality Extended Stay 2.15 Residence Inn Chicago - Deerfield, IL Hospitality Extended Stay 2.16 Homewood Suites - Malvern, PA Hospitality Extended Stay 2.17 Residence Inn - Houston, TX Hospitality Extended Stay 2.18 Residence Inn - Santa Fe, NM Hospitality Extended Stay 2.19 Residence Inn - Placentia, CA Hospitality Extended Stay 2.20 Homewood Suites - Glen Allen, VA Hospitality Extended Stay 2.21 Residence Inn - Atlanta, GA (Buckhead) Hospitality Extended Stay 2.22 Homewood Suites - Beaverton, OR Hospitality Extended Stay 2.23 Residence Inn - Cincinnati, OH Hospitality Extended Stay 2.24 Residence Inn - Lombard, IL Hospitality Extended Stay 2.25 Residence Inn - Jacksonville, FL Hospitality Extended Stay 2.26 Homewood Suites - Irving, TX Hospitality Extended Stay 2.27 Residence Inn Dallas - Irving, TX Hospitality Extended Stay 2.28 Homewood Suites - Clearwater, FL Hospitality Extended Stay 2.29 Residence Inn - Boca Raton, FL Hospitality Extended Stay 2.30 Residence Inn - Clearwater, FL Hospitality Extended Stay 2.31 Residence Inn - Birmingham, AL Hospitality Extended Stay 2.32 Residence Inn - Smyrna, GA Hospitality Extended Stay 2.33 Homewood Suites - Addison, TX Hospitality Extended Stay 2.34 Homewood Suites - Chesterfield, MO Hospitality Extended Stay 2.35 Residence Inn - Montgomery, AL Hospitality Extended Stay 2.36 Homewood Suites - Atlanta, GA (Buckhead) Hospitality Extended Stay 2.37 Residence Inn - Chesterfield, MO Hospitality Extended Stay 2.38 Residence Inn - Blue Ash, OH Hospitality Extended Stay 2.39 Residence Inn - Berwyn, PA Hospitality Extended Stay 2.40 Residence Inn - Danvers, MA Hospitality Extended Stay 2.41 Homewood Suites - Midvale, UT Hospitality Extended Stay 2.42 Homewood Suites - Plano, TX Hospitality Extended Stay 2.43 Homewood Suites - Atlanta, GA (Cumberland) Hospitality Extended Stay 2.44 Residence Inn - Memphis, TN Hospitality Extended Stay 2.45 Residence Inn - Atlanta, GA (DeKalb) Hospitality Extended Stay 2.46 Homewood Suites - Norcross, GA Hospitality Extended Stay 3 1 DDR Southeast Pool Retail Anchored 3.01 Hilltop Plaza Retail Anchored 3.02 Largo Town Center Retail Anchored 3.03 Midway Plaza Retail Anchored 3.04 Riverstone Plaza Retail Anchored 3.05 Highland Grove Retail Anchored 3.06 Riverdale Shops Retail Anchored 3.07 Skyview Plaza Retail Anchored 3.08 Apple Blossom Corners Retail Anchored 3.09 Fayetteville Pavilion Retail Anchored 3.10 Creekwood Crossing Retail Anchored 3.11 Flamingo Falls Retail Anchored 3.12 Harundale Plaza Retail Anchored 3.13 Meadowmont Village Center Retail Anchored 3.14 Springfield Commons Retail Anchored 3.15 Northlake Commons Retail Anchored 3.16 Village Square at Golf Retail Anchored 3.17 Oviedo Park Crossing Retail Anchored 3.18 Shoppes of Golden Acres Retail Anchored 3.19 Bardmoor Shopping Center Retail Anchored 3.20 Rosedale Shopping Center Retail Anchored 3.21 Casselberry Commons Retail Anchored 3.22 Shoppes at New Tampa Retail Anchored 3.23 Crossroads Plaza Retail Anchored 3.24 Plaza Del Paraiso Retail Anchored 3.25 North Pointe Plaza Retail Anchored 3.26 Melbourne Shopping Center Retail Anchored 3.27 Market Square (DDR) Retail Anchored 3.28 Shoppes of Lithia Retail Anchored 3.29 West Oaks Towne Center Retail Anchored 3.30 Sharon Greens Retail Anchored 3.31 Lakewood Ranch Retail Anchored 3.32 Cofer Crossing Retail Anchored 3.33 Clayton Corners Retail Anchored 3.34 Clearwater Crossing Retail Anchored 3.35 Shops at Paradise Pointe Retail Anchored 3.36 Killearn Center Retail Anchored 3.37 Conway Plaza Retail Anchored 3.38 River Run Shopping Center Retail Anchored 3.39 Aberdeen Square Retail Anchored 3.40 Derby Square Retail Anchored 3.41 Chickasaw Trails Shopping Center Retail Anchored 3.42 Shoppes at Lake Dow Retail Anchored 3.43 Shoppes of Ellenwood Retail Anchored 3.44 Shops at Oliver's Crossing Retail Anchored 3.45 Southwood Village Shopping Center Retail Anchored 3.46 Paraiso Plaza Retail Anchored 3.47 Sheridan Sqaure Retail Anchored 3.48 Countryside Shopping Center Retail Anchored 3.49 Shoppes of Citrus Hills Retail Anchored 3.50 Crystal Springs Shopping Center Retail Anchored 3.51 Sexton Commons Retail Anchored 3.52 Hairston Crossing Retail Anchored 4 1 Two Herald Square Mixed Use Office/Retail 5 1 Westin Casuarina Resort & Spa - Cayman Islands Hospitality Full Service 6 1 DDR-TRT Pool Retail Anchored 6.01 Centerton Square Retail Anchored 6.02 Beaver Creek Commons Retail Anchored 6.03 Mount Nebo Pointe Retail Anchored 7 1 Ashford Hospitality Pool 4 Hospitality Various 7.01 Spring Hill Suites - Orlando, FL Hospitality Limited Service 7.02 Courtyard - Orlando, FL Hospitality Limited Service 7.03 Residence Inn - Atlanta, GA Hospitality Extended Stay 7.04 Fairfield Inn - Orlando, FL Hospitality Limited Service 7.05 Courtyard by Marriott - Edison, NJ Hospitality Limited Service 8 1 17 Battery Place South Office CBD 9 1 Rockvale Square Retail Outlet 10 1 Centerside II Office Suburban 11 1 Citadel Mall Retail Anchored 12 1 Port Chester Shopping Center Retail Anchored 13 1 60 Madison Avenue Office CBD 14 1 3600 Wilshire Boulevard Office CBD 15 1 La Jolla Centre I Office Suburban 16 1 450-460 Park Avenue South Office CBD 17 1 Stadium Crossings Mixed Use Office/Retail 18 1 La Jolla Centre II Office Suburban 19 1 Roosevelt Square Retail Anchored 20 1 Marriott - Mobile, AL(2) Hospitality Full Service 21 2 Little Rock Pool(3) Multifamily Conventional 21.01 Chenal Lakes Apartments Multifamily Conventional 21.02 Brightwaters Apartments Multifamily Conventional 22 1 Jamison Valley Holdings Pool Office Suburban 22.01 Sherman Oaks Atrium Office Suburban 22.02 West Hills Plaza Office Suburban 23 1 Portofino Inn & Suites - Anaheim, CA Hospitality Limited Service 24 1 Barrington Business Center Industrial Flex 25 2 Mountain Shadow Apartments(4) Multifamily Conventional 26 1 Courtyard by Marriott - Philadelphia, PA Hospitality Full Service 27 2 Town Center Apartments(5) Multifamily Conventional 28 2 The Gates at Citiplace Apartments Multifamily Conventional 29 Reserved(6) 30 2 Environs Residential Rental Community Multifamily Single Family/Conventional/Townhomes 31 2 Summit Trails Apartments(7) Multifamily Conventional 32 1 Wellington Market Place Retail Anchored 33 1 Sheraton West - Richmond, VA(8) Hospitality Full Service 34 1 Franklin Square III Retail Anchored 35 1 Siena Office Park(9) Office Suburban 36 1 Columbus Park Crossing Shopping Center Retail Anchored 37 1 Vestal Park Mixed Use Student Housing/Retail/Office 38 2 Amber Place Multifamily Conventional 39 1 Wyndham - Atlanta, GA Hospitality Full Service 40 1 141 5th Avenue Retail Single Tenant 41 1 Marietta Trade Center Retail Anchored 42 1 Majestic Square Mixed Use Retail/Office 43 1 138 Spring Street Mixed Use Office/Retail 44 1 72 Madison Avenue Office CBD 45 2 The Centre Apartments Multifamily Student Housing 46 1 Pompano Plaza Retail Anchored 47 1 Wildwood North Shopping Center Retail Anchored 48 1 Federal Law Center Office Suburban 49 2 Estancia Apartments Multifamily Conventional 50 1 Colonial Promenade Bear Lake Retail Anchored 51 1 Mercury Computer Office Suburban 52 2 Villa del Oso Multifamily Conventional 53 1 Mount Pleasant Square Retail Anchored 54 1 65 West 36th Street Office CBD 55 1 Lazy Days Marina Special Purpose Marina Park 56 1 Athens West Retail Anchored 57 1 Peachtree Medical Office Pool Office Medical 57.01 Yorktown Medical Center Office Medical 57.02 Shakerag Medical Center Office Medical 58 1 BPRE Pool Office Suburban 58.01 11820 Pierce Street Office Suburban 58.02 8131 East Indian Bend Road Office Suburban 58.03 8111 East Indian Bend Road Office Suburban 58.04 8115 East Indian Bend Road Office Suburban 58.05 7328 East Stetson Drive Office Suburban 59 2 Porto Bella(10) Multifamily Conventional 60 1 Shoppes at Woodhill Retail Shadow Anchored 61 2 Le Coeur du Monde Apartments Multifamily Conventional 62 1 Barrington Terrace Healthcare Assisted Living 63 1 Sunset Commons Retail Anchored 64 1 XSport Fitness - Downers Grove, IL Retail Single Tenant 65 1 Topsham Crossing Center Retail Anchored 66 2 Chartwell Court Apartments Multifamily Conventional 67 1 Cupertino Town Center Office Suburban 68 1 One Front Street Office CBD 69 2 Pine Winds Apartments Multifamily Conventional 70 2 The Arbors at Port Warwick Multifamily Independent Living 71 1 Michael's Warehouse & Distribution Facility Industrial Warehouse/Distribution 72 1 Parmer-McNeil Plaza Shopping Center Retail Unanchored 73 1 159-181 Second Avenue Office CBD 74 1 Midtown Square Mixed Use Retail/Parking Garage/Industrial 75 2 Vista Montana Multifamily Conventional 76 1 1500 West Park Drive Office Suburban 77 2 Colony Grove Apartments Multifamily Conventional 78 1 Glenwood Plaza Office Suburban 79 1 Mayfaire Towne Center Retail Anchored 80 2 Deerwood Crossing Apartments(11) Multifamily Conventional 81 1 English Village Retail Anchored 82 1 The Village at Heather Ridge Pool Office Suburban 82.01 Heather Ridge Bank Building Office Suburban 82.02 Heather Ridge Office Building Office Suburban 83 2 Sunnygate Village Apartments Multifamily Conventional 84 1 Coddle Creek Shopping Center Retail Anchored 85 1 Commons V Medical Office Office Medical 86 1 Plaza 57 Mixed Use Retail/Office 87 1 8300 East Raintree Drive Mixed Use Office/Warehouse 88 1 Bella Piazza Retail Unanchored 89 1 17000 Ventura Boulevard Mixed Use Office/Retail 90 1 Willimantic Plaza Retail Anchored 91 2 Imperial Towers Apartments Multifamily Conventional 92 1 Cardiff Plaza Shopping Center Retail Unanchored 93 1 Medical Office Building Office Medical 94 1 Bath Shopping Center Retail Anchored 95 2 7400 Apartments Multifamily Conventional 96 2 Dutch Village Apartments(12) Multifamily Conventional 97 1 Hampton Inn - Bennington, VT(13) Hospitality Limited Service 98 1 Lantern Bend Medical Office Medical 99 2 Fountain Park Apartments Multifamily Conventional 100 1 Bunge North America Industrial Warehouse/Distribution 101 1 Shoppes at Pennington(14) Mixed Use Retail/Office 102 1 Columbia Summit Retail Anchored 103 1 Galleria Shopping Center Retail Unanchored 104 1 Sunset Ridge Center Retail Unanchored 105 1 Barchester Pool Land Various 105.01 Mansion House Center Ground Lease Land Mixed Use 105.02 Pinewood Estates Apartments Ground Lease Land Multifamily 105.03 Winrock Villas Condominiums Ground Lease Land Multifamily 105.04 National City Bank Building Ground Lease Land Office 105.05 Albuquerque Plaza Ground Lease Land Mixed Use 106 1 Shoppes at Indian Trail Retail Shadow Anchored 107 1 Summerlin Office Building Office Suburban 108 2 Village Square Apartments Multifamily Conventional 109 1 The Timmons Place Office Building Office Suburban 110 1 1331 Gemini Building Office Suburban 111 1 Village Pavilion Retail Unanchored 112 2 The Apartments at 1515 West Morse Avenue Multifamily Conventional 113 2 5724-32 South Blackstone Avenue Multifamily Conventional 114 2 Stanford Place II Apartments Multifamily Conventional 115 1 Rockbridge Place Retail Anchored 116 1 Schertz Retail Center Retail Shadow Anchored 117 1 Holiday Inn Express - Heber City , UT Hospitality Limited Service 118 1 Shops at East-West Connector Retail Unanchored 119 1 The Timmons Square Office Building Office Suburban 120 2 Clearwater Estates III and IV Multifamily Conventional 121 1 North Tucker Garage Special Purpose Parking Garage/Retail 122 1 SilverLeaf Suites - Eagle, CO(15) Hospitality Extended Stay 123 1 Warehouse Terminal - Manitowac, WI Industrial Warehouse 124 1 701 Interstate 20 East Office Medical 125 1 Ridge Road Shopping Center Retail Shadow Anchored 126 1 OfficeMax - Eden Prairie, MN Retail Single Tenant 127 2 4717 North Winthrop Apartments Multifamily Conventional 128 1 Pay Low - Gary, IN Retail Single Tenant 129 1 Wiseway Retail Single Tenant 130 1 Walgreens - Ozark, MO Retail Single Tenant 131 1 Warehouse Terminal - Menominee, MI Industrial Warehouse 132 1 Raintree Building Industrial Warehouse 133 1 Tractor Supply - Rutland, VT Retail Single Tenant 134 1 Tractor Supply - Watertown, WI Retail Single Tenant 135 1 Archives One - Malvern, PA Industrial Warehouse 136 1 Village Square Office Suburban 137 1 Baseline Industrial Buildings Industrial Flex 138 1 Ocean Rose Inn - Narragansett, RI(16) Hospitality Limited Service 139 1 Archives One - Greensboro, NC Industrial Warehouse 140 1 IHOP - Pearland, TX Retail Single Tenant 141 1 National Tire & Battery at Greens Landing Retail Single Tenant 142 1 Archives One - Essex Junction, VT Industrial Warehouse 143 1 Comerica Bank at Preston Center Retail Single Tenant INITIAL DEPOSIT TO MORTGAGE MONTHLY TAX MONTHLY INSURANCE ANNUAL DEPOSIT TO REPLACEMENT RESERVES CAPITAL IMPROVEMENTS LOAN NUMBER ESCROW ($) ESCROW ($) ($) RESERVE ($) - ------------------------------------------------------------------------------------------------------------------ 1 1.01 1.02 1.03 1.04 1.05 1.06 1.07 1.08 1.09 1.10 1.11 1.12 1.13 1.14 1.15 1.16 1.17 1.18 1.19 1.20 2 2.01 2.02 2.03 2.04 2.05 2.06 2.07 2.08 2.09 2.10 2.11 2.12 2.13 2.14 2.15 2.16 2.17 2.18 2.19 2.20 2.21 2.22 2.23 2.24 2.25 2.26 2.27 2.28 2.29 2.30 2.31 2.32 2.33 2.34 2.35 2.36 2.37 2.38 2.39 2.40 2.41 2.42 2.43 2.44 2.45 2.46 3 3.01 3.02 3.03 3.04 3.05 3.06 3.07 3.08 3.09 3.10 3.11 3.12 3.13 3.14 3.15 3.16 3.17 3.18 3.19 3.20 3.21 3.22 3.23 3.24 3.25 3.26 3.27 3.28 3.29 3.30 3.31 3.32 3.33 3.34 3.35 3.36 3.37 3.38 3.39 3.40 3.41 3.42 3.43 3.44 3.45 3.46 3.47 3.48 3.49 3.50 3.51 3.52 4 363,596 12,819 35,904 102,750 5 140,394 4.0% of Yearly Gross Revenue 6 6.01 6.02 6.03 7 92,471 4.0% of Yearly Gross Revenue 2,500 7.01 7.02 7.03 7.04 7.05 8 144,957 26,989 41,383 3,815,394 9 77,404 53,966 10 11 12 163,243 13 97,637 4,621 20,523 86,710 14 27,519 4,683 53,847 17,500 15 16 84,432 4,884 25,014 3,239,131 17 36,591 3,858 18 19 46,788 20 7,465 17,589 541,848 21 35,823 8,999 200,040 21.01 21.02 22 31,565 2,338 48,894 22.01 22.02 23 14,188 282,996 6,250 24 46,389 8,627 27,947 44,375 25 21,015 5,982 98,976 26 90,721 4.0% of Yearly Gross Revenue 27 67,276 10,698 77,700 28 14,728 92,250 29 30 32,904 3,578 31 20,541 4,599 71,556 32 46,428 33 12,155 12,946 587,352 85,000 34 35 21,550 2,563 15,192 36 37 41,042 8,146 20,209 38 17,500 4,000 58,800 39 30,386 40 3,869 41 31,250 42 43 11,291 1,262 44 24,605 2,017 4,960 45 44,744 5,485 77,700 37,500 46 47 21,605 3,213 64,141 48 14,175 9,366 49 16,108 2,073 50 51 52 11,667 4,134 24,648 53 2,953 54 17,917 2,998 7,800 55 211 10,995 40,572 56 12,691 4,690 18,099 57 14,386 1,982 22,994 57.01 57.02 58 11,718 753 58.01 58.02 58.03 58.04 58.05 59 8,921 3,187 25,792 60 61 11,800 5,586 62 11,793 63 652 2,193 64 6,900 2,250 6,210 65 4,286 6,851 66 41,741 6,342 60,750 67 10,352 756 23,667 68 11,408 1,141 7,072 69 11,612 2,685 54,000 70 7,693 71 72 17,363 816 73 9,836 5,637 15,190 74 10,147 75 6,860 2,920 22,464 76 11,289 2,729 20,400 77 6,116 2,064 78 2,212 1,740 79 80 9,294 71,250 635,345 81 5,823 2,367 10,400 82 4,782 1,651 11,551 82.01 82.02 83 8,250 2,781 35,433 166,425 84 6,892 85 9,165 4,752 11,028 86 12,448 725 3,786 87 8,506 609 12,998 88 15,580 1,213 4,193 89 8,572 455 8,778 90 91 12,239 68,634 828,748 92 9,259 2,951 33,469 93 7,500 504 3,993 94 8,659 6,552 23,125 95 11,460 5,863 48,216 127,075 96 5,841 50,750 364,597 97 7,777 2,849 3.0% of Yearly Gross Revenue 98 14,050 99 9,366 3,980 49,104 100 101 1,071 947 2,656 102 5,866 1,338 24,802 103 8,864 731 4,972 104 3,184 642 105 105.01 105.02 105.03 105.04 105.05 106 628 517 107 3,942 1,315 3,978 108 12,439 2,238 109 110 8,964 11,999 111 112 4,993 953 16,500 113 3,715 1,687 12,600 114 2,579 2,231 16,600 115 5,823 5,701 93,500 116 3,502 1,971 117 2,100 1,187 56,114 1,047,931 118 3,107 119 120 4,098 797 12,000 121 50,000 122 4,040 1,129 70,862 123 6,268 2,835 22,950 124 3,146 720 2,655 125 11,496 2,503 10,272 126 5,023 1,800 127 3,125 1,494 10,200 128 17,932 6,875 129 5,270 214,375 130 131 4,020 1,106 14,192 132 2,950 379 3,298 133 134 135 136 2,898 569 8,319 86,625 137 2,760 305 3,959 58,215 138 1,892 2,042 16,563 13,750 139 140 603 141 48 142 143 INITIAL DEPOSIT TO MORTGAGE CAPITAL IMPROVEMENTS LOAN NUMBER RESERVE ($) INITIAL TI/LC ESCROW ($) ONGOING TI/LC FOOTNOTE - --------------------------------------------------------------------------------------------- 1 18,200,095 1.01 1.02 1.03 1.04 1.05 1.06 1.07 1.08 1.09 1.10 1.11 1.12 1.13 1.14 1.15 1.16 1.17 1.18 1.19 1.20 2 2.01 2.02 2.03 2.04 2.05 2.06 2.07 2.08 2.09 2.10 2.11 2.12 2.13 2.14 2.15 2.16 2.17 2.18 2.19 2.20 2.21 2.22 2.23 2.24 2.25 2.26 2.27 2.28 2.29 2.30 2.31 2.32 2.33 2.34 2.35 2.36 2.37 2.38 2.39 2.40 2.41 2.42 2.43 2.44 2.45 2.46 3 3.01 3.02 3.03 3.04 3.05 3.06 3.07 3.08 3.09 3.10 3.11 3.12 3.13 3.14 3.15 3.16 3.17 3.18 3.19 3.20 3.21 3.22 3.23 3.24 3.25 3.26 3.27 3.28 3.29 3.30 3.31 3.32 3.33 3.34 3.35 3.36 3.37 3.38 3.39 3.40 3.41 3.42 3.43 3.44 3.45 3.46 3.47 3.48 3.49 3.50 3.51 3.52 4 102,750 3,000,000 5 6 6.01 6.02 6.03 7 2,500 7.01 7.02 7.03 7.04 7.05 8 3,815,394 3,500,000 (1) 9 (1) 10 3,756,047 11 12 13 86,710 3,000,000 (1) 14 17,500 15 1,719,172 16 3,239,131 2,000,000 (1) 17 18 1,940,921 19 20 21 21.01 21.02 22 22.01 22.02 23 6,250 24 44,375 25 26 27 28 29 30 31 32 (1) 33 85,000 34 35 1,300,000 36 37 38 39 40 31,000 41 31,250 42 43 44 1,150,000 (1) 45 37,500 46 47 48 49 50 665,000 51 52 53 54 (1) 55 56 57 (1) 57.01 57.02 58 58.01 58.02 58.03 58.04 58.05 59 60 61 62 63 64 65 66 67 250,000 (1) 68 500,000 (1) 69 70 71 72 73 (1) 74 75 76 200,000 (1) 77 78 79 80 635,345 81 82 (1) 82.01 82.02 83 166,425 84 85 (1) 86 (1) 87 (1) 88 (1) 89 90 91 828,748 92 175,000 (1) 93 (1) 94 23,125 95 127,075 96 364,597 97 98 99 100 101 (1) 102 (1) 103 (1) 104 (1) 105 105.01 105.02 105.03 105.04 105.05 106 (1) 107 50,000 (1) 108 109 146,000 110 (1) 111 112 113 114 115 93,500 116 73,931 (1) 117 1,047,931 118 385,000 119 117,000 120 121 50,000 122 123 124 (1) 125 20,000 (1) 126 127 128 129 214,375 130 131 132 130,000 (1) 133 134 135 136 86,625 (1) 137 58,215 40,000 (1) 138 13,750 139 140 13,072 (1) 141 142 143 (1) In addition to any escrows funded at loan closing for potential TI/LC expenses, the related Mortgage Loan requires funds to be escrowed during some or all of the loan terms for TI/LC expenses, which may be incurred during the term of the related Mortgage Loans. In certain instances, escrowed funds may be released to the borrower upon satisfaction of certain leasing conditions. (2) Annual deposits to the replacement reserve are $541,848 through the first year and 4.0% of gross revenue thereafter. (3) Commencing March 11, 2009, annual deposits to the replacement reserve are $200,040. (4) Commencing July 11, 2009, annual deposit to the replacement reserve is $98,976. (5) Commencing on November 11, 2008 annual deposits to the replacement reserve are $77,700. (6) Loan number 29 was removed from Annex A-1 included in the Free Writing Prospectus dated June 10, 2007. (7) Commencing July 11, 2009, annual deposits to the replacement reserve are $71,556. (8) Annual deposits to the replacement reserve are $587,352 through April 11, 2008 and 4.0% of gross revenue thereafter. (9) Commencing July 11, 2011, annual deposits to the replacement reserve are $15,192. (10) Commencing on June 11, 2010, annual deposits to the replacement reserve are $25,792. (11) Commencing on May 11, 2010, annual deposits to the replacement reserve are $71,250. (12) Commencing May 11, 2010, annual deposits to the replacement reserve are $50,750. (13) Deposit to the replacement reserve is $6,025 on the first payment date and annual deposits are 3.0% of gross revenue thereafter. (14) Commencing June 11, 2010, annual deposits to the replacement reserve are $2,656. (15) Annual deposits to the replacement reserve are $70,682 during the first year and 4.0% of gross revenue thereafter. (16) Annual deposits to the replacement reserve are $16,563 through May 11, 2008 and 4.0% of gross revenue thereafter.
WACHOVIA BANK COMMERCIAL MORTGAGE TRUST SERIES 2007-C32 ANNEX A-4 COMMERCIAL TENANT SCHEDULE MORTGAGE LOAN CUT-OFF LOAN GROUP GENERAL DATE LOAN NUMBER NUMBER PROPERTY NAME PROPERTY TYPE SPECIFIC PROPERTY TYPE BALANCE ($) - ----------------------------------------------------------------------------------------------------------------------------------- 1 1 Beacon D.C. & Seattle Pool Various Various 414,000,000 1.01 Market Square Office CBD 1.02 Polk & Taylor Buildings Office Suburban 1.03 Wells Fargo Center Office CBD 1.04 One, Two & Three Lafayette Centre Office CBD 1.05 Booz Allen Complex Office Suburban 1.06 Key Center Office CBD 1.07 Sunset North Office Suburban 1.08 City Center Bellevue Office CBD 1.09 Plaza Center and US Bank Tower Office CBD 1.10 1616 Fort Myer Drive Office Suburban 1.11 American Center Office Suburban 1.12 Eastgate Office Park Office Suburban 1.13 Liberty Place Office CBD 1.14 Lincoln Executive Center Buildings I, Office Suburban II, III, A&B 1.15 11111 Sunset Hills Road Office Suburban 1.16 Army and Navy Club Building Office CBD 1.17 Plaza East Office CBD 1.18 Reston Town Center Mixed Use Office/Retail 1.19 1300 North Seventeenth Street Office Suburban 1.20 Washington Mutual Tower Office CBD 3 1 DDR Southeast Pool Retail Anchored 221,250,000 3.01 Hilltop Plaza Retail Anchored 3.02 Largo Town Center Retail Anchored 3.03 Midway Plaza Retail Anchored 3.04 Riverstone Plaza Retail Anchored 3.05 Highland Grove Retail Anchored 3.06 Riverdale Shops Retail Anchored 3.07 Skyview Plaza Retail Anchored 3.08 Apple Blossom Corners Retail Anchored 3.09 Fayetteville Pavilion Retail Anchored 3.10 Creekwood Crossing Retail Anchored 3.11 Flamingo Falls Retail Anchored 3.12 Harundale Plaza Retail Anchored 3.13 Meadowmont Village Center Retail Anchored 3.14 Springfield Commons Retail Anchored 3.15 Northlake Commons Retail Anchored 3.16 Village Square at Golf Retail Anchored 3.17 Oviedo Park Crossing Retail Anchored 3.18 Shoppes of Golden Acres Retail Anchored 3.19 Bardmoor Shopping Center Retail Anchored 3.20 Rosedale Shopping Center Retail Anchored 3.21 Casselberry Commons Retail Anchored 3.22 Shoppes at New Tampa Retail Anchored 3.23 Crossroads Plaza Retail Anchored 3.24 Plaza Del Paraiso Retail Anchored 3.25 North Pointe Plaza Retail Anchored 3.26 Melbourne Shopping Center Retail Anchored 3.27 Market Square (DDR) Retail Anchored 3.28 Shoppes of Lithia Retail Anchored 3.29 West Oaks Towne Center Retail Anchored 3.30 Sharon Greens Retail Anchored 3.31 Lakewood Ranch Retail Anchored 3.32 Cofer Crossing Retail Anchored 3.33 Clayton Corners Retail Anchored 3.34 Clearwater Crossing Retail Anchored 3.35 Shops at Paradise Pointe Retail Anchored 3.36 Killearn Center Retail Anchored 3.37 Conway Plaza Retail Anchored 3.38 River Run Shopping Center Retail Anchored 3.39 Aberdeen Square Retail Anchored 3.40 Derby Square Retail Anchored 3.41 Chickasaw Trails Shopping Center Retail Anchored 3.42 Shoppes at Lake Dow Retail Anchored 3.43 Shoppes of Ellenwood Retail Anchored 3.44 Shops at Oliver's Crossing Retail Anchored 3.45 Southwood Village Shopping Center Retail Anchored 3.46 Paraiso Plaza Retail Anchored 3.47 Sheridan Sqaure Retail Anchored 3.48 Countryside Shopping Center Retail Anchored 3.49 Shoppes of Citrus Hills Retail Anchored 3.50 Crystal Springs Shopping Center Retail Anchored 3.51 Sexton Commons Retail Anchored 3.52 Hairston Crossing Retail Anchored 4 1 Two Herald Square Mixed Use Office/Retail 200,000,000 6 1 DDR-TRT Pool Retail Anchored 110,000,000 6.01 Centerton Square Retail Anchored 6.02 Beaver Creek Commons Retail Anchored 6.03 Mount Nebo Pointe Retail Anchored 8 1 17 Battery Place South Office CBD 95,000,000 9 1 Rockvale Square Retail Outlet 92,400,000 10 1 Centerside II Office Suburban 89,300,000 11 1 Citadel Mall Retail Anchored 75,040,500 12 1 Port Chester Shopping Center Retail Anchored 70,000,000 13 1 60 Madison Avenue Office CBD 66,500,000 14 1 3600 Wilshire Boulevard Office CBD 64,000,000 15 1 La Jolla Centre I Office Suburban 60,000,000 16 1 450-460 Park Avenue South Office CBD 54,000,000 17 1 Stadium Crossings Mixed Use Office/Retail 47,000,000 18 1 La Jolla Centre II Office Suburban 46,000,000 19 1 Roosevelt Square Retail Anchored 46,000,000 22 1 Jamison Valley Holdings Pool Office Suburban 38,000,000 22.01 Sherman Oaks Atrium Office Suburban 22.02 West Hills Plaza Office Suburban 24 1 Barrington Business Center Industrial Flex 36,100,000 29 Reserved(1) 32 1 Wellington Market Place Retail Anchored 30,000,000 34 1 Franklin Square III Retail Anchored 29,400,000 35 1 Siena Office Park Office Suburban 28,620,000 36 1 Columbus Park Crossing Shopping Center Retail Anchored 28,000,000 37 1 Vestal Park Mixed Use Student Housing/Retail/Office 27,000,000 40 1 141 5th Avenue Retail Single Tenant 25,000,000 41 1 Marietta Trade Center Retail Anchored 25,000,000 42 1 Majestic Square Mixed Use Retail/Office 23,850,000 43 1 138 Spring Street Mixed Use Office/Retail 23,500,000 44 1 72 Madison Avenue Office CBD 22,000,000 46 1 Pompano Plaza Retail Anchored 18,850,000 47 1 Wildwood North Shopping Center Retail Anchored 18,700,000 48 1 Federal Law Center Office Suburban 17,800,000 50 1 Colonial Promenade Bear Lake Retail Anchored 16,720,000 51 1 Mercury Computer Office Suburban 16,200,000 53 1 Mount Pleasant Square Retail Anchored 15,500,000 54 1 65 West 36th Street Office CBD 14,750,000 56 1 Athens West Retail Anchored 13,760,000 57 1 Peachtree Medical Office Pool Office Medical 13,530,000 57.01 Yorktown Medical Center Office Medical 57.02 Shakerag Medical Center Office Medical 58 1 BPRE Pool Office Suburban 13,200,000 58.01 11820 Pierce Street Office Suburban 58.02 8131 East Indian Bend Road Office Suburban 58.03 8111 East Indian Bend Road Office Suburban 58.04 8115 East Indian Bend Road Office Suburban 58.05 7328 East Stetson Drive Office Suburban 60 1 Shoppes at Woodhill Retail Shadow Anchored 13,100,000 63 1 Sunset Commons Retail Anchored 12,988,766 64 1 XSport Fitness - Downers Grove, IL Retail Single Tenant 12,936,479 65 1 Topsham Crossing Center Retail Anchored 12,720,000 67 1 Cupertino Town Center Office Suburban 12,400,000 68 1 One Front Street Office CBD 11,800,000 71 1 Michael's Warehouse & Distribution Facility Industrial Warehouse/Distribution 11,200,000 72 1 Parmer-McNeil Plaza Shopping Center Retail Unanchored 11,050,000 73 1 159-181 Second Avenue Office CBD 11,000,000 74 1 Midtown Square(2) Mixed Use Retail/Parking Garage/Industrial 11,000,000 76 1 1500 West Park Drive Office Suburban 10,800,000 78 1 Glenwood Plaza Office Suburban 10,550,000 79 1 Mayfaire Towne Center Retail Anchored 10,490,379 81 1 English Village Retail Anchored 10,400,000 82 1 The Village at Heather Ridge Pool Office Suburban 10,400,000 82.01 Heather Ridge Bank Building Office Suburban 82.02 Heather Ridge Office Building Office Suburban 84 1 Coddle Creek Shopping Center Retail Anchored 10,050,000 85 1 Commons V Medical Office Office Medical 10,000,000 86 1 Plaza 57 Mixed Use Retail/Office 9,250,000 87 1 8300 East Raintree Drive Mixed Use Office/Warehouse 9,200,000 88 1 Bella Piazza Retail Unanchored 9,000,000 89 1 17000 Ventura Boulevard Mixed Use Office/Retail 8,800,000 90 1 Willimantic Plaza Retail Anchored 8,800,000 92 1 Cardiff Plaza Shopping Center Retail Unanchored 8,000,000 93 1 Medical Office Building Office Medical 8,000,000 94 1 Bath Shopping Center Retail Anchored 7,920,000 98 1 Lantern Bend Medical Office Medical 6,728,000 100 1 Bunge North America Industrial Warehouse/Distribution 6,262,000 101 1 Shoppes at Pennington Mixed Use Retail/Office 6,100,000 102 1 Columbia Summit Retail Anchored 6,000,000 103 1 Galleria Shopping Center Retail Unanchored 6,000,000 104 1 Sunset Ridge Center Retail Unanchored 6,000,000 105 1 Barchester Pool(3) Land Various 5,900,000 105.01 Mansion House Center Ground Lease Land Mixed Use 105.02 Pinewood Estates Apartments Ground Lease Land Multifamily 105.03 Winrock Villas Condominiums Ground Lease Land Multifamily 105.04 National City Bank Building Ground Lease Land Office 105.05 Albuquerque Plaza Ground Lease Land Mixed Use 106 1 Shoppes at Indian Trail Retail Shadow Anchored 5,650,000 107 1 Summerlin Office Building Office Suburban 5,600,000 109 1 The Timmons Place Office Building Office Suburban 5,350,000 110 1 1331 Gemini Building Office Suburban 5,250,000 111 1 Village Pavilion Retail Unanchored 5,000,000 115 1 Rockbridge Place Retail Anchored 4,300,000 116 1 Schertz Retail Center Retail Shadow Anchored 4,250,000 118 1 Shops at East-West Connector Retail Unanchored 4,140,000 119 1 The Timmons Square Office Building Office Suburban 3,850,000 121 1 North Tucker Garage Special Purpose Parking Garage/Retail 3,500,000 123 1 Warehouse Terminal - Manitowac, WI Industrial Warehouse 3,478,302 124 1 701 Interstate 20 East Office Medical 3,412,500 125 1 Ridge Road Shopping Center Retail Shadow Anchored 3,400,000 126 1 OfficeMax - Eden Prairie, MN Retail Single Tenant 3,197,148 128 1 Pay Low - Gary, IN Retail Single Tenant 2,747,709 129 1 Wiseway Retail Single Tenant 2,747,709 130 1 Walgreens - Ozark, MO Retail Single Tenant 2,399,000 131 1 Warehouse Terminal - Menominee, MI Industrial Warehouse 2,385,121 132 1 Raintree Building Industrial Warehouse 2,100,000 133 1 Tractor Supply - Rutland, VT Retail Single Tenant 2,095,000 134 1 Tractor Supply - Watertown, WI Retail Single Tenant 1,994,000 135 1 Archives One - Malvern, PA Industrial Warehouse 1,856,544 136 1 Village Square Office Suburban 1,750,000 137 1 Baseline Industrial Buildings Industrial Flex 1,700,000 139 1 Archives One - Greensboro, NC Industrial Warehouse 1,117,872 140 1 IHOP - Pearland, TX Retail Single Tenant 1,100,000 141 1 National Tire & Battery at Greens Landing Retail Single Tenant 1,100,000 142 1 Archives One - Essex Junction, VT Industrial Warehouse 1,097,910 143 1 Comerica Bank at Preston Center Retail Single Tenant 1,000,000 MORTGAGE LOAN NUMBER OF UNIT OF LARGEST TENANT NUMBER UNITS (UNITS) MEASURE LARGEST TENANT % OF NRA - ------------------------------------------------------------------------------------------------------------------------------ 1 9,848,341 Sq. Ft. Various Various 1.01 678,348 Sq. Ft. Fulbright & Jaworski 18.8% 1.02 904,226 Sq. Ft. GSA - Department of Defense 60.7% 1.03 944,141 Sq. Ft. Wells Fargo Bank NA 19.9% 1.04 711,495 Sq. Ft. Commodity Future 22.7% 1.05 731,234 Sq. Ft. Booz Allen Hamilton 97.7% 1.06 473,988 Sq. Ft. Infospace 27.6% 1.07 463,182 Sq. Ft. Expedia 57.4% 1.08 465,765 Sq. Ft. HDR Engineering 11.7% 1.09 466,948 Sq. Ft. US Bank National 9.8% 1.10 294,521 Sq. Ft. DHS - GS-11B-01687 24.6% 1.11 329,695 Sq. Ft. SunTrust Bank 18.1% 1.12 251,088 Sq. Ft. Fiserv Seattle 14.7% 1.13 163,936 Sq. Ft. GSA - Department of Justice 42.4% 1.14 277,672 Sq. Ft. High Tech Institute 11.3% 1.15 216,469 Sq. Ft. XO Communications 77.4% 1.16 102,822 Sq. Ft. New York Times 21.5% 1.17 148,952 Sq. Ft. Serena Software 19.3% 1.18 764,103 Sq. Ft. College Entrance Exam 9.3% 1.19 380,743 Sq. Ft. BAE Systems 19.3% 1.20 1,079,013 Sq. Ft. Perkins Coie 26.5% 3 7,297,943 Sq. Ft. Various Various 3.01 245,774 Sq. Ft. Century Theater 21.1% 3.02 260,797 Sq. Ft. Regency Furniture 27.2% 3.03 227,209 Sq. Ft. Publix 24.7% 3.04 307,716 Sq. Ft. Belk 19.5% 3.05 312,546 Sq. Ft. Kohl's 31.4% 3.06 273,307 Sq. Ft. Kohl's 31.5% 3.07 281,244 Sq. Ft. Kmart 34.1% 3.08 240,560 Sq. Ft. Kohl's 34.9% 3.09 272,385 Sq. Ft. Creative Basket Express 16.5% 3.10 227,085 Sq. Ft. Beall's 29.4% 3.11 108,565 Sq. Ft. Fresh Market 16.9% 3.12 217,619 Sq. Ft. Value City 37.5% 3.13 132,745 Sq. Ft. Harris Teeter 33.8% 3.14 271,729 Sq. Ft. Kohl's 31.9% 3.15 149,658 Sq. Ft. Ross Dress for Less 20.0% 3.16 126,486 Sq. Ft. Publix 31.5% 3.17 186,212 Sq. Ft. Linens 'N Things 16.5% 3.18 130,609 Sq. Ft. Publix 33.9% 3.19 152,667 Sq. Ft. Publix 42.9% 3.20 119,197 Sq. Ft. Harris Teeter 39.2% 3.21 243,176 Sq. Ft. Ross Dress for Less 17.6% 3.22 158,222 Sq. Ft. Beall's 35.0% 3.23 89,627 Sq. Ft. Shoprite 67.8% 3.24 82,441 Sq. Ft. Publix 74.2% 3.25 104,460 Sq. Ft. Publix 46.8% 3.26 204,216 Sq. Ft. Big Lots 18.4% 3.27 121,766 Sq. Ft. Office Depot 20.5% 3.28 71,430 Sq. Ft. Publix 76.1% 3.29 66,539 Sq. Ft. Michaels 35.7% 3.30 98,317 Sq. Ft. Kroger 55.1% 3.31 69,471 Sq. Ft. Publix 63.7% 3.32 137,757 Sq. Ft. Kroger 47.1% 3.33 125,653 Sq. Ft. Lowe's Foods 36.1% 3.34 90,566 Sq. Ft. Kroger 59.8% 3.35 83,929 Sq. Ft. Publix 52.7% 3.36 95,229 Sq. Ft. Publix 55.8% 3.37 117,723 Sq. Ft. Publix 32.2% 3.38 93,643 Sq. Ft. Publix 45.9% 3.39 70,555 Sq. Ft. Publix 68.8% 3.40 128,210 Sq. Ft. Giant Eagle 54.6% 3.41 75,492 Sq. Ft. Publix 63.3% 3.42 73,271 Sq. Ft. Publix 60.4% 3.43 67,721 Sq. Ft. Publix 65.4% 3.44 76,512 Sq. Ft. Lowe's Foods 55.4% 3.45 62,840 Sq. Ft. Publix 71.4% 3.46 60,712 Sq. Ft. Publix 62.4% 3.47 67,475 Sq. Ft. Publix 62.4% 3.48 73,986 Sq. Ft. Winn-Dixie 69.3% 3.49 68,927 Sq. Ft. Publix 69.4% 3.50 66,986 Sq. Ft. Publix 66.1% 3.51 49,097 Sq. Ft. Harris Teeter 73.3% 3.52 57,884 Sq. Ft. Publix 76.5% 4 354,298 Sq. Ft. Publicis 33.7% 6 678,553 Sq. Ft. Various Various 6.01 432,327 Sq. Ft. Wegman's Food (Ground Lease) 30.1% 6.02 143,129 Sq. Ft. Linens 'N Things 19.5% 6.03 103,097 Sq. Ft. Sportsman's Warehouse 46.8% 8 413,828 Sq. Ft. Continental Stock Transfer & Trust Company 8.5% 9 539,661 Sq. Ft. Pottery Barn 5.5% 10 287,494 Sq. Ft. AIG Marketing, Inc. 19.2% 11 296,707 Sq. Ft. Old Navy 5.1% 12 524,479 Sq. Ft. Kohl's 38.7% 13 186,575 Sq. Ft. Weight Watchers Internat 16.2% 14 414,202 Sq. Ft. California Family Health 5.0% 15 165,184 Sq. Ft. Colliers Iliff Thorn & Company 12.5% 16 166,761 Sq. Ft. WKP-Spier, LLC 16.1% 17 165,662 Sq. Ft. Bally's Total Fitness 22.0% 18 147,047 Sq. Ft. Chatham Capital 15.4% 19 309,360 Sq. Ft. Belk 21.7% 22 176,977 Sq. Ft. Various Various 22.01 92,996 Sq. Ft. Whole Foods 24.8% 22.02 83,981 Sq. Ft. One Call Medical 12.3% 24 931,560 Sq. Ft. National Distribution Centers, Inc. 56.4% 29 32 171,955 Sq. Ft. Wal-Mart 27.0% 34 272,181 Sq. Ft. Kohl's 29.6% 35 101,278 Sq. Ft. HQ Global Workplaces, Inc 17.6% 36 225,922 Sq. Ft. Kohl's 39.3% 37 441,648 Sq. Ft. Ambling / University Park (Ground Lease) 54.2% 40 6,000 Sq. Ft. HSBC USA, National Association 100.0% 41 316,576 Sq. Ft. Wal-Mart 65.2% 42 74,786 Sq. Ft. Saks Fifth Avenue 40.1% 43 17,000 Sq. Ft. Yabu Pushelberg, Inc. 29.4% 44 54,000 Sq. Ft. Wind-Up Entertainment, Inc 27.8% 46 127,484 Sq. Ft. Publix 35.8% 47 168,791 Sq. Ft. Bruno's Inc. 30.9% 48 93,665 Sq. Ft. GSA (Multi TT) 100.0% 50 131,317 Sq. Ft. Tuesday Morning 22.8% 51 185,327 Sq. Ft. Mercury Computer Systems Inc. 100.0% 53 89,004 Sq. Ft. Bi-Lo 52.7% 54 60,000 Sq. Ft. Majestic Pearl & Stone 8.3% 56 180,990 Sq. Ft. Goody's Family Clothing 22.1% 57 114,971 Sq. Ft. Various Various 57.01 91,654 Sq. Ft. Piedmont Fayette Hospital 19.3% 57.02 23,317 Sq. Ft. Mkt Street Mortgage 27.1% 58 43,028 Sq. Ft. Various Various 58.01 13,356 Sq. Ft. RBI Southern California, Inc. 50.9% 58.02 8,902 Sq. Ft. Retail Brokers, Inc. 100.0% 58.03 9,010 Sq. Ft. RBI Management Services, LLC 100.0% 58.04 6,000 Sq. Ft. Barness Papas Investments, LLC 100.0% 58.05 5,760 Sq. Ft. Apex Architecture, LLC & Global Retail Development Group, LLC 100.0% 60 85,277 Sq. Ft. Bed Bath & Beyond 29.3% 63 67,922 Sq. Ft. Piggly Wiggly 55.8% 64 41,400 Sq. Ft. XSport Fitness 100.0% 65 85,636 Sq. Ft. Dick's Sporting Goods 55.6% 67 56,351 Sq. Ft. Skillnet Solutions 6.9% 68 70,722 Sq. Ft. Elam & Burke 23.3% 71 506,828 Sq. Ft. Michaels Stores, Inc. 100.0% 72 50,962 Sq. Ft. Wachovia Bank 8.2% 73 69,043 Sq. Ft. Valley of California, Inc. 16.2% 74 27,715 Sq. Ft. SPI Club 54.7% 76 80,201 Sq. Ft. Health Plans 21.9% 78 131,572 Sq. Ft. Manning, Fulton & Skinner 21.6% 79 52,441 Sq. Ft. Fresh Market 40.9% 81 103,429 Sq. Ft. Goody's Family Clothing 33.8% 82 57,753 Sq. Ft. Various Various 82.01 35,404 Sq. Ft. Marshal Bank First 100.0% 82.02 22,349 Sq. Ft. HDR Engineering 49.1% 84 79,546 Sq. Ft. Harris Teeter (Ground Lease) 61.4% 85 55,132 Sq. Ft. Anchor Health Centers 73.4% 86 17,207 Sq. Ft. HSBC Bank USA, National Association 21.6% 87 61,896 Sq. Ft. Intrasight Tech, Inc 37.8% 88 27,954 Sq. Ft. Credit Union 14.4% 89 35,113 Sq. Ft. First Bank 18.6% 90 125,626 Sq. Ft. BJ's Wholesale Club 54.3% 92 139,456 Sq. Ft. Office Concepts 14.5% 93 39,935 Sq. Ft. Dermatology Associates 39.8% 94 43,677 Sq. Ft. CVS 21.4% 98 48,750 Sq. Ft. Drs Aquino Coleman 46.3% 100 107,520 Sq. Ft. Bunge Oils, Inc. 100.0% 101 26,489 Sq. Ft. Barones Tuscany Grill 14.6% 102 88,577 Sq. Ft. Complete Suite Furniture, Inc. 28.4% 103 38,247 Sq. Ft. Lamp & Lighting of the Bower 22.4% 104 19,600 Sq. Ft. Bio-Medical Applications Of NV, Inc. 45.9% 105 621,847 Sq. Ft. Various Various 105.01 104,315 Sq. Ft. Value St. Louis Associates, LP 100.0% 105.02 254,850 Sq. Ft. Alburquerque Plaza Office Investments, LLC 100.0% 105.03 218,100 Sq. Ft. W.B.W. Partners, LLC 100.0% 105.04 35,870 Sq. Ft. National City Bank 100.0% 105.05 8,712 Sq. Ft. Crescent Real Estate Fund 100.0% 106 33,586 Sq. Ft. Shoe Dept 14.4% 107 19,891 Sq. Ft. Christopher Homes, LLC 52.7% 109 48,998 Sq. Ft. T.N. Master Tile, LP 15.0% 110 59,709 Sq. Ft. ARES Corporation 19.8% 111 34,767 Sq. Ft. GA Foot & Ankle 25.3% 115 71,268 Sq. Ft. Food Depot 62.7% 116 19,715 Sq. Ft. Washington Mutual 17.8% 118 32,009 Sq. Ft. Isocracy Fitness, LLC 68.7% 119 30,772 Sq. Ft. Cabinets & Designs 12.3% 121 177,865 Sq. Ft. Central Parking System 90.6% 123 229,500 Sq. Ft. K & K Integrated Logistics 100.0% 124 26,552 Sq. Ft. Allied Health Professionals 50.5% 125 64,197 Sq. Ft. Wallys Party Factory 18.7% 126 18,000 Sq. Ft. OfficeMax 100.0% 128 68,750 Sq. Ft. Pay Low Discount Foods 100.0% 129 53,763 Sq. Ft. Wise Way 100.0% 130 14,820 Sq. Ft. Walgreens 100.0% 131 141,916 Sq. Ft. KK Integrated Logistics, Inc. 100.0% 132 16,488 Sq. Ft. Kingswood Collision 77.3% 133 21,688 Sq. Ft. Tractor Supply Company 100.0% 134 23,627 Sq. Ft. Tractor Supply Company 100.0% 135 32,416 Sq. Ft. Archives One, Inc. 100.0% 136 41,593 Sq. Ft. Noridian 78.4% 137 23,286 Sq. Ft. Sherwin Williams Co. 36.2% 139 40,025 Sq. Ft. ArchivesOne - Greensboro, NC 100.0% 140 4,022 Sq. Ft. IHOP 100.0% 141 8,064 Sq. Ft. National Tire & Battery 100.0% 142 20,000 Sq. Ft. Archives One 100.0% 143 3,608 Sq. Ft. Comerica Bank 100.0% MORTGAGE LARGEST LOAN TENANT EXP. 2ND LARGEST TENANT 2ND LARGEST TENANT NUMBER DATE 2ND LARGEST TENANT NAME % OF NRA EXP. DATE - ------------------------------------------------------------------------------------------------------------------------------------ 1 Various Various Various Various 1.01 6/30/2015 Shearman & Sterling 16.9% Multiple Spaces 1.02 Multiple Spaces Polk GSA 39.3% Multiple Spaces 1.03 Multiple Spaces King County 10.4% 7/31/2007 1.04 9/30/2015 Jackson & Campbell 6.2% 5/31/2010 1.05 Multiple Spaces Northern VA Family SV 0.5% 12/31/2007 1.06 2/28/2013 Keybank National Association 21.9% 7/31/2010 1.07 9/30/2009 Sierra Entertainment 27.6% 2/28/2010 1.08 12/31/2012 Oracle USA 6.6% 3/31/2009 1.09 12/31/2013 Business Service Center 7.7% 3/31/2009 1.10 Multiple Spaces GSA 16.0% 2/28/2011 1.11 Multiple Spaces HQ Global Workplaces 6.5% 3/31/2011 1.12 7/31/2008 Orrtax Software 13.3% 9/30/2013 1.13 1/31/2008 American Hospital Association 24.1% 8/31/2014 1.14 6/30/2014 John L Scott Real Estate Service 9.6% 4/30/2014 1.15 11/30/2007 Stanley Martin 13.4% 1/31/2016 1.16 12/31/2009 Jones Lang Lasalle 17.5% Multiple Spaces 1.17 1/31/2012 Barclay Dean 8.8% 8/31/2012 1.18 9/30/2009 Pfizer, Inc. 8.2% 9/30/2009 1.19 5/31/2014 Federal Network Systems 11.2% 11/30/2008 1.20 Multiple Spaces Washington Mutual Bank 16.8% 12/31/2010 3 Various Various Various Various 3.01 9/30/2016 Circuit City 15.9% 1/31/2017 3.02 5/31/2017 Shoppers Food Warehouse 19.1% 9/30/2009 3.03 11/3/2011 Ross Dress for Less 11.3% 1/31/2013 3.04 10/9/2018 Publix 16.7% 2/11/2018 3.05 1/31/2016 Marshall's 9.7% 1/31/2011 3.06 1/31/2024 Stop & Shop 20.0% 10/31/2016 3.07 7/31/2009 Publix 15.0% 4/6/2008 3.08 1/31/2018 Martin's Food Store 28.1% 5/1/2040 3.09 3/15/2020 Dick's Sporting Goods 16.5% 1/31/2017 3.10 4/30/2016 Macy's 20.4% 3/31/2009 3.11 2/28/2022 CVS 10.0% 10/4/2021 3.12 3/31/2015 A & P Company 26.1% 12/31/2019 3.13 4/30/2022 Yankelovich, Inc. 10.4% 7/31/2012 3.14 2/2/2019 Bed Bath & Beyond 12.9% 1/31/2010 3.15 1/31/2014 True Treasures 8.0% 12/31/2007 3.16 11/30/2008 Anthony's 8.2% 12/31/2011 3.17 1/31/2011 TJ Maxx 16.1% 11/30/2010 3.18 10/31/2022 Remington Steakhouse 6.1% 8/31/2015 3.19 7/27/2011 Home Shopping Network Out 10.9% 4/30/2009 3.20 8/31/2020 CVS 8.5% 1/31/2021 3.21 1/31/2013 Publix 14.8% 5/31/2012 3.22 4/30/2017 Publix 34.4% 10/31/2022 3.23 6/30/2024 Wawa 6.4% 8/31/2018 3.24 5/31/2023 Hollywood Video 6.6% 7/31/2008 3.25 8/21/2010 Fashion Bug 7.7% 1/31/2011 3.26 1/31/2009 Publix 13.7% 12/31/2019 3.27 12/31/2013 Petco 11.7% 9/30/2010 3.28 7/31/2023 Natures Health Food 4.5% 9/30/2007 3.29 2/28/2010 PetSmart 28.8% 1/31/2016 3.30 10/31/2021 Jumpsters 5.7% 4/30/2013 3.31 9/30/2021 Beef O'Brady's 3.8% 2/28/2012 3.32 3/31/2019 Goody's Family Clothing 19.9% 4/30/2014 3.33 9/21/2019 Dollar General 8.2% 4/30/2010 3.34 9/30/2023 Green Tea Chinese Restaurant 3.5% 12/31/2008 3.35 6/30/2021 Countrywide Home Loans 6.6% 3/31/2008 3.36 11/30/2011 CVS 8.9% 10/31/2010 3.37 10/31/2019 Beall's 10.2% 4/30/2010 3.38 2/15/2009 Athlete's Foot 3.7% 3/31/2012 3.39 10/17/2010 The REF Sports Bar & Grill 5.1% 10/31/2011 3.40 6/30/2016 Once Upon A Child 5.0% 5/31/2008 3.41 2/2/2014 Blockbuster 8.6% 11/30/2008 3.42 3/31/2022 Blockbuster 6.6% 6/30/2012 3.43 8/31/2023 Washington Mutual Bank 5.2% 10/28/2008 3.44 4/15/2023 Dollar Tree Store 10.5% 4/30/2008 3.45 9/30/2023 Starbucks 3.8% 2/28/2017 3.46 3/13/2017 Hollywood Video 9.9% 10/24/2014 3.47 4/17/2011 Dollar Tree Store 6.9% 2/28/2009 3.48 4/30/2017 Advance Auto Parts 9.5% 12/31/2008 3.49 4/3/2014 Blockbuster 5.8% 1/31/2008 3.50 10/31/2021 Blockbuster 7.1% 12/31/2011 3.51 8/22/2021 Italian Pie 6.2% 2/22/2012 3.52 12/31/2022 Washington Mutual Bank 4.8% 3/31/2012 4 8/30/2016 H&M Hennes & Mauritz 20.0% 1/30/2016 6 Various Various Various Various 6.01 8/31/2024 Sports Authority 9.3% 7/31/2015 6.02 1/31/2016 OfficeMax 14.0% 10/31/2014 6.03 11/30/2020 Developer's Diversified-Master Lease 30.2% 11/11/2008 8 7/12/2011 IT USA, Inc. 8.5% 4/30/2017 9 1/31/2018 VF Outlet 5.3% 3/31/2012 10 Multiple Spaces Commonwealth Land Title Co 11.9% 5/6/2011 11 1/31/2009 Finish Line 3.5% 1/31/2008 12 Multiple Spaces A & P Supermarket 9.8% 12/31/2017 13 9/30/2017 Bilinguals, Inc. 10.1% Multiple Spaces 14 9/30/2007 Southwestern Pacific Land Group 3.8% 6/6/2009 15 11/30/2016 IBM 9.7% 7/31/2010 16 11/14/2010 Mimeo.Com. Inc. 11.6% Multiple Spaces 17 6/30/2014 Hewlett Packard 20.6% 3/31/2010 18 2/28/2011 Marcus & Millichap Real Estate 10.4% 11/30/2010 19 1/31/2012 Publix 16.6% 7/31/2018 22 Various Various Various Various 22.01 2/28/2010 Ross Morgan 7.5% 7/31/2010 22.02 7/31/2009 Rockhardbody Total Fitness 12.2% 1/15/2011 24 5/31/2008 PGM Products 17.2% 12/31/2010 29 32 8/31/2018 Wellington Theatre 8 11.9% 9/30/2008 34 2/1/2019 Sports Authority 15.8% 8/31/2013 35 12/31/2016 National University 13.0% 5/31/2012 36 10/4/2026 Dick's Sporting Goods 19.9% 1/31/2018 37 12/31/2049 AIG 15.7% 2/28/2009 40 10/7/2020 41 10/25/2025 Dollar Tree Store 3.5% 5/31/2009 42 8/21/2026 The Beach Company 24.6% 3/31/2012 43 4/30/2009 Sunglass Hut 26.5% 7/31/2019 44 9/30/2010 Iridium Group 9.3% 2/28/2011 46 12/31/2026 Marshalls 29.9% 10/31/2016 47 5/31/2020 Gap 17.8% 1/31/2011 48 1/14/2016 50 1/15/2008 Lifestyle Family Fitness 21.1% 9/30/2010 51 3/1/2017 53 11/30/2024 West Marine 8.4% 2/28/2011 54 6/30/2014 Graubard & Nihamin PC 8.3% 1/31/2013 56 4/30/2011 Ingles Markets, Inc. 17.7% 9/30/2008 57 Various Various Various Various 57.01 9/30/2009 PMCC - Department of Medicine 19.1% 11/30/2012 57.02 4/30/2011 PMCC - Pediatrics 22.5% 11/30/2011 58 Various Various Various Various 58.01 12/31/2026 RBI Management Services California, Inc. 49.1% 12/31/2026 58.02 12/31/2026 58.03 12/31/2026 58.04 12/31/2026 58.05 12/31/2026 60 1/31/2015 Cost Plus World Market 21.5% 1/31/2015 63 5/31/2026 R & A BBQ 4.7% 11/30/2011 64 12/31/2022 65 1/31/2017 Bed Bath & Beyond 25.7% 1/31/2017 67 Multiple Spaces Gerst AAP and Gerst Software 5.4% 9/30/2009 68 12/31/2010 Perkins Cole 19.1% 6/14/2009 71 6/30/2023 72 11/30/2020 Las Curras Inc. 7.8% 2/28/2011 73 1/31/2011 DAB Enterprises, Inc. 13.2% 8/31/2017 74 11/30/2009 B&H Parking NA 1/1/2009 76 4/30/2009 United medical 10.7% 11/30/2008 78 9/30/2016 Branch Banking & Trust 20.9% 9/30/2008 79 3/31/2022 O2 Fitness 26.4% 12/31/2013 81 10/31/2012 Michaels Stores, Inc. 19.5% 8/31/2013 82 Various Various Various Various 82.01 11/30/2013 82.02 7/31/2015 Williams Insurance Agency, Inc. 25.4% 1/31/2015 84 8/4/2024 Bio-M-Bos 4.5% 1/31/2012 85 Multiple Spaces Collier Surgery Center 17.5% 4/30/2009 86 7/31/2015 Town Kitchen, LLC 21.5% 8/31/2015 87 9/30/2010 Amazing Mail.com, Inc. 35.4% 7/31/2012 88 7/31/2017 Cary Brown DDS 9.6% 9/30/2012 89 1/31/2017 Cannon Constructors 18.5% 7/31/2011 90 1/20/2019 Ocean State Job Lot Sotres 24.1% 1/31/2009 92 12/31/2007 Goodwill Industries of SN 10.8% 4/30/2008 93 4/30/2016 Keller Williams 26.2% 8/31/2017 94 1/31/2011 Movie Gallery (Home Vsn) 13.7% 11/30/2009 98 9/30/2018 E Cardio 22.6% 5/31/2014 100 4/30/2026 101 1/1/2017 Hip Square To The Power Of Two 8.2% 2/28/2012 102 7/31/2016 TVI, Inc. 23.0% 11/30/2011 103 9/30/2014 Bellini Juvenile Furniture 14.6% 12/31/2010 104 5/21/2017 Borch Inc. "Baja Lobster" 29.6% 3/31/2017 105 Various 105.01 4/30/2040 105.02 11/30/2051 105.03 3/2/2034 105.04 6/10/2045 105.05 6/30/2051 106 4/30/2012 Panera Bread 12.6% 12/31/2016 107 5/31/2012 Nevada Title Co. 21.3% 5/31/2008 109 12/31/2007 The Motherhood Center 14.0% 6/30/2009 110 Multiple Spaces Tietroniz Software 19.7% 3/1/2009 111 5/31/2010 Center for Premier Suites 19.7% 1/31/2011 115 11/30/2016 CVS 12.6% 10/31/2007 116 3/31/2011 Don's and Ben's, Gabriel Hldgs. 14.8% 10/31/2011 118 11/30/2020 Ecce Liben, Inc. 8.7% 4/4/2011 119 6/30/2008 Jerry Pope 11.0% 10/31/2007 121 3/31/2015 Perfect Pizza, Inc. 2.7% 11/23/2010 123 1/31/2022 124 12/31/2013 Tarrant County Hospital District 49.5% 8/31/2011 125 2/28/2012 Tuesday Morning 11.4% 7/15/2012 126 1/31/2018 128 5/31/2022 129 5/31/2022 130 11/30/2081 131 1/31/2022 132 7/31/2014 Dale Husband 22.7% 9/30/2007 133 7/30/2020 134 1/31/2021 135 12/31/2021 136 Multiple Spaces KVRR TV Fox 19.3% 10/31/2010 137 12/31/2007 Mesa Lighting & Fan 34.1% 8/31/2008 139 1/31/2022 140 4/30/2026 141 11/30/2031 142 12/31/2021 143 8/1/2016 MORTGAGE LOAN 3RD LARGEST TENANT % OF 3RD LARGEST TENANT NUMBER 3RD LARGEST TENANT NAME NRA EXP. DATE - ---------------------------------------------------------------------------------------------- 1 Various Various Various 1.01 Edison Electric Institute 11.3% 7/31/2015 1.02 1.03 Moss Adams 9.9% Multiple Spaces 1.04 AT&T Corp. 5.7% Multiple Spaces 1.05 YK and Wang 0.4% 10/31/2011 1.06 Symetra Finacial Corporation 15.1% 7/31/2015 1.07 American Family Mutual Insurance 6.1% Multiple Spaces 1.08 Cisco Systems 6.0% 2/28/2013 1.09 Wells Fargo Bank NA 5.3% Multiple Spaces 1.10 EADS 12.6% 8/31/2014 1.11 GSA 6.4% 8/31/2013 1.12 Great American Insurance 9.9% 12/31/2009 1.13 National Retail Federation 16.3% 3/31/2014 1.14 Peacehealth 9.3% 3/31/2014 1.15 Akamai Technologies 7.2% 5/31/2011 1.16 Constantine Cannon 12.2% 3/31/2008 1.17 National Medical Management 8.5% 7/31/2008 1.18 National Amusements 6.7% 2/28/2011 1.19 BBN Technologies 10.8% 11/30/2010 1.20 Davis Wright Tremaine 15.7% 12/31/2018 3 Various Various Various 3.01 Ross Dress For Less 11.2% 1/31/2013 3.02 Marshall's 10.3% 12/31/2011 3.03 Petco 6.7% 1/31/2014 3.04 Ross Dress for Less 9.8% 1/31/2013 3.05 Circuit City 9.0% 1/31/2016 3.06 Go 1 Dollar 4.2% 9/30/2013 3.07 Circuit City 11.7% 10/31/2008 3.08 OfficeMax 9.7% 4/30/2012 3.09 Linens 'N Things 12.8% 1/31/2016 3.10 Beall's Outlet 13.2% 4/30/2014 3.11 Ortiz-Parra Enter 9.2% 12/31/2011 3.12 A.J. Wright 11.5% 11/30/2009 3.13 B. Christopher's 4.4% 10/31/2015 3.14 Gander Mountain 11.5% 8/31/2014 3.15 Yum Yum Japanese Stakehouse 3.2% 8/31/2011 3.16 Boris International 4.4% 6/30/2011 3.17 Ross Dress For Less 16.1% 1/31/2010 3.18 Amscot Financial 4.0% 5/31/2014 3.19 Beall's 9.1% 10/31/2011 3.20 The Mindbody Experience 4.1% 1/31/2009 3.21 Stein Mart 14.2% 4/30/2015 3.22 Tropical Realty and Inves 3.4% 2/28/2008 3.23 Hallmark 5.6% 2/28/2014 3.24 Rotelli's Pizza & Pasta 2.2% 7/31/2013 3.25 S & K Famous Brands 4.8% 1/31/2011 3.26 ValueThrift 9.8% 1/31/2009 3.27 Grand Harbour Import Comp 9.8% 4/30/2010 3.28 Liquor Store 2.4% 11/30/2008 3.29 Family Christian Stores 7.5% 10/31/2010 3.30 Dollar Tree Store 5.5% 9/30/2011 3.31 Manhattan Liquors 3.8% 8/31/2012 3.32 Dollar & Party Store 3.0% 12/31/2008 3.33 Sherwin-Williams 4.0% 3/31/2010 3.34 BE Fitness, Inc. 3.1% 5/31/2009 3.35 Blockbuster 5.7% 7/31/2011 3.36 Bonefish Restaurant 5.6% 4/30/2013 3.37 Ross Dress for Less 8.7% 10/31/2015 3.38 RadioShack 3.2% 12/31/2010 3.39 Bikram Yoga 2.7% 9/30/2007 3.40 Play It Again Sports 3.2% 7/31/2009 3.41 Giovanni's Italian Restaurant 4.8% 11/30/2011 3.42 Los Portales Mexican Cuis 5.3% 3/31/2011 3.43 Beauty & More 4.1% 8/31/2008 3.44 Monte De Rey 5.5% 4/30/2008 3.45 Itza Pizza 3.3% 12/31/2008 3.46 Washington Mutual Bank 5.9% 8/31/2010 3.47 Pancho's Backyard 3.8% 7/31/2011 3.48 Blockbuster 8.1% 4/30/2012 3.49 Quizno's Subs 3.1% 1/31/2009 3.50 Hallmark 5.0% 2/28/2012 3.51 Fuquay Urgent Care 5.7% 9/30/2008 3.52 Jackson Hewitt Tax Service 2.5% 3/31/2012 4 Mercy College 15.5% 5/31/2022 6 Various Various Various 6.01 Jo-Ann Stores 8.2% 1/31/2015 6.02 PetSmart 13.3% 1/31/2020 6.03 Famous Footwear 6.2% 8/31/2016 8 Wall Street Access, Inc. 8.2% 10/31/2008 9 Calvert Retail (Reading China) 5.0% 11/30/2008 10 Health Net 10.2% 8/31/2009 11 New York & Company 3.0% 1/31/2016 12 Linens & Things, Inc. 9.5% 12/31/2015 13 Mergent, Inc. 7.9% 9/30/2008 14 The Philippine Consulate General 3.4% 9/30/2009 15 LMA North America, Inc. 8.9% 4/30/2010 16 Drumbeat Digital, LLC 8.4% 10/31/2012 17 Agilent Technologies 15.8% 3/31/2010 18 Scott Wage 9.1% 12/14/2007 19 SteinMart 14.9% 11/30/2008 22 Various Various Various 22.01 Executive Financial Lending 6.2% 11/30/2008 22.02 Kaiser Foundation Health 7.5% 12/31/2009 24 Windspeed Pennsauken 10.7% 6/30/2012 29 32 Walgreens 7.9% 8/31/2029 34 PetSmart 9.6% 1/31/2014 35 Countrywide Home Loan 11.9% 12/2/2009 36 T.J. Maxx 13.3% 3/31/2017 37 Nationwide Credit 12.4% 7/30/2009 40 41 Anna's Linens 3.2% 6/30/2015 42 RBC Dain Rauscher Inc 7.9% 7/31/2007 43 Amore Pacific, Inc. 14.7% 10/31/2012 44 Bilinguals, Inc. 9.3% 7/31/2012 46 Office Depot 18.2% 12/31/2010 47 Goody's Family Clothing 17.8% 3/31/2010 48 50 Blockbuster 6.2% 6/30/2009 51 53 Barbara Jean's 4.9% 5/31/2016 54 Hidrocj Realty Inc. 8.3% 6/30/2012 56 Big Lots, Inc. 16.0% 1/31/2009 57 Various Various Various 57.01 PMCC - Dermatology 7.3% 11/30/2013 57.02 PMCC - Dept of Medicine 22.1% 11/30/2012 58 58.01 58.02 58.03 58.04 58.05 60 Pier 1 Imports 12.7% 2/28/2015 63 Weichert Realtors 4.7% 12/31/2011 64 65 Petco 18.7% 2/28/2017 67 Hoffman, Steven (et al) 4.4% 9/30/2007 68 George's Cycles and Fitness 14.1% 4/30/2011 71 72 WAMU 7.2% 12/31/2015 73 Bay Area Pediatrics 7.0% 11/30/2012 74 Jocks & Jills 20.6% 12/31/2007 76 WFS Financial 9.9% 7/31/2011 78 Scott & Stringfellow, Inc. 8.4% 8/31/2024 79 Fox and Hound 15.6% 5/31/2020 81 Shoe Carnival, Inc. 9.7% 1/31/2011 82 82.01 82.02 84 Maya Tan 3.1% 11/30/2009 85 Dr. Perimutter 4.7% 9/30/2012 86 Fir Tree, LLC 20.2% 6/30/2012 87 Villagio Tile & Stone 17.3% 9/30/2009 88 Wings N Things 6.5% 2/28/2017 89 Fassberg Construction 13.4% 7/31/2007 90 Family Dollar 5.1% 12/31/2008 92 Aaron's Rental 6.5% 8/31/2012 93 Stroudwater Associates 15.2% 3/31/2017 94 Cross Insurance 13.7% 2/28/2009 98 IKP Family Medicine 15.7% 9/30/2013 100 101 Pool and Spa Store 7.8% 2/28/2017 102 Tuesday Morning 10.5% 7/15/2010 103 Lamberti of Manalapan, Inc. 8.6% 2/28/2011 104 Naomi, Inc. "Naomi Dance" 12.2% 4/30/2012 105 105.01 105.02 105.03 105.04 105.05 106 Cato 11.6% 1/31/2012 107 Booz Allen Hamilton 12.1% 4/30/2010 109 Physical Conditioning Centre 7.2% 4/30/2009 110 Alamo Title 9.9% 3/31/2009 111 Coldwell Banker 19.7% 1/31/2008 115 Beauty Town 3.4% 4/30/2015 116 Tri County Dentist 8.9% 3/31/2011 118 Village Health Georgia, PC 5.0% 12/6/2010 119 Wayne Wicks & Associates 9.1% 9/30/2008 121 123 124 125 Dollar General 11.1% 8/1/2007 126 128 129 130 131 132 133 134 135 136 Ameriprise 2.3% 7/31/2007 137 Lindsays Auto 20.5% 12/31/2008 139 140 141 142 143 (1) Loan number 29 was removed from Annex A-1 included in the Free Writing Prospectus dated June 10, 2007. (2) With respect to the Midtown Square Loan (loan number 74), representing 0.3% of the Cut-Off Date Pool Balance (0.3% of the Cut-Off Date Group 1 Balance), the second largest tenant was determined to be as such based on the annual base rent paid by the tenant. (3) With respect to the Barchester Pool Loan (loan number 105), representing 0.2% of the Cut-Off Date Pool Balance (0.2% of the Cut-Off Date Group 1 Balance), as of the origination of the related Mortgage Loan, one Mortgaged Property was improved with a mixed use office/retail building, one was improved with an apartment complex, one was improved with multifamily condominium complex, one was improved with a high rise office building and a seven-story parking garage and the other was improved with a mixed use project that includes an office tower, retail arcade, underground parking facilities, meeting space and a 395-room luxury hotel; however, in all cases, the improvements are not part of the collateral for the related Mortgaged Property.
WACHOVIA BANK COMMERCIAL MORTGAGE TRUST SERIES 2007-C32 ANNEX A-5 CERTAIN CHARACTERISTICS OF THE MORTGAGE LOANS AND MORTGAGED PROPERTIES (CROSSED & PORTFOLIOS) LOAN MORTGAGE LOAN GROUP NUMBER NUMBER PROPERTY NAME CITY STATE - --------------------------------------------------------------------------------------------------------------------- 1 1 Beacon D.C. & Seattle Pool Various Various - --------------------------------------------------------------------------------------------------------------------- 1.01 Market Square Washington DC 1.02 Polk & Taylor Buildings Arlington VA 1.03 Wells Fargo Center Seattle WA 1.04 One, Two & Three Lafayette Centre Washington DC 1.05 Booz Allen Complex Mc Lean VA 1.06 Key Center Bellevue WA 1.07 Sunset North Bellevue WA 1.08 City Center Bellevue Bellevue WA 1.09 Plaza Center and US Bank Tower Bellevue WA 1.10 1616 Fort Myer Drive Arlington VA 1.11 American Center Vienna VA 1.12 Eastgate Office Park Bellevue WA 1.13 Liberty Place Washington DC 1.14 Lincoln Executive Center Buildings I, II, III, A&B Bellevue WA 1.15 11111 Sunset Hills Road Reston VA 1.16 Army and Navy Club Building Washington DC 1.17 Plaza East Bellevue WA 1.18 Reston Town Center Reston VA 1.19 1300 North Seventeenth Street Arlington VA 1.20 Washington Mutual Tower Seattle WA 2 1 ING Hospitality Pool Various Various - --------------------------------------------------------------------------------------------------------------------- 2.01 Residence Inn - La Jolla, CA La Jolla CA 2.02 Residence Inn Seattle East - Redmond , WA Redmond WA 2.03 Residence Inn - Long Beach, CA Long Beach CA 2.04 Residence Inn - Costa Mesa, CA Costa Mesa CA 2.05 Residence Inn Pasadena - Arcadia, CA Arcadia CA 2.06 Residence Inn - Irvine, CA Irvine CA 2.07 Homewood Suites - Herndon, VA Herndon VA 2.08 Residence Inn Concord - Pleasant Hill, CA Pleasant Hill CA 2.09 Residence Inn - San Ramon, CA San Ramon CA 2.10 Homewood Suites - Linthicum, MD Linthicum MD 2.11 Residence Inn - Saint Louis, MO Saint Louis MO 2.12 Residence Inn - Bakersfield, CA Bakersfield CA 2.13 Residence Inn - Boulder, CO Boulder CO 2.14 Residence Inn - Hapeville, GA Hapeville GA 2.15 Residence Inn Chicago - Deerfield, IL Deerfield IL 2.16 Homewood Suites - Malvern, PA Malvern PA 2.17 Residence Inn - Houston, TX Houston TX 2.18 Residence Inn - Santa Fe, NM Santa Fe NM 2.19 Residence Inn - Placentia, CA Placentia CA 2.20 Homewood Suites - Glen Allen, VA Glen Allen VA 2.21 Residence Inn - Atlanta, GA (Buckhead) Atlanta GA 2.22 Homewood Suites - Beaverton, OR Beaverton OR 2.23 Residence Inn - Cincinnati, OH Cincinnati OH 2.24 Residence Inn - Lombard, IL Lombard IL 2.25 Residence Inn - Jacksonville, FL Jacksonville FL 2.26 Homewood Suites - Irving, TX Irving TX 2.27 Residence Inn Dallas - Irving, TX Irving TX 2.28 Homewood Suites - Clearwater, FL Clearwater FL 2.29 Residence Inn - Boca Raton, FL Boca Raton FL 2.30 Residence Inn - Clearwater, FL Clearwater FL 2.31 Residence Inn - Birmingham, AL Birmingham AL 2.32 Residence Inn - Smyrna, GA Smyrna GA 2.33 Homewood Suites - Addison, TX Addison TX 2.34 Homewood Suites - Chesterfield, MO Chesterfield MO 2.35 Residence Inn - Montgomery, AL Montgomery AL 2.36 Homewood Suites - Atlanta, GA (Buckhead) Atlanta GA 2.37 Residence Inn - Chesterfield, MO Chesterfield MO 2.38 Residence Inn - Blue Ash, OH Blue Ash OH 2.39 Residence Inn - Berwyn, PA Berwyn PA 2.40 Residence Inn - Danvers, MA Danvers MA 2.41 Homewood Suites - Midvale, UT Midvale UT 2.42 Homewood Suites - Plano, TX Plano TX 2.43 Homewood Suites - Atlanta, GA (Cumberland) Atlanta GA 2.44 Residence Inn - Memphis, TN Memphis TN 2.45 Residence Inn - Atlanta, GA (DeKalb) Atlanta GA 2.46 Homewood Suites - Norcross, GA Norcross GA 3 1 DDR Southeast Pool Various Various - --------------------------------------------------------------------------------------------------------------------- 3.01 Hilltop Plaza Richmond CA 3.02 Largo Town Center Largo MD 3.03 Midway Plaza Tamarac FL 3.04 Riverstone Plaza Canton GA 3.05 Highland Grove Highland IN 3.06 Riverdale Shops West Springfield MA 3.07 Skyview Plaza Orlando FL 3.08 Apple Blossom Corners Winchester VA 3.09 Fayetteville Pavilion Fayetteville NC 3.10 Creekwood Crossing Bradenton FL 3.11 Flamingo Falls Pembroke Pines FL 3.12 Harundale Plaza Glen Burnie MD 3.13 Meadowmont Village Center Chapel Hill NC 3.14 Springfield Commons Toledo OH 3.15 Northlake Commons Palm Beach Gardens FL 3.16 Village Square at Golf Boynton Beach FL 3.17 Oviedo Park Crossing Oviedo FL 3.18 Shoppes of Golden Acres New Port Richey FL 3.19 Bardmoor Shopping Center Largo FL 3.20 Rosedale Shopping Center Huntersville NC 3.21 Casselberry Commons Casselberry FL 3.22 Shoppes at New Tampa Wesley Chapel FL 3.23 Crossroads Plaza Lumberton NJ 3.24 Plaza Del Paraiso Miami FL 3.25 North Pointe Plaza Tampa FL 3.26 Melbourne Shopping Center Melbourne FL 3.27 Market Square (DDR) Douglasville GA 3.28 Shoppes of Lithia Valrico FL 3.29 West Oaks Towne Center Ocoee FL 3.30 Sharon Greens Cumming GA 3.31 Lakewood Ranch Bradenton FL 3.32 Cofer Crossing Tucker GA 3.33 Clayton Corners Clayton NC 3.34 Clearwater Crossing Flowery Branch GA 3.35 Shops at Paradise Pointe Fort Walton Beach FL 3.36 Killearn Center Tallahassee FL 3.37 Conway Plaza Orlando FL 3.38 River Run Shopping Center Miramar FL 3.39 Aberdeen Square Boynton Beach FL 3.40 Derby Square Grove City OH 3.41 Chickasaw Trails Shopping Center Orlando FL 3.42 Shoppes at Lake Dow McDonough GA 3.43 Shoppes of Ellenwood Ellenwood GA 3.44 Shops at Oliver's Crossing Winston Salem NC 3.45 Southwood Village Shopping Center Tallahassee FL 3.46 Paraiso Plaza Hialeah FL 3.47 Sheridan Sqaure Dania FL 3.48 Countryside Shopping Center Naples FL 3.49 Shoppes of Citrus Hills Hernando FL 3.50 Crystal Springs Shopping Center Crystal River FL 3.51 Sexton Commons Fuquay Varina NC 3.52 Hairston Crossing Decatur GA 6 1 DDR-TRT Pool Various Various - --------------------------------------------------------------------------------------------------------------------- 6.01 Centerton Square Mount Laurel NJ 6.02 Beaver Creek Commons Apex NC 6.03 Mount Nebo Pointe Ohio Township PA 7 1 Ashford Hospitality Pool 4 Various Various - --------------------------------------------------------------------------------------------------------------------- 7.01 Spring Hill Suites - Orlando, FL Orlando FL 7.02 Courtyard - Orlando, FL Orlando FL 7.03 Residence Inn - Atlanta, GA Atlanta GA 7.04 Fairfield Inn - Orlando, FL Orlando FL 7.05 Courtyard by Marriott - Edison, NJ Edison NJ 21 2 Little Rock Pool Little Rock AR - --------------------------------------------------------------------------------------------------------------------- 21.01 Chenal Lakes Apartments Little Rock AR 21.02 Brightwaters Apartments Little Rock AR 22 1 Jamison Valley Holdings Pool Various CA - --------------------------------------------------------------------------------------------------------------------- 22.01 Sherman Oaks Atrium Sherman Oaks CA 22.02 West Hills Plaza Woodland Hills CA Various 2 Albuquerque Multifamily Portfolio Albuquerque NM - --------------------------------------------------------------------------------------------------------------------- 52 2 Villa del Oso Albuquerque NM 75 2 Vista Montana Albuquerque NM 57 1 Peachtree Medical Office Pool Various GA - --------------------------------------------------------------------------------------------------------------------- 57.01 Yorktown Medical Center Fayetteville GA 57.02 Shakerag Medical Center Peachtree City GA 58 1 BPRE Pool Various Various - --------------------------------------------------------------------------------------------------------------------- 58.01 11820 Pierce Street Riverside CA 58.02 8131 East Indian Bend Road Scottsdale AZ 58.03 8111 East Indian Bend Road Scottsdale AZ 58.04 8115 East Indian Bend Road Scottsdale AZ 58.05 7328 East Stetson Drive Scottsdale AZ 82 1 The Village at Heather Ridge Pool Sioux Falls SD - --------------------------------------------------------------------------------------------------------------------- 82.01 Heather Ridge Bank Building Sioux Falls SD 82.02 Heather Ridge Office Building Sioux Falls SD 105 1 Barchester Pool Various Various - --------------------------------------------------------------------------------------------------------------------- 105.01 Mansion House Center Ground Lease Saint Louis MO 105.02 Pinewood Estates Apartments Ground Lease Albuquerque NM 105.03 Winrock Villas Condominiums Ground Lease Albuquerque NM 105.04 National City Bank Building Ground Lease Fort Wayne IN 105.05 Albuquerque Plaza Ground Lease Albuquerque NM Various 1 Warehouse Terminal Portfolio Various Various - --------------------------------------------------------------------------------------------------------------------- 123 1 Warehouse Terminal - Manitowac, WI Manitowoc WI 131 1 Warehouse Terminal - Menominee, MI Menominee MI Various 1 Archives One Portfolio Various Various - --------------------------------------------------------------------------------------------------------------------- 135 1 Archives One - Malvern, PA Malvern PA 139 1 Archives One - Greensboro, NC Greensboro NC 142 1 Archives One - Essex Junction, VT Essex Junction VT CROSS COLLATERALIZED AND CROSS CUT-OFF DATE % OF AGGREGATE MORTGAGE LOAN DEFAULTED LOAN BALANCE CUT-OFF DATE NUMBER LOAN FLAG ORIGINAL LOAN BALANCE ($) ($) BALANCE - ------------------------------------------------------------------------------------------------------------------------------- 1 414,000,000 414,000,000 10.8% - ------------------------------------------------------------------------------------------------------------------------------- 1.01 63,968,572 1.02 50,666,978 1.03 47,643,889 1.04 43,060,885 1.05 36,313,350 1.06 24,269,362 1.07 22,552,247 1.08 22,389,000 1.09 18,356,199 1.10 16,929,301 1.11 12,817,899 1.12 11,197,523 1.13 10,641,275 1.14 10,338,966 1.15 9,093,453 1.16 7,678,647 1.17 6,082,456 1.18 1.19 1.20 2 283,850,000 283,850,000 7.4% - ------------------------------------------------------------------------------------------------------------------------------- 2.01 28,759,000 2.02 17,819,000 2.03 15,324,000 2.04 13,578,000 2.05 11,760,500 2.06 10,620,000 2.07 10,156,500 2.08 9,337,000 2.09 7,982,500 2.10 7,662,000 2.11 6,842,500 2.12 6,272,000 2.13 6,022,500 2.14 5,951,500 2.15 5,951,500 2.16 5,916,000 2.17 5,630,500 2.18 5,559,500 2.19 5,452,500 2.20 5,132,000 2.21 5,096,000 2.22 4,918,000 2.23 4,739,500 2.24 4,561,500 2.25 4,526,000 2.26 4,419,000 2.27 4,383,500 2.28 4,383,500 2.29 4,027,000 2.30 3,920,000 2.31 3,813,000 2.32 3,670,500 2.33 3,528,000 2.34 3,385,500 2.35 3,350,000 2.36 3,314,500 2.37 3,029,000 2.38 3,029,000 2.39 2,993,500 2.40 2,922,000 2.41 2,886,500 2.42 2,744,000 2.43 2,530,000 2.44 2,245,000 2.45 2,067,000 2.46 1,639,500 3 221,250,000 221,250,000 5.8% - ------------------------------------------------------------------------------------------------------------------------------- 3.01 9,527,500 3.02 9,067,500 3.03 8,652,500 3.04 8,495,000 3.05 8,382,500 3.06 8,082,500 3.07 7,382,500 3.08 7,305,000 3.09 7,000,000 3.10 6,667,500 3.11 6,272,500 3.12 6,177,500 3.13 6,132,500 3.14 6,017,600 3.15 5,275,000 3.16 4,937,500 3.17 4,922,500 3.18 4,787,500 3.19 4,762,500 3.20 4,382,500 3.21 4,325,000 3.22 4,200,000 3.23 3,762,500 3.24 3,360,000 3.25 3,335,000 3.26 3,335,000 3.27 3,175,000 3.28 3,150,000 3.29 3,095,000 3.30 3,017,500 3.31 3,000,000 3.32 2,985,000 3.33 2,937,500 3.34 2,875,000 3.35 2,765,000 3.36 2,762,500 3.37 2,700,000 3.38 2,652,500 3.39 2,540,000 3.40 2,477,500 3.41 2,477,500 3.42 2,342,500 3.43 2,230,000 3.44 2,142,500 3.45 2,127,500 3.46 2,117,500 3.47 2,062,500 3.48 1,905,000 3.49 1,905,000 3.50 1,872,500 3.51 1,785,000 3.52 1,602,500 6 110,000,000 110,000,000 2.9% - ------------------------------------------------------------------------------------------------------------------------------- 6.01 67,800,000 6.02 26,200,000 6.03 16,000,000 7 103,906,000 103,906,000 2.7% - ------------------------------------------------------------------------------------------------------------------------------- 7.01 30,213,037 7.02 29,189,965 7.03 15,932,504 7.04 15,930,493 7.05 12,640,000 21 40,000,000 40,000,000 1.0% - ------------------------------------------------------------------------------------------------------------------------------- 21.01 21.02 22 38,000,000 38,000,000 1.0% - ------------------------------------------------------------------------------------------------------------------------------- 22.01 22.02 Various Albuquerque Multifamily Portfolio 27,000,000 27,000,000 0.7% - ------------------------------------------------------------------------------------------------------------------------------- 52 Albuquerque Multifamily Portfolio 16,180,000 16,180,000 0.4% 75 Albuquerque Multifamily Portfolio 10,820,000 10,820,000 0.3% 57 13,530,000 13,530,000 0.4% - ------------------------------------------------------------------------------------------------------------------------------- 57.01 57.02 58 13,200,000 13,200,000 0.3% - ------------------------------------------------------------------------------------------------------------------------------- 58.01 4,160,000 58.02 2,720,000 58.03 2,720,000 58.04 1,840,000 58.05 1,760,000 82 10,400,000 10,400,000 0.3% - ------------------------------------------------------------------------------------------------------------------------------- 82.01 82.02 105 5,900,000 5,900,000 0.2% - ------------------------------------------------------------------------------------------------------------------------------- 105.01 2,630,000 105.02 1,255,000 105.03 1,050,000 105.04 815,000 105.05 150,000 Various Warehouse Terminal Portfolio 5,900,000 5,863,424 0.2% - ------------------------------------------------------------------------------------------------------------------------------- 123 Warehouse Terminal Portfolio 3,500,000 3,478,302 0.1% 131 Warehouse Terminal Portfolio 2,400,000 2,385,121 0.1% Various Archives One Portfolio 4,080,000 4,072,326 0.1% - ------------------------------------------------------------------------------------------------------------------------------- 135 Archives One Portfolio 1,860,000 1,856,544 0.0% 139 Archives One Portfolio 1,120,000 1,117,872 0.0% 142 Archives One Portfolio 1,100,000 1,097,910 0.0% ORIGINAL REMAINING ORIGINAL REMAINING MATURITY DATE TERM TO TERM TO AMORT AMORT OR ARD MORTGAGE LOAN MATURITY OR MATURITY OR REMAINING IO TERM TERM MONTHLY P&I BALLOON NUMBER ARD (MOS.) ARD (MOS.) PERIOD (MOS.) (MOS.) (MOS.) PAYMENTS ($) BALANCE ($) - -------------------------------------------------------------------------------------------------------------------------- 1 60 59 59 IO IO IO 414,000,000 - -------------------------------------------------------------------------------------------------------------------------- 1.01 1.02 1.03 1.04 1.05 1.06 1.07 1.08 1.09 1.10 1.11 1.12 1.13 1.14 1.15 1.16 1.17 1.18 1.19 1.20 2 60 60 60 IO IO IO 283,850,000 - -------------------------------------------------------------------------------------------------------------------------- 2.01 2.02 2.03 2.04 2.05 2.06 2.07 2.08 2.09 2.10 2.11 2.12 2.13 2.14 2.15 2.16 2.17 2.18 2.19 2.20 2.21 2.22 2.23 2.24 2.25 2.26 2.27 2.28 2.29 2.30 2.31 2.32 2.33 2.34 2.35 2.36 2.37 2.38 2.39 2.40 2.41 2.42 2.43 2.44 2.45 2.46 3 120 120 120 IO IO IO 221,250,000 - -------------------------------------------------------------------------------------------------------------------------- 3.01 3.02 3.03 3.04 3.05 3.06 3.07 3.08 3.09 3.10 3.11 3.12 3.13 3.14 3.15 3.16 3.17 3.18 3.19 3.20 3.21 3.22 3.23 3.24 3.25 3.26 3.27 3.28 3.29 3.30 3.31 3.32 3.33 3.34 3.35 3.36 3.37 3.38 3.39 3.40 3.41 3.42 3.43 3.44 3.45 3.46 3.47 3.48 3.49 3.50 3.51 3.52 6 120 120 120 IO IO IO 110,000,000 - -------------------------------------------------------------------------------------------------------------------------- 6.01 6.02 6.03 7 120 118 58 360 360 619,788 97,136,972 - -------------------------------------------------------------------------------------------------------------------------- 7.01 7.02 7.03 7.04 7.05 21 120 119 119 IO IO IO 40,000,000 - -------------------------------------------------------------------------------------------------------------------------- 21.01 21.02 22 120 119 119 IO IO IO 38,000,000 - -------------------------------------------------------------------------------------------------------------------------- 22.01 22.02 Various 60 59 59 IO IO IO 27,000,000 - -------------------------------------------------------------------------------------------------------------------------- 52 60 59 59 IO IO IO 16,180,000 75 60 59 59 IO IO IO 10,820,000 57 120 119 35 360 360 76,992 12,111,542 - -------------------------------------------------------------------------------------------------------------------------- 57.01 57.02 58 120 119 119 IO IO IO 13,200,000 - -------------------------------------------------------------------------------------------------------------------------- 58.01 58.02 58.03 58.04 58.05 82 120 120 360 360 62,889 8,842,652 - -------------------------------------------------------------------------------------------------------------------------- 82.01 82.02 105 120 119 23 360 360 35,298 5,227,023 - -------------------------------------------------------------------------------------------------------------------------- 105.01 105.02 105.03 105.04 105.05 Various 120 117 240 237 42,235 3,868,540 - -------------------------------------------------------------------------------------------------------------------------- 123 120 117 240 237 25,055 2,294,897 131 120 117 240 237 17,181 1,573,643 Various 120 118 360 358 24,136 3,448,194 - -------------------------------------------------------------------------------------------------------------------------- 135 120 118 360 358 11,068 1,574,527 139 120 118 360 358 6,593 945,274 142 120 118 360 358 6,475 928,394 APPRAISED CUT-OFF LTV RATIO MORTGAGE LOAN VALUE DATE LTV AT MATURITY NUMBER OF NUMBER ($) DSCR (X) RATIO OR ARD UNITS (UNITS) - ------------------------------------------------------------------------------------------------------ 1 3,432,650,000 1.27 78.7% 78.7% 9,848,341 - ------------------------------------------------------------------------------------------------------ 1.01 529,000,000 678,348 1.02 419,000,000 904,226 1.03 394,000,000 944,141 1.04 356,100,000 711,495 1.05 300,300,000 731,234 1.06 200,700,000 473,988 1.07 186,500,000 463,182 1.08 182,150,000 465,765 1.09 151,800,000 466,948 1.10 144,000,000 294,521 1.11 106,000,000 329,695 1.12 92,600,000 251,088 1.13 96,000,000 163,936 1.14 85,500,000 277,672 1.15 75,200,000 216,469 1.16 63,500,000 102,822 1.17 50,300,000 148,952 1.18 440,000,000 764,103 1.19 200,000,000 380,743 1.20 378,684,000 1,079,013 2 890,300,000 2.14 63.8% 63.8% 5,796 - ------------------------------------------------------------------------------------------------------ 2.01 86,700,000 288 2.02 52,600,000 180 2.03 45,400,000 216 2.04 39,600,000 144 2.05 35,800,000 120 2.06 32,700,000 112 2.07 29,900,000 109 2.08 30,700,000 126 2.09 26,300,000 106 2.10 23,000,000 147 2.11 20,300,000 152 2.12 18,800,000 114 2.13 19,400,000 128 2.14 20,800,000 126 2.15 18,300,000 128 2.16 19,700,000 123 2.17 20,200,000 110 2.18 16,500,000 120 2.19 17,600,000 112 2.20 15,400,000 123 2.21 16,700,000 136 2.22 15,100,000 123 2.23 14,800,000 144 2.24 14,300,000 144 2.25 15,400,000 112 2.26 13,500,000 136 2.27 14,600,000 120 2.28 13,100,000 112 2.29 13,100,000 120 2.30 12,300,000 88 2.31 12,500,000 128 2.32 11,800,000 130 2.33 10,900,000 120 2.34 10,500,000 145 2.35 10,500,000 94 2.36 9,900,000 92 2.37 9,500,000 104 2.38 9,700,000 118 2.39 11,000,000 88 2.40 10,900,000 96 2.41 8,800,000 98 2.42 9,400,000 99 2.43 7,900,000 124 2.44 7,200,000 105 2.45 12,000,000 144 2.46 5,200,000 92 3 1,393,500,000 1.51 63.5% 63.5% 7,297,943 - ------------------------------------------------------------------------------------------------------ 3.01 60,000,000 245,774 3.02 57,100,000 260,797 3.03 54,500,000 227,209 3.04 53,500,000 307,716 3.05 52,800,000 312,546 3.06 50,900,000 273,307 3.07 46,500,000 281,244 3.08 46,000,000 240,560 3.09 40,000,000 272,385 3.10 42,000,000 227,085 3.11 39,500,000 108,565 3.12 38,900,000 217,619 3.13 35,000,000 132,745 3.14 37,900,000 271,729 3.15 40,500,000 149,658 3.16 31,100,000 126,486 3.17 31,000,000 186,212 3.18 31,800,000 130,609 3.19 30,000,000 152,667 3.20 27,600,000 119,197 3.21 37,700,000 243,176 3.22 24,000,000 158,222 3.23 21,500,000 89,627 3.24 19,200,000 82,441 3.25 21,000,000 104,460 3.26 21,000,000 204,216 3.27 20,000,000 121,766 3.28 18,000,000 71,430 3.29 19,500,000 66,539 3.30 19,000,000 98,317 3.31 18,900,000 69,471 3.32 18,800,000 137,757 3.33 18,500,000 125,653 3.34 18,100,000 90,566 3.35 15,800,000 83,929 3.36 17,400,000 95,229 3.37 17,000,000 117,723 3.38 16,700,000 93,643 3.39 16,000,000 70,555 3.40 15,600,000 128,210 3.41 15,600,000 75,492 3.42 14,750,000 73,271 3.43 14,050,000 67,721 3.44 13,500,000 76,512 3.45 13,400,000 62,840 3.46 12,100,000 60,712 3.47 13,700,000 67,475 3.48 12,000,000 73,986 3.49 12,000,000 68,927 3.50 11,800,000 66,986 3.51 10,200,000 49,097 3.52 10,100,000 57,884 6 164,100,000 1.50 67.0% 67.0% 678,553 - ------------------------------------------------------------------------------------------------------ 6.01 106,500,000 432,327 6.02 35,000,000 143,129 6.03 22,600,000 103,097 7 139,900,000 1.36 74.3% 69.4% 1,396 - ------------------------------------------------------------------------------------------------------ 7.01 40,300,000 400 7.02 39,800,000 312 7.03 21,000,000 150 7.04 23,000,000 388 7.05 15,800,000 146 21 50,000,000 1.42 80.0% 80.0% 712 - ------------------------------------------------------------------------------------------------------ 21.01 34,000,000 456 21.02 16,000,000 256 22 45,900,000 1.22 82.8% 82.8% 176,977 - ------------------------------------------------------------------------------------------------------ 22.01 25,000,000 92,996 22.02 20,900,000 83,981 Various 33,900,000 1.37 79.6% 79.6% 528 - ------------------------------------------------------------------------------------------------------ 52 20,400,000 1.35 79.3% 79.3% 312 75 13,500,000 1.40 80.2% 80.2% 216 57 23,500,000 1.72 57.6% 51.5% 114,971 - ------------------------------------------------------------------------------------------------------ 57.01 18,734,020 91,654 57.02 4,765,980 23,317 58 16,500,000 1.46 80.0% 80.0% 43,028 - ------------------------------------------------------------------------------------------------------ 58.01 5,200,000 13,356 58.02 3,400,000 8,902 58.03 3,400,000 9,010 58.04 2,300,000 6,000 58.05 2,200,000 5,760 82 13,770,000 1.16 75.5% 64.2% 57,753 - ------------------------------------------------------------------------------------------------------ 82.01 8,860,000 35,404 82.02 4,910,000 22,349 105 13,380,000 1.20 44.1% 39.1% 621,847 - ------------------------------------------------------------------------------------------------------ 105.01 5,450,000 104,315 105.02 3,500,000 254,850 105.03 2,500,000 218,100 105.04 1,630,000 35,870 105.05 300,000 8,712 Various 8,800,000 1.34 66.6% 44.0% 371,416 - ------------------------------------------------------------------------------------------------------ 123 5,300,000 1.35 65.6% 43.3% 229,500 131 3,500,000 1.33 68.2% 45.0% 141,916 Various 5,100,000 1.29 79.9% 67.6% 92,441 - ------------------------------------------------------------------------------------------------------ 135 2,325,000 1.25 79.9% 67.7% 32,416 139 1,400,000 1.28 79.9% 67.5% 40,025 142 1,375,000 1.35 79.9% 67.5% 20,000 CUT-OFF DATE LOAN MORTGAGE LOAN UNIT OF AMOUNT UW NET CASH NUMBER MEASURE PER (UNIT) ($) FLOW ($) - ---------------------------------------------------------------------------- 1 Sq. Ft. 274 198,385,886 - ---------------------------------------------------------------------------- 1.01 Sq. Ft. 25,307,068 1.02 Sq. Ft. 22,263,095 1.03 Sq. Ft. 18,616,234 1.04 Sq. Ft. 17,388,129 1.05 Sq. Ft. 15,469,519 1.06 Sq. Ft. 11,014,878 1.07 Sq. Ft. 8,370,682 1.08 Sq. Ft. 9,183,434 1.09 Sq. Ft. 8,466,919 1.10 Sq. Ft. 7,127,979 1.11 Sq. Ft. 6,801,602 1.12 Sq. Ft. 3,555,517 1.13 Sq. Ft. 5,225,760 1.14 Sq. Ft. 3,898,128 1.15 Sq. Ft. 4,199,874 1.16 Sq. Ft. 2,376,221 1.17 Sq. Ft. 2,352,485 1.18 Sq. Ft. 8,066,030 1.19 Sq. Ft. 5,900,879 1.20 Sq. Ft. 12,801,453 2 Rooms 97,947 68,787,909 - ---------------------------------------------------------------------------- 2.01 Rooms 5,980,402 2.02 Rooms 4,057,691 2.03 Rooms 3,578,379 2.04 Rooms 3,221,289 2.05 Rooms 2,617,560 2.06 Rooms 2,281,782 2.07 Rooms 2,470,571 2.08 Rooms 2,121,871 2.09 Rooms 1,794,657 2.10 Rooms 1,810,691 2.11 Rooms 1,896,994 2.12 Rooms 1,587,655 2.13 Rooms 1,629,473 2.14 Rooms 1,609,325 2.15 Rooms 1,553,498 2.16 Rooms 1,500,069 2.17 Rooms 1,474,297 2.18 Rooms 1,481,604 2.19 Rooms 1,249,069 2.20 Rooms 1,095,751 2.21 Rooms 1,384,423 2.22 Rooms 1,166,625 2.23 Rooms 1,213,431 2.24 Rooms 1,211,946 2.25 Rooms 1,129,314 2.26 Rooms 929,633 2.27 Rooms 1,182,102 2.28 Rooms 922,982 2.29 Rooms 995,824 2.30 Rooms 1,017,847 2.31 Rooms 1,020,831 2.32 Rooms 1,030,549 2.33 Rooms 806,803 2.34 Rooms 733,624 2.35 Rooms 998,027 2.36 Rooms 842,014 2.37 Rooms 823,765 2.38 Rooms 867,956 2.39 Rooms 770,202 2.40 Rooms 854,993 2.41 Rooms 754,796 2.42 Rooms 670,588 2.43 Rooms 736,401 2.44 Rooms 439,476 2.45 Rooms 837,583 2.46 Rooms 433,548 3 Sq. Ft. 121 74,964,784 - ---------------------------------------------------------------------------- 3.01 Sq. Ft. 3,254,062 3.02 Sq. Ft. 2,983,928 3.03 Sq. Ft. 2,605,612 3.04 Sq. Ft. 2,849,278 3.05 Sq. Ft. 3,080,036 3.06 Sq. Ft. 2,603,536 3.07 Sq. Ft. 2,360,522 3.08 Sq. Ft. 2,241,995 3.09 Sq. Ft. 2,745,418 3.10 Sq. Ft. 2,046,231 3.11 Sq. Ft. 2,162,758 3.12 Sq. Ft. 2,284,906 3.13 Sq. Ft. 2,388,833 3.14 Sq. Ft. 2,410,318 3.15 Sq. Ft. 1,663,965 3.16 Sq. Ft. 1,486,528 3.17 Sq. Ft. 1,647,125 3.18 Sq. Ft. 1,503,785 3.19 Sq. Ft. 1,597,905 3.20 Sq. Ft. 1,720,380 3.21 Sq. Ft. 1,144,651 3.22 Sq. Ft. 1,433,139 3.23 Sq. Ft. 1,467,579 3.24 Sq. Ft. 1,023,505 3.25 Sq. Ft. 1,005,755 3.26 Sq. Ft. 965,314 3.27 Sq. Ft. 1,265,311 3.28 Sq. Ft. 1,100,600 3.29 Sq. Ft. 1,024,459 3.30 Sq. Ft. 1,097,205 3.31 Sq. Ft. 922,830 3.32 Sq. Ft. 1,050,441 3.33 Sq. Ft. 1,147,357 3.34 Sq. Ft. 1,019,035 3.35 Sq. Ft. 954,995 3.36 Sq. Ft. 819,071 3.37 Sq. Ft. 915,615 3.38 Sq. Ft. 954,616 3.39 Sq. Ft. 739,001 3.40 Sq. Ft. 895,014 3.41 Sq. Ft. 736,595 3.42 Sq. Ft. 742,227 3.43 Sq. Ft. 812,970 3.44 Sq. Ft. 842,680 3.45 Sq. Ft. 766,910 3.46 Sq. Ft. 741,633 3.47 Sq. Ft. 497,588 3.48 Sq. Ft. 721,809 3.49 Sq. Ft. 603,747 3.50 Sq. Ft. 651,099 3.51 Sq. Ft. 715,655 3.52 Sq. Ft. 549,260 6 Sq. Ft. 162 9,091,455 - ---------------------------------------------------------------------------- 6.01 Sq. Ft. 5,740,205 6.02 Sq. Ft. 2,018,925 6.03 Sq. Ft. 1,332,324 7 Rooms 74,431 10,136,737 - ---------------------------------------------------------------------------- 7.01 Rooms 2,773,951 7.02 Rooms 3,102,134 7.03 Rooms 1,551,833 7.04 Rooms 1,577,577 7.05 Rooms 1,131,242 21 Units 56,180 3,106,208 - ---------------------------------------------------------------------------- 21.01 Units 2,058,969 21.02 Units 1,047,239 22 Sq. Ft. 215 2,773,048 - ---------------------------------------------------------------------------- 22.01 Sq. Ft. 1,441,076 22.02 Sq. Ft. 1,331,972 Various Units 51,136 2,138,102 - ---------------------------------------------------------------------------- 52 Units 51,859 1,263,238 75 Units 50,093 874,864 57 Sq. Ft. 118 1,593,604 - ---------------------------------------------------------------------------- 57.01 Sq. Ft. 57.02 Sq. Ft. 58 Sq. Ft. 307 1,115,240 - ---------------------------------------------------------------------------- 58.01 Sq. Ft. 342,724 58.02 Sq. Ft. 230,444 58.03 Sq. Ft. 234,353 58.04 Sq. Ft. 157,121 58.05 Sq. Ft. 150,599 82 Sq. Ft. 180 877,632 - ---------------------------------------------------------------------------- 82.01 Sq. Ft. 581,280 82.02 Sq. Ft. 296,352 105 Sq. Ft. 9 507,708 - ---------------------------------------------------------------------------- 105.01 Sq. Ft. 206,599 105.02 Sq. Ft. 100,867 105.03 Sq. Ft. 85,593 105.04 Sq. Ft. 96,859 105.05 Sq. Ft. 17,790 Various Sq. Ft. 16 679,360 - ---------------------------------------------------------------------------- 123 Sq. Ft. 15 404,838 131 Sq. Ft. 17 274,522 Various Sq. Ft. 44 372,836 - ---------------------------------------------------------------------------- 135 Sq. Ft. 57 166,310 139 Sq. Ft. 28 101,254 142 Sq. Ft. 55 105,272
WACHOVIA BANK COMMERCIAL MORTGAGE TRUST SERIES 2007-C32 ANNEX A-6 DEBT SERVICE PAYMENT SCHEDULE FOR THE SIENA OFFICE PARK MORTGAGE LOAN LOAN PAY PRINCIPAL MONTHLY DEBT MORTGAGE LOAN PAY MONTHLY DEBT MORTGAGE PERIOD ($) INTEREST ($) SERVICE ($) RATE (%) PERIOD PRINCIPAL ($) INTEREST ($) SERVICE ($) RATE (%) 1 -- 124,020.00 124,020.00 5.2000% 61 -- 136,779.75 136,779.75 5.7350% 2 -- 128,154.00 128,154.00 5.2000% 62 -- 141,339.08 141,339.08 5.7350% 3 -- 128,154.00 128,154.00 5.2000% 63 -- 141,339.08 141,339.08 5.7350% 4 -- 124,020.00 124,020.00 5.2000% 64 -- 136,779.75 136,779.75 5.7350% 5 -- 128,154.00 128,154.00 5.2000% 65 -- 141,339.08 141,339.08 5.7350% 6 -- 124,020.00 124,020.00 5.2000% 66 -- 136,779.75 136,779.75 5.7350% 7 -- 128,154.00 128,154.00 5.2000% 67 -- 141,339.08 141,339.08 5.7350% 8 -- 128,154.00 128,154.00 5.2000% 68 -- 141,339.08 141,339.08 5.7350% 9 -- 119,886.00 119,886.00 5.2000% 69 -- 127,661.10 127,661.10 5.7350% 10 -- 128,154.00 128,154.00 5.2000% 70 -- 141,339.08 141,339.08 5.7350% 11 -- 124,020.00 124,020.00 5.2000% 71 -- 136,779.75 136,779.75 5.7350% 12 -- 128,154.00 128,154.00 5.2000% 72 -- 141,339.08 141,339.08 5.7350% 13 -- 124,020.00 124,020.00 5.2000% 73 -- 136,779.75 136,779.75 5.7350% 14 -- 128,154.00 128,154.00 5.2000% 74 -- 141,339.08 141,339.08 5.7350% 15 -- 128,154.00 128,154.00 5.2000% 75 -- 141,339.08 141,339.08 5.7350% 16 -- 124,020.00 124,020.00 5.2000% 76 -- 136,779.75 136,779.75 5.7350% 17 -- 128,154.00 128,154.00 5.2000% 77 -- 141,339.08 141,339.08 5.7350% 18 -- 124,020.00 124,020.00 5.2000% 78 -- 136,779.75 136,779.75 5.7350% 19 -- 128,154.00 128,154.00 5.2000% 79 -- 141,339.08 141,339.08 5.7350% 20 -- 128,154.00 128,154.00 5.2000% 80 -- 141,339.08 141,339.08 5.7350% 21 -- 115,752.00 115,752.00 5.2000% 81 -- 127,661.10 127,661.10 5.7350% 22 -- 128,154.00 128,154.00 5.2000% 82 -- 141,339.08 141,339.08 5.7350% 23 -- 124,020.00 124,020.00 5.2000% 83 -- 136,779.75 136,779.75 5.7350% 24 -- 128,154.00 128,154.00 5.2000% 84 -- 141,339.08 141,339.08 5.7350% 25 -- 124,020.00 124,020.00 5.2000% 85 -- 136,779.75 136,779.75 5.7350% 26 -- 128,154.00 128,154.00 5.2000% 86 -- 141,339.08 141,339.08 5.7350% 27 -- 128,154.00 128,154.00 5.2000% 87 -- 141,339.08 141,339.08 5.7350% 28 -- 124,020.00 124,020.00 5.2000% 88 -- 136,779.75 136,779.75 5.7350% 29 -- 128,154.00 128,154.00 5.2000% 89 -- 141,339.08 141,339.08 5.7350% 30 -- 124,020.00 124,020.00 5.2000% 90 -- 136,779.75 136,779.75 5.7350% 31 -- 128,154.00 128,154.00 5.2000% 91 -- 141,339.08 141,339.08 5.7350% 32 -- 128,154.00 128,154.00 5.2000% 92 -- 141,339.08 141,339.08 5.7350% 33 -- 115,752.00 115,752.00 5.2000% 93 -- 127,661.10 127,661.10 5.7350% 34 -- 128,154.00 128,154.00 5.2000% 94 -- 141,339.08 141,339.08 5.7350% 35 -- 124,020.00 124,020.00 5.2000% 95 -- 136,779.75 136,779.75 5.7350% 36 -- 128,154.00 128,154.00 5.2000% 96 -- 141,339.08 141,339.08 5.7350% 37 -- 136,779.75 136,779.75 5.7350% 97 -- 136,779.75 136,779.75 5.7350% 38 -- 141,339.08 141,339.08 5.7350% 98 -- 141,339.08 141,339.08 5.7350% 39 -- 141,339.08 141,339.08 5.7350% 99 -- 141,339.08 141,339.08 5.7350% 40 -- 136,779.75 136,779.75 5.7350% 100 -- 136,779.75 136,779.75 5.7350% 41 -- 141,339.08 141,339.08 5.7350% 101 -- 141,339.08 141,339.08 5.7350% 42 -- 136,779.75 136,779.75 5.7350% 102 -- 136,779.75 136,779.75 5.7350% 43 -- 141,339.08 141,339.08 5.7350% 103 -- 141,339.08 141,339.08 5.7350% 44 -- 141,339.08 141,339.08 5.7350% 104 -- 141,339.08 141,339.08 5.7350% 45 -- 127,661.10 127,661.10 5.7350% 105 -- 132,220.43 132,220.43 5.7350% 46 -- 141,339.08 141,339.08 5.7350% 106 -- 141,339.08 141,339.08 5.7350% 47 -- 136,779.75 136,779.75 5.7350% 107 -- 136,779.75 136,779.75 5.7350% 48 -- 141,339.08 141,339.08 5.7350% 108 -- 141,339.08 141,339.08 5.7350% 49 -- 136,779.75 136,779.75 5.7350% 109 -- 136,779.75 136,779.75 5.7350% 50 -- 141,339.08 141,339.08 5.7350% 110 -- 141,339.08 141,339.08 5.7350% 51 -- 141,339.08 141,339.08 5.7350% 111 -- 141,339.08 141,339.08 5.7350% 52 -- 136,779.75 136,779.75 5.7350% 112 -- 136,779.75 136,779.75 5.7350% 53 -- 141,339.08 141,339.08 5.7350% 113 -- 141,339.08 141,339.08 5.7350% 54 -- 136,779.75 136,779.75 5.7350% 114 -- 136,779.75 136,779.75 5.7350% 55 -- 141,339.08 141,339.08 5.7350% 115 -- 141,339.08 141,339.08 5.7350% 56 -- 141,339.08 141,339.08 5.7350% 116 -- 141,339.08 141,339.08 5.7350% 57 -- 132,220.43 132,220.43 5.7350% 117 -- 127,661.10 127,661.10 5.7350% 58 -- 141,339.08 141,339.08 5.7350% 118 -- 141,339.08 141,339.08 5.7350% 59 -- 136,779.75 136,779.75 5.7350% 119 -- 136,779.75 136,779.75 5.7350% 60 -- 141,339.08 141,339.08 5.7350% 120 28,620,000.00 141,339.08 28,761,339.08 5.7350%
WACHOVIA BANK COMMERCIAL MORTGAGE TRUST SERIES 2007-C32 ANNEX B ---------- CERTAIN MORTGAGE POOL INFORMATION This electronic annex ("Electronic Annex B") and the related materials on the CD-ROM to which Electronic Annex B accompanies are a part of the prospectus supplement, dated June 22, 2007 (the "Prospectus Supplement"), relating to the Wachovia Bank Commercial Mortgage Trust, Commercial Mortgage Pass-Through Certificates, Series 2007-C32 Class A-1, Class A-2, Class A-PB, Class A-3, Class A-1A, Class IO, Class A-J, Class B, Class C, Class D, Class E and Class F Certificates (collectively, the "Certificates"). The information set forth in Electronic Annex B is an electronic copy of certain information set forth on Annex B to the Prospectus Supplement. The Electronic Annex B and the CD-ROM should be reviewed only in conjunction with the entire Prospectus Supplement. The CD-ROM does not contain all relevant information relating to the Certificates, particularly with respect to the structure of the underlying Trust Fund and the risks and special considerations associated with an investment in the Certificates. Such information is described elsewhere in the Prospectus Supplement. Any information contained in Electronic Annex B and on the CD-ROM to which Electronic Annex B accompanies will be more fully described elsewhere in the Prospectus Supplement. The information contained on the CD-ROM should not be viewed as projections, forecasts, predictions or opinions with respect to value. Prior to making any investment decision, a prospective investor should receive, and should carefully review, the prospectus, dated October 19, 2006 (the "Prospectus") and the Prospectus Supplement. ---------------- B-1 WACHOVIA BANK COMMERCIAL MORTGAGE TRUST SERIES 2007-C32 ANNEX B MORTGAGED PROPERTIES BY PROPERTY TYPE FOR ALL MORTGAGE LOANS (1) % OF WTD. AVG. WTD. AVG. CUT-OFF AVERAGE MAXIMUM CUT-OFF LTV NUMBER OF AGGREGATE DATE CUT-OFF CUT-OFF DATE RATIO AT MORTGAGED CUT-OFF POOL DATE DATE LTV MATURITY PROPERTY TYPE PROPERTIES DATE BALANCE BALANCE BALANCE BALANCE RATIO (2) (2) - ----------------------------------------------------------------------------------------------------------------------------- Office 56 $ 1,169,790,500 30.6% $ 20,889,116 $ 95,000,000 72.0% 71.5% Retail 99 1,026,196,690 26.8 $ 10,365,623 $ 92,400,000 71.2% 69.3% Retail - Anchored 76 801,889,645 21.0 $ 10,551,180 $ 75,040,500 70.4% 68.5% Retail - Outlet 1 92,400,000 2.4 $ 92,400,000 $ 92,400,000 80.0% 80.0% Retail - Single Tenant 11 56,317,045 1.5 $ 5,119,731 $ 25,000,000 73.3% 68.0% Retail - Unanchored 7 49,190,000 1.3 $ 7,027,143 $ 11,050,000 64.9% 63.3% Retail - Shadow Anchored(4) 4 26,400,000 0.7 $ 6,600,000 $ 13,100,000 71.0% 67.4% Hospitality 61 715,271,335 18.7 $ 11,725,760 $ 140,000,000 68.0% 64.5% Multifamily 30 443,196,794 11.6 $ 14,773,226 $ 35,572,500 77.3% 76.3% Mixed Use 11 365,700,000 9.6 $ 33,245,455 $ 200,000,000 69.6% 69.1% Industrial 10 67,297,750 1.8 $ 6,729,775 $ 36,100,000 78.7% 74.6% Special Purpose 2 17,500,000 0.5 $ 8,750,000 $ 14,000,000 63.5% 60.9% Healthcare 1 13,000,000 0.3 $ 13,000,000 $ 13,000,000 69.1% 65.7% Land(5) 5 5,900,000 0.2 $ 1,180,000 $ 2,630,000 44.1% 39.1% - ----------------------------- ---------- --------------- ------- 275 $ 3,823,853,069 100.0% $ 13,904,920 $ 200,000,000 71.4% 69.9% ========== =============== ======= WTD. AVG. STATED WTD. AVG. MINIMUM MAXIMUM REMAINING CUT-OFF CUT-OFF CUT-OFF TERM TO DATE DATE DATE WTD. AVG. WTD. AVG. MATURITY DSC DSC DSC OCCUPANCY MORTGAGE PROPERTY TYPE (MOS.) RATIO (2) RATIO (2) RATIO (2) RATE (3) RATE - ----------------------------------------------------------------------------------------------------- Office 88 1.40x 1.16x 2.11x 94.6% 5.763% Retail 119 1.45x 1.08x 2.55x 94.6% 5.656% Retail - Anchored 119 1.48x 1.16x 2.46x 95.3% 5.602% Retail - Outlet 119 1.38x 1.38x 1.38x 88.5% 5.755% Retail - Single Tenant 118 1.32x 1.08x 2.55x 100.0% 6.051% Retail - Unanchored 119 1.37x 1.25x 1.58x 88.7% 5.863% Retail - Shadow Anchored(4) 112 1.44x 1.16x 1.97x 93.7% 5.714% Hospitality 93 1.71x 1.20x 2.60x NA 5.906% Multifamily 104 1.32x 1.15x 1.73x 92.9% 5.710% Mixed Use 118 1.27x 1.12x 1.58x 98.6% 5.806% Industrial 118 1.40x 1.19x 1.88x 96.8% 5.881% Special Purpose 70 1.59x 1.18x 1.69x 78.3% 6.422% Healthcare 57 1.37x 1.37x 1.37x 89.7% 6.030% Land(5) 119 1.20x 1.20x 1.20x 100.0% 5.980% - ----------------------------- 103 1.45x 1.08x 2.60x 94.7% 5.765% _____________________________ (1) Because this table presents information relating to the Mortgaged Properties and not the Mortgage Loans, the information for Mortgage Loans secured by more than one Mortgaged Property is based on allocated amounts (allocating the Mortgage Loan principal balance to each of those properties by the appraised values of the Mortgaged Properties or the allocated loan amount (or specific release prices) as detailed in the related Mortgage Loan documents). (2) Certain of the Mortgage Loans reflect LTV Ratios that have been calculated on an "as-stabilized" basis, or that have DSC Ratios that have been adjusted to take into account certain cash reserves or letters of credit. See "Additional Mortgage Loan Information" herein. Also see "DESCRIPTION OF THE MORTGAGE POOL--Additional Mortgage Loan Information" and "RISK FACTORS--Risks Relating to Net Cash Flow" and "-- Inspections and Appraisals May Not Accurately Reflect Value or Condition of Mortgaged Property" in the Prospectus Supplement. (3) Occupancy Rates exclude 61 hospitality properties, representing 18.7% of the Cut-Off Date Pool Balance. In certain cases, occupancy includes space for which leases have been executed, but the tenant has not taken occupancy. (4) A Mortgaged Property is classified as "shadow anchored" if it is located in close proximity to an anchored retail property. (5) As of the origination of the related Mortgage Loan, one Mortgaged Property was improved with a mixed use office/retail building, one was improved with an apartment complex, one was improved with a multifamily condominium complex, one was improved with a high rise office building and a seven-story parking garage and the other was improved with a mixed use project that includes an office tower, retail arcade, underground parking facilities, meeting space and a 395-room luxury hotel; however, in all cases, the improvements are not part of the collateral for the related Mortgaged Property. B-2 WACHOVIA BANK COMMERCIAL MORTGAGE TRUST SERIES 2007-C32 ANNEX B MORTGAGED PROPERTIES BY PROPERTY TYPE FOR LOAN GROUP 1 MORTGAGE LOANS (1) % OF WTD. AVG. WTD. AVG. CUT-OFF AVERAGE MAXIMUM CUT-OFF LTV NUMBER OF AGGREGATE DATE CUT-OFF CUT-OFF DATE RATIO AT MORTGAGED CUT-OFF GROUP 1 DATE DATE LTV MATURITY PROPERTY TYPE PROPERTIES DATE BALANCE BALANCE BALANCE BALANCE RATIO (2) (2) - ----------------------------------------------------------------------------------------------------------------------------- Office 56 $ 1,169,790,500 34.6% $ 20,889,116 $ 95,000,000 72.0% 71.5% Retail 99 1,026,196,690 30.4 $ 10,365,623 $ 92,400,000 71.2% 69.3% Retail - Anchored 76 801,889,645 23.7 $ 10,551,180 $ 75,040,500 70.4% 68.5% Retail - Outlet 1 92,400,000 2.7 $ 92,400,000 $ 92,400,000 80.0% 80.0% Retail - Single Tenant 11 56,317,045 1.7 $ 5,119,731 $ 25,000,000 73.3% 68.0% Retail - Unanchored 7 49,190,000 1.5 $ 7,027,143 $ 11,050,000 64.9% 63.3% Retail - Shadow Anchored(4) 4 26,400,000 0.8 $ 6,600,000 $ 13,100,000 71.0% 67.4% Hospitality 61 715,271,335 21.2 $ 11,725,760 $ 140,000,000 68.0% 64.5% Mixed Use 11 365,700,000 10.8 $ 33,245,455 $ 200,000,000 69.6% 69.1% Industrial 10 67,297,750 2.0 $ 6,729,775 $ 36,100,000 78.7% 74.6% Special Purpose 2 17,500,000 0.5 $ 8,750,000 $ 14,000,000 63.5% 60.9% Healthcare 1 13,000,000 0.4 $ 13,000,000 $ 13,000,000 69.1% 65.7% Land(5) 5 5,900,000 0.2 $ 1,180,000 $ 2,630,000 44.1% 39.1% - ----------------------------- ---------- --------------- ------- 245 $ 3,380,656,275 100.0% $ 13,798,597 $ 200,000,000 70.7% 69.0% ========== =============== ======= WTD. AVG. STATED WTD. AVG. MINIMUM MAXIMUM REMAINING CUT-OFF CUT-OFF CUT-OFF TERM TO DATE DATE DATE WTD. AVG. WTD. AVG. MATURITY DSC DSC DSC OCCUPANCY MORTGAGE PROPERTY TYPE (MOS.) RATIO (2) RATIO (2) RATIO (2) RATE (3) RATE - ----------------------------------------------------------------------------------------------------- Office 88 1.40x 1.16x 2.11x 94.6% 5.763% Retail 119 1.45x 1.08x 2.55x 94.6% 5.656% Retail - Anchored 119 1.48x 1.16x 2.46x 95.3% 5.602% Retail - Outlet 119 1.38x 1.38x 1.38x 88.5% 5.755% Retail - Single Tenant 118 1.32x 1.08x 2.55x 100.0% 6.051% Retail - Unanchored 119 1.37x 1.25x 1.58x 88.7% 5.863% Retail - Shadow Anchored(4) 112 1.44x 1.16x 1.97x 93.7% 5.714% Hospitality 93 1.71x 1.20x 2.60x NA 5.906% Mixed Use 118 1.27x 1.12x 1.58x 98.6% 5.806% Industrial 118 1.40x 1.19x 1.88x 96.8% 5.881% Special Purpose 70 1.59x 1.18x 1.69x 78.3% 6.422% Healthcare 57 1.37x 1.37x 1.37x 89.7% 6.030% Land(5) 119 1.20x 1.20x 1.20x 100.0% 5.980% - ----------------------------- 102 1.47x 1.08x 2.60x 95.1% 5.772% _____________________________ (1) Because this table presents information relating to the Mortgaged Properties and not the Mortgage Loans, the information for Mortgage Loans secured by more than one Mortgaged Property is based on allocated amounts (allocating the Mortgage Loan principal balance to each of those properties by the appraised values of the Mortgaged Properties or the allocated loan amount (or specific release prices) as detailed in the related Mortgage Loan documents). (2) Certain of the Mortgage Loans reflect LTV Ratios that have been calculated on an "as-stabilized" basis, or that have DSC Ratios that have been adjusted to take into account certain cash reserves or letters of credit. See "Additional Mortgage Loan Information" herein. Also see "DESCRIPTION OF THE MORTGAGE POOL--Additional Mortgage Loan Information" and "RISK FACTORS--Risks Relating to Net Cash Flow" and "-- Inspections and Appraisals May Not Accurately Reflect Value or Condition of Mortgaged Property" in the Prospectus Supplement. (3) Occupancy Rates exclude 61 hospitality properties, representing 21.2% of the Cut-Off Date Group 1 Balance. In certain cases, occupancy includes space for which leases have been executed, but the tenant has not taken occupancy. (4) A Mortgaged Property is classified as "shadow anchored" if it is located in close proximity to an anchored retail property. (5) As of the origination of the related Mortgage Loan, one Mortgaged Property was improved with a mixed use office/retail building, one was improved with an apartment complex, one was improved with a multifamily condominium complex, one was improved with a high rise office building and a seven-story parking garage and the other was improved with a mixed use project that includes an office tower, retail arcade, underground parking facilities, meeting space and a 395-room luxury hotel; however, in all cases, the improvements are not part of the collateral for the related Mortgaged Property. B-3 WACHOVIA BANK COMMERCIAL MORTGAGE TRUST SERIES 2007-C32 ANNEX B MORTGAGED PROPERTIES BY PROPERTY TYPE FOR LOAN GROUP 2 MORTGAGE LOANS (1) % OF WTD. AVG. WTD. AVG. CUT-OFF AVERAGE MAXIMUM CUT-OFF LTV NUMBER OF AGGREGATE DATE CUT-OFF CUT-OFF DATE RATIO AT MORTGAGED CUT-OFF GROUP 2 DATE DATE LTV MATURITY PROPERTY TYPE PROPERTIES DATE BALANCE BALANCE BALANCE BALANCE RATIO (2) (2) - ----------------------------------------------------------------------------------------------------------------------------- Multifamily 30 $ 443,196,794 100.0% $ 14,773,226 $ 35,572,500 77.3% 76.3% - ----------------------------- ---------- --------------- ------- 30 $ 443,196,794 100.0% $ 14,773,226 $ 35,572,500 77.3% 76.3% ========== =============== ======= WTD. AVG. STATED WTD. AVG. MINIMUM MAXIMUM REMAINING CUT-OFF CUT-OFF CUT-OFF TERM TO DATE DATE DATE WTD. AVG. WTD. AVG. MATURITY DSC DSC DSC OCCUPANCY MORTGAGE PROPERTY TYPE (MOS.) RATIO (2) RATIO (2) RATIO (2) RATE RATE - ----------------------------------------------------------------------------------------------------- Multifamily 104 1.32x 1.15x 1.73x 92.9% 5.710% - ----------------------------- 104 1.32x 1.15x 1.73x 92.9% 5.710% _____________________________ (1) Because this table presents information relating to the Mortgaged Properties and not the Mortgage Loans, the information for Mortgage Loans secured by more than one Mortgaged Property is based on allocated amounts (allocating the Mortgage Loan principal balance to each of those properties by the appraised values of the Mortgaged Properties or the allocated loan amount (or specific release prices) as detailed in the related Mortgage Loan documents). (2) Certain of the Mortgage Loans reflect LTV Ratios that have been calculated on an "as-stabilized" basis, or that have DSC Ratios that have been adjusted to take into account certain cash reserves or letters of credit. See "Additional Mortgage Loan Information" herein. Also see "DESCRIPTION OF THE MORTGAGE POOL--Additional Mortgage Loan Information" and "RISK FACTORS--Risks Relating to Net Cash Flow" and "-- Inspections and Appraisals May Not Accurately Reflect Value or Condition of Mortgaged Property" in the Prospectus Supplement. B-4 WACHOVIA BANK COMMERCIAL MORTGAGE TRUST SERIES 2007-C32 ANNEX B RANGE OF CUT-OFF DATE BALANCES FOR ALL MORTGAGE LOANS % OF AGGREGATE CUT-OFF AVERAGE MAXIMUM WTD. AVG. WTD. AVG. NUMBER OF CUT-OFF DATE CUT-OFF CUT-OFF CUT-OFF LTV RATIO RANGE OF CUT-OFF MORTGAGE DATE POOL DATE DATE DATE LTV AT DATE BALANCES LOANS BALANCE BALANCE BALANCE BALANCE RATIO * MATURITY * - ------------------------------------------------------------------------------------------------------------------------------- $1,000,000 - $2,000,000 10 $ 14,287,326 0.4% $ 1,428,733 $ 1,994,000 65.2% 57.7% $2,000,001 - $3,000,000 6 14,474,539 0.4 $ 2,412,423 $ 2,747,709 68.2% 58.7% $3,000,001 - $4,000,000 9 31,137,951 0.8 $ 3,459,772 $ 3,850,000 69.9% 62.1% $4,000,001 - $5,000,000 8 35,540,000 0.9 $ 4,442,500 $ 5,000,000 74.2% 71.7% $5,000,001 - $6,000,000 9 51,310,000 1.3 $ 5,701,111 $ 6,000,000 70.0% 66.1% $6,000,001 - $7,000,000 5 32,784,335 0.9 $ 6,556,867 $ 6,994,335 70.6% 63.1% $7,000,001 - $8,000,000 5 38,420,000 1.0 $ 7,684,000 $ 8,000,000 72.7% 68.5% $8,000,001 - $9,000,000 4 34,680,000 0.9 $ 8,670,000 $ 9,000,000 69.7% 69.7% $9,000,001 - $10,000,000 3 28,450,000 0.7 $ 9,483,333 $ 10,000,000 72.7% 68.1% $10,000,001 - $15,000,000 31 368,879,919 9.6 $ 11,899,352 $ 14,750,000 70.5% 67.4% $15,000,001 - $20,000,000 9 157,475,000 4.1 $ 17,497,222 $ 19,875,000 76.2% 75.6% $20,000,001 - $25,000,000 5 119,350,000 3.1 $ 23,870,000 $ 25,000,000 75.7% 75.7% $25,000,001 - $30,000,000 8 224,520,000 5.9 $ 28,065,000 $ 30,000,000 77.7% 76.7% $30,000,001 - $35,000,000 5 163,875,000 4.3 $ 32,775,000 $ 35,000,000 69.5% 69.0% $35,000,001 - $40,000,000 5 186,422,500 4.9 $ 37,284,500 $ 40,000,000 81.5% 81.5% $40,000,001 - $45,000,000 1 44,000,000 1.2 $ 44,000,000 $ 44,000,000 75.2% 65.8% $45,000,001 - $50,000,000 3 139,000,000 3.6 $ 46,333,333 $ 47,000,000 66.6% 66.6% $50,000,001 - $55,000,000 1 54,000,000 1.4 $ 54,000,000 $ 54,000,000 77.1% 77.1% $55,000,001 - $60,000,000 1 60,000,000 1.6 $ 60,000,000 $ 60,000,000 52.8% 52.8% $60,000,001 - $65,000,000 1 64,000,000 1.7 $ 64,000,000 $ 64,000,000 74.7% 74.7% $65,000,001 - $70,000,000 2 136,500,000 3.6 $ 68,250,000 $ 70,000,000 67.3% 67.3% $70,000,001 - $75,000,000 1 75,040,500 2.0 $ 75,040,500 $ 75,040,500 79.8% 66.4% $80,000,001 - $90,000,000 1 89,300,000 2.3 $ 89,300,000 $ 89,300,000 56.1% 56.1% $90,000,001 - $100,000,000 2 187,400,000 4.9 $ 93,700,000 $ 95,000,000 75.1% 75.1% $100,000,001 - $150,000,000 3 353,906,000 9.3 $ 117,968,667 $ 140,000,000 70.9% 66.2% $150,000,001 - $200,000,000 1 200,000,000 5.2 $ 200,000,000 $ 200,000,000 66.7% 66.7% $200,000,001 - $300,000,000 2 505,100,000 13.2 $ 252,550,000 $ 283,850,000 63.7% 63.7% $400,000,001 - $414,000,000 1 414,000,000 10.8 $ 414,000,000 $ 414,000,000 78.7% 78.7% - ----------------------------- ---------- --------------- ------- 142 $ 3,823,853,069 100.0% $ 26,928,543 $ 414,000,000 71.4% 69.9% ========== =============== ======= WTD. AVG. STATED REMAINING WTD. AVG. TERM TO CUT-OFF WTD. AVG. RANGE OF CUT-OFF MATURITY DATE DSC MORTGAGE DATE BALANCES (MOS.) RATIO * RATE - ----------------------------------------------------------------- $1,000,000 - $2,000,000 119 1.56x 5.948% $2,000,001 - $3,000,000 118 1.50x 5.893% $3,000,001 - $4,000,000 105 1.38x 5.990% $4,000,001 - $5,000,000 111 1.33x 5.814% $5,000,001 - $6,000,000 113 1.28x 5.872% $6,000,001 - $7,000,000 119 1.44x 5.830% $7,000,001 - $8,000,000 119 1.39x 5.691% $8,000,001 - $9,000,000 119 1.32x 5.732% $9,000,001 - $10,000,000 120 1.35x 5.699% $10,000,001 - $15,000,000 110 1.36x 5.807% $15,000,001 - $20,000,000 106 1.34x 5.757% $20,000,001 - $25,000,000 108 1.27x 5.652% $25,000,001 - $30,000,000 112 1.29x 5.742% $30,000,001 - $35,000,000 108 1.63x 5.775% $35,000,001 - $40,000,000 108 1.34x 5.799% $40,000,001 - $45,000,000 119 1.31x 5.890% $45,000,001 - $50,000,000 121 1.54x 5.595% $50,000,001 - $55,000,000 59 1.35x 5.695% $55,000,001 - $60,000,000 124 1.74x 5.645% $60,000,001 - $65,000,000 120 1.20x 5.980% $65,000,001 - $70,000,000 120 1.88x 5.526% $70,000,001 - $75,000,000 118 1.22x 5.680% $80,000,001 - $90,000,000 124 1.66x 5.645% $90,000,001 - $100,000,000 89 1.46x 5.717% $100,000,001 - $150,000,000 119 1.36x 5.984% $150,000,001 - $200,000,000 118 1.25x 5.920% $200,000,001 - $300,000,000 86 1.86x 5.635% $400,000,001 - $414,000,000 59 1.27x 5.797% - ----------------------------- 103 1.45x 5.765% _____________________________ * Certain of the Mortgage Loans reflect LTV Ratios that have been calculated on an "as-stabilized" basis, or that have DSC Ratios that have been adjusted to take into account certain cash reserves or letters of credit. See "Additional Mortgage Loan Information" herein. Also see "DESCRIPTION OF THE MORTGAGE POOL--Additional Mortgage Loan Information" and "RISK FACTORS--Risks Relating to Net Cash Flow" and "-- Inspections and Appraisals May Not Accurately Reflect Value or Condition of Mortgaged Property" in the Prospectus Supplement. B-5 WACHOVIA BANK COMMERCIAL MORTGAGE TRUST SERIES 2007-C32 ANNEX B RANGE OF CUT-OFF DATE BALANCES FOR LOAN GROUP 1 MORTGAGE LOANS % OF AGGREGATE CUT-OFF AVERAGE MAXIMUM WTD. AVG. WTD. AVG. NUMBER OF CUT-OFF DATE CUT-OFF CUT-OFF CUT-OFF LTV RATIO RANGE OF CUT-OFF MORTGAGE DATE GROUP 1 DATE DATE DATE LTV AT DATE BALANCES LOANS BALANCE BALANCE BALANCE BALANCE RATIO * MATURITY * - ------------------------------------------------------------------------------------------------------------------------------- $1,000,000 - $2,000,000 10 $ 14,287,326 0.4% $ 1,428,733 $ 1,994,000 65.2% 57.7% $2,000,001 - $3,000,000 6 14,474,539 0.4 $ 2,412,423 $ 2,747,709 68.2% 58.7% $3,000,001 - $4,000,000 7 24,337,951 0.7 $ 3,476,850 $ 3,850,000 67.4% 59.2% $4,000,001 - $5,000,000 5 21,890,000 0.6 $ 4,378,000 $ 5,000,000 73.1% 68.9% $5,000,001 - $6,000,000 8 45,750,000 1.4 $ 5,718,750 $ 6,000,000 68.9% 64.5% $6,000,001 - $7,000,000 4 26,084,335 0.8 $ 6,521,084 $ 6,994,335 68.1% 62.0% $7,000,001 - $8,000,000 3 23,920,000 0.7 $ 7,973,333 $ 8,000,000 73.7% 68.6% $8,000,001 - $9,000,000 3 26,600,000 0.8 $ 8,866,667 $ 9,000,000 71.5% 71.5% $9,000,001 - $10,000,000 3 28,450,000 0.8 $ 9,483,333 $ 10,000,000 72.7% 68.1% $10,000,001 - $15,000,000 22 265,125,625 7.8 $ 12,051,165 $ 14,750,000 68.7% 65.4% $15,000,001 - $20,000,000 6 103,770,000 3.1 $ 17,295,000 $ 18,850,000 75.7% 74.8% $20,000,001 - $25,000,000 5 119,350,000 3.5 $ 23,870,000 $ 25,000,000 75.7% 75.7% $25,000,001 - $30,000,000 7 198,520,000 5.9 $ 28,360,000 $ 30,000,000 77.4% 76.3% $30,000,001 - $35,000,000 1 35,000,000 1.0 $ 35,000,000 $ 35,000,000 34.7% 32.4% $35,000,001 - $40,000,000 3 110,850,000 3.3 $ 36,950,000 $ 38,000,000 83.5% 83.5% $40,000,001 - $45,000,000 1 44,000,000 1.3 $ 44,000,000 $ 44,000,000 75.2% 65.8% $45,000,001 - $50,000,000 3 139,000,000 4.1 $ 46,333,333 $ 47,000,000 66.6% 66.6% $50,000,001 - $55,000,000 1 54,000,000 1.6 $ 54,000,000 $ 54,000,000 77.1% 77.1% $55,000,001 - $60,000,000 1 60,000,000 1.8 $ 60,000,000 $ 60,000,000 52.8% 52.8% $60,000,001 - $65,000,000 1 64,000,000 1.9 $ 64,000,000 $ 64,000,000 74.7% 74.7% $65,000,001 - $70,000,000 2 136,500,000 4.0 $ 68,250,000 $ 70,000,000 67.3% 67.3% $70,000,001 - $75,000,000 1 75,040,500 2.2 $ 75,040,500 $ 75,040,500 79.8% 66.4% $80,000,001 - $90,000,000 1 89,300,000 2.6 $ 89,300,000 $ 89,300,000 56.1% 56.1% $90,000,001 - $100,000,000 2 187,400,000 5.5 $ 93,700,000 $ 95,000,000 75.1% 75.1% $100,000,001 - $150,000,000 3 353,906,000 10.5 $ 117,968,667 $ 140,000,000 70.9% 66.2% $150,000,001 - $200,000,000 1 200,000,000 5.9 $ 200,000,000 $ 200,000,000 66.7% 66.7% $200,000,001 - $300,000,000 2 505,100,000 14.9 $ 252,550,000 $ 283,850,000 63.7% 63.7% $400,000,001 - $414,000,000 1 414,000,000 12.2 $ 414,000,000 $ 414,000,000 78.7% 78.7% - ----------------------------- ---------- --------------- ------- 113 $ 3,380,656,275 100.0% $ 29,917,312 $ 414,000,000 70.7% 69.0% ========== =============== ======= WTD. AVG. STATED REMAINING WTD. AVG. TERM TO CUT-OFF WTD. AVG. RANGE OF CUT-OFF MATURITY DATE DSC MORTGAGE DATE BALANCES (MOS.) RATIO * RATE - ----------------------------------------------------------------- $1,000,000 - $2,000,000 119 1.56x 5.948% $2,000,001 - $3,000,000 118 1.50x 5.893% $3,000,001 - $4,000,000 101 1.44x 6.010% $4,000,001 - $5,000,000 106 1.36x 5.845% $5,000,001 - $6,000,000 112 1.26x 5.889% $6,000,001 - $7,000,000 118 1.51x 5.855% $7,000,001 - $8,000,000 119 1.33x 5.726% $8,000,001 - $9,000,000 119 1.32x 5.787% $9,000,001 - $10,000,000 120 1.35x 5.699% $10,000,001 - $15,000,000 108 1.39x 5.873% $15,000,001 - $20,000,000 119 1.36x 5.714% $20,000,001 - $25,000,000 108 1.27x 5.652% $25,000,001 - $30,000,000 111 1.30x 5.735% $30,000,001 - $35,000,000 118 2.60x 5.907% $35,000,001 - $40,000,000 119 1.34x 5.910% $40,000,001 - $45,000,000 119 1.31x 5.890% $45,000,001 - $50,000,000 121 1.54x 5.595% $50,000,001 - $55,000,000 59 1.35x 5.695% $55,000,001 - $60,000,000 124 1.74x 5.645% $60,000,001 - $65,000,000 120 1.20x 5.980% $65,000,001 - $70,000,000 120 1.88x 5.526% $70,000,001 - $75,000,000 118 1.22x 5.680% $80,000,001 - $90,000,000 124 1.66x 5.645% $90,000,001 - $100,000,000 89 1.46x 5.717% $100,000,001 - $150,000,000 119 1.36x 5.984% $150,000,001 - $200,000,000 118 1.25x 5.920% $200,000,001 - $300,000,000 86 1.86x 5.635% $400,000,001 - $414,000,000 59 1.27x 5.797% - ----------------------------- 102 1.47x 5.772% _____________________________ * Certain of the Mortgage Loans reflect LTV Ratios that have been calculated on an "as-stabilized" basis, or that have DSC Ratios that have been adjusted to take into account certain cash reserves or letters of credit. See "Additional Mortgage Loan Information" herein. Also see "DESCRIPTION OF THE MORTGAGE POOL--Additional Mortgage Loan Information" and "RISK FACTORS--Risks Relating to Net Cash Flow" and "-- Inspections and Appraisals May Not Accurately Reflect Value or Condition of Mortgaged Property" in the Prospectus Supplement. B-6 WACHOVIA BANK COMMERCIAL MORTGAGE TRUST SERIES 2007-C32 ANNEX B RANGE OF CUT-OFF DATE BALANCES FOR LOAN GROUP 2 MORTGAGE LOANS % OF AGGREGATE CUT-OFF AVERAGE MAXIMUM WTD. AVG. WTD. AVG. NUMBER OF CUT-OFF DATE CUT-OFF CUT-OFF CUT-OFF LTV RATIO RANGE OF CUT-OFF MORTGAGE DATE GROUP 2 DATE DATE DATE LTV AT DATE BALANCES LOANS BALANCE BALANCE BALANCE BALANCE RATIO * MATURITY * - ------------------------------------------------------------------------------------------------------------------------------- $3,100,000 - $4,000,000 2 $ 6,800,000 1.5% $ 3,400,000 $ 3,700,000 78.8% 72.4% $4,000,001 - $5,000,000 3 13,650,000 3.1 $ 4,550,000 $ 4,700,000 76.1% 76.1% $5,000,001 - $6,000,000 1 5,560,000 1.3 $ 5,560,000 $ 5,560,000 79.4% 79.4% $6,000,001 - $7,000,000 1 6,700,000 1.5 $ 6,700,000 $ 6,700,000 80.0% 67.3% $7,000,001 - $8,000,000 2 14,500,000 3.3 $ 7,250,000 $ 7,400,000 71.0% 68.3% $8,000,001 - $9,000,000 1 8,080,000 1.8 $ 8,080,000 $ 8,080,000 64.1% 64.1% $10,000,001 - $15,000,000 9 103,754,294 23.4 $ 11,528,255 $ 13,200,000 75.2% 72.5% $15,000,001 - $20,000,000 3 53,705,000 12.1 $ 17,901,667 $ 19,875,000 77.2% 77.2% $25,000,001 - $30,000,000 1 26,000,000 5.9 $ 26,000,000 $ 26,000,000 80.1% 80.1% $30,000,001 - $35,000,000 4 128,875,000 29.1 $ 32,218,750 $ 34,000,000 78.9% 78.9% $35,000,001 - $40,000,000 2 75,572,500 17.1 $ 37,786,250 $ 40,000,000 78.6% 78.6% - ----------------------------- ---------- --------------- ------- 29 $ 443,196,794 100.0% $ 15,282,648 $ 40,000,000 77.3% 76.3% ========== =============== ======= WTD. AVG. STATED REMAINING WTD. AVG. TERM TO CUT-OFF WTD. AVG. RANGE OF CUT-OFF MATURITY DATE DSC MORTGAGE DATE BALANCES (MOS.) RATIO * RATE - ----------------------------------------------------------------- $3,100,000 - $4,000,000 120 1.17x 5.919% $4,000,001 - $5,000,000 119 1.28x 5.765% $5,000,001 - $6,000,000 119 1.45x 5.740% $6,000,001 - $7,000,000 120 1.17x 5.730% $7,000,001 - $8,000,000 119 1.48x 5.633% $8,000,001 - $9,000,000 119 1.33x 5.550% $10,000,001 - $15,000,000 113 1.29x 5.639% $15,000,001 - $20,000,000 80 1.29x 5.838% $25,000,001 - $30,000,000 119 1.20x 5.800% $30,000,001 - $35,000,000 105 1.37x 5.739% $35,000,001 - $40,000,000 91 1.36x 5.635% - ----------------------------- 104 1.32x 5.710% _____________________________ * Certain of the Mortgage Loans reflect LTV Ratios that have been calculated on an "as-stabilized" basis, or that have DSC Ratios that have been adjusted to take into account certain cash reserves or letters of credit. See "Additional Mortgage Loan Information" herein. Also see "DESCRIPTION OF THE MORTGAGE POOL--Additional Mortgage Loan Information" and "RISK FACTORS--Risks Relating to Net Cash Flow" and "-- Inspections and Appraisals May Not Accurately Reflect Value or Condition of Mortgaged Property" in the Prospectus Supplement. B-7 WACHOVIA BANK COMMERCIAL MORTGAGE TRUST SERIES 2007-C32 ANNEX B MORTGAGED PROPERTIES BY STATE FOR ALL MORTGAGE LOANS (1) % OF AGGREGATE CUT-OFF AVERAGE MAXIMUM NUMBER OF CUT-OFF DATE CUT-OFF CUT-OFF MORTGAGED DATE POOL DATE DATE STATE PROPERTIES BALANCE BALANCE BALANCE BALANCE - ------------------------------------------------------------------------------------------------------------------------- NY 10 $ 597,750,000 15.6% $ 59,775,000 $ 200,000,000 CA 25 575,873,000 15.1 $ 23,034,920 $ 89,300,000 Southern(3) 20 525,626,000 13.7 $ 26,281,300 $ 89,300,000 Northern(3) 5 50,247,000 1.3 $ 10,049,400 $ 12,400,000 FL 44 356,557,496 9.3 $ 8,103,579 $ 46,000,000 GA 28 237,654,004 6.2 $ 8,487,643 $ 28,000,000 VA 13 199,442,775 5.2 $ 15,341,752 $ 50,666,978 WA 11 186,648,641 4.9 $ 16,968,058 $ 47,643,889 NC 18 177,727,018 4.6 $ 9,873,723 $ 29,400,000 PA 8 169,646,044 4.4 $ 21,205,755 $ 92,400,000 NJ 7 140,402,500 3.7 $ 20,057,500 $ 67,800,000 Cayman Islands 1 140,000,000 3.7 $ 140,000,000 $ 140,000,000 SC 4 127,490,500 3.3 $ 31,872,625 $ 75,040,500 TX 20 126,607,500 3.3 $ 6,330,375 $ 34,000,000 DC 4 125,349,378 3.3 $ 31,337,345 $ 63,968,572 NV 5 105,967,500 2.8 $ 21,193,500 $ 35,572,500 AL 5 80,263,000 2.1 $ 16,052,600 $ 44,000,000 CO 3 40,522,500 1.1 $ 13,507,500 $ 31,000,000 AR 2 40,000,000 1.0 $ 20,000,000 $ 27,200,000 MO 8 39,192,000 1.0 $ 4,899,000 $ 13,056,000 MA 4 38,004,500 1.0 $ 9,501,125 $ 16,200,000 IL 6 35,849,479 0.9 $ 5,974,913 $ 12,936,479 NM 6 35,014,500 0.9 $ 5,835,750 $ 16,180,000 LA 1 33,700,000 0.9 $ 33,700,000 $ 33,700,000 AZ 8 32,740,000 0.9 $ 4,092,500 $ 10,700,000 ME 3 28,640,000 0.7 $ 9,546,667 $ 12,720,000 MD 3 22,907,000 0.6 $ 7,635,667 $ 9,067,500 MI 2 22,260,121 0.6 $ 11,130,061 $ 19,875,000 IN 5 20,252,917 0.5 $ 4,050,583 $ 8,382,500 OH 4 16,263,500 0.4 $ 4,065,875 $ 6,017,500 ID 1 11,800,000 0.3 $ 11,800,000 $ 11,800,000 SD 2 10,400,000 0.3 $ 5,200,000 $ 6,691,649 VT 3 10,187,245 0.3 $ 3,395,748 $ 6,994,335 CT 1 8,800,000 0.2 $ 8,800,000 $ 8,800,000 UT 2 7,086,500 0.2 $ 3,543,250 $ 4,200,000 MN 2 6,897,148 0.2 $ 3,448,574 $ 3,700,000 WI 2 5,472,302 0.1 $ 2,736,151 $ 3,478,302 OR 1 4,918,000 0.1 $ 4,918,000 $ 4,918,000 TN 1 2,245,000 0.1 $ 2,245,000 $ 2,245,000 ND 1 1,750,000 0.0 $ 1,750,000 $ 1,750,000 RI 1 1,571,000 0.0 $ 1,571,000 $ 1,571,000 - ------------------------------- ------- ---------------- ----- 275 $ 3,823,853,069 100.0% $ 13,904,920 $ 200,000,000 ======= ================ ===== WTD. AVG. STATED WTD. AVG. REMAINING WTD. AVG. CUT-OFF WTD. AVG. TERM TO CUT-OFF WTD. AVG. DATE LTV LTV RATIO MATURITY DATE DSC MORTGAGE STATE RATIO (2) AT MATURITY (2) (MOS.) RATIO (2) RATE - ------------------------------------------------------------------------------------------------------- NY 70.0% 69.9% 101 1.44x 5.734% CA 65.6% 65.6% 108 1.62x 5.737% Southern(3) 65.5% 65.5% 109 1.61x 5.744% Northern(3) 66.7% 66.7% 99 1.65x 5.665% FL 71.1% 69.2% 114 1.41x 5.712% GA 68.7% 67.8% 102 1.45x 5.771% VA 74.4% 73.0% 77 1.35x 5.807% WA 77.0% 76.8% 61 1.35x 5.784% NC 72.9% 70.3% 116 1.41x 5.632% PA 67.1% 66.5% 116 1.69x 5.742% NJ 73.1% 71.8% 119 1.43x 5.733% Cayman Islands 71.4% 63.2% 120 1.25x 6.380% SC 78.1% 70.2% 119 1.33x 5.643% TX 70.9% 68.9% 104 1.54x 5.705% DC 78.7% 78.7% 59 1.27x 5.797% NV 77.2% 76.8% 83 1.32x 5.772% AL 75.9% 70.7% 114 1.39x 5.823% CO 73.2% 72.3% 110 1.44x 5.816% AR 80.0% 80.0% 119 1.42x 5.480% MO 70.8% 70.0% 99 1.60x 5.669% MA 65.4% 65.4% 115 1.55x 5.805% IL 71.6% 66.4% 101 1.51x 6.250% NM 74.6% 74.3% 63 1.48x 5.783% LA 79.3% 79.3% 119 1.50x 5.650% AZ 75.7% 74.5% 119 1.36x 5.796% ME 79.8% 74.2% 119 1.26x 5.662% MD 63.6% 63.6% 100 1.72x 5.621% MI 78.6% 76.1% 117 1.32x 5.642% IN 69.4% 66.3% 119 1.42x 5.757% OH 63.6% 63.6% 91 1.81x 5.630% ID 79.7% 79.7% 119 1.41x 5.880% SD 75.5% 64.2% 120 1.16x 6.080% VT 70.5% 61.6% 118 1.68x 5.976% CT 78.6% 78.6% 119 1.43x 5.590% UT 70.4% 64.6% 94 1.66x 5.898% MN 77.7% 65.8% 120 1.23x 5.902% WI 61.7% 47.5% 117 1.60x 5.873% OR 63.8% 63.8% 60 2.14x 5.663% TN 63.8% 63.8% 60 2.14x 5.663% ND 67.3% 57.6% 120 1.20x 6.290% RI 74.8% 70.0% 119 1.20x 6.020% - ------------------------------- 71.4% 69.9% 103 1.45x 5.765% __________________ (1) Because this table presents information relating to the Mortgaged Properties and not the Mortgage Loans, the information for Mortgage Loans secured by more than one Mortgaged Property is based on allocated amounts (allocating the Mortgage Loan principal balance to each of those properties by the appraised values of the Mortgaged Properties or the allocated loan amount (or specific release prices) as detailed in the related Mortgage Loan documents). (2) Certain of the Mortgage Loans reflect LTV Ratios that have been calculated on an "as-stabilized" basis, or that have DSC Ratios that have been adjusted to take into account certain cash reserves or letters of credit. See "Additional Mortgage Loan Information" herein. Also see "DESCRIPTION OF THE MORTGAGE POOL-Additional Mortgage Loan Information" and "RISK FACTORS-Risks Relating to Net Cash Flow" and "- Inspections and Appraisals May Not Accurately Reflect Value or Condition of Mortgaged Property" in the Prospectus Supplement. (3) For purposes of determining whether a Mortgaged Property is in Northern California or Southern California, Mortgaged Properties north of San Luis Obispo County, Kern County and San Bernardino County were included in Northern California and Mortgaged Properties in or south of such counties were included in Southern California. B-8 WACHOVIA BANK COMMERCIAL MORTGAGE TRUST SERIES 2007-C32 ANNEX B MORTGAGED PROPERTIES BY STATE FOR LOAN GROUP 1 MORTGAGE LOANS (1) % OF AGGREGATE CUT-OFF AVERAGE NUMBER OF CUT-OFF DATE CUT-OFF MORTGAGED DATE GROUP 1 DATE STATE PROPERTIES BALANCE BALANCE BALANCE - -------------------------------------------------------------------------------------------------- NY 10 $ 597,750,000 17.7% $ 59,775,000 CA 23 545,023,000 16.1 $ 23,696,652 Southern(3) 18 494,776,000 14.6 $ 27,487,556 Northern(3) 5 50,247,000 1.5 $ 10,049,400 FL 44 356,557,496 10.5 $ 8,103,579 GA 27 211,654,004 6.3 $ 7,839,037 WA 11 186,648,641 5.5 $ 16,968,058 VA 11 177,914,481 5.3 $ 16,174,044 PA 6 154,166,044 4.6 $ 25,694,341 NC 15 148,627,018 4.4 $ 9,908,468 NJ 7 140,402,500 4.2 $ 20,057,500 Cayman Islands 1 140,000,000 4.1 $ 140,000,000 SC 4 127,490,500 3.8 $ 31,872,625 DC 4 125,349,378 3.7 $ 31,337,345 AL 5 80,263,000 2.4 $ 16,052,600 TX 17 73,457,500 2.2 $ 4,321,029 NV 3 40,220,000 1.2 $ 13,406,667 MA 4 38,004,500 1.1 $ 9,501,125 ME 3 28,640,000 0.8 $ 9,546,667 IL 3 23,449,479 0.7 $ 7,816,493 MD 3 22,907,000 0.7 $ 7,635,667 AZ 7 22,040,000 0.7 $ 3,148,571 MO 6 21,786,000 0.6 $ 3,631,000 OH 4 16,263,500 0.5 $ 4,065,875 IN 4 14,692,917 0.4 $ 3,673,229 ID 1 11,800,000 0.3 $ 11,800,000 SD 2 10,400,000 0.3 $ 5,200,000 VT 3 10,187,245 0.3 $ 3,395,748 CO 2 9,522,500 0.3 $ 4,761,250 CT 1 8,800,000 0.3 $ 8,800,000 NM 4 8,014,500 0.2 $ 2,003,625 UT 2 7,086,500 0.2 $ 3,543,250 WI 2 5,472,302 0.2 $ 2,736,151 OR 1 4,918,000 0.1 $ 4,918,000 MN 1 3,197,148 0.1 $ 3,197,148 MI 1 2,385,121 0.1 $ 2,385,121 TN 1 2,245,000 0.1 $ 2,245,000 ND 1 1,750,000 0.1 $ 1,750,000 RI 1 1,571,000 0.0 $ 1,571,000 - ----------------- ------- -------------- ------ 245 $3,380,656,275 100.0% $ 13,798,597 ====== ============== ====== WTD. AVG. STATED MAXIMUM WTD. AVG. REMAINING WTD. AVG. CUT-OFF CUT-OFF WTD. AVG. TERM TO CUT-OFF WTD. AVG. DATE DATE LTV LTV RATIO MATURITY DATE DSC MORTGAGE STATE BALANCE RATIO (2) AT MATURITY (2) (MOS.) RATIO (2) RATE - ----------------------------------------------------------------------------------------------------------------------- NY $ 200,000,000 70.0% 69.9% 101 1.44x 5.734% CA $ 89,300,000 65.1% 65.1% 109 1.64x 5.726% Southern(3) $ 89,300,000 64.9% 64.9% 110 1.64x 5.732% Northern(3) $ 12,400,000 66.7% 66.7% 99 1.65x 5.665% FL $ 46,000,000 71.1% 69.2% 114 1.41x 5.712% GA $ 28,000,000 67.3% 66.3% 100 1.48x 5.768% WA $ 47,643,889 77.0% 76.8% 61 1.35x 5.784% VA $ 50,666,978 75.9% 75.2% 71 1.35x 5.819% PA $ 92,400,000 67.4% 66.8% 115 1.71x 5.761% NC $ 29,400,000 71.5% 69.1% 115 1.43x 5.620% NJ $ 67,800,000 73.1% 71.8% 119 1.43x 5.733% Cayman Islands $ 140,000,000 71.4% 63.2% 120 1.25x 6.380% SC $ 75,040,500 78.1% 70.2% 119 1.33x 5.643% DC $ 63,968,572 78.7% 78.7% 59 1.27x 5.797% AL $ 44,000,000 75.9% 70.7% 114 1.39x 5.823% TX $ 11,050,000 65.2% 63.9% 92 1.68x 5.803% NV $ 28,620,000 76.4% 75.4% 120 1.39x 5.709% MA $ 16,200,000 65.4% 65.4% 115 1.55x 5.805% ME $ 12,720,000 79.8% 74.2% 119 1.26x 5.662% IL $ 12,936,479 69.4% 61.5% 91 1.65x 6.472% MD $ 9,067,500 63.6% 63.6% 100 1.72x 5.621% AZ $ 9,200,000 75.4% 73.5% 119 1.40x 5.819% MO $ 6,842,500 64.0% 62.6% 83 1.84x 5.699% OH $ 6,017,500 63.6% 63.6% 91 1.81x 5.630% IN $ 8,382,500 65.7% 61.3% 120 1.40x 5.763% ID $ 11,800,000 79.7% 79.7% 119 1.41x 5.880% SD $ 6,691,649 75.5% 64.2% 120 1.16x 6.080% VT $ 6,994,335 70.5% 61.6% 118 1.68x 5.976% CO $ 6,022,500 57.3% 53.4% 82 2.00x 5.772% CT $ 8,800,000 78.6% 78.6% 119 1.43x 5.590% NM $ 5,559,500 57.7% 56.2% 78 1.85x 5.760% UT $ 4,200,000 70.4% 64.6% 94 1.66x 5.898% WI $ 3,478,302 61.7% 47.5% 117 1.60x 5.873% OR $ 4,918,000 63.8% 63.8% 60 2.14x 5.663% MN $ 3,197,148 77.0% 64.9% 119 1.32x 5.720% MI $ 2,385,121 68.1% 45.0% 117 1.33x 5.990% TN $ 2,245,000 63.8% 63.8% 60 2.14x 5.663% ND $ 1,750,000 67.3% 57.6% 120 1.20x 6.290% RI $ 1,571,000 74.8% 70.0% 119 1.20x 6.020% - ----------------------------------------------------------------------------------------------------------------------- $ 200,000,000 70.7% 69.0% 102 1.47x 5.772% ______________________ (1) Because this table presents information relating to the Mortgaged Properties and not the Mortgage Loans, the information for Mortgage Loans secured by more than one Mortgaged Property is based on allocated amounts (allocating the Mortgage Loan principal balance to each of those properties by the appraised values of the Mortgaged Properties or the allocated loan amount (or specific release prices) as detailed in the related Mortgage Loan documents). (2) Certain of the Mortgage Loans reflect LTV Ratios that have been calculated on an "as-stabilized" basis, or that have DSC Ratios that have been adjusted to take into account certain cash reserves or letters of credit. See "Additional Mortgage Loan Information" herein. Also see "DESCRIPTION OF THE MORTGAGE POOL--Additional Mortgage Loan Information" and "RISK FACTORS--Risks Relating to Net Cash Flow" and "-- Inspections and Appraisals May Not Accurately Reflect Value or Condition of Mortgaged Property" in the Prospectus Supplement. (3) For purposes of determining whether a Mortgaged Property is in Northern California or Southern California, Mortgaged Properties north of San Luis Obispo County, Kern County and San Bernardino County were included in Northern California and Mortgaged Properties in or south of such counties were included in Southern California. B-9 WACHOVIA BANK COMMERCIAL MORTGAGE TRUST SERIES 2007-C32 ANNEX B MORTGAGED PROPERTIES BY STATE FOR LOAN GROUP 2 MORTGAGE LOANS (1) % OF AGGREGATE CUT-OFF AVERAGE MAXIMUM NUMBER OF CUT-OFF DATE CUT-OFF CUT-OFF MORTGAGED DATE GROUP 2 DATE DATE STATE PROPERTIES BALANCE BALANCE BALANCE BALANCE - ------------------------------------------------------------------------------------------------------------------------- NV 2 $ 65,747,500 14.8% $ 32,873,750 $ 35,572,500 TX 3 53,150,000 12.0 $ 17,716,667 $ 34,000,000 AR 2 40,000,000 9.0 $ 20,000,000 $ 27,200,000 LA 1 33,700,000 7.6 $ 33,700,000 $ 33,700,000 CO 1 31,000,000 7.0 $ 31,000,000 $ 31,000,000 CA 2 30,850,000 7.0 $ 15,425,000 $ 17,650,000 Southern(3) 2 30,850,000 7.0 $ 15,425,000 $ 17,650,000 NC 3 29,100,000 6.6 $ 9,700,000 $ 11,600,000 NM 2 27,000,000 6.1 $ 13,500,000 $ 16,180,000 GA 1 26,000,000 5.9 $ 26,000,000 $ 26,000,000 VA 2 21,528,294 4.9 $ 10,764,147 $ 11,278,294 MI 1 19,875,000 4.5 $ 19,875,000 $ 19,875,000 MO 2 17,406,000 3.9 $ 8,703,000 $ 13,056,000 PA 2 15,480,000 3.5 $ 7,740,000 $ 8,080,000 IL 3 12,400,000 2.8 $ 4,133,333 $ 4,700,000 AZ 1 10,700,000 2.4 $ 10,700,000 $ 10,700,000 IN 1 5,560,000 1.3 $ 5,560,000 $ 5,560,000 MN 1 3,700,000 0.8 $ 3,700,000 $ 3,700,000 ---- -------------- ---- 30 $ 443,196,794 100.0% $ 14,773,226 $ 35,572,500 ==== ============== ==== WTD. AVG. STATED WTD. AVG. REMAINING WTD. AVG. CUT-OFF WTD. AVG. TERM TO CUT-OFF WTD. AVG. DATE LTV LTV RATIO MATURITY DATE DSC MORTGAGE STATE RATIO (2) AT MATURITY (2) (MOS.) RATIO (2) RATE - ----------------------------------------------------------------------------------------------------------------- NV 77.6% 77.6% 60 1.27x 5.810% TX 78.7% 75.8% 119 1.36x 5.569% AR 80.0% 80.0% 119 1.42x 5.480% LA 79.3% 79.3% 119 1.50x 5.650% CO 78.1% 78.1% 119 1.27x 5.830% CA 75.6% 75.6% 85 1.20x 5.936% Southern(3) 75.6% 75.6% 85 1.20x 5.936% NC 79.8% 76.6% 119 1.30x 5.696% NM 79.6% 79.6% 59 1.37x 5.790% GA 80.1% 80.1% 119 1.20x 5.800% VA 61.8% 55.1% 119 1.29x 5.709% MI 79.8% 79.8% 117 1.32x 5.600% MO 79.3% 79.3% 119 1.30x 5.630% PA 63.6% 63.6% 119 1.52x 5.550% IL 75.7% 75.7% 119 1.24x 5.829% AZ 76.4% 76.4% 120 1.28x 5.750% IN 79.4% 79.4% 119 1.45x 5.740% MN 78.3% 66.5% 120 1.15x 6.060% - ----------------------------------------------------------------------------------------------------------------------- 77.3% 76.3% 104 1.32x 5.710% ______________________ (1) Because this table presents information relating to the Mortgaged Properties and not the Mortgage Loans, the information for Mortgage Loans secured by more than one Mortgaged Property is based on allocated amounts (allocating the Mortgage Loan principal balance to each of those properties by the appraised values of the Mortgaged Properties or the allocated loan amount (or specific release prices) as detailed in the related Mortgage Loan documents). (2) Certain of the Mortgage Loans reflect LTV Ratios that have been calculated on an "as-stabilized" basis, or that have DSC Ratios that have been adjusted to take into account certain cash reserves or letters of credit. See "Additional Mortgage Loan Information" herein. Also see "DESCRIPTION OF THE MORTGAGE POOL--Additional Mortgage Loan Information" and "RISK FACTORS--Risks Relating to Net Cash Flow" and "-- Inspections and Appraisals May Not Accurately Reflect Value or Condition of Mortgaged Property" in the Prospectus Supplement. (3) For purposes of determining whether a Mortgaged Property is in Northern California or Southern California, Mortgaged Properties north of San Luis Obispo County, Kern County and San Bernardino County were included in Northern California and Mortgaged Properties in or south of such counties were included in Southern California. B-10 WACHOVIA BANK COMMERCIAL MORTGAGE TRUST SERIES 2007-C32 ANNEX B RANGE OF UNDERWRITTEN DSC RATIOS FOR ALL MORTGAGE LOANS AS OF THE CUT-OFF DATE % OF AGGREGATE CUT-OFF AVERAGE NUMBER OF CUT-OFF DATE CUT-OFF RANGE OF UNDERWRITTEN MORTGAGE DATE POOL DATE DSC RATIOS (X) LOANS BALANCE BALANCE BALANCE - ------------------------------------------------------------------------------------ 1.08 - 1.09 1 $ 25,000,000 0.7% $ 25,000,000 1.10 - 1.14 1 27,000,000 0.7 $ 27,000,000 1.15 - 1.19 11 100,110,379 2.6 $ 9,100,944 1.20 - 1.24 25 473,820,266 12.4 $ 18,952,811 1.25 - 1.29 29 1,123,659,813 29.4 $ 38,746,890 1.30 - 1.34 14 192,677,770 5.0 $ 13,762,698 1.35 - 1.39 12 352,112,212 9.2 $ 29,342,684 1.40 - 1.44 12 241,428,294 6.3 $ 20,119,025 1.45 - 1.49 8 100,120,000 2.6 $ 12,515,000 1.50 - 1.54 5 473,050,000 12.4 $ 94,610,000 1.55 - 1.59 3 41,894,335 1.1 $ 13,964,778 1.60 - 1.64 2 20,500,000 0.5 $ 10,250,000 1.65 - 1.69 2 103,300,000 2.7 $ 51,650,000 1.70 - 1.74 3 80,930,000 2.1 $ 26,976,667 1.75 - 1.79 1 3,500,000 0.1 $ 3,500,000 1.85 - 1.89 4 20,211,000 0.5 $ 5,052,750 1.95 - 1.99 2 4,500,000 0.1 $ 2,250,000 2.05 - 2.09 1 1,994,000 0.1 $ 1,994,000 2.10 - 2.14 2 329,850,000 8.6 $164,925,000 2.15 - 2.19 1 2,095,000 0.1 $ 2,095,000 2.30 - 2.60 3 106,100,000 2.8 $ 35,366,667 - ------------------------- --------- --------------- --------- 142 $ 3,823,853,069 100.0% $ 26,928,543 ========= =============== ========= WTD. AVG. STATED MAXIMUM WTD. AVG. REMAINING WTD. AVG. CUT-OFF CUT-OFF WTD. AVG. TERM TO CUT-OFF WTD. AVG. RANGE OF UNDERWRITTEN DATE DATE LTV LTV RATIO MATURITY DATE DSC MORTGAGE DSC RATIOS (X) BALANCE RATIO * AT MATURITY * (MOS.) RATIO * RATE - ----------------------------------------------------------------------------------------------------------------- 1.08 - 1.09 $ 25,000,000 80.6% 80.6% 120 1.08x 5.700% 1.10 - 1.14 $ 27,000,000 75.0% 72.1% 118 1.12x 5.680% 1.15 - 1.19 $ 25,000,000 68.1% 62.3% 120 1.17x 5.714% 1.20 - 1.24 $ 75,040,500 77.3% 74.1% 115 1.21x 5.799% 1.25 - 1.29 $ 414,000,000 75.0% 73.3% 92 1.26x 5.906% 1.30 - 1.34 $ 47,000,000 74.0% 70.4% 119 1.31x 5.765% 1.35 - 1.39 $ 103,906,000 77.6% 75.4% 104 1.36x 5.829% 1.40 - 1.44 $ 40,000,000 77.9% 77.5% 110 1.42x 5.685% 1.45 - 1.49 $ 29,400,000 75.0% 74.8% 119 1.46x 5.665% 1.50 - 1.54 $ 221,250,000 67.0% 67.0% 108 1.51x 5.599% 1.55 - 1.59 $ 23,850,000 73.0% 71.1% 119 1.58x 5.715% 1.60 - 1.64 $ 16,200,000 64.1% 64.1% 105 1.62x 5.728% 1.65 - 1.69 $ 89,300,000 56.6% 56.3% 115 1.67x 5.772% 1.70 - 1.74 $ 60,000,000 54.5% 53.5% 123 1.74x 5.615% 1.75 - 1.79 $ 3,500,000 46.1% 35.6% 120 1.76x 5.960% 1.85 - 1.89 $ 10,550,000 55.4% 55.1% 87 1.87x 5.525% 1.95 - 1.99 $ 3,400,000 51.8% 50.1% 75 1.97x 6.013% 2.05 - 2.09 $ 1,994,000 54.9% 54.9% 116 2.05x 5.670% 2.10 - 2.14 $ 283,850,000 61.2% 61.2% 69 2.14x 5.660% 2.15 - 2.19 $ 2,095,000 55.1% 55.1% 116 2.15x 5.670% 2.30 - 2.60 $ 70,000,000 48.8% 48.0% 119 2.51x 5.512% - ------------------------- $ 414,000,000 71.4% 69.9% 103 1.45X 5.765% _________________________ * Certain of the Mortgage Loans reflect LTV Ratios that have been calculated on an "as-stabilized" basis, or that have DSC Ratios that have been adjusted to take into account certain cash reserves or letters of credit. See "Additional Mortgage Loan Information" herein. Also see "DESCRIPTION OF THE MORTGAGE POOL--Additional Mortgage Loan Information" and "RISK FACTORS--Risks Relating to Net Cash Flow" and "-- Inspections and Appraisals May Not Accurately Reflect Value or Condition of Mortgaged Property" in the Prospectus Supplement. B-11 WACHOVIA BANK COMMERCIAL MORTGAGE TRUST SERIES 2007-C32 ANNEX B RANGE OF UNDERWRITTEN DSC RATIOS FOR LOAN GROUP 1 MORTGAGE LOANS AS OF THE CUT-OFF DATE % OF AGGREGATE CUT-OFF AVERAGE NUMBER OF CUT-OFF DATE CUT-OFF RANGE OF UNDERWRITTEN MORTGAGE DATE GROUP 1 DATE DSC RATIOS (X) LOANS BALANCE BALANCE BALANCE - ------------------------------------------------------------------------------------ 1.08 - 1.09 1 $ 25,000,000 0.7% $ 25,000,000 1.10 - 1.14 1 27,000,000 0.8 $ 27,000,000 1.15 - 1.19 8 79,460,379 2.4 $ 9,932,547 1.20 - 1.24 19 402,170,266 11.9 $ 21,166,856 1.25 - 1.29 21 975,606,313 28.9 $ 46,457,443 1.30 - 1.34 12 164,722,770 4.9 $ 13,726,897 1.35 - 1.39 9 319,982,212 9.5 $ 35,553,579 1.40 - 1.44 8 145,330,000 4.3 $ 18,166,250 1.45 - 1.49 7 94,560,000 2.8 $ 13,508,571 1.50 - 1.54 4 439,350,000 13.0 $109,837,500 1.55 - 1.59 3 41,894,335 1.2 $ 13,964,778 1.60 - 1.64 2 20,500,000 0.6 $ 10,250,000 1.65 - 1.69 2 103,300,000 3.1 $ 51,650,000 1.70 - 1.74 2 73,530,000 2.2 $ 36,765,000 1.75 - 1.79 1 3,500,000 0.1 $ 3,500,000 1.85 - 1.89 4 20,211,000 0.6 $ 5,052,750 1.95 - 1.99 2 4,500,000 0.1 $ 2,250,000 2.05 - 2.09 1 1,994,000 0.1 $ 1,994,000 2.10 - 2.14 2 329,850,000 9.8 $164,925,000 2.15 - 2.19 1 2,095,000 0.1 $ 2,095,000 2.30 - 2.60 3 106,100,000 3.1 $ 35,366,667 - ------------------------- --------- --------------- --------- 113 $ 3,380,656,275 100.0% $ 29,917,312 ========= =============== ========= WTD. AVG. STATED MAXIMUM WTD. AVG. REMAINING WTD. AVG. CUT-OFF CUT-OFF WTD. AVG. TERM TO CUT-OFF WTD. AVG. RANGE OF UNDERWRITTEN DATE DATE LTV LTV RATIO MATURITY DATE DSC MORTGAGE DSC RATIOS (X) BALANCE RATIO * AT MATURITY * (MOS.) RATIO * RATE - ------------------------------------------------------------------------------------------------------------------ 1.08 - 1.09 $ 25,000,000 80.6% 80.6% 120 1.08x 5.700% 1.10 - 1.14 $ 27,000,000 75.0% 72.1% 118 1.12x 5.680% 1.15 - 1.19 $ 25,000,000 66.3% 61.3% 119 1.17x 5.707% 1.20 - 1.24 $ 75,040,500 77.2% 73.6% 117 1.21x 5.791% 1.25 - 1.29 $ 414,000,000 74.6% 72.8% 92 1.26x 5.931% 1.30 - 1.34 $ 47,000,000 73.7% 69.6% 119 1.31x 5.795% 1.35 - 1.39 $ 103,906,000 77.4% 75.0% 106 1.37x 5.841% 1.40 - 1.44 $ 36,750,000 78.6% 78.6% 108 1.42x 5.727% 1.45 - 1.49 $ 29,400,000 74.7% 74.5% 119 1.46x 5.661% 1.50 - 1.54 $ 221,250,000 66.1% 66.1% 107 1.52x 5.595% 1.55 - 1.59 $ 23,850,000 73.0% 71.1% 119 1.58x 5.715% 1.60 - 1.64 $ 16,200,000 64.1% 64.1% 105 1.62x 5.728% 1.65 - 1.69 $ 89,300,000 56.6% 56.3% 115 1.67x 5.772% 1.70 - 1.74 $ 60,000,000 53.7% 52.5% 123 1.74x 5.622% 1.75 - 1.79 $ 3,500,000 46.1% 35.6% 120 1.76x 5.960% 1.85 - 1.89 $ 10,550,000 55.4% 55.1% 87 1.87x 5.525% 1.95 - 1.99 $ 3,400,000 51.8% 50.1% 75 1.97x 6.013% 2.05 - 2.09 $ 1,994,000 54.9% 54.9% 116 2.05x 5.670% 2.10 - 2.14 $ 283,850,000 61.2% 61.2% 69 2.14x 5.660% 2.15 - 2.19 $ 2,095,000 55.1% 55.1% 116 2.15x 5.670% 2.30 - 2.60 $ 70,000,000 48.8% 48.0% 119 2.51x 5.512% - ------------------------- $ 414,000,000 70.7% 69.0% 102 1.47x 5.772% _________________________ * Certain of the Mortgage Loans reflect LTV Ratios that have been calculated on an "as-stabilized" basis, or that have DSC Ratios that have been adjusted to take into account certain cash reserves or letters of credit. See "Additional Mortgage Loan Information" herein. Also see "DESCRIPTION OF THE MORTGAGE POOL--Additional Mortgage Loan Information" and "RISK FACTORS--Risks Relating to Net Cash Flow" and "-- Inspections and Appraisals May Not Accurately Reflect Value or Condition of Mortgaged Property" in the Prospectus Supplement. B-12 WACHOVIA BANK COMMERCIAL MORTGAGE TRUST SERIES 2007-C32 ANNEX B RANGE OF UNDERWRITTEN DSC RATIOS FOR LOAN GROUP 2 MORTGAGE LOANS AS OF THE CUT-OFF DATE % OF AGGREGATE CUT-OFF AVERAGE NUMBER OF CUT-OFF DATE CUT-OFF RANGE OF UNDERWRITTEN MORTGAGE DATE GROUP 2 DATE DSC RATIOS (X) LOANS BALANCE BALANCE BALANCE - ------------------------------------------------------------------------------------ 1.15 - 1.19 3 $ 20,650,000 4.7% $ 6,883,333 1.20 - 1.24 6 71,650,000 16.2 $ 11,941,667 1.25 - 1.29 8 148,053,500 33.4 $ 18,506,688 1.30 - 1.34 2 27,955,000 6.3 $ 13,977,500 1.35 - 1.39 3 32,130,000 7.2 $ 10,710,000 1.40 - 1.44 4 96,098,294 21.7 $ 24,024,574 1.45 - 1.49 1 5,560,000 1.3 $ 5,560,000 1.50 - 1.54 1 33,700,000 7.6 $ 33,700,000 1.70 - 1.73 1 7,400,000 1.7 $ 7,400,000 - ------------------------- --------- --------------- --------- 29 $ 443,196,794 100.0% $ 15,282,648 ========= =============== ========= WTD. AVG. STATED MAXIMUM WTD. AVG. REMAINING WTD. AVG. CUT-OFF CUT-OFF WTD. AVG. TERM TO CUT-OFF WTD. AVG. RANGE OF UNDERWRITTEN DATE DATE LTV LTV RATIO MATURITY DATE DSC MORTGAGE DSC RATIOS (X) BALANCE RATIO * AT MATURITY * (MOS.) RATIO * RATE - ------------------------------------------------------------------------------------------------------------------ 1.15 - 1.19 $ 10,250,000 75.1% 66.4% 120 1.15x 5.739% 1.20 - 1.24 $ 26,000,000 77.6% 77.0% 104 1.20x 5.847% 1.25 - 1.29 $ 35,572,500 77.7% 76.8% 93 1.27x 5.740% 1.30 - 1.34 $ 19,875,000 75.3% 75.3% 118 1.32x 5.586% 1.35 - 1.39 $ 16,180,000 79.6% 79.6% 88 1.35x 5.713% 1.40 - 1.44 $ 40,000,000 76.9% 75.9% 112 1.42x 5.621% 1.45 - 1.49 $ 5,560,000 79.4% 79.4% 119 1.45x 5.740% 1.50 - 1.54 $ 33,700,000 79.3% 79.3% 119 1.50x 5.650% 1.70 - 1.73 $ 7,400,000 63.0% 63.0% 119 1.73x 5.550% - ------------------------- $ 40,000,000 77.3% 76.3% 104 1.32x 5.710% _________________________ * Certain of the Mortgage Loans reflect LTV Ratios that have been calculated on an "as-stabilized" basis, or that have DSC Ratios that have been adjusted to take into account certain cash reserves or letters of credit. See "Additional Mortgage Loan Information" herein. Also see "DESCRIPTION OF THE MORTGAGE POOL--Additional Mortgage Loan Information" and "RISK FACTORS--Risks Relating to Net Cash Flow" and "-- Inspections and Appraisals May Not Accurately Reflect Value or Condition of Mortgaged Property" in the Prospectus Supplement. B-13 WACHOVIA BANK COMMERCIAL MORTGAGE TRUST SERIES 2007-C32 ANNEX B RANGE OF LTV RATIOS FOR ALL MORTGAGE LOANS AS OF THE CUT-OFF DATE % OF AGGREGATE CUT-OFF AVERAGE NUMBER OF CUT-OFF DATE CUT-OFF RANGE OF CUT-OFF DATE MORTGAGE DATE POOL DATE LTV RATIOS (%) LOANS BALANCE BALANCE BALANCE - ------------------------------------------------------------------------------------ 24.77 - 40.00 3 $ 47,100,000 1.2% $ 15,700,000 40.01 - 50.00 5 57,500,000 1.5 $ 11,500,000 50.01 - 55.00 5 87,222,294 2.3 $ 17,444,459 55.01 - 60.00 10 239,743,000 6.3 $ 23,974,300 60.01 - 65.00 11 595,491,000 15.6 $ 54,135,545 65.01 - 70.00 10 357,563,424 9.4 $ 35,756,342 70.01 - 75.00 24 590,415,732 15.4 $ 24,600,655 75.01 - 80.00 68 1,708,597,620 44.7 $ 25,126,436 80.01 - 85.00 5 104,120,000 2.7 $ 20,824,000 85.01 - 88.05 1 36,100,000 0.9 $ 36,100,000 - ------------------------- --------- --------------- --------- 142 $ 3,823,853,069 100.0% $ 26,928,543 ========= =============== ========= WTD. AVG. STATED MAXIMUM WTD. AVG. REMAINING WTD. AVG. CUT-OFF CUT-OFF WTD. AVG. TERM TO CUT-OFF WTD. AVG. RANGE OF CUT-OFF DATE DATE DATE LTV LTV RATIO MATURITY DATE DSC MORTGAGE LTV RATIOS (%) BALANCE RATIO * AT MATURITY * (MOS.) RATIO * RATE - ------------------------------------------------------------------------------------------------------------------ 24.77 - 40.00 $ 35,000,000 32.4% 30.7% 118 2.26x 5.821% 40.01 - 50.00 $ 46,000,000 45.5% 44.1% 123 1.99x 5.706% 50.01 - 55.00 $ 60,000,000 52.7% 51.7% 113 1.73x 5.669% 55.01 - 60.00 $ 89,300,000 56.9% 56.3% 115 1.85x 5.621% 60.01 - 65.00 $ 283,850,000 63.7% 63.5% 91 1.80x 5.637% 65.01 - 70.00 $ 200,000,000 67.0% 65.9% 116 1.34x 5.794% 70.01 - 75.00 $ 140,000,000 72.7% 68.5% 108 1.32x 5.995% 75.01 - 80.00 $ 414,000,000 78.6% 77.1% 98 1.31x 5.741% 80.01 - 85.00 $ 38,000,000 81.2% 81.2% 110 1.22x 5.850% 85.01 - 88.05 $ 36,100,000 88.0% 88.0% 118 1.39x 5.970% - ------------------------- $ 414,000,000 71.4% 69.9% 103 1.45x 5.765% _________________________ * Certain of the Mortgage Loans reflect LTV Ratios that have been calculated on an "as-stabilized" basis, or that have DSC Ratios that have been adjusted to take into account certain cash reserves or letters of credit. See "Additional Mortgage Loan Information" herein. Also see "DESCRIPTION OF THE MORTGAGE POOL--Additional Mortgage Loan Information" and "RISK FACTORS--Risks Relating to Net Cash Flow" and "-- Inspections and Appraisals May Not Accurately Reflect Value or Condition of Mortgaged Property" in the Prospectus Supplement. B-14 WACHOVIA BANK COMMERCIAL MORTGAGE TRUST SERIES 2007-C32 ANNEX B RANGE OF LTV RATIOS FOR LOAN GROUP 1 MORTGAGE LOANS AS OF THE CUT-OFF DATE % OF AGGREGATE CUT-OFF AVERAGE NUMBER OF CUT-OFF DATE CUT-OFF RANGE OF CUT-OFF DATE MORTGAGE DATE GROUP 1 DATE LTV RATIOS (%) LOANS BALANCE BALANCE BALANCE - ------------------------------------------------------------------------------------ 24.77 - 40.00 3 $ 47,100,000 1.4% $ 15,700,000 40.01 - 50.00 5 57,500,000 1.7 $ 11,500,000 50.01 - 55.00 4 75,944,000 2.2 $ 18,986,000 55.01 - 60.00 10 239,743,000 7.1 $ 23,974,300 60.01 - 65.00 9 580,011,000 17.2 $ 64,445,667 65.01 - 70.00 10 357,563,424 10.6 $ 35,756,342 70.01 - 75.00 20 545,465,732 16.1 $ 27,273,287 75.01 - 80.00 48 1,373,929,120 40.6 $ 28,623,523 80.01 - 85.00 3 67,300,000 2.0 $ 22,433,333 85.01 - 88.05 1 36,100,000 1.1 $ 36,100,000 - ------------------------- --------- --------------- --------- 113 $ 3,380,656,275 100.0% $ 29,917,312 ========= =============== ========= WTD. AVG. STATED MAXIMUM WTD. AVG. REMAINING WTD. AVG. CUT-OFF CUT-OFF WTD. AVG. TERM TO CUT-OFF WTD. AVG. RANGE OF CUT-OFF DATE DATE DATE LTV LTV RATIO MATURITY DATE DSC MORTGAGE LTV RATIOS (%) BALANCE RATIO * AT MATURITY * (MOS.) RATIO * RATE - ------------------------------------------------------------------------------------------------------------------ 24.77 - 40.00 $ 35,000,000 32.4% 30.7% 118 2.26x 5.821% 40.01 - 50.00 $ 46,000,000 45.5% 44.1% 123 1.99x 5.706% 50.01 - 55.00 $ 60,000,000 52.6% 52.6% 112 1.77x 5.652% 55.01 - 60.00 $ 89,300,000 56.9% 56.3% 115 1.85x 5.621% 60.01 - 65.00 $ 283,850,000 63.7% 63.5% 91 1.80x 5.639% 65.01 - 70.00 $ 200,000,000 67.0% 65.9% 116 1.34x 5.794% 70.01 - 75.00 $ 140,000,000 72.7% 68.4% 109 1.33x 6.017% 75.01 - 80.00 $ 414,000,000 78.5% 76.8% 96 1.30x 5.750% 80.01 - 85.00 $ 38,000,000 81.8% 81.8% 115 1.19x 5.879% 85.01 - 88.05 $ 36,100,000 88.0% 88.0% 118 1.39x 5.970% - ------------------------- $ 414,000,000 70.7% 69.0% 102 1.47x 5.772% _________________________ * Certain of the Mortgage Loans reflect LTV Ratios that have been calculated on an "as-stabilized" basis, or that have DSC Ratios that have been adjusted to take into account certain cash reserves or letters of credit. See "Additional Mortgage Loan Information" herein. Also see "DESCRIPTION OF THE MORTGAGE POOL--Additional Mortgage Loan Information" and "RISK FACTORS--Risks Relating to Net Cash Flow" and "-- Inspections and Appraisals May Not Accurately Reflect Value or Condition of Mortgaged Property" in the Prospectus Supplement. B-15 WACHOVIA BANK COMMERCIAL MORTGAGE TRUST SERIES 2007-C32 ANNEX B RANGE OF LTV RATIOS FOR LOAN GROUP 2 MORTGAGE LOANS AS OF THE CUT-OFF DATE % OF AGGREGATE CUT-OFF AVERAGE NUMBER OF CUT-OFF DATE CUT-OFF RANGE OF CUT-OFF DATE MORTGAGE DATE GROUP 2 DATE LTV RATIOS (%) LOANS BALANCE BALANCE BALANCE - ------------------------------------------------------------------------------------ 53.71 - 55.00 1 $ 11,278,294 2.5% $ 11,278,294 60.01 - 65.00 2 15,480,000 3.5 $ 7,740,000 70.01 - 75.00 4 44,950,000 10.1 $ 11,237,500 75.01 - 80.00 20 334,668,500 75.5 $ 16,733,425 80.01 - 80.15 2 36,820,000 8.3 $ 18,410,000 - ------------------------- --------- --------------- --------- 29 $ 443,196,794 100.0% $ 15,282,648 ========= =============== ========= WTD. AVG. STATED MAXIMUM WTD. AVG. REMAINING WTD. AVG. CUT-OFF CUT-OFF WTD. AVG. TERM TO CUT-OFF WTD. AVG. RANGE OF CUT-OFF DATE DATE DATE LTV LTV RATIO MATURITY DATE DSC MORTGAGE LTV RATIOS (%) BALANCE RATIO * AT MATURITY * (MOS.) RATIO * RATE - ------------------------------------------------------------------------------------------------------------------ 53.71 - 55.00 $ 11,278,294 53.7% 45.3% 118 1.42x 5.780% 60.01 - 65.00 $ 8,080,000 63.6% 63.6% 119 1.52x 5.550% 70.01 - 75.00 $ 17,650,000 72.7% 70.1% 96 1.22x 5.725% 75.01 - 80.00 $ 40,000,000 79.0% 78.3% 104 1.33x 5.703% 80.01 - 80.15 $ 26,000,000 80.1% 80.1% 101 1.26x 5.797% - ------------------------- $ 40,000,000 77.3% 76.3% 104 1.32x 5.710% _________________________ * Certain of the Mortgage Loans reflect LTV Ratios that have been calculated on an "as-stabilized" basis, or that have DSC Ratios that have been adjusted to take into account certain cash reserves or letters of credit. See "Additional Mortgage Loan Information" herein. Also see "DESCRIPTION OF THE MORTGAGE POOL--Additional Mortgage Loan Information" and "RISK FACTORS--Risks Relating to Net Cash Flow" and "-- Inspections and Appraisals May Not Accurately Reflect Value or Condition of Mortgaged Property" in the Prospectus Supplement. B-16 WACHOVIA BANK COMMERCIAL MORTGAGE TRUST SERIES 2007-C32 ANNEX B RANGE OF LTV RATIOS FOR ALL MORTGAGE LOANS AS OF THE MATURITY DATE OR ANTICIPATED REPAYMENT DATE % OF AGGREGATE CUT-OFF AVERAGE NUMBER OF CUT-OFF DATE CUT-OFF RANGE OF MATURITY DATE MORTGAGE DATE POOL DATE OR ARD LTV RATIOS (%) LOANS BALANCE BALANCE BALANCE - ------------------------------------------------------------------------------------ 24.77 - 30.00 1 $ 11,000,000 0.3% $ 11,000,000 30.01 - 40.00 6 47,600,000 1.2 $ 7,933,333 40.01 - 50.00 4 63,141,718 1.7 $ 15,785,429 50.01 - 55.00 5 89,474,000 2.3 $ 17,894,800 55.01 - 60.00 14 261,647,188 6.8 $ 18,689,085 60.01 - 65.00 18 764,530,192 20.0 $ 42,473,900 65.01 - 70.00 26 682,331,471 17.8 $ 26,243,518 70.01 - 75.00 15 302,040,000 7.9 $ 20,136,000 75.01 - 80.00 47 1,461,868,500 38.2 $ 31,103,585 80.01 - 85.00 5 104,120,000 2.7 $ 20,824,000 85.01 - 88.05 1 36,100,000 0.9 $ 36,100,000 - ------------------------- --------- --------------- --------- 142 $ 3,823,853,069 100.0% $ 26,928,543 ========= =============== ========= WTD. AVG. STATED MAXIMUM WTD. AVG. REMAINING WTD. AVG. CUT-OFF CUT-OFF WTD. AVG. TERM TO CUT-OFF WTD. AVG. RANGE OF MATURITY DATE DATE DATE LTV LTV RATIO MATURITY DATE DSC MORTGAGE OR ARD LTV RATIOS (%) BALANCE RATIO * AT MATURITY * (MOS.) RATIO * RATE - ------------------------------------------------------------------------------------------------------------------ 24.77 - 30.00 $ 11,000,000 24.8% 24.8% 119 1.15x 5.550% 30.01 - 40.00 $ 35,000,000 37.1% 33.7% 118 2.34x 5.914% 40.01 - 50.00 $ 46,000,000 49.1% 45.5% 122 1.92x 5.701% 50.01 - 55.00 $ 60,000,000 53.3% 52.4% 113 1.77x 5.632% 55.01 - 60.00 $ 89,300,000 58.5% 56.8% 116 1.78x 5.716% 60.01 - 65.00 $ 283,850,000 65.6% 63.5% 98 1.68x 5.789% 65.01 - 70.00 $ 200,000,000 71.7% 67.2% 117 1.31x 5.808% 70.01 - 75.00 $ 95,000,000 73.6% 72.5% 97 1.33x 5.776% 75.01 - 80.00 $ 414,000,000 78.6% 78.6% 94 1.32x 5.736% 80.01 - 85.00 $ 38,000,000 81.2% 81.2% 110 1.22x 5.850% 85.01 - 88.05 $ 36,100,000 88.0% 88.0% 118 1.39x 5.970% - ------------------------- $ 414,000,000 71.4% 69.9% 103 1.45x 5.765% _________________________ * Certain of the Mortgage Loans reflect LTV Ratios that have been calculated on an "as-stabilized" basis, or that have DSC Ratios that have been adjusted to take into account certain cash reserves or letters of credit. See "Additional Mortgage Loan Information" herein. Also see "DESCRIPTION OF THE MORTGAGE POOL--Additional Mortgage Loan Information" and "RISK FACTORS--Risks Relating to Net Cash Flow" and "-- Inspections and Appraisals May Not Accurately Reflect Value or Condition of Mortgaged Property" in the Prospectus Supplement. B-17 WACHOVIA BANK COMMERCIAL MORTGAGE TRUST SERIES 2007-C32 ANNEX B RANGE OF LTV RATIOS FOR LOAN GROUP 1 MORTGAGE LOANS AS OF THE MATURITY DATE OR ANTICIPATED REPAYMENT DATE % OF AGGREGATE CUT-OFF AVERAGE NUMBER OF CUT-OFF DATE CUT-OFF RANGE OF MATURITY DATE MORTGAGE DATE GROUP 1 DATE OR ARD LTV RATIOS (%) LOANS BALANCE BALANCE BALANCE - ------------------------------------------------------------------------------------ 24.77 - 30.00 1 $ 11,000,000 0.3% $ 11,000,000 30.01 - 40.00 6 47,600,000 1.4 $ 7,933,333 40.01 - 50.00 3 51,863,424 1.5 $ 17,287,808 50.01 - 55.00 5 89,474,000 2.6 $ 17,894,800 55.01 - 60.00 14 261,647,188 7.7 $ 18,689,085 60.01 - 65.00 16 749,050,192 22.2 $ 46,815,637 65.01 - 70.00 22 649,231,471 19.2 $ 29,510,521 70.01 - 75.00 11 262,290,000 7.8 $ 23,844,545 75.01 - 80.00 31 1,155,100,000 34.2 $ 37,261,290 80.01 - 85.00 3 67,300,000 2.0 $ 22,433,333 85.01 - 88.05 1 36,100,000 1.1 $ 36,100,000 - ------------------------- --------- --------------- --------- 113 $ 3,380,656,275 100.0% $ 29,917,312 ========= =============== ========= WTD. AVG. STATED MAXIMUM WTD. AVG. REMAINING WTD. AVG. CUT-OFF CUT-OFF WTD. AVG. TERM TO CUT-OFF WTD. AVG. RANGE OF MATURITY DATE DATE DATE LTV LTV RATIO MATURITY DATE DSC MORTGAGE OR ARD LTV RATIOS (%) BALANCE RATIO * AT MATURITY * (MOS.) RATIO * RATE - ------------------------------------------------------------------------------------------------------------------ 24.77 - 30.00 $ 11,000,000 24.8% 24.8% 119 1.15x 5.550% 30.01 - 40.00 $ 35,000,000 37.1% 33.7% 118 2.34x 5.914% 40.01 - 50.00 $ 46,000,000 48.1% 45.5% 123 2.02x 5.684% 50.01 - 55.00 $ 60,000,000 53.3% 52.4% 113 1.77x 5.632% 55.01 - 60.00 $ 89,300,000 58.5% 56.8% 116 1.78x 5.716% 60.01 - 65.00 $ 283,850,000 65.6% 63.5% 97 1.68x 5.794% 65.01 - 70.00 $ 200,000,000 71.6% 67.2% 117 1.31x 5.822% 70.01 - 75.00 $ 95,000,000 73.3% 72.3% 97 1.35x 5.754% 75.01 - 80.00 $ 414,000,000 78.6% 78.5% 92 1.31x 5.746% 80.01 - 85.00 $ 38,000,000 81.8% 81.8% 115 1.19x 5.879% 85.01 - 88.05 $ 36,100,000 88.0% 88.0% 118 1.39x 5.970% - ------------------------- $ 414,000,000 70.7% 69.0% 102 1.47x 5.772% _________________________ * Certain of the Mortgage Loans reflect LTV Ratios that have been calculated on an "as-stabilized" basis, or that have DSC Ratios that have been adjusted to take into account certain cash reserves or letters of credit. See "Additional Mortgage Loan Information" herein. Also see "DESCRIPTION OF THE MORTGAGE POOL--Additional Mortgage Loan Information" and "RISK FACTORS--Risks Relating to Net Cash Flow" and "-- Inspections and Appraisals May Not Accurately Reflect Value or Condition of Mortgaged Property" in the Prospectus Supplement. B-18 WACHOVIA BANK COMMERCIAL MORTGAGE TRUST SERIES 2007-C32 ANNEX B RANGE OF LTV RATIOS FOR LOAN GROUP 2 MORTGAGE LOANS AS OF THE MATURITY DATE OR ANTICIPATED REPAYMENT DATE % OF AGGREGATE CUT-OFF AVERAGE NUMBER OF CUT-OFF DATE CUT-OFF RANGE OF MATURITY DATE MORTGAGE DATE GROUP 2 DATE OR ARD LTV RATIOS (%) LOANS BALANCE BALANCE BALANCE - ------------------------------------------------------------------------------------ 45.35 - 50.00 1 $ 11,278,294 2.5% $ 11,278,294 60.01 - 65.00 2 15,480,000 3.5 $ 7,740,000 65.01 - 70.00 4 33,100,000 7.5 $ 8,275,000 70.01 - 75.00 4 39,750,000 9.0 $ 9,937,500 75.01 - 80.00 16 306,768,500 69.2 $ 19,173,031 80.01 - 80.15 2 36,820,000 8.3 $ 18,410,000 - ------------------------- --------- --------------- --------- 29 $ 443,196,794 100.0% $ 15,282,648 ========= =============== ========= WTD. AVG. STATED MAXIMUM WTD. AVG. REMAINING WTD. AVG. CUT-OFF CUT-OFF WTD. AVG. TERM TO CUT-OFF WTD. AVG. RANGE OF MATURITY DATE DATE DATE LTV LTV RATIO MATURITY DATE DSC MORTGAGE OR ARD LTV RATIOS (%) BALANCE RATIO * AT MATURITY * (MOS.) RATIO * RATE - ------------------------------------------------------------------------------------------------------------------ 45.35 - 50.00 $ 11,278,294 53.7% 45.3% 118 1.42x 5.780% 60.01 - 65.00 $ 8,080,000 63.6% 63.6% 119 1.52x 5.550% 65.01 - 70.00 $ 12,450,000 75.0% 67.5% 120 1.21x 5.529% 70.01 - 75.00 $ 17,650,000 75.6% 73.2% 92 1.23x 5.918% 75.01 - 80.00 $ 40,000,000 78.9% 78.9% 103 1.34x 5.697% 80.01 - 80.15 $ 26,000,000 80.1% 80.1% 101 1.26x 5.797% - ------------------------- $ 40,000,000 77.3% 76.3% 104 1.32x 5.710% _________________________ * Certain of the Mortgage Loans reflect LTV Ratios that have been calculated on an "as-stabilized" basis, or that have DSC Ratios that have been adjusted to take into account certain cash reserves or letters of credit. See "Additional Mortgage Loan Information" herein. Also see "DESCRIPTION OF THE MORTGAGE POOL--Additional Mortgage Loan Information" and "RISK FACTORS--Risks Relating to Net Cash Flow" and "-- Inspections and Appraisals May Not Accurately Reflect Value or Condition of Mortgaged Property" in the Prospectus Supplement. B-19 WACHOVIA BANK COMMERCIAL MORTGAGE TRUST SERIES 2007-C32 ANNEX B RANGE OF MORTGAGE RATES FOR ALL MORTGAGE LOANS % OF AGGREGATE CUT-OFF AVERAGE NUMBER OF CUT-OFF DATE CUT-OFF RANGE OF MORTGAGE DATE POOL DATE MORTGAGE RATES (%) (1) LOANS BALANCE BALANCE BALANCE - ------------------------------------------------------------------------------------- 5.180 - 5.250 1 $ 12,450,000 0.3% $ 12,450,000 5.251 - 5.500 4 118,661,000 3.1 $ 29,665,250 5.501 - 5.750 60 1,796,448,027 47.0 $ 29,940,800 5.751 - 6.000 58 1,608,842,227 42.1 $ 27,738,659 6.001 - 6.250 12 111,115,335 2.9 $ 9,259,611 6.251 - 6.500 4 145,550,000 3.8 $ 36,387,500 6.501 - 6.750 2 17,850,000 0.5 $ 8,925,000 7.001 - 7.130 1 12,936,479 0.3 $ 12,936,479 - ----------------------- --------- --------------- ------- 142 $ 3,823,853,069 100.0% $ 26,928,543 ========= =============== ======= WTD. AVG. STATED MAXIMUM WTD. AVG. REMAINING WTD. AVG. CUT-OFF CUT-OFF WTD. AVG. TERM TO CUT-OFF WTD. AVG. RANGE OF DATE DATE LTV LTV RATIO MATURITY DATE DSC MORTGAGE MORTGAGE RATES (%) (1) BALANCE RATIO (2) AT MATURITY (2) (MOS.) RATIO (2) RATE - ------------------------------------------------------------------------------------------------------------------ 5.180 - 5.250 $ 12,450,000 75.0% 69.4% 120 1.29x 5.180% 5.251 - 5.500 $ 70,000,000 64.6% 64.6% 120 2.07x 5.378% 5.501 - 5.750 $ 283,850,000 68.8% 67.7% 104 1.55x 5.633% 5.751 - 6.000 $ 414,000,000 74.8% 73.6% 98 1.33x 5.848% 6.001 - 6.250 $ 29,500,000 73.0% 68.4% 98 1.32x 6.092% 6.251 - 6.500 $ 140,000,000 71.5% 63.2% 120 1.25x 6.376% 6.501 - 6.750 $ 14,000,000 62.9% 61.4% 58 1.59x 6.580% 7.001 - 7.130 $ 12,936,479 73.9% 59.6% 116 1.25x 7.130% - ----------------------- $ 414,000,000 71.4% 69.9% 103 1.45x 5.765% __________________ (1) The interest rate with respect to 1 Mortgage Loan (loan number 35), representing 0.7% of the Cut-Off Date Pool Balance may vary during the term of the related Mortgage Loan. For purposes of the table above as well as calculations throughout the Prospectus Supplement, the mortgage rate was assumed to be the average mortgage rate over the term of the related Mortgage Loan. See "DESCRIPTION OF THE MORTGAGE POOL-Additional Mortgage Loan Information in the Prospectus Supplement. (2) Certain of the Mortgage Loans reflect LTV Ratios that have been calculated on an "as-stabilized" basis, or that have DSC Ratios that have been adjusted to take into account certain cash reserves or letters of credit. See "Additional Mortgage Loan Information" herein. Also see "DESCRIPTION OF THE MORTGAGE POOL-Additional Mortgage Loan Information" and "RISK FACTORS-Risks Relating to Net Cash Flow" and "- Inspections and Appraisals May Not Accurately Reflect Value or Condition of Mortgaged Property" in the Prospectus Supplement. B-20 WACHOVIA BANK COMMERCIAL MORTGAGE TRUST SERIES 2007-C32 ANNEX B RANGE OF MORTGAGE RATES FOR LOAN GROUP 1 MORTGAGE LOANS % OF AGGREGATE CUT-OFF AVERAGE NUMBER OF CUT-OFF DATE CUT-OFF RANGE OF MORTGAGE DATE GROUP 1 DATE MORTGAGE RATES (%) (1) LOANS BALANCE BALANCE BALANCE - ------------------------------------------------------------------------------------- 5.310 - 5.500 3 $ 78,661,000 2.3% $ 26,220,333 5.501 - 5.750 44 1,597,377,027 47.3 $ 36,304,023 5.751 - 6.000 49 1,438,516,433 42.6 $ 29,357,478 6.001 - 6.250 10 89,765,335 2.7 $ 8,976,533 6.251 - 6.500 4 145,550,000 4.3 $ 36,387,500 6.501 - 6.750 2 17,850,000 0.5 $ 8,925,000 7.001 - 7.130 1 12,936,479 0.4 $ 12,936,479 - ----------------------- --------- --------------- ------- 113 $ 3,380,656,275 100.0% $ 29,917,312 ========= =============== ======= WTD. AVG. STATED MAXIMUM WTD. AVG. REMAINING WTD. AVG. CUT-OFF CUT-OFF WTD. AVG. TERM TO CUT-OFF WTD. AVG. RANGE OF DATE DATE LTV LTV RATIO MATURITY DATE DSC MORTGAGE MORTGAGE RATES (%) (1) BALANCE RATIO (2) AT MATURITY (2) (MOS.) RATIO (2) RATE - ------------------------------------------------------------------------------------------------------------------ 5.310 - 5.500 $ 70,000,000 56.7% 56.7% 120 2.40x 5.326% 5.501 - 5.750 $ 283,850,000 67.7% 66.6% 103 1.57x 5.630% 5.751 - 6.000 $ 414,000,000 74.6% 73.3% 100 1.33x 5.852% 6.001 - 6.250 $ 29,500,000 72.9% 67.7% 105 1.35x 6.082% 6.251 - 6.500 $ 140,000,000 71.5% 63.2% 120 1.25x 6.376% 6.501 - 6.750 $ 14,000,000 62.9% 61.4% 58 1.59x 6.580% 7.001 - 7.130 $ 12,936,479 73.9% 59.6% 116 1.25x 7.130% - ----------------------- $ 414,000,000 70.7% 69.0% 102 1.47x 5.772% __________________ (1) The interest rate with respect to 1 Mortgage Loan (loan number 35), representing 0.8% of the Cut-Off Date Group 1 Balance may vary during the term of the related Mortgage Loan. For purposes of the table above as well as calculations throughout the Prospectus Supplement, the mortgage rate was assumed to be the average mortgage rate over the term of the related Mortgage Loan. See "DESCRIPTION OF THE MORTGAGE POOL-Additional Mortgage Loan Information in the Prospectus Supplement. (2) Certain of the Mortgage Loans reflect LTV Ratios that have been calculated on an "as-stabilized" basis, or that have DSC Ratios that have been adjusted to take into account certain cash reserves or letters of credit. See "Additional Mortgage Loan Information" herein. Also see "DESCRIPTION OF THE MORTGAGE POOL-Additional Mortgage Loan Information" and "RISK FACTORS-Risks Relating to Net Cash Flow" and "- Inspections and Appraisals May Not Accurately Reflect Value or Condition of Mortgaged Property" in the Prospectus Supplement. B-21 WACHOVIA BANK COMMERCIAL MORTGAGE TRUST SERIES 2007-C32 ANNEX B RANGE OF MORTGAGE RATES FOR LOAN GROUP 2 MORTGAGE LOANS % OF AGGREGATE CUT-OFF AVERAGE NUMBER OF CUT-OFF DATE CUT-OFF RANGE OF MORTGAGE DATE GROUP 2 DATE MORTGAGE RATES (%) * LOANS BALANCE BALANCE BALANCE - ------------------------------------------------------------------------------------- 5.180 - 5.250 1 $ 12,450,000 2.8% $ 12,450,000 5.251 - 5.500 1 40,000,000 9.0 $ 40,000,000 5.501 - 5.750 16 199,071,000 44.9 $ 12,441,938 5.751 - 6.000 9 170,325,794 38.4 $ 18,925,088 6.001 - 6.150 2 21,350,000 4.8 $ 10,675,000 - ----------------------- --------- --------------- ------- 29 $ 443,196,794 100.0% $ 15,282,648 ========= =============== ======= WTD. AVG. STATED MAXIMUM WTD. AVG. REMAINING WTD. AVG. CUT-OFF CUT-OFF WTD. AVG. TERM TO CUT-OFF WTD. AVG. RANGE OF DATE DATE LTV LTV RATIO MATURITY DATE DSC MORTGAGE MORTGAGE RATES (%) * BALANCE RATIO * AT MATURITY * (MOS.) RATIO * RATE - ------------------------------------------------------------------------------------------------------------------ 5.180 - 5.250 $ 12,450,000 75.0% 69.4% 120 1.29x 5.180% 5.251 - 5.500 $ 40,000,000 80.0% 80.0% 119 1.42x 5.480% 5.501 - 5.750 $ 34,000,000 77.8% 76.6% 119 1.36x 5.658% 5.751 - 6.000 $ 35,572,500 76.6% 76.1% 87 1.28x 5.809% 6.001 - 6.150 $ 17,650,000 73.3% 71.3% 70 1.19x 6.134% - ----------------------- $ 40,000,000 77.3% 76.3% 104 1.32x 5.710% __________________ * Certain of the Mortgage Loans reflect LTV Ratios that have been calculated on an "as-stabilized" basis, or that have DSC Ratios that have been adjusted to take into account certain cash reserves or letters of credit. See "Additional Mortgage Loan Information" herein. Also see "DESCRIPTION OF THE MORTGAGE POOL-Additional Mortgage Loan Information" and "RISK FACTORS-Risks Relating to Net Cash Flow" and "- Inspections and Appraisals May Not Accurately Reflect Value or Condition of Mortgaged Property" in the Prospectus Supplement. B-22 WACHOVIA BANK COMMERCIAL MORTGAGE TRUST SERIES 2007-C32 ANNEX B RANGE OF ORIGINAL TERMS TO MATURITY OR ANTICIPATED REPAYMENT DATE FOR ALL MORTGAGE LOANS % OF AGGREGATE CUT-OFF AVERAGE RANGE OF ORIGINAL TERMS TO NUMBER OF CUT-OFF DATE CUT-OFF MATURITY OR ANTICIPATED MORTGAGE DATE POOL DATE REPAYMENT DATE (MONTHS) LOANS BALANCE BALANCE BALANCE - ------------------------------------------------------------------------------------- 60 - 60 18 $ 1,059,697,500 27.7% $ 58,872,083 61 - 84 1 14,750,000 0.4 $ 14,750,000 109 - 120 120 2,554,105,569 66.8 $ 21,284,213 121 - 126 3 195,300,000 5.1 $ 65,100,000 - ----------------------- --------- --------------- ------- 142 $ 3,823,853,069 100.0% $ 26,928,543 ========= =============== ======= WTD. AVG. STATED MAXIMUM WTD. AVG. REMAINING WTD. AVG. RANGE OF ORIGINAL TERMS TO CUT-OFF CUT-OFF WTD. AVG. TERM TO CUT-OFF WTD. AVG. MATURITY OR ANTICIPATED DATE DATE LTV LTV RATIO MATURITY DATE DSC MORTGAGE REPAYMENT DATE (MONTHS) BALANCE RATIO * AT MATURITY * (MOS.) RATIO * RATE - ------------------------------------------------------------------------------------------------------------------ 60 - 60 $ 414,000,000 72.9% 72.9% 59 1.55x 5.765% 61 - 84 $ 14,750,000 56.7% 56.7% 83 1.21x 5.810% 109 - 120 $ 221,250,000 72.3% 70.0% 119 1.39x 5.774% 121 - 126 $ 89,300,000 52.6% 52.6% 124 1.79x 5.645% - ----------------------- $ 414,000,000 71.4% 69.9% 103 1.45x 5.765% __________________ * Certain of the Mortgage Loans reflect LTV Ratios that have been calculated on an "as-stabilized" basis, or that have DSC Ratios that have been adjusted to take into account certain cash reserves or letters of credit. See "Additional Mortgage Loan Information" herein. Also see "DESCRIPTION OF THE MORTGAGE POOL-Additional Mortgage Loan Information" and "RISK FACTORS-Risks Relating to Net Cash Flow" and "- Inspections and Appraisals May Not Accurately Reflect Value or Condition of Mortgaged Property" in the Prospectus Supplement. B-23 WACHOVIA BANK COMMERCIAL MORTGAGE TRUST SERIES 2007-C32 ANNEX B