Exhibit 99.1
Legend:
Certain parts of this document have not been disclosed and have been filed separately with the Secretary of the Securities and Exchange Commission, and are subject to a confidential treatment request pursuant to Rule 406 of the Securities Exchange Act of 1933. These sections have been marked with asterisks (ie. "********"). For following information has been removed:
| Terms or Type of Term(s) | Section: | |
1. | Identity information/Location of well. | Pages 16, 17, 23, 24, 25, 27, 28, 29, and 31. |
RESERVE AND ECONOMIC EVALUATION
AND RESOURCES ASSESSMENT
OIL PROPERTIES
SASKATCHEWAN
Prepared For
FALCONRIDGE OIL LTD.
January 1, 2013
(December 31, 2012)
1
April 23, 2014
Falconridge Oil Ltd.
17-120 West Beaver Creek
Richmond Hill, Ontario, Canada
L4B 1L2
Attention: Mr. Al Morra
Dear Sir:
| Re: | Reserve and Economic Evaluation – Falconridge Oil Ltd. |
| Five Hills, Saskatchewan – January 1, 2013 |
In accordance with your authorization we have prepared a reserve and economic evaluation of oil properties located in Five Hills, Saskatchewan owned by Falconridge Oil Ltd. (the "Company") for an effective date of January 1, 2013 (as of December 31, 2012).
This evaluation has been carried out in accordance with the guidelines of Regulation S-X, Rule 4 -10 (a) of the Securities Exchange Act, with respect to the classification of Reserves. The report has been prepared and/or supervised by a "Qualified Reserves Evaluator" as demonstrated on the accompanying Certificate of Qualification of the author(s).
The SUMMARY OF RESERVES AND ECONOMICS includes values at the property level and the consolidated cash flows for each accumulating reserve category, and contains the results of the economic forecasts using pricing guidelines as defined in Regulation S-X 210.4-10 22 (v), and expressed in United States dollars, as applicable for SEC filing. The net present values presented in this report do not necessarily represent the fair market value of the reserves evaluated in this report.
At the request of the client, this report has been prepared in summary form only, excluding maps and discussions typical of a fully compliant report.
A REPRESENTATION LETTER from the Company, confirming that to the best of their knowledge all the information they provided for our use in the preparation of this report was complete and accurate as of the effective date, is enclosed following the Glossary.
Because the reserves data are based on judgments regarding future events, actual results will vary and the variations may be significant. We have no responsibility to update our report for events and circumstances which may have occurred since the preparation date of this report.
Prior to public disclosure of any information contained in this report, or our name as author, our written consent must be obtained, as to the information being disclosed and the manner in which it is presented. This report may not be reproduced, distributed or made available for use by any other party without our written consent and may not be reproduced for distribution at any time without the complete context of the report, unless otherwise reviewed and approved by us.
We consent to the submission of this report, in its entirety, to securities regulatory agencies and stock exchanges, by the Company.
2
It has been a pleasure to prepare this report and the opportunity to have been of service is appreciated.
Yours very truly,
Chapman Petroleum Engineering Ltd.
| [Original Signed By:] | PERMIT TO PRACTICE CHAPMAN PETROLEUM ENGINEERING LTD. | |
| C.W. Chapman | Signature [Original Signed By:] C.W. Chapman | |
| Date April 28, 2014 | ||
C.W. Chapman P.Eng., President | PERMIT NUMBER: P 4201 The Association of Professional Engineers and Geoscientists of Alberta | |
[Original Signed By:]
Wei Guo Wang
Wei Guo Wang, P.Eng., CGA, MA, MBA, B.Sc
Project Economist (Economics Coordinator)
wgw/lml/5966
3
CERTIFICATE OF QUALIFICATION
I, C. W. CHAPMAN, P. Eng., Professional Engineer of the City of Calgary, Alberta, Canada, officing at Suite 445, 708 – 11th Avenue S.W., hereby certify:
| 1. | THAT I am a registered Professional Engineer in the Province of Alberta and a member of the Australasian Institute of Mining and Metallurgy. |
| 2. | THAT I graduated from the University of Alberta with a Bachelor of Science degree in Mechanical Engineering in 1971. |
| 3. | THAT I have been employed in the petroleum industry since graduation by various companies and have been directly involved in reservoir engineering, petrophysics, operations, and evaluations during that time. |
| 4. | THAT I have in excess of 25 years in the conduct of evaluation and engineering studies relating to oil & gas fields in Canada and around the world. |
| 5. | THAT I participated directly in the evaluation of these assets and properties and preparation of this report for Falconridge Oil Ltd, dated April 23, 2014 and the parameters and conditions employed in this evaluation were examined by me and adopted as representative and appropriate in establishing the value of these oil and gas properties according to the information available to date. |
| 6. | THAT I have not, nor do I expect to receive, any direct or indirect interest in the properties or securities of Falconridge Oil Ltd, its participants or any affiliate thereof. |
| 7. | THAT I have not examined all of the documents pertaining to the ownership and agreements referred to in this report, or the chain of Title for the oil and gas properties discussed. |
| 8. | A personal field examination of these properties was considered to be unnecessary because the data available from the Company's records and public sources was satisfactory for our purposes. |
| [Original Signed By:] | PERMIT TO PRACTICE CHAPMAN PETROLEUM ENGINEERING LTD. | |
| C.W. Chapman | Signature [Original Signed By:] C.W. Chapman | |
| Date April 28, 2014 | ||
C.W. Chapman P.Eng., President | PERMIT NUMBER: P 4201 The Association of Professional Engineers and Geoscientists of Alberta | |
4
CERTIFICATE OF QUALIFICATION
I, WEI GUO WANG, P.Eng., CGA, Professional Engineer and Certified General Accountant of the City of Calgary, Alberta, Canada, office at Suite 445, 708 – 11th Avenue S.W., hereby certify:
| 1. | THAT I am a Registered Professional Engineer in the Province of Alberta. |
| 2. | THAT I am a Certified General Accountant in the Province of Alberta. |
| 2. | THAT I graduated from the University of Calgary with a Master of Arts degree in Economics in 2005 and a Bachelor of Science degree in Chemical Engineering from Hefei University of Technology of China in 1985. |
| 3. | THAT I have been employed in the petroleum industry since 2002. |
| 4. | THAT I participated directly in the evaluation of these assets and properties and preparation of this report for Falconridge Oil Ltd, dated April 23, 2014 and the parameters and conditions employed in this evaluation were examined by me and adopted as representative and appropriate in establishing the value of these oil and gas properties according to the information available to date. |
| 5. | THAT I have not, nor do I expect to receive, any direct or indirect interest in the properties or securities of Falconridge Oil Ltd, its participants or any affiliate thereof. |
| 6. | THAT I have not examined all of the documents pertaining to the ownership and agreements referred to in this report, or the chain of Title for the oil and gas properties discussed. |
| 7. | A personal field examination of these properties was considered to be unnecessary because the data available from the Company’s records and public sources was satisfactory for our purposes. |
[Original Signed By:]
Wei Guo Wang
Wei Guo Wang, P.Eng., CGA, MA, MBA, B.Sc
Project Economist (Economics Coordinator)
5
CERTIFICATE OF QUALIFICATION
I, CHARLES G.K. MOORE, P. Eng., Professional Engineer of the City of Calgary, Alberta, Canada, officing at Suite 445, 708 - 11th Avenue S.W., hereby certify:
| 1. | THAT I am a registered Professional Engineer in the Province of Alberta. |
| 2. | THAT I graduated from the Technical University of Nova Scotia with a Bachelor of Engineering degree in Mining Engineering in 1972. |
| 3. | THAT I have been employed in the petroleum industry since graduation by various companies and have been directly involved in reservoir engineering, petrophysics, operations, and evaluations during that time. |
| 4. | THAT I have in excess of 10 years of experience in the conduct of evaluation and engineering studies relating to oil and gas fields in Canada and internationally. |
| 5. | THAT I participated directly in the evaluation of these assets and properties and preparation of this | report for Falconridge Oil Ltd., dated April 23, 2014 and the parameters and conditions employed in this evaluation were examined by me and adopted as representative and appropriate in establishing the value of these oil and gas properties according to the information available to date. |
| 6. | THAT I have not, nor do I expect to receive, any direct or indirect interest in the properties or securities of Falconridge Oil Ltd., its participants or any affiliate thereof. |
| 7. | THAT I have not examined all of the documents pertaining to the ownership and agreements referred to in this report, or the chain of Title for the oil and gas properties discussed. |
| 8. | A personal field examination of these properties was considered to be unnecessary because the data | available from the Company's records and public sources was satisfactory for our purposes. |
[Original Signed By:]
Charles G.K. Moore
Charles G.K. Moore, P.Eng.,
Associate
6
RESERVE AND ECONOMIC EVALUATION
AND RESOURCE ASSESSMENT
OIL PROPERTIES
SASKATCHEWAN
Prepared For
ADMIRAL TY OILS LTD.
January 1, 2013
(December 31, 2012)
7
TABLE OF CONTENTS
Scope of Report
Authorization
Purpose
Definitions
Barrels of Oil Equivalent
Sources of Information
Product Prices
Product Sales Arrangements
Capital Expenditures and Operating Costs
Income Tax Parameters
Abandonment and Restoration
Economics
Constant Price Parameters
Attachment 1 - Product Price Forecast
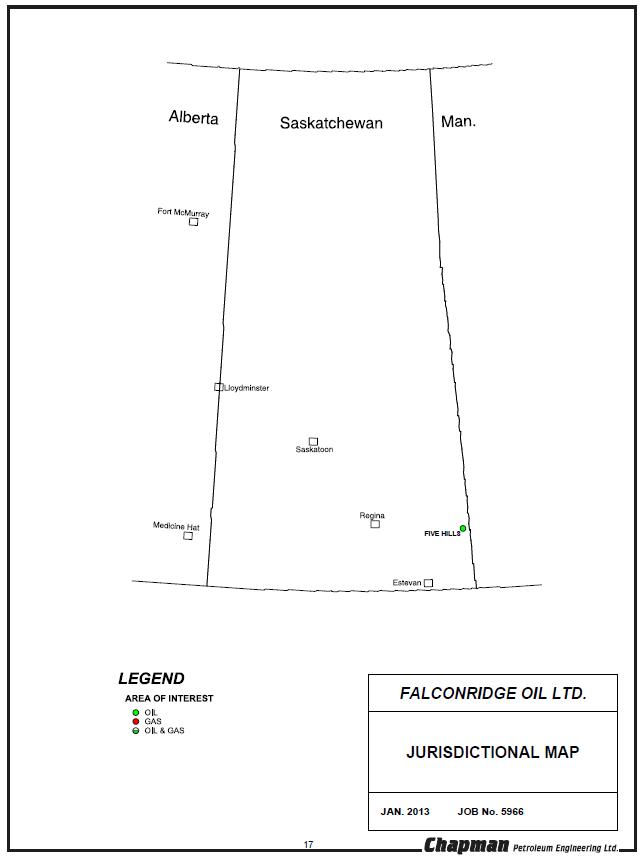
Jurisdictional Map
Discussion
SASKATCHEWAN
Five Hills
Glossary
Company Representation Letter
8
SCOPE OF REPORT
Authorization
This evaluation has been authorized by Mr. Al Morra, on behalf of Falconridge Oil Ltd. The engineering analysis has been performed over the month of April 2013.
Purpose
The purpose of this report was to prepare a third party independent appraisal of the oil and gas reserves owned by Falconridge Oil Ltd. for the Company's financial planning and reporting.
The values in this report do not include the value of the Company's undeveloped land holdings nor the tangible value of their interest in associated plant and well site facilities they may own. The cash flow forecasts account for well and/or facility abandonment and reclamation costs and the offsetting salvage value of the tangible equipment after abandonment.
Reserve Definitions
Proved and probable reserves as classified in the report have been based on Rule 4-10(a) of
Regulation S-X of the Securities Exchange Act:
Classification of Reserves
Proved Oil and Gas Reserves.
Proved oil and gas reserves are those quantities of oil and gas, which, by analysis of geoscience and engineering data, can be estimated with reasonable certainty to be economically producible-from a given date forward, from known reservoirs, and under existing economic conditions, operating methods, and government regulations-prior to the time at which contracts providing the right to operate expire, unless evidence indicates that renewal is reasonably certain, regardless of whether deterministic or probabilistic methods are used for the estimation.
The project to extract the hydrocarbons must have commenced or the operator must be reasonably certain that it will commence the project within a reasonable time.
| (i) | The area of the reservoir considered as proved includes: |
(A) The area identified by drilling and limited by fluid contacts, if any, and
(B) Adjacent undrilled portions of the reservoir that can, with reasonable certainty, be judged to be continuous with it and to contain economically producible oil or gas on the basis of available geoscience and engineering data.
| (ii) | In the absence of data on fluid contacts, proved quantities in a reservoir are limited by the lowest known hydrocarbons (LKH) as seen in a well penetration unless geoscience, engineering, or performance data and reliable technology establishes a lower contact with reasonable certainty. |
9
| (iii) | Where direct observation from well penetrations has defined a highest known oil (HKO) elevation and the potential exists for an associated gas cap, proved oil reserves may be assigned in the structurally higher portions of the reservoir only if geoscience, engineering, or performance data and reliable technology establish the higher contact with reasonable certainty. |
| (iv) | Reserves which can be produced economically through application of improved recovery techniques (including, but not limited to, fluid injection) are included in the proved classification when: |
(A) Successful testing by a pilot project in an area of the reservoir with properties no more favorable than in the reservoir as a whole, the operation of an installed program in the reservoir or an analogous reservoir, or other evidence using reliable technology establishes the reasonable certainty of the engineering analysis on which the project or program was based; and
(B) The project has been approved for development by all necessary parties and entities, including governmental entities.
| (v) | Existing economic conditions include prices and costs at which economic producibility from a reservoir is to be determined. The price shall be the average price during the 12-month period prior to the ending date of the period covered by the report, determined as an unweighted arithmetic average of the first-day-of-the-month price for each month within such period, unless prices are defined by contractual arrangement, excluding escalations based upon future conditions. |
Probable Reserves
Probable reserves are those additional reserves that are less certain to be recovered than proved reserves but which, together with proved reserves, are as likely as not to be recovered.
| (i) | When deterministic methods are used, it is as likely as not that actual remaining quantities recovered will exceed the sum of estimated proved plus probable reserves. When probabilistic methods are used, there should be at least a 50% probability that the actual quantities recovered will equal or exceed the proved plus probable reserves estimates. |
| (ii) | Probable reserves may be assigned to areas of a reservoir adjacent to proved reserves where data control or interpretations of available data are less certain, even if the interpreted reservoir continuity of structure or productivity does not meet the reasonable certainty criterion. Probable reserves may be assigned to areas that are structurally higher than the proved area if these areas are in communication with the proved reservoir. |
| (iii) | Probable reserves estimates also include potential incremental quantities associated with a greater percentage recovery of the hydrocarbons in place than assumed for proved reserves. |
Possible Reserves
Possible reserves are those additional reserves that are less certain to be recovered than probable reserves.
10
| (i) | When deterministic methods are used, the total quantities ultimately recovered from a project have a low probability of exceeding proved plus probable plus possible reserves. When probabilistic methods are used, there should be at least a 10% probability that the total quantities ultimately recovered will equal or exceed the proved plus probable plus possible reserves estimates. |
| (ii) | Possible reserves may be assigned to areas of a reservoir adjacent to probable reserves where data control and interpretations of available data are progressively less certain. |
Frequently, this will be in areas where geoscience and engineering data are unable to define clearly the area and vertical limits of commercial production from the reservoir by a defined project.
| (iii) | Possible reserves also include incremental quantities associated with a greater percentage recovery of the hydrocarbons in place than the recovery quantities assumed for probable reserves. |
| (iv) | The proved plus probable and proved plus probable plus possible reserves estimates must be based on reasonable alternative technical and commercial interpretations within the reservoir or subject project that are clearly documented, including comparisons to results in successful similar projects. |
| (v) | Possible reserves may be assigned where geoscience and engineering data identify directly adjacent portions of a reservoir within the same accumulation that may be separated from proved areas by faults with displacement less than formation thickness or other geological discontinuities and that have not been penetrated by a wellbore, and the registrant believes that such adjacent portions are in communication with the known (proved) reservoir. |
Possible reserves may be assigned to areas that are structurally higher or lower than the proved area if these areas are in communication with the proved reservoir.
| (vi) | Pursuant to paragraph (a)(22)(iii) of this section, where direct observation has defined a highest known oil (HKO) elevation and the potential exists for an associated gas cap, proved oil reserves should be assigned in the structurally higher portions of the reservoir above the |
HKO only if the higher contact can be established with reasonable certainty through reliable technology. Portions of the reservoir that do not meet this reasonable certainty criterion may be assigned as probable and possible oil or gas based on reservoir fluid properties and pressure gradient interpretations.
Barrel of Oil Equivalent
If at any time in this report reference is made to "Barrels of Oil Equivalent" (BOE), the conversion used is 6 Mscf : 1 STB (6 Mcf : 1 bbl).
BOEs may be misleading, particularly if used in isolation. A BOE conversion ratio of 6 Mcf: 1 bbl is based on an energy equivalency conversion method primarily applicable at the burner tip and does not represent value equivalency at the well head.
Sources of Information
Source of the data used in the preparation of this report are as follows:
11
| i) | Ownership and Burdens have been derived from the Company's land records and other information from the Company as required for clarification |
| ii) | Production data is acquired from public data sources, except for very recent data or certain wells which are provided directly by the Company |
iii) Well data is accessed from the Company's well files and from public data sources
| iv) | Operating Costs are based on actual revenue and expense statements provided by the Company for established properties or from discussions with the Company and our experience in the area for new properties |
| v) | Price differentials are derived from revenue statements, compared to actual posted prices for the appropriate benchmark price over a period of several months |
| vi) | Timing of Development Plans and Capital estimates are normally determined by discussions with the Company together with our experience and judgement |
Product Prices
The price used for each area in this report, in accordance with SEC regulation S-X rule 4-10, was the average price during the 12-month period prior to the ending date of the period covered by the report, determined as an unweighted arithmetic average of the first-day-of-the-month price for each month, within such period, unless prices are defined by contractual arrangements, excluding escalations based on future conditions.
Adjustments for crude quality, gas heating value and NGL trucking and fractionation have still been applied to the average prices to reflect actual prices being received. In addition, no escalation has been applied to either the capital expenditures or operating costs.
The average price shown in the cash flows may differ from year to year due to variations in the proportionate production volumes from each property relative to the total.
For the purpose of US Security Exchange Commission filing, the results of the Constant Prices and
Cost case for proved and probable reserves expressed in Canadian dollars are presented in the
Summary of Reserves and Economics (SEC} .
Products Sale Arrangements
The Company does not have any "hedge" contracts in place at this time.
Capital Expenditures and Operating Costs
Operating costs and capital expenditures have been based on historical experience and analogy where necessary and have not been escalated.
Income Tax Parameters
Net cash flows after consideration of corporate income tax have not been included in this report.
12
Abandonment and Restoration
Abandonment and restoration costs, net of salvage, have been included in the cash flows for the final event of any particular well. The abandonment cost does not impact the economic limit and is included in the final year of production automatically by ERGO. For marginal wells nearing the end of their economic life, these costs may result in a negative net present value.
In this report, the royalty interest owner is not responsible for abandonment and restoration costs..
Economics
The results of the before tax economic analysis, which are presented for each entity and property summary, are in a condensed form presented on one page for simplicity in analyzing the cash flows, however, if for any reason more extensive breakdown of the cash flow is required, a separate schedule can be provided showing the full derivation and breakdown of any or all of the columns on the summary page.
The economic presentation shows the gross property and company gross and net (before and after royalty) production of oil gas and each NGL product along with the product prices adjusted for oil quality and heating value of gas. Oil prices also include the deduction for trucking costs where applicable for royalty deductions.
The second level includes the revenues, royalties, operating costs, processing income, abandonment costs, capital and cash flow of the property. Operating costs are presented for the gross property and the company share, split between variable and fixed costs, and the effective cost per BOE.
Net revenues are presented annually and as a net back in $/BOE @ 6 Mscf/STB. Revenue from custom processing of oil or gas is presented separately.
The third level of data presents the cumulative cash flow values (present worth) for various discount rates. Also, the net cash flow breakdown is presented. The project profitability criteria are summarized on the bottom right of the page. These data are not relevant in the case of corporate evaluations but are useful in assessing individual capital projects.
Constant Price Parameters
The Constant Price values utilized in this report are the latest prices being received posted prices for oil by the Company.
Adjustments for crude quality, gas heating value and NGL trucking and fractionation have still been applied to the average prices to reflect actual prices being received. In addition, no escalation has been applied to either the capital expenditures or operating costs.
In the Constant Price cash flows the magnitude of the gross and net reserves will not change except where production forecasts have been truncated or extended due to economic limits being reached earlier or later in the life of the properties than in the forecast price case, and due to the impact of royalties which are price related.
The average price shown in the cash flows may differ from year to year due to variations in the proportionate production volumes from each property relative to the total.
13
Attachment 1
CHAPMAN PETROLEUM ENGINEERING LTD.
CRUDE OIL
HISTORICAL, CONSTANT, CURRENT AND FUTURE PRICES
January 1, 2013
| Date | WTI [1] $US/STB | AB Synthetic Crude Price [2] $CDN/STB | Western Canada Select [3] $CDN/STB | Sask. Light [4] $CDNISTB | Sask. Heavy [5] $CDN/STB | B.C. Light [6] $CDN/STB | Exchange Rate $US/$CON |
| HISTORICAL PRICES | |||||||
| 2001 | 25.98 | 39.66 | 25.41 | 35.57 | 31.84 | n/a | 0.65 |
| 2002 | 26.09 | 40.63 | 32.20 | 37.67 | 34.57 | n/a | 0.64 |
| 2003 | 30.84 | 43.57 | 32.65 | 40.13 | 37.64 | n/a | 0.72 |
| 2004 | 41.48 | 52.89 | 37.52 | 48.96 | 45.74 | n/a | 0.77 |
| 2005 | 56.62 | 69.16 | 43.25 | 62.04 | 56.53 | n/a | 0.83 |
| 2006 | 65.91 | 72.88 | 50.40 | 66.77 | 61.23 | n/a | 0.88 |
| 2007 | 72.35 | 75.57 | 53.17 | 71.42 | 64.55 | n/a | 0.94 |
| 2008 | 99.70 | 102.98 | 83.88 | 98.02 | 92.45 | n/a | 0.94 |
| 2009 | 61.64 | 76.77 | 53.04 | 72.56 | 64.37 | n/a | 0.88 |
| 2010 | 79.42 | 80.56 | 66.58 | 77.02 | 72.79 | n/a | 0.97 |
| 2011 | 95.03 | 102.45 | 77.43 | 92.42 | 83.44 | n/a | 1.01 |
| 2012 | 94.16 | 92.56 | 71.70 | 84.58 | 77.58 | n/a | 1.00 |
| CONSTANT PRICES (The first-day-of-the-month price for the preceding 12 months-SEC) | |||||||
| 95.02 | 94.43 | 72.93 | 86.29 | 79.84 | 92.07 | 1.00 | |
| FORECAST PRICES | |||||||
| 2013 | 90.00 | 90.00 | 69.30 | 81.90 | 74.53 | 87.75 | 1..0 |
| 201 | 91.00 | 93.00 | 71.61 | 84.63 | 77.01 | 90.68 | 1.00 |
| 2015 | 92.00 | 94.00 | 72.38 | 85.54 | 77.84 | 91.65 | 1.00 |
| 2016 | 96.00 | 98.00 | 75.46 | 89.18 | 81.15 | 95.55 | 1.00 |
| 2017 | 97.00 | 99.00 | 76.23 | 90.09 | 81.98 | 96.53 | 1.00 |
| 2018 | 98.00 | 100.00 | 77.00 | 91.00 | 82.81 | 97.50 | 1.00 |
| 2019 | 100.00 | 102.00 | 78.54 | 92.82 | 84.47 | 99.45 | 1.00 |
| 2020 | 100.00 | 102.00 | 78.54 | 92.82 | 84.47 | 99.45 | 1.00 |
| 2021 | 102.00 | 104.00 | 80.08 | 94.64 | 86.12 | 101.40 | 1.00 |
| 2022 | 104.04 | 106.04 | 81.65 | 96.50 | 87.81 | 103.39 | 1.00 |
| 2023 | 106.12 | 108.12 | 83.25 | 98.39 | 89.53 | 105.42 | 1.00 |
| 2024 | 108.24 | 110.24 | 84.89 | 100.32 | 91.29 | 107.49 | 1.00 |
| 2025 | 110.41 | 112.41 | 86.55 | 102.29 | 93.09 | 109.60 | 1.00 |
| 2026 | 112.62 | 114.62 | 88.25 | 104.30 | 94.91 | 111.75 | 1.00 |
| 2027 | 114.87 | 116.87 | 89.99 | 106.35 | 96.78 | 113.95 | 1.00 |
| 2028 | 117.17 | 119.17 | 91.76 | 108.44 | 98.68 | 116.19 | 1.00 |
| Constant thereafter | |||||||
| Notes: | [1] West Texas Intermediate quality (D2/S2) crude (40APl) landed in Cushing, Oklahoma. | ||||||
[2] Equivalent price for Light Sweet Crude (02/52) & Synthetic Crude (34APl) landed in Edmonton. | |||||||
| [3] Western Canada Select (20.5API) | |||||||
[4] Light Sour Blend at Cromer, Saskatchewan (850 kg/m3, 1.2% sulphur). | |||||||
[5] Midale at Cromer, Saskatchewan (880 kg/m3, 2.0% sulphur). | |||||||
[6] B.C. Light at Taylor, British Columbia (825 kg/m3, 0.5% sulphur) . | |||||||
14
15
FIVE HILLS AREA
SASKATCHEWAN
INDEX
Discussion
Ownership
Geology
Reserves
Production
FIVE HILLS AREA
SASKATCHEWAN
INDEX
Product Prices
Capital Expenditures
Operating Costs
Attachments
Figure 1: Land and Well Map with Analogies
Table 1: Schedule of Lands, Interests and Royalty Burdens
Figure 2: Geological Maps and Figures
a) Table of Formations - Southeast Saskatchewan
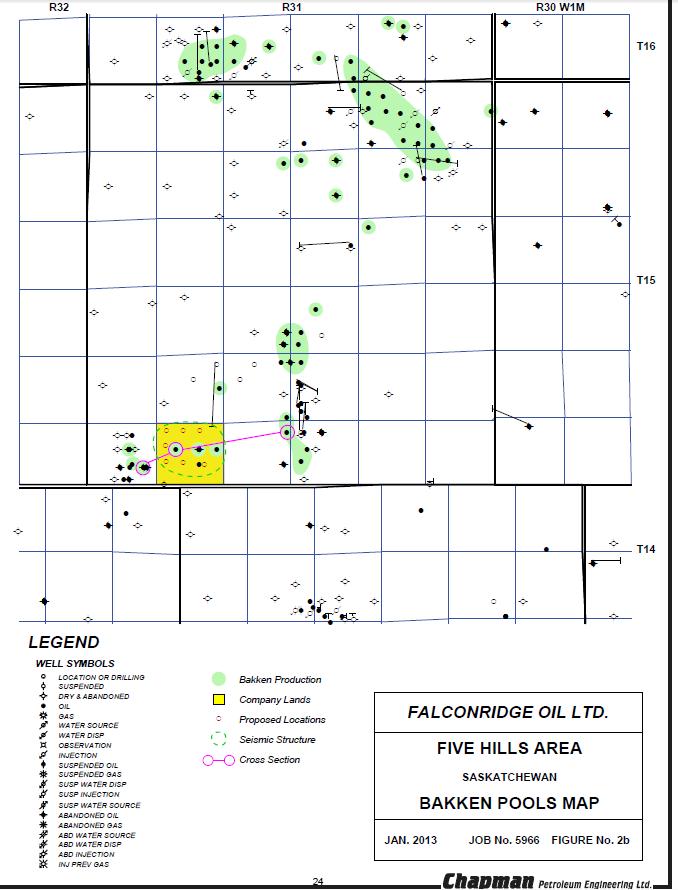
b) Bakken Pools Map
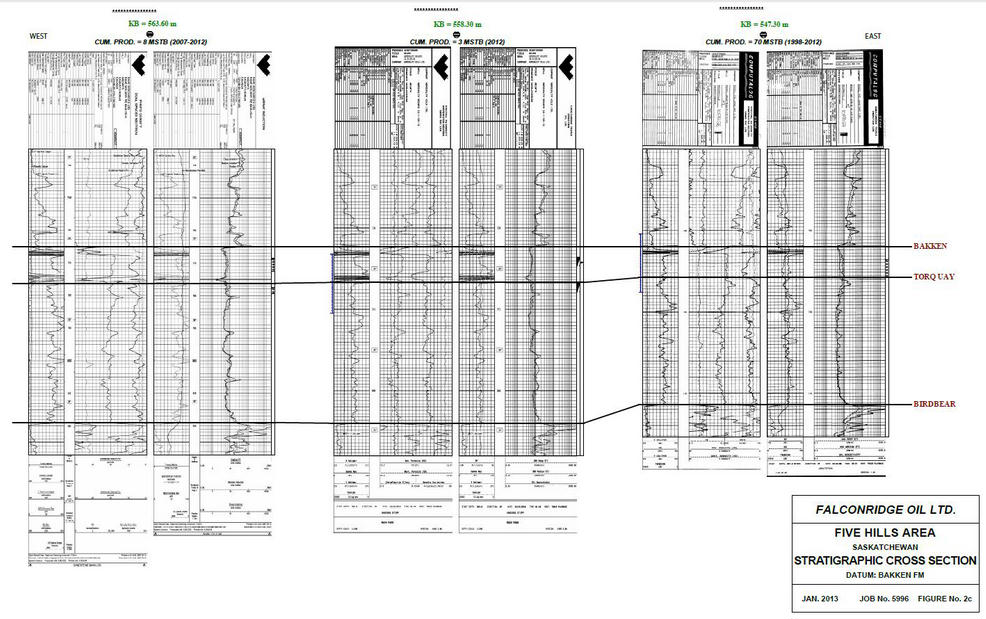
c) Stratigraphic Cross Section
Table 2: Summary of Gross Reserves
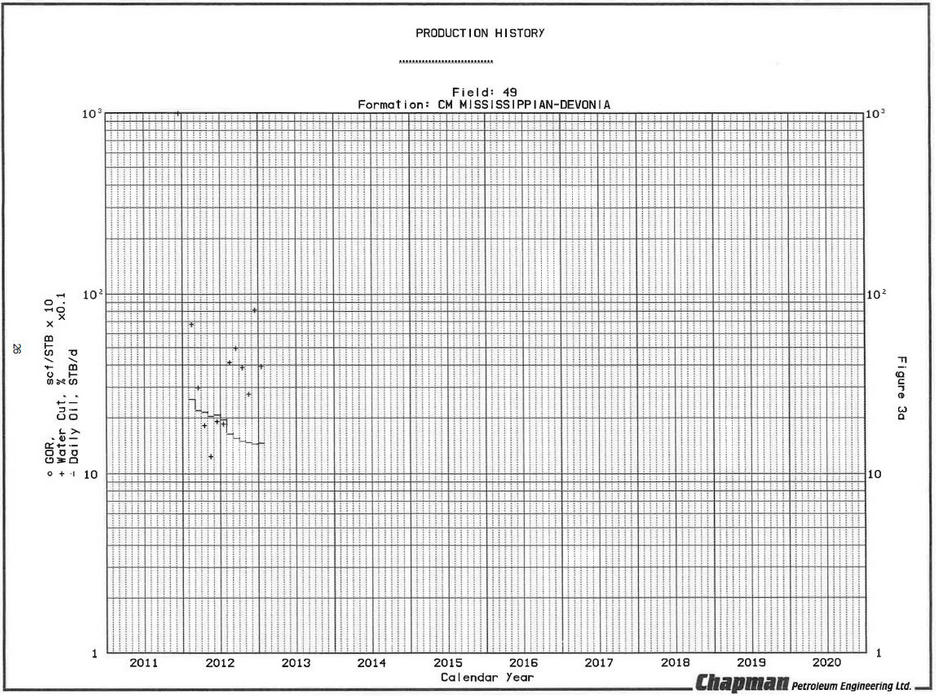
Figure 3: Production History Graph
a) ***************************
Table 3: Summary of Anticipated Capital Expenditures
a) Development
b) Abandonment and Restoration
Table 4: Economic Summary
Cash Flows
a) *************************** - Proved Developed Producing
b) *************************** - Proved Plus Probable Developed Producing
Appendix A: *************************** - Proved Developed Producing
Appendix B: Section 5 Wells & Locations, Bakken/Torquay- Proved Plus Probable
16
FIVE HILLS AREA
SASKATCHEWAN
DISCUSSION
Ownership
The Company owns a ten percent royalty interest in one producing vertical oil well *************** as shown on the map, Figure 1.
A detailed description of the wells and royalty interests is presented in Table 1.
Geology
The zones of interest in this area are the Devonian Bakken and underlying Torquay formations as shown on the Table of Formations chart illustrated in Figure 2a. The Bakken Formation is elastic unit with extensive production in this area as shown on the map of Bakken pools illustrated in Figure 2b. The Torquay is also a elastic unit in this area.
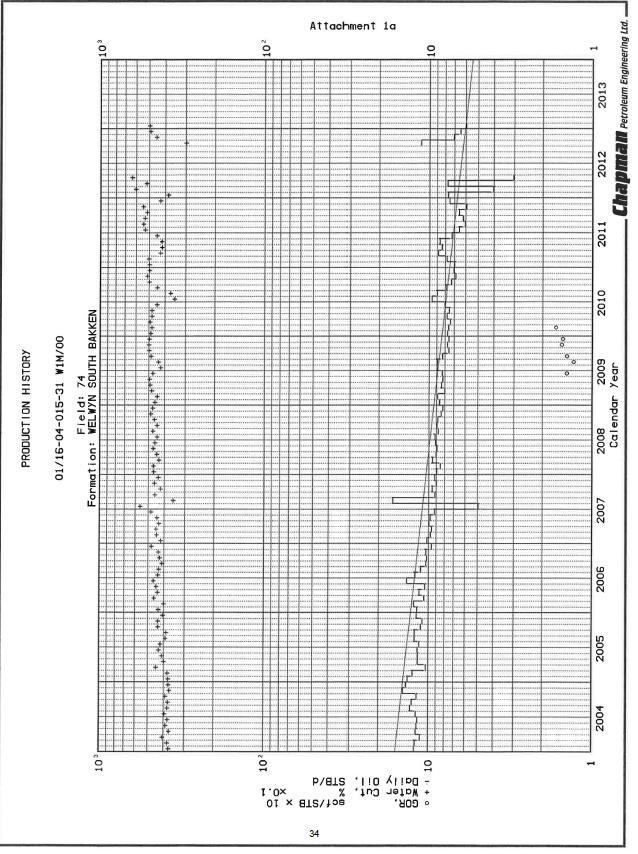
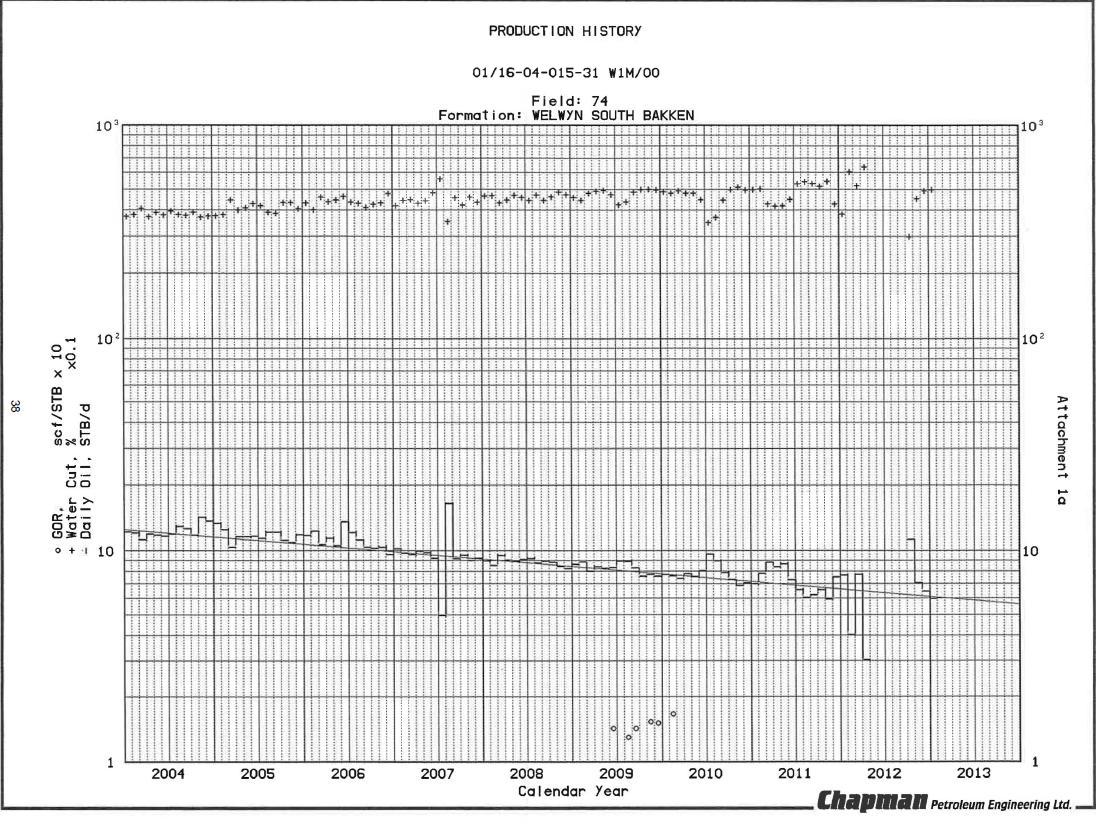
The east-west cross section illustrated in Figure 2c runs from a good producing well in the established Bakken production in the Welwyn South Poof to a well drilled by the Company in 2010 and then to a poor Bakken producer to the west. The Company well has already produced in less than one year almost half the oil the well to the west has produced for over five years.
Reserves
Proved developed producing light and medium oil reserves of 44 MSTB have been estimated for the Bakken/Torquay zone in the recently drilled well ************** based on limited production data from this well and analogy to a similar well in 16-04-15-31 W1.
Probable additional developed producing oil reserves of 24 MSTB have been estimated for the ********* well based on a more optimistic interpretation of the performance of the well 16-4.
Appendices A and B present our interpretation on the performance of well 16-4 for the Bakken/Torquay formation.
A summary of the gross reserves is presented in Table 2.
Production
The active well, **************, is producing at a rate of 15 STB/d. It is anticipated that the well will begin an immediate decline to an eventual economic limit. The production history of the 11-5 well is shown in Figure 3a.
Product Prices
An average 2013 oil price of $82.90/STB has been estimated for this area, based on revenue statements provided by the operator. The forecast SEC constant price is for Saskatchewan Light Oil adjusted by - $3.39/STB for quality and transportation.
Capital Expenditures
The royalty interest owner is not responsible for capital expenditures, abandonment and restoration costs as presented in Tables 3a and 3b.
17
Operating Costs
The royalty interest is not required to pay operating costs.
Economics
A summary of the Company reserves and economics using forecast prices and costs is presented in Table 4 and the results of the cash flow analysis performed on this well are presented in Tables 4a through 4b.
18

19
Table 1
Schedule of Lands, Interests and Royalty Burdens
January 1, 2013
Falconridge Oil Ltd.
Five Hills, Saskatchewan
| Appraised Interest | Royalty Burdens | |||
| Working | Royalty | Basic | Overriding | |
| Description | % | % | % | % |
| Twp 15 Rge 31 W1M | ||||
| Sec.5 | ||||
| (Well 11-5) | - | 10.0000 | - | - |
20

21
22
23
24
Table 2
Summary of Gross Reserves
January 1, 2013
Five Hills, Saskatchewan
Current or Initial Rate | API Gravity | Ultimate ROIP | Cumulative Production | Remaining ROIP | ||
| Description | STB/d | (Deg) | (MSTB) | (MSTB) | (MSTB) | Reference |
| Light & Medium Oil | ||||||
| Proved Developed Producing | ||||||
| *********************** | 15 | 40 | 49 | 5 | 44 | Appendix A |
| Total Proved Developed Producing | 15 | 49 | 5 | 44 | ||
| Total Proved Developed | 49 | 5 | 44 | |||
| Probable | ||||||
| Probable Developed Producing | ||||||
| ************************* | 2 | 40 | 24 | 0 | 24 | Appendix B |
| Total Probable | 24 | 0 | 24 | |||
| Total Proved Plus Probably | 73 | 5 | 68 |
25
Table 3a
Summary of Anticipated Capital Expenditures
Development
January 1, 2013
Falconridge on Ltd.
Five Hills, Saskatchewan
| Description | Date | Operation | Capital Interest % | Gross Capital % | Net Capital M$ |
No Capital Expenditures have been anticipated for this area. Note: M$ means thousands of dollars | |||||
26
Table 3b
Summary of Anticipated Capital Expenditures
Abandonment and Restoration
January 1, 2013
Falconridge Oil Ltd.
Five Hills, Saskatchewan
Description | Well Parameters | Capital Interest % | Gross Capital M$ | Net Capital M$ |
| **************** | The royalty interest owner is not responsible for abandonment and restoration costs, | |||
| 0.0000 | 40 | 0 | ||
| Total Abandonment and Restoration | 40 | 0 |
| Note: | M$ means thousands of dollars. |
| The above capital values are expressed in terms of current dollar values without escalation. |
27
Table 4
Constant Prices & Coats
Summary of Company Reserves and Economics
Before Income Tax
January 1, 2013
Falconridge Oil Ltd.
Five Hills, Saskatchewan
Net To Appraised Interest
| Reserves | Cumulative Cash Flow (BIT) – M$ | ||||||||||
Light and Medium Oil MSTB | Sales Gas MMecf | NGL Mbbls | Discounted at: | ||||||||
Description Proved Developed Producing | Gross | Net | Gross | Net | Gross | Net | Undisc. | 5%/year | 10%year | 15%/year | 20%/year |
| ***********************Bakkan/Torquay | 0 | 4 | 0 | 0 | 0 | 0 | 362 | 273 | 217 | 180 | 154 |
| Total Proved Developed Producing | 0 | 4 | 0 | 0 | 0 | 0 | 362 | 273 | 217 | 180 | 154 |
| Total Proved Developed | 0 | 4 | 0 | 0 | 0 | 0 | 362 | 273 | 217 | 180 | 154 |
Probable Probable Developed Producing | |||||||||||
| *********************Bakken/Torquay Incr. | 0 | 2 | 0 | 0 | 0 | 0 | 203 | 113 | 72 | 52 | 40 |
| Total Probable Developed Producing | 0 | 2 | 0 | 0 | 0 | 0 | 203 | 113 | 72 | 52 | 40 |
| Total Proved Plus Probable | 0 | 7 | 0 | 0 | 0 | 0 | 566 | 383 | 288 | 232 | 193 |
M$ means thousands of dollars.
Gross reserves are the total of the Company’s working and/or royalty share before deduction of royalties by others.
Net reserves are the total of the Company’s working and/or royalty interest share after deducting the amounts attributable to royalties owned by others.
Columns may not add precisely due to accumulative rounding of values throughout the report.
28
Table 4a
| EVALUATION OF: Five Hills, Saskatchewan – Proved Developed Producing | ERGO v7. 43 P2 ENERGY SOLUTIONS PAGE 1 |
| GLOBAL: 15-Jul-2013 5813-Sec | |
| EFF: 01-Jan-2013 DISC: 01-Jan-2013 PROD: 01-JAN-2013 | |
| FILE: OfivPP1.DAX | |
| WELL/LOCATION -************************************************ | TRACT FACTOR – 100.0000 % |
| EVALUATED BY – | ULT POOL RESERVES – 43648 STB |
| COMPANY EVALUATED – Falconridge Oil Ltd. | PRODUCT TO DATE – N/A |
| APPAISAL FOR – | DECLINE INDICATOR - EXPONENTIAL |
| PROJECT – CONSTANT PRICES & COSTS | |
| TOTAL ABANDONMENT – 4000 - $ - (2031) | |
| NOTE: ECONOMIC LIMIT OCCURS IN 2031 | |
| INTEREST | ROYALTIES/TAXES |
| AVG GR 10.0000% | SASKATCHEWAN PRODN TAX + FREEHOLD 15.00% (TIER4) + AVG GR 19.00% |
Oil STB | ||||||
Pool Company Share | ||||||
# of Year Wells | Price $/STB | STB/D | VOL | GROSS | NET | |
| 2013 | 1 | 82.90 | 14.2 | 5126 | 0 | 513 |
| 2014 | 1 | 82.90 | 12.8 | 4615 | 0 | 461 |
| 2015 | 1 | 82.90 | 11.5 | 4155 | 0 | 415 |
| 2016 | 1 | 82.90 | 10.4 | 3740 | 0 | 374 |
| 2017 | 1 | 82.90 | 9.4 | 3368 | 0 | 337 |
| 2018 | 1 | 82.90 | 8.4 | 3032 | 0 | 303 |
| 2019 | 1 | 82.90 | 7.6 | 2729 | 0 | 273 |
| 2020 | 1 | 82.90 | 6.8 | 2457 | 0 | 246 |
| 2021 | 1 | 82.90 | 6.1 | 2212 | 0 | 221 |
| 2022 | 1 | 82.90 | 5.5 | 1992 | 0 | 199 |
| 2023 | 1 | 82.90 | 5.0 | 1793 | 0 | 179 |
| 2024 | 1 | 82.90 | 4.5 | 1614 | 0 | 161 |
| 2025 | 1 | 82.90 | 4.0 | 1453 | 0 | 145 |
| 2026 | 1 | 82.90 | 3.6 | 1308 | 0 | 131 |
| 2027 | 1 | 82.90 | 3.3 | 1178 | 0 | 118 |
| SUB | 40773 | 0 | 4077 | |||
| REM | 2875 | 0 | 287 | |||
| TOT | 43648 | 0 | 4365 | |||
COMPANY SHARE FUTURE NET REVENUE | |||||||||||||||||||
Capital &Aband | Future Revenue (FR) | Royalties | Operating Costs | Future Net Rev | |||||||||||||||
| Year | Costs -M $ - | Oil -M$ - | SaleGas -M$ - | Products -M$ - | Total -M$ - | Crown -M$ - | Other -M$ - | Mineral -M$ - | -% - | Fixed Variable -M$- -M$- $/STB | FR After Roy & Oper -M$- | Net back $/STB | Proc& Other Income –M$ - | Cap’l Costs -M$ - | Aband Costs -M$- | Undisc –M$- | 10.0% -M$- | ||
| 2013 | 0 | 42 | 0 | 0 | 42 | 0 | 0 | 0 | .0 | 0 | 0 | .00 | 42 | .00 | 0 | 0 | 0 | 42 | 41 |
| 2014 | 0 | 38 | 0 | 0 | 38 | 0 | 0 | 0 | .0 | 0 | 0 | .00 | 38 | .00 | 0 | 0 | 0 | 38 | 33 |
| 2015 | 0 | 34 | 0 | 0 | 34 | 0 | 0 | 0 | .0 | 0 | 0 | .00 | 34 | .00 | 0 | 0 | 0 | 34 | 27 |
| 2016 | 0 | 31 | 0 | 0 | 31 | 0 | 0 | 0 | .0 | 0 | 0 | .00 | 31 | .00 | 0 | 0 | 0 | 31 | 22 |
| 2017 | 0 | 28 | 0 | 0 | 28 | 0 | 0 | 0 | .0 | 0 | 0 | .00 | 28 | .00 | 0 | 0 | 0 | 28 | 18 |
| 2018 | 0 | 25 | 0 | 0 | 25 | 0 | 0 | 0 | .0 | 0 | 0 | .00 | 25 | .00 | 0 | 0 | 0 | 25 | 15 |
29
| 2019 | 0 | 23 | 0 | 0 | 23 | 0 | 0 | 0 | .0 | 0 | 0 | .00 | 23 | .00 | 0 | 0 | 0 | 23 | 12 |
| 2020 | 0 | 20 | 0 | 0 | 20 | 0 | 0 | 0 | .0 | 0 | 0 | .00 | 20 | .00 | 0 | 0 | 0 | 20 | 10 |
| 2021 | 0 | 18 | 0 | 0 | 18 | 0 | 0 | 0 | .0 | 0 | 0 | .00 | 18 | .00 | 0 | 0 | 0 | 18 | 8 |
| 2022 | 0 | 17 | 0 | 0 | 17 | 0 | 0 | 0 | .0 | 0 | 0 | .00 | 17 | .00 | 0 | 0 | 0 | 17 | 7 |
| 2023 | 0 | 15 | 0 | 0 | 15 | 0 | 0 | 0 | .0 | 0 | 0 | .00 | 15 | .00 | 0 | 0 | 0 | 15 | 5 |
| 2024 | 0 | 13 | 0 | 0 | 13 | 0 | 0 | 0 | .0 | 0 | 0 | .00 | 13 | .00 | 0 | 0 | 0 | 13 | 4 |
| 2025 | 0 | 12 | 0 | 0 | 12 | 0 | 0 | 0 | .0 | 0 | 0 | .00 | 12 | .00 | 0 | 0 | 0 | 12 | 4 |
| 2026 | 0 | 11 | 0 | 0 | 11 | 0 | 0 | 0 | .0 | 0 | 0 | .00 | 11 | .00 | 0 | 0 | 0 | 11 | 3 |
| 2027 | 0 | 10 | 0 | 0 | 10 | 0 | 0 | 0 | .0 | 0 | 0 | .00 | 10 | .00 | 0 | 0 | 0 | 10 | 2 |
| ---------------------------------------------------------------------------------------------------------------------------------------------------------------------------------------------------------------------- | |||||||||||||||||||
| SUB | 0 | 338 | 0 | 0 | 338 | 0 | 0 | 0 | .0 | 0 | 0 | 338 | 0 | 0 | 0 | 338 | 212 | ||
| REM | 40 | 24 | 0 | 0 | 24 | 0 | 0 | 0 | .0 | 0 | 0 | 24 | 0 | 0 | 0 | 24 | 5 | ||
| TOT | 40 | 362 | 0 | 0 | 362 | 0 | 0 | 0 | .0 | 0 | 0 | 362 | 0 | 0 | 0 | 362 | 217 | ||
| NET PRESENT VALUE (-$-) | |||||||
| Discount Rate | .0% | 5.0% | 8.0% | 10.0% | 12.0% | 15.0% | 20.0% |
| FR After Roy & Oper | 361840 | 272610 | 236454 | 217107 | 200670 | 180267 | 154438 |
| Proc & Other Income | 0 | 0 | 0 | 0 | 0 | 0 | 0 |
| Capital Costs | 0 | 0 | 0 | 0 | 0 | 0 | 0 |
| Abandoment Costs | 0 | 0 | 0 | 0 | 0 | 0 | 0 |
| Future Net Revenue | 361840 | 272610 | 236454 | 217107 | 200670 | 180267 | 154438 |
| PROFITABILITY | |
| COMPANY SHARE BASIS | Before Tax |
| Rate of Return (%) | n/a |
| Profit Index (undisc.) | n/a |
| (disc. @ 10.0%) | n/a |
| (disc. @ 5.0%) | n/a |
| First Payout (years) | n/a |
| Total Payout (years) | n/a |
| Cost of finding ($/BOE) | n/a |
| NPV @ 10.0% ($/STB) | .00 |
| NPV @ 5.0% ($/STB) | .00 |
| COMPANY SHARE | |||||||
1st Year | Average | Royalties | Oper Costs | FR After Roy&Oper | Capital Costs | Future NetRev | |
| % Interest | .0 | .0 | . | ||||
| % of Future Revenue | .0 | .0 | 100.0 | .0 | 100.0 | ||
30
Table 4b
| EVALUATION OF: | |
| Five Hills, Saskatchewan – Proved Plus Probable Developed Producing | ERGO v7. 43 P2 ENERGY SOLUTIONS PAGE 1 |
| GLOBAL: 15-Jul-2013 5813-Sec | |
| EFF: 01-Jan-2013 DISC: 01-Jan-2013 PROD: 01-JAN-2013 | |
| FILE: OfivRA1.DAX | |
WELL/LOCATION - **************************************** | TRACT FACTOR – 100.0000 % |
| EVALUATED BY – | ULT POOL RESERVES – 68148 STB |
| COMPANY EVALUATED – Falconridge Oil Ltd. | PRODUCT TO DATE – N/A |
| APPAISAL FOR – | DECLINE INDICATOR - EXPONENTIAL |
| PROJECT – CONSTANT PRICES & COSTS | |
| TOTAL ABANDONMENT – 4000 - $ - (2039) | |
| NOTE: ECONOMIC LIMIT OCCURS IN 2009 | |
| INTEREST | ROYALTIES/TAXES |
| AVG GR 10.0000% | SASKATCHEWAN PRODN TAX + FREEHOLD 15.00% (TIER4) + AVG GR 19.00% |
Oil STB | ||||||
Pool Company Share | ||||||
# of Year Wells | Price $/STB | STB/D | VOL | GROSS | NET | |
| 2013 | 1 | 82.90 | 16.4 | 5887 | 0 | 589 |
| 2014 | 1 | 82.90 | 15.1 | 5446 | 0 | 545 |
| 2015 | 1 | 82.90 | 14.0 | 5037 | 0 | 504 |
| 2016 | 1 | 82.90 | 12.9 | 4659 | 0 | 466 |
| 2017 | 1 | 82.90 | 12.0 | 4310 | 0 | 431 |
| 2018 | 1 | 82.90 | 11.1 | 3987 | 0 | 399 |
| 2019 | 1 | 82.90 | 10.2 | 3687 | 0 | 369 |
| 2020 | 1 | 82.90 | 9.5 | 3411 | 0 | 341 |
| 2021 | 1 | 82.90 | 8.8 | 3155 | 0 | 315 |
| 2022 | 1 | 82.90 | 8.1 | 2918 | 0 | 292 |
| 2023 | 1 | 82.90 | 7.5 | 2699 | 0 | 270 |
| 2024 | 1 | 82.90 | 6.9 | 2497 | 0 | 250 |
| 2025 | 1 | 82.90 | 6.4 | 2310 | 0 | 231 |
| 2026 | 1 | 82.90 | 5.9 | 2136 | 0 | 214 |
| 2027 | 1 | 82.90 | 5.5 | 1976 | 0 | 198 |
| SUB | 54116 | 0 | 5412 | |||
| REM | 14032 | 0 | 1403 | |||
| TOT | 68148 | 0 | 6815 | |||
COMPANY SHARE FUTURE NET REVENUE | |||||||||||||||||||
Capital &Aband | Future Revenue (FR) | Royalties | Operating Costs | Future Net Rev | |||||||||||||||
| Year | Costs -M $ - | Oil -M$ - | SaleGas -M$ - | Products -M$ - | Total -M$ - | Crown -M$ - | Other -M$ - | Mineral -M$ - | -% - | Fixed Variable -M$- -M$- $/STB | FR After Roy & Oper -M$- | Net back $/STB | Proc& Other Income –M$ - | Cap’l Costs -M$ - | Aband Costs -M$- | Undisc –M$- | 10.0% -M$- | ||
| 2013 | 0 | 49 | 0 | 0 | 49 | 0 | 0 | 0 | .0 | 0 | 0 | .00 | 49 | .00 | 0 | 0 | 0 | 49 | 47 |
| 2014 | 0 | 45 | 0 | 0 | 45 | 0 | 0 | 0 | .0 | 0 | 0 | .00 | 45 | .00 | 0 | 0 | 0 | 45 | 39 |
| 2015 | 0 | 42 | 0 | 0 | 42 | 0 | 0 | 0 | .0 | 0 | 0 | .00 | 42 | .00 | 0 | 0 | 0 | 42 | 33 |
| 2016 | 0 | 39 | 0 | 0 | 39 | 0 | 0 | 0 | .0 | 0 | 0 | .00 | 39 | .00 | 0 | 0 | 0 | 39 | 28 |
31
| 2017 | 0 | 36 | 0 | 0 | 36 | 0 | 0 | 0 | .0 | 0 | 0 | .00 | 36 | .00 | 0 | 0 | 0 | 36 | 23 |
| 2018 | 0 | 33 | 0 | 0 | 33 | 0 | 0 | 0 | .0 | 0 | 0 | .00 | 33 | .00 | 0 | 0 | 0 | 33 | 20 |
| 2019 | 0 | 31 | 0 | 0 | 31 | 0 | 0 | 0 | .0 | 0 | 0 | .00 | 31 | .00 | 0 | 0 | 0 | 31 | 16 |
| 2020 | 0 | 28 | 0 | 0 | 28 | 0 | 0 | 0 | .0 | 0 | 0 | .00 | 28 | .00 | 0 | 0 | 0 | 28 | 14 |
| 2021 | 0 | 26 | 0 | 0 | 26 | 0 | 0 | 0 | .0 | 0 | 0 | .00 | 26 | .00 | 0 | 0 | 0 | 26 | 12 |
| 2022 | 0 | 24 | 0 | 0 | 24 | 0 | 0 | 0 | .0 | 0 | 0 | .00 | 24 | .00 | 0 | 0 | 0 | 24 | 10 |
| 2023 | 0 | 22 | 0 | 0 | 22 | 0 | 0 | 0 | .0 | 0 | 0 | .00 | 22 | .00 | 0 | 0 | 0 | 22 | 8 |
| 2024 | 0 | 21 | 0 | 0 | 21 | 0 | 0 | 0 | .0 | 0 | 0 | .00 | 21 | .00 | 0 | 0 | 0 | 21 | 7 |
| 2025 | 0 | 19 | 0 | 0 | 19 | 0 | 0 | 0 | .0 | 0 | 0 | .00 | 19 | .00 | 0 | 0 | 0 | 19 | 6 |
| 2026 | 0 | 18 | 0 | 0 | 18 | 0 | 0 | 0 | .0 | 0 | 0 | .00 | 18 | .00 | 0 | 0 | 0 | 18 | 5 |
| 2027 | 0 | 16 | 0 | 0 | 16 | 0 | 0 | 0 | .0 | 0 | 0 | .00 | 16 | .00 | 0 | 0 | 0 | 16 | 4 |
| ---------------------------------------------------------------------------------------------------------------------------------------------------------------------------------------------------------------------- | |||||||||||||||||||
| SUB | 0 | 449 | 0 | 0 | 449 | 0 | 0 | 0 | .0 | 0 | 0 | 449 | 0 | 0 | 0 | 449 | 271 | ||
| REM | 40 | 116 | 0 | 0 | 116 | 0 | 0 | 0 | .0 | 0 | 0 | 116 | 0 | 0 | 0 | 116 | 19 | ||
| TOT | 40 | 565 | 0 | 0 | 565 | 0 | 0 | 0 | .0 | 0 | 0 | 565 | 0 | 0 | 0 | 565 | 289 | ||
| NET PRESENT VALUE (-$-) | |||||||
| Discount Rate | .0% | 5.0% | 8.0% | 10.0% | 12.0% | 15.0% | 20.0% |
| FR After Roy & Oper | 564945 | 385229 | 321375 | 289249 | 263029 | 231794 | 194184 |
| Proc & Other Income | 0 | 0 | 0 | 0 | 0 | 0 | 0 |
| Capital Costs | 0 | 0 | 0 | 0 | 0 | 0 | 0 |
| Abandoment Costs | 0 | 0 | 0 | 0 | 0 | 0 | 0 |
| Future Net Revenue | 564945 | 385229 | 321375 | 289249 | 263029 | 231794 | 194184 |
| COMPANY SHARE | |||||||
1st Year | Average | Royalties | Oper Costs | FR After Roy&Oper | Capital Costs | Future NetRev | |
| % Interest | .0 | .0 | |||||
| % of Future Revenue | .0 | .0 | .100.0 | 0.0 | 100.0 | ||
| PROFITABILITY | |
| COMPANY SHARE BASIS | Before Tax |
| Rate of Return (%) | n/a |
| Profit Index (undisc.) | n/a |
| (disc. @ 10.0%) | n/a |
| (disc. @ 5.0%) | n/a |
| First Payout (years) | n/a |
| Total Payout (years) | n/a |
| Cost of finding ($/BOE) | n/a |
| NPV @ 10.0% ($/STB) | .00 |
| NPV @ 5.0% ($/STB) | .00 |
32
Appendix A
Summary of Analog Analysis
January 1, 2013
Five Hills, Saskatchewan
Analog for
Well Sec. 5 Wells, Proved Developed Producing
Zone BakkenfTorquay
| Analog Property | Reference | ||
| Field Welwyn South (Well 16-4-33-15 W1) | |||
| Pool Bakken | |||
| Ultimate reserves | 84 | MSTB | Attachment 1b |
| Number of Wells | 1 | ||
| Ave Reserves/well | 84 | MSTB | Calculated |
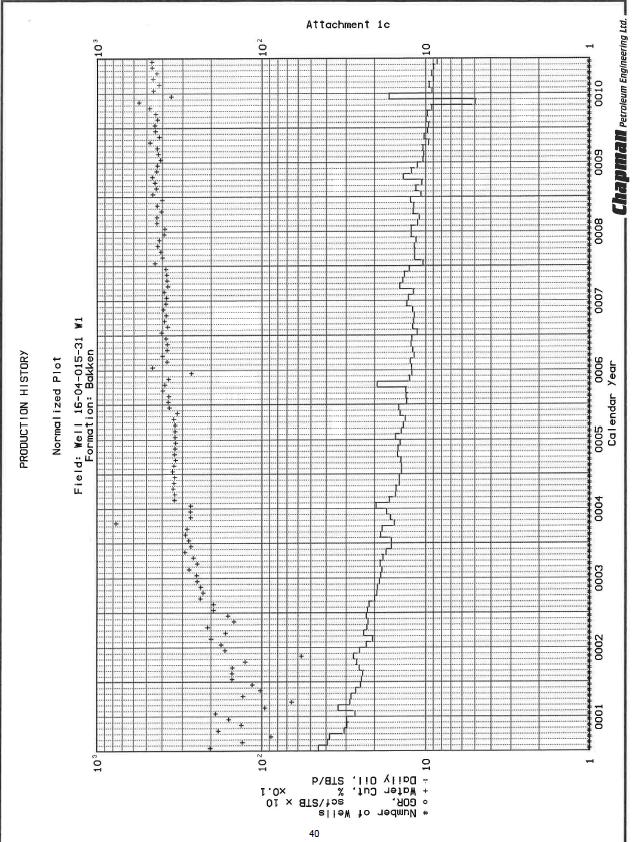
| Average Initial Rate | 30 | STB/d | Attachment 1c |
Attachments
1 a) Group Production Plot
1b) Group Rate vs. Cum. Plot
1c) Normalized Production Plot
1 d) Well List - Analog
33
34

35

36
Appendix B
Summary of Analog Analysis
January 1, 2013
Five Hills, Saskatchewan
Analog for
Well Sec. 5 Wells & Locations, Proved Plus Probable
Zone Bakken/Torquay
| Analog Property | Reference | ||
| Field Welwyn South (Well 16-4-33-15 W1) | |||
| Pool Bakken | |||
| Ultimate reserves | 89 | MSTB | Attachment 1b |
| Number of Wells | 1 | ||
| Ave Reserves/well | 89 | MSTB | Calculated |
| Average Initial Rate | 35 | STB/d | Attachment 1c |
Attachments
1 a) Group Production Plot
1b) Group Rate vs. Cum. Plot
1c) Normalized Production Plot
1 d) Well List - Analog
37
38

39
40
GLOSSARY OF TERMS
(Abbreviations & Definitions)
| General | |
| BIT | - Before Income Tax |
| AIT | - After Income Tax |
| M$ | - Thousands of Dollars |
| Effective | - The date for which the Present Value of the future cash flows and reserve categories are established |
| Date | |
| $US | - United States Dollars |
| WTI | - West Texas Intermediate - the common reference for crude oil used for oil price comparisons |
| ARTC | - Alberta Royalty Tax Credit |
| GRP | - Gas Reference Price |
| Interests and Royalties | |
| BPO | - Before Payout |
| APO | - After Payout |
| APPO | - After Project Payout |
| Payout | - The point at which a participant's original capital investment is recovered from its net revenue |
| GORR | - Gross Overriding Royalty - percentage of revenue on gross revenue earned (can be an interest or a burden) |
| NC | - New Crown - crown royalty on petroleum and natural gas discovered after April 30, 1974 |
| SS 1/150- | - Sliding Scale Royalty - a varying gross overriding royalty based on monthly production. Percentage is (5%-15%) Oil calculated as 1-150°1 of monthly production with a minimum percentage of 5% and a maximum of 15% |
| FH | - Freehold Royalty |
| P&NG | - Petroleum and Natural Gas |
| Twp | - Township |
| Rge | - Range |
| Sec | - Section |
41
| Technical Data | |
| psia | - Pounds per square inch absolute |
| MSTB | - Thousands of Stock Tank Barrels of oil (oil volume at 60 F and 14.65 psia) |
| MMscf | - Millions of standard cubic feet of gas (gas volume at 60 F and 14.65 psia) |
| Bbls | - Barrels |
| Mbbls | - Thousands of barrels |
| MM BTU | - Millions of British Thermal Units - heating value of natural gas |
| STB/d | - Stock Tank Barrels of oil per day- oil production rate |
| Mscf/d | - Thousands of standard cubic feet of gas per day - gas production rate |
| GOR | - Gas-Oil Ratio (standard cubic feet of solution gas per stock tank barrel of oil) |
| (scf/STB) | |
| mKB | - Metres Kelly Bushing - depth of well in relation to the Kelly Bushing which is located on the floor of the drilling rig. The Kelly Bushing is the usual reference for all depth measurements during drilling operations. |
| EOR | - Enhanced Oil Recovery |
| GJ | - Gigajoules |
| Marketable or Sales Natural Gas | |
| - Natural gas that meets specifications for its sale, whether it occurs naturally or results from the processing of raw natural gas. Field and plant fuel and losses to the point of the sale must be excluded from the marketable quantity. The heating value of marketable natural gas may vary considerably, depending on its composition; therefore, quantities are usually expressed not only in volumes but also in terms of energy content. Reserves are always reported as marketable. | |
| NGLs | - Natural Gas Liquids - Those hydrocarbon components that can be recovered from natural gas as liquids, including but not limited to ethane, propane, butanes, pentanes plus, condensate, and small quantities of non-hydrocarbons. |
| Raw Gas | - Natural gas as it is produced from the reservoir prior to processing. It is gaseous at the conditions under which its Volume is measured or estimated and may include varying amounts of heavier hydrocarbons (that may liquefy at atmospheric conditions) and water vapour; may also contain sulphur and other non-hydrocarbon compounds. Raw natural gas is generally not suitable for end use. |
| EUR | - Estimated Ultimate Recovery |
42
April 24, 2014
Chapman Petroleum Engineering Ltd.
445, 708 - 11 Avenue SW
Calgary, AB
T2R OE4
Dear Sir:
Re: Company Representation Letter
Regarding the evaluation of our Company's oil and gas reserves and independent appraisal of the economic value of these reserves for the year ended December 31, 2012, (the effective date), we herein confirm to the best of our knowledge and belief as of the effective date of the reserves evaluation, and as applicable, as of today, the following representations and information made available to you during the conduct of the evaluation:
1. We, Falconridge Oil Ltd., (the Client) have made available to you, Chapman Petroleum
Engineering Ltd. (the Evaluator) certain records, information, and data relating to the evaluated properties that we confirm is, with the exception of immaterial items, complete and accurate as of the effective date of the reserves evaluation, including the following:
| • | Accounting, financial, tax and contractual data |
| • | Asset ownership and related encumbrance information; |
| • | Details concerning product marketing, transportation and processing arrangements; |
| • | All technical information including geological, engineering and production and test data; |
| • | Estimates of future abandonment and reclamation costs. |
2. We confirm that all financial and accounting information provided to you is, to the best of our knowledge, both on an individual entity basis and in total, entirely consistent with that reported by our Company for public disclosure and audit purposes.
3. We confirm that our Company has satisfactory title to all of the assets, whether tangible,intangible, or otherwise, for which accurate and current ownership information has been provided.
4. With respect to all information provided to you regarding product marketing, transportation, and processing arrangements, we confirm that we have disclosed to you all anticipated changes, terminations, and additions to these arrangements that could reasonably be expected to have a material effect on the evaluation of our Company's reserves and future net revenues.
5. With the possible exception of items of an immaterial nature, we confirm the following as of the effective date of the evaluation:
| • | For all operated properties that you have evaluated, no changes have occurred or are reasonably expected to occur to the operating conditions or methods that have been used by our Company over the past twelve (12) months, except as disclosed to you. In the case of non-operated properties, we have advised you of any such changes of which we have been made aware. |
| • | All regulatory, permits, and licenses required to allow continuity of future operations and production from the evaluated properties are in place and, except as disclosed to you, there are no directives, orders, penalties, or regulatory rulings in effect or expected to come into effect relating to the evaluated properties. |
43
| • | Except as disclosed to you, the producing trend and status of each evaluated well or entity in effect throughout the three-month period preceding the effective date of the evaluation are consistent with those that existed for the same well or entity immediately prior to this three-month period. |
| • | Except as disclosed to you, we have no plans or intentions related to the ownership, development or operation of the evaluated properties that could reasonably be expected to materially affect the production levels or recovery of reserves from the evaluated properties. |
| • | If material changes of an adverse nature occur in the Company's operating performance subsequent to the effective date and prior to the report date, we will inform you of such material changes prior to requesting your approval for any public disclosure of reserves information. |
6. We hereby confirm that our Company is in material compliance with all Environmental Laws and does not have any Environmental Claims pending.
Between the effective date of the report and the date of this letter, nothing has come to our attention that has materially affected or could affect our reserves and economic value of these reserves that has not been disclosed to you.
Yours very truly,
| President and Chief Executive Officer | Vice-President & Chief Financial Officer |
44