1
UNITED STATES
SECURITIES AND EXCHANGE COMMISSION
Washington, D.C. 20549
FORM 10-K
[ x ]ANNUAL REPORT PURSUANT TO SECTION 13 OR 15(d) OF THE SECURITIES EXCHANGE ACT OF 1934
For the fiscal year ended March 31, 2012
or
[ ]TRANSITION REPORT PURSUANT TO SECTION 13 OR 15(d) OF THE SECURITIES EXCHANGE ACT OF 1934
For the transition period from ________________ to __________________
Commission file number 000-53291
LAKE VICTORIA MINING COMPANY, INC.
(Exact name of registrant as specified in its charter)
| Nevada | 51-0628651 |
| State or other jurisdiction of | (I.R.S. Employer |
| incorporation or organization | Identification No.) |
Suite 810 – 675 West Hastings Street
Vancouver, British Columbia, Canada V6B 1N2
(Address of principal executive offices, including zip code)
604.681.9635
(telephone number, including area code)
Securities registered pursuant to Section 12(b) of the Act
| Title of Each Class | Name of each Exchange on which registered |
| Nil | N/A |
Securities registered pursuant to Section 12(g) of the Act
Common Stock, par value $0.00001 per share
(Title of Class)
Indicate by check mark if the registrant is a well-known seasoned issuer, as defined in Rule 405 of the Securities Act.YES[ ]NO[ x ]
Indicate by check mark if the registrant is not required to file reports pursuant to Section 13 or 15(d) of the Act:YES[ ]NO[ x ]
Indicate by check mark whether the registrant(1) has filed all reports required by Section 13 or 15(d) of the Securities Exchange Act of 1934 during the preceding 12 months (or for such shorter period that the registrant was required to file such reports), and (2) has been subject to such filing requirements for the past 90 day.YES[ x ]NO[ ]
Indicate by check mark whether the registrant has submitted electronically and posted on its corporate Website, if any, every Interactive Data File required to be submitted and posted pursuant to Rule405 of Regulation S-T (§229.405 of this chapter) during the preceding 12 months (or for such shorter period that the registrant was required to submit and post such files). YES [ x ] NO [ ]
2
Indicate by check mark if disclosure of delinquent filers pursuant to Item 405 of Regulations S-K is not contained herein, and will not be contained, to the best of registrant’s knowledge, in definitive proxy or information statements incorporated by reference in Part III of this Form 10-K or any amendment to this Form 10-K.[ ]
Indicate by check mark whether the registrant is a large accelerated filer, an accelerated filer, a non-accelerated filer, or a smaller reporting company. See the definitions of “large accelerated filer,” “accelerated filer” and “smaller reporting company” in Rule 12b-2 if the Exchange Act.
| Large Accelerated Filer [ ] | Accelerated Filer [ ] |
| Non-accelerated Filer [ ] | Smaller Reporting Company [ x ] |
| (Do not check if a smaller reporting company) | |
Indicate by check mark whether the registrant is a shell company (as defined in Rule 12b-2 of the Act).YES[ ]NO[ x ]
State the aggregate market value of the voting and non-voting common equity held by non-affiliates computed by reference to the price at which the common equity was sold, or the average bid and asked prices of such common equity, as of the last business day of the registrant’s most recently completed second fiscal quarter: $24,225,254 based on a price of $0.31 per share, being the average bid and ask price of the registrant’s common stock as quoted on the OTC Bulletin Board on September 30, 2011.
Indicate the number of shares outstanding of each of the registrant's classes of common stock as of the latest practicable date 111,770,733 shares of common stock as of June 29, 2012.
DOCUMENTS INCORPORATED BY REFERENCE
List hereunder the following documents if incorporated by reference and the Part of the Form 10-K (e.g., Part I, Part II, etc.) into which the document is incorporated: (1) Any annual report to security holders; (2) Any proxy or information statement; and (3) Any prospectus filed pursuant to Rule 424(b) or (c) under the Securities Act of 1933. The listed documents should be clearly described for identification purposes (e.g., annual report to security holders for fiscal year ended December 24, 1980).Not Applicable
3
TABLE OF CONTENTS
4
PART I
Forward Looking Statements
This annual report contains forward-looking statements. Forward-looking statements are projections of events, revenues, income, future economic performance or management’s plans and objectives for our future operations. In some cases, you can identify forward-looking statements by terminology such as “may”, “should”, “expects”, “plans”, “anticipates”, “believes”, “estimates”, “predicts”, “potential” or “continue” or the negative of these terms or other comparable terminology. These statements are only predictions and involve known and unknown risks, uncertainties and other factors, including the risks in the section entitled “Risk Factors” and the risks set out below, any of which may cause our or our industry’s actual results, levels of activity, performance or achievements to be materially different from any future results, levels of activity, performance or achievements expressed or implied by these forward-looking statements. These risks include, by way of example and not in limitation:
risks and uncertainties relating to the interpretation of sampling results, the geology, grade and continuity of mineral deposits;
risks and uncertainties that results of initial sampling and mapping will not be consistent with our expectations;
mining and development risks, including risks related to accidents, equipment breakdowns, labor disputes or other unanticipated difficulties with or interruptions in production;
the potential for delays in exploration activities;
risks related to the inherent uncertainty of cost estimates and the potential for unexpected costs and expenses;
risks related to commodity price fluctuations;
the uncertainty of profitability based upon our limited history;
risks related to failure to obtain adequate financing on a timely basis and on acceptable terms for our planned exploration projects;
risks related to environmental regulation and liability;
risks that the amounts reserved or allocated for environmental compliance, reclamation, post-closure control measures, monitoring and on-going maintenance may not be sufficient to cover such costs;
risks related to tax assessments;
political and regulatory risks associated with mining development and exploration; and
other risks and uncertainties related to our mineral property and business strategy.
This list is not an exhaustive list of the factors that may affect any of our forward-looking statements. These and other factors should be considered carefully and readers should not place undue reliance on our forward-looking statements.
Forward looking statements are made based on management’s beliefs, estimates and opinions on the date the statements are made and we undertake no obligation to update forward-looking statements if these beliefs, estimates and opinions or other circumstances should change. Although we believe that the expectations reflected in the forward-looking statements are reasonable, we cannot guarantee future results, levels of activity, performance or achievements. Except as required by applicable law, including the securities laws of the United States and Canada, we do not intend to update any of the forward-looking statements to conform these statements to actual results.
5
In this annual report, unless otherwise specified, all dollar amounts are expressed in United States dollars and all references to “common stock” refer to the common shares in our capital stock.
As used in this annual report, the terms “we”, “us”, “our”, the “Company” and “Lake Victoria” mean Lake Victoria Mining Company, Inc., and our wholly owned subsidiaries Kilimanjaro Mining Company Inc., Lake Victoria Resources (T) Limited, Chrysos 197 Company Tanzania Ltd and Jin 197 Company Tanzania Ltd, unless otherwise indicated.
General
Lake Victoria Mining Company, Inc. was incorporated on December 11, 2006 under the laws of the State of Nevada. We are an exploration stage corporation focused on acquiring, exploring and developing gold deposits in the Lake Victoria Greenstone Belt in Tanzania, East Africa. As of March 31, 2012, we hold prospective gold projects, consisting of 29 Prospecting Licenses (PLs) and 71 Primary Mining Licenses (PMLs) and four uranium projects consisting of 6 Prospecting Licenses, within its Tanzania property portfolio, covering approximately 2,280 square kilometers. We carry out our business by acquiring, exploring and evaluating mineral properties through our ongoing exploration programs. Following exploration, we intend to either advance them to a commercially feasible mining stage, enter joint ventures to further develop these properties or dispose of them if the properties do not meet our requirements. Our properties are all early stage exploration properties. Within our mineral exploration land in Tanzania our focus is primarily on gold, although our portfolio also contains uranium prospects.
Since inception we have had no revenues and have relied upon the sale of our securities to fund operations. To date, we have not discovered a commercially viable ore body, mineral deposit or mineral reserve on any of our properties and we will be unable to do so until further exploration is done and a comprehensive evaluation concludes an economic and legal feasibility study.
Our property portfolio is large, therefore we may interest other companies in our properties to either participate by means of option or joint venture agreements in the exploration of them or to finance and establish production if mineralization is found.
We maintain our registered agent’s office at The Corporation Trust Company of Nevada, 6100 Neil Road, Suite 500, Reno, Nevada 89511 and our business and administrative office is located at Suite 810 – 675 West Hastings Street, Vancouver, British Columbia, V6B 1N2, Canada. Our telephone number is 604.681.9635.
Recent Corporate Developments
Since the commencement of our fourth quarter ended March 31, 2012, we experienced the following significant corporate developments:
| | 1. | On the Uyowa Gold Project, we conducted a 2,486 meter reverse circulation drilling during the latter part of 2011 and identified two narrow, but continuous, gold rich zones extending about 1.3 kilometers in strike length. Reconnaissance investigation is currently underway on the Uyowa block of licenses, located 40 kilometers southeast of the Kahama South license. A number of ground magnetic anomalies within the licenses are being targeted with soil and termite sampling programs. In May 2012, a 1459 meter diamond drilling program was completed at the Target 1 location. Assays are pending and will be reported when available and confirmed. At least seven ground magnetic targets within the northern license are to be prioritized for a Rotary Air Blast (RAB) drilling program during the course of this year. |
| | | |
| | 2. | In late 2011, we commenced opening a number of the old collapsed trenches across the BIF hill at the Kiabakari East Prospect located within the central part of the Musoma-Mara Greenstone Belt in the Musoma District in northeastern Tanzania. Sampling of some of the artisanal workings and shafts on the hill returned encouraging results. Mapping and channel sampling were completed before cessation of field activities and samples were submitted to SGS Laboratories, Mwanza for analysis of gold. Additional infill trenches have been planned, pending results from this initial trench program. At the nearby Kinyambwiga property, an auger drill program is currently in progress to test strike extensions of the Kanunga 1 gold rich vein beneath areas of thin clay rich soil cover. Once completed, the auger rig will be utilised to explore coincident ground magnetic and IP gradient targets, overlain by similar soil cover, on nearby Suguti and Murangi licenses. |
6
| | 3. | In April, 2012 we closed a private placement of 14,285,000 shares at a price of $0.06 per share for gross proceeds of $857,100. We issued an aggregate of 2,000,000 shares to one subscriber that represented that they were not US person (as that term is defined in Regulation S of the Securities Act of 1933) in an offshore transaction pursuant to Regulation S and/or Section 4(2) of the Securities Act of 1933 and an additional 12,285,000 shares to eight accredited investors, who represented that they were each a “US Person” as defined in Regulation S, pursuant to Rule 506 of Regulation D and/or Section 4(2) of the Securities Act of 1933. Proceeds of the private placement are intended to be applied to the Company’s ongoing work program on its mining projects, continued exploration for new projects and general working capital. |
| | | |
| | 4. | Effective April 24, 2012, we appointed Lorne B. Anderson as a director of our company. Mr. Anderson is a Chartered Accountant with over 45 years of experience since his designation and has been an Independent Financial consultant to the minerals industry since 1998. He has served as a director of Tahoe Resources Inc. since June 2010 to date and as the Director of Skyline Gold Corporation from June 2006 to date and CFO from December 2008 to date. He was the CFO of Tyhee Gold Corp from May 2005 until January 2012 and was the CFO and Treasurer of Glamis Gold Ltd. from 1988 to 1998. Mr. Anderson has more than 20 years experience in the mining industry, during which time he has been involved with administration, equity and bank financings, and investor relation programs. In connection with the appointment of Mr. Anderson to the board, we granted stock options to Mr. Anderson to purchase 300,000 shares of our common stock at an exercise price of $0.09 per share exercisable until April 30, 2015. |
| | | |
| | 5. | At Kahama South, we have commenced a ground magnetic survey and a geologic mapping program of the 245 square kilometer project. |
| | | |
| | 6. | During 2012, early stage exploration programs are planned for a number of additional Company licenses within the North Mara Greenstone Belt of northeastern Tanzania. |
Competitive Factors
The gold mining industry is fragmented, that is there are many gold prospectors and producers, small and large. We are a small exploration stage mining company and we do not have the financial, personnel or equipment resources that many competitors possess. Because of our lack of resources we may not be able to adequately withstand the competitive forces that exist in the mining industry generally and specifically with respect to gold mining.
Regulations
Mineral rights in the United Republic of Tanzania are governed by the Mining Act of 1998 and The Mining (Mineral Rights) Regulations, 2010 and control over minerals is vested in the United Republic of Tanzania. Prospecting for minerals may only be conducted under authority of a mineral right granted by the Ministry of Energy and Minerals under this Act.
The three types of mineral rights most often encountered, which are applicable to us include: prospecting licenses; retention licenses; and mining licenses. A prospecting license grants the holder thereof the exclusive right to prospect in the area covered by the license for all minerals, other than building and gemstones, for an initial period of four years. Thereafter, the license is renewable for two further periods of three and two years consecutively. On each renewal of a prospecting license, 50 percent of the area covered by the license must be relinquished. The maximum initial area for a prospecting license is 300 square kilometers. A company applying for a prospecting license must, inter alia, state the financial and technical resources available to it. A retention license can also be requested from the Minister, after the expiry of the 4-3-2-year prospecting license period, for reasons ranging from funds to technical considerations.
Mining is carried out through either a mining license or a special mining license or a primary mining license, all three of which confer on the holder thereof the exclusive right to conduct mining operations in or on the area covered by the license. A mining license is granted for a period of 10 years and is renewable for a further period of 10 years. A special mining license is granted for a period of 25 years and is renewable for the estimated life of the ore body or such period as the applicant may request whichever period is shorter. If the holder of a prospecting license has identified a mineral deposit within the prospecting area which is potentially of commercial significance, but it cannot be developed immediately by reason of technical constraints, adverse market conditions or other economic factors of a temporary character, it can apply for a retention license which will entitle the holder thereof to apply for a special mining license when it sees fit to proceed with mining operations.
7
A retention license is valid for a period of five years and is thereafter renewable for a single period of five years. A mineral right may be freely transferred by the holder thereof to another person, except for a mining license, which must have the approval of the Ministry to be assigned.
However, this approval requirement for the assignment of a mining license will not apply if the mining license is assigned to an affiliate company of the holder or to a financial institution or bank as security for any loan or guarantee in respect of mining operations.
A holder of a mineral right may enter into a development agreement with the Ministry to guarantee the fiscal stability of a long-term mining project and make special provision for the payment of royalties, taxes, fees and other fiscal imposts.
We have complied with all applicable requirements and the relevant licenses have been issued.
Environmental Law
We are also subject to Tanzania laws dealing with environmental matters relating to the exploration and development of mining properties. While in the exploration stage, on any of our project areas, we are conscious of any environmental impact we may be having. However, our obligations are very limited, as our activities cause minimal environmental disturbances and are limited to mapping, sampling, trenching, geophysical surveying and drilling. Once project areas reach a point of being commercially feasible for mining then we will be required to conduct proper environmental impact studies based on feasibility reports and planned mining operations. We do protect the environment through any regulations affecting:
| | 1. | Health and Safety |
| | | |
| | 2. | Archaeological Sites |
| | | |
| | 3. | Exploration Access |
Subsidiaries
We have four wholly owned subsidiaries. Kilimanjaro Mining Company Inc., a US corporation, Lake Victoria Resources (T) Limited, Chrysos 197 Company Tanzania Ltd and Jin 179 Company Tanzania Ltd. which are Tanzanian corporations.
Employees
On April 26, 2011, we entered into employment and contract agreements with our officers and directors. Our president David Kalenuik and secretary Heidi Kalenuik agreed to handle our administrative duties. See “Item 11. Executive Compensation – Employment Agreements”, below.
To the extent possible we intend to use the services of subcontractors for manual labor and exploration work on our properties. Lake Victoria Resources (T) Limited, our wholly owned Tanzania subsidiary may hire subcontractors and employees to complete exploration work. A large skilled and unskilled workforce is readily available within Tanzania to satisfy any labour requirements we may have. Through contractors and skilled professional employees we do provide any necessary on the job training to accomplish our exploration objectives.
Much of the information included in this annual report includes or is based upon estimates, projections or other “forward looking statements”. Such forward looking statements include any projections and estimates made by us and our management in connection with our business operations. While these forward-looking statements, and any assumptions upon which they are based, are made in good faith and reflect our current judgment regarding the direction of our business, actual results will almost always vary, sometimes materially, from any estimates, predictions, projections, assumptions or other future performance suggested herein.
8
Such estimates, projections or other “forward looking statements” involve various risks and uncertainties as outlined below. We caution the reader that important factors in some cases have affected and, in the future, could materially affect actual results and cause actual results to differ materially from the results expressed in any such estimates, projections or other “forward looking statements”.
Risks Associated with Mining
All of our properties are in the exploration stage. There is no assurance that we can establish the existence of any mineral resource on any of our properties in commercially exploitable quantities. Until we can do so, we cannot earn any revenues from operations and if we do not do so we will lose all of the funds that we expend on exploration. If we do not discover any mineral resource in a commercially exploitable quantity, our business could fail.
Despite exploration work on our mineral properties, we have not established that any of them contain any mineral reserve, nor can there be any assurance that we will be able to do so. If we do not, our business could fail.
A mineral reserve is defined by the Securities and Exchange Commission in its Industry Guide 7 (which can be viewed over the Internet athttp://www.sec.gov/divisions/corpfin/forms/industry.htm#secguide7) as that part of a mineral deposit which could be economically and legally extracted or produced at the time of the reserve determination. The probability of an individual prospect ever having a “reserve” that meets the requirements of the Securities and Exchange Commission’s Industry Guide 7 is extremely remote; in all probability our mineral resource property does not contain any ‘reserve’ and any funds that we spend on exploration will probably be lost.
Even if we do eventually discover a mineral reserve on one or more of our properties, there can be no assurance that we will be able to develop our properties into producing mines and extract those resources. Both mineral exploration and development involve a high degree of risk and few properties which are explored are ultimately developed into producing mines.
The commercial viability of an established mineral deposit will depend on a number of factors including, by way of example, the size, grade and other attributes of the mineral deposit, the proximity of the resource to infrastructure such as a smelter, roads and a point for shipping, government regulation and market prices. Most of these factors will be beyond our control, and any of them could increase costs and make extraction of any identified mineral resource unprofitable.
Mineral operations are subject to applicable law and government regulation. Even if we discover a mineral resource in a commercially exploitable quantity, these laws and regulations could restrict or prohibit the exploitation of that mineral resource. If we cannot exploit any mineral resource that we might discover on our properties, our business may fail.
Both mineral exploration and extraction require permits from various foreign, federal, state, provincial and local governmental authorities and are governed by laws and regulations, including those with respect to prospecting, mine development, mineral production, transport, export, taxation, labour standards, occupational health, waste disposal, toxic substances, land use, environmental protection, mine safety and other matters. There can be no assurance that we will be able to obtain or maintain any of the permits required for the continued exploration of our mineral properties or for the construction and operation of a mine on our properties at economically viable costs. If we cannot accomplish these objectives, our business could fail.
We believe that we are in compliance with all material laws and regulations that currently apply to our activities but there can be no assurance that we can continue to remain in compliance. Current laws and regulations could be amended and we might not be able to comply with them, as amended. Further, there can be no assurance that we will be able to obtain or maintain all permits necessary for our future operations, or that we will be able to obtain them on reasonable terms. To the extent such approvals are required and are not obtained, we may be delayed or prohibited from proceeding with planned exploration or development of our mineral properties.
9
Our business activities are conducted in Tanzania.
Our mineral exploration activities in Tanzania may be affected in varying degrees by political stability and government regulations relating to the mining industry and foreign investment in that country. The government of Tanzania may institute regulatory policies that adversely affect the exploration and development (if any) ’s properties. Any changes in regulations or shifts in political conditions in this country are beyond the control and may adversely affect its business. Investors should assess the political and regulatory risks related to we’s foreign country investments. Our operations may be affected in varying degrees by government regulations with respect to restrictions on production, price controls, export controls, foreign exchange controls, income taxes, expropriation of property, environmental legislation and mine safety.
We may not have clear title to our properties.
Acquisition of title to mineral properties is a very detailed and time-consuming process, and we’s title to its properties may be affected by prior unregistered agreements or transfers, or undetected defects. Several ’s prospecting licenses are currently subject to renewal by the Ministry of Energy and Minerals of Tanzania. In result, there is a risk that we may not have clear title to all our mineral property interests, or they may be subject to challenge or impugned in the future. We have exploration licenses. We do not have a license to mine any minerals or reserves whatsoever commercially at this time on any part of our properties. Once exploration has advanced to a point where mining on one or more of our properties is feasible, we plan to apply for a mining license or licenses.
If we establish the existence of a mineral resource on any of our properties in a commercially exploitable quantity, we will require additional capital in order to develop the property into a producing mine. If we cannot raise this additional capital, we will not be able to exploit the resource, and our business could fail.
If we do discover mineral resources in commercially exploitable quantities on any of our properties, we will be required to expend substantial sums of money to establish the extent of the resource, develop processes to extract it and develop extraction and processing facilities and infrastructure. Although we may derive substantial benefits from the discovery of a major deposit, there can be no assurance that such a resource will be large enough to justify commercial operations, nor can there be any assurance that we will be able to raise the funds required for development on a timely basis. If we cannot raise the necessary capital or complete the necessary facilities and infrastructure, our business may fail.
Mineral exploration and development is subject to extraordinary operating risks. We do not currently insure against these risks. In the event of a cave-in or similar occurrence, our liability may exceed our resources, which would have an adverse impact on our company.
Mineral exploration, development and production involve many risks, which even a combination of experience, knowledge and careful evaluation may not be able to overcome. Our operations will be subject to all the hazards and risks inherent in the exploration for mineral resources and, if we discover a mineral resource in commercially exploitable quantity, our operations could be subject to all of the hazards and risks inherent in the development and production of resources, including liability for pollution, cave-ins or similar hazards against which we cannot insure or against which we may elect not to insure. Any such event could result in work stoppages and damage to property, including damage to the environment. We do not currently maintain any insurance coverage against these operating hazards nor do we expect to get such insurance for the foreseeable future. If a hazard were to occur, the costs of rectifying the hazard may exceed our asset value and cause us to liquidate all of our assets, resulting in the loss of your entire investment in our company.
Mineral prices are subject to dramatic and unpredictable fluctuations.
We expect to derive revenues, if any, either from the sale of our mineral resource properties or from the extraction and sale of precious and base metals such as gold, silver and copper. The price of those commodities has fluctuated widely in recent years, and is affected by numerous factors beyond our control, including international, economic and political trends, expectations of inflation, currency exchange fluctuations, interest rates, global or regional consumptive patterns, speculative activities and increased production due to new extraction developments and improved extraction and production methods. The effect of these factors on the price of base and precious metals, and therefore the economic viability of any of our exploration properties and projects, cannot accurately be predicted.
10
The mining industry is highly competitive and there is no assurance that we will continue to be successful in acquiring mineral claims. If we cannot continue to acquire properties to explore for mineral resources, we may be required to reduce or cease operations.
The mineral exploration, development, and production industry is largely un-integrated. We compete with other exploration companies looking for mineral resource properties. While we compete with other exploration companies in the effort to locate and acquire mineral resource properties, we will not compete with them for the removal or sales of mineral products from our properties if we should eventually discover the presence of them in quantities sufficient to make production economically feasible. Readily available markets exist worldwide for the sale of mineral products. Therefore, we will likely be able to sell any mineral products that we identify and produce.
In identifying and acquiring mineral resource properties, we compete with many companies possessing greater financial resources and technical facilities. This competition could adversely affect our ability to acquire suitable prospects for exploration in the future. Accordingly, there can be no assurance that we will acquire any interest in additional mineral resource properties that might yield reserves or result in commercial mining operations.
If our costs of exploration are greater than anticipated, then we may not be able to complete the exploration program for our Tanzanian properties without additional financing, of which there is no assurance that we would be able to obtain.
We are proceeding with the initial stages of exploration on our Tanzanian properties. We are carrying out an exploration program that has been recommended by a consulting geologist. This exploration program outlines a budget for completion of the recommended exploration program. However, there is no assurance that our actual costs will not exceed the budgeted costs. Factors that could cause actual costs to exceed budgeted costs include increased prices due to competition for personnel and supplies during the exploration season, unanticipated problems in completing the exploration program and delays experienced in completing the exploration program. Increases in exploration costs could result in our not being able to carry out our exploration program without additional financing. There is no assurance that we would be able to obtain additional financing in this event.
Because of the speculative nature of exploration of mining properties, there is substantial risk that no commercially exploitable minerals will be found and our business will fail.
We are in the initial stage of exploration of our mineral property, and thus have no way to evaluate the likelihood that we will be successful in establishing commercially exploitable reserves of gold, silver or other valuable minerals on our Tanzanian properties.
The search for valuable minerals as a business is extremely risky. We may not find commercially exploitable reserves of gold, silver or other valuable minerals in our mineral property. Exploration for minerals is a speculative venture necessarily involving substantial risk. The expenditures to be made by us on our exploration program may not result in the discovery of commercial quantities of ore. The likelihood of success must be considered in light of the problems, expenses, difficulties, complications and delays encountered in connection with the exploration of the mineral properties that we plan to undertake. Problems such as unusual or unexpected formations and other conditions are involved in mineral exploration and often result in unsuccessful exploration efforts. In such a case, we would be unable to complete our business plan.
Because our executive officers have limited experience in mineral exploration and do not have formal training specific to the technicalities of mineral exploration, there is a higher risk that our business will fail.
Our executive officers have limited experience in mineral exploration and do not have formal training as geologists or in the technical aspects of management of a mineral resource exploration company. As a result of this inexperience, there is a higher risk of our being unable to complete our business plan for the exploration of our mineral property. With no direct training or experience in these areas, our management may not be fully aware of many of the specific requirements related to working within this industry. Our decisions and choices may not take into account standard engineering or managerial approaches mineral resource exploration companies commonly use. Consequently, the lack of training and experience of our management in this industry could result in management making decisions that could result in a reduced likelihood of our being able to locate commercially exploitable reserves on our mineral property with the result that we would not be able to achieve revenues or raise further financing to continue exploration activities. In addition, we will have to rely on the technical services of others with expertise in geological exploration in order for us to carry out our planned exploration program. If we are unable to contract for the services of such individuals, it will make it difficult and maybe impossible to pursue our business plan. There is thus a higher risk that our operations, earnings and ultimate financial success could suffer irreparable harm and our business will likely fail.
11
Risks Relating to Our Common Stock
If we issue additional shares in the future, it will result in the dilution of our existing shareholders.
Our articles of incorporation authorize the issuance of up to 250,000,000 shares of common stock with a par value of $0.00001 per share. Our board of directors may choose to issue some or all of such shares to acquire one or more businesses or to provide additional financing in the future. The issuance of any such shares will reduce the book value and market price of the outstanding shares of our common stock. If we issue any such additional shares, such issuance will reduce the proportionate ownership and voting power of all current shareholders. Further, such issuance may result in a change of control of our corporation.
Our common stock is illiquid and shareholders may be unable to sell their shares.
There is currently a limited market for our common stock and we can provide no assurance to investors that a market will develop. If a market for our common stock does not develop, our shareholders may not be able to re-sell the shares of our common stock that they have purchased and they may lose all of their investment. Public announcements regarding our company, changes in government regulations, conditions in our market segment or changes in earnings estimates by analysts may cause the price of our common shares to fluctuate substantially. In addition, stock prices for junior mineral exploration companies fluctuate widely for reasons that may be unrelated to their operating results. These fluctuations may adversely affect the trading price of our common shares.
Penny stock rules will limit the ability of our stockholders to sell their stock.
The Securities and Exchange Commission has adopted regulations which generally define “penny stock” to be any equity security that has a market price (as defined) less than $5.00 per share or an exercise price of less than $5.00 per share, subject to certain exceptions. Our securities are covered by the penny stock rules, which impose additional sales practice requirements on broker-dealers who sell to persons other than established customers and “accredited investors”. The term “accredited investor” refers generally to institutions with assets in excess of $5,000,000 or individuals with a net worth in excess of $1,000,000 or annual income exceeding $200,000 or $300,000 jointly with their spouse. The penny stock rules require a broker-dealer, prior to a transaction in a penny stock not otherwise exempt from the rules, to deliver a standardized risk disclosure document in a form prepared by the Securities and Exchange Commission which provides information about penny stocks and the nature and level of risks in the penny stock market. The broker-dealer also must provide the customer with current bid and offer quotations for the penny stock, the compensation of the broker-dealer and its salesperson in the transaction and monthly account statements showing the market value of each penny stock held in the customer’s account. The bid and offer quotations, and the broker-dealer and salesperson compensation information, must be given to the customer orally or in writing prior to effecting the transaction and must be given to the customer in writing before or with the customer’s confirmation. In addition, the penny stock rules require that prior to a transaction in a penny stock not otherwise exempt from these rules, the broker-dealer must make a special written determination that the penny stock is a suitable investment for the purchaser and receive the purchaser’s written agreement to the transaction. These disclosure requirements may have the effect of reducing the level of trading activity in the secondary market for the stock that is subject to these penny stock rules. Consequently, these penny stock rules may affect the ability of broker-dealers to trade our securities. We believe that the penny stock rules discourage investor interest in and limit the marketability of our common stock.
The Financial Industry Regulatory Authority, or FINRA, has adopted sales practice requirements which may also limit a shareholder’s ability to buy and sell our stock.
In addition to the “penny stock” rules described above, FINRA has adopted rules that require that in recommending an investment to a customer, a broker-dealer must have reasonable grounds for believing that the investment is suitable for that customer. Prior to recommending speculative low priced securities to their non-institutional customers, broker-dealers must make reasonable efforts to obtain information about the customer’s financial status, tax status, investment objectives and other information. Under interpretations of these rules, FINRA believes that there is a high probability that speculative low priced securities will not be suitable for at least some customers. FINRA requirements make it more difficult for broker-dealers to recommend that their customers buy our common stock, which may limit your ability to buy and sell our stock and have an adverse effect on the market for its shares.
12
Because of the early stage of development and the nature of our business, our securities are considered highly speculative.
Our securities must be considered highly speculative, generally because of the nature of our business and the early stage of our development. We are engaged in the business of identifying, acquiring, exploring and developing commercial reserves of primarily gold and potentially uranium. Our properties are in the exploration stage only and are without known reserves of gold and/or uranium. Accordingly, we have not generated any revenues nor have we realized a profit from our operations to date and there is little likelihood that we will generate any revenues or realize any profits in the short term. Any profitability in the future from our business will be dependent upon locating and developing economic reserves of gold and/or uranium, which itself is subject to numerous risk factors as set forth herein. Since we have not generated any revenues, we will have to raise additional monies through the sale of our equity securities or debt in order to continue our business operations.
We do not intend to pay dividends on any investment in the shares of stock of our company.
We have never paid any cash dividends and currently do not intend to pay any dividends for the foreseeable future. To the extent that we require additional funding currently not provided for in our financing plan, our funding sources may prohibit the payment of a dividend. Because we do not intend to declare dividends, any gain on an investment in our company will need to come through an increase in the stock’s price. This may never happen and investors may lose all of their investment in our company.
Risks Related to Our Company
Our by-laws contain provisions indemnifying our officers and directors.
Our by-laws provide the indemnification of our directors and officers to the fullest extent legally permissible under the Nevada corporate law against all expenses, liability and loss reasonably incurred or suffered by them in connection with any action, suit or proceeding. Furthermore, our by-laws provide that our board of directors may cause our company to purchase and maintain insurance for our directors and officers, and we have implemented director and officer insurance coverage.
Because most of our directors and officers are residents of other countries other than the United States, investors may find it difficult to enforce, within the United States, any judgments obtained against our directors and officers.
Most of our directors and officers are nationals and/or residents of countries other than the United States, and all or a substantial portion of such persons’ assets are located outside the United States. As a result, it may be difficult for investors to enforce within the United States any judgments obtained against our officers or directors, including judgments predicated upon the civil liability provisions of the securities laws of the United States or any state thereof.
| ITEM 1B. | UNRESOLVED STAFF COMMENTS. |
Not applicable.
Executive Offices
As of the date of this report, our executive offices consist of approximately 200 square feet, plus common area, located at Suite 810, 675 West Hastings Street, Vancouver, British Columbia V6B 1N2, Canada. We rent the office at a rate of $1,400 plus tax per month on a month to month basis. We believe that our office space and facilities are sufficient to meet our present needs and do not anticipate any difficulty securing alternative or additional space, as needed, on terms acceptable to us.
13
Mineral Properties
Acquisition of Primary Mining Licenses in Singida, Tanzania
On May 15, 2009, the Company signed a Mineral Financing Agreement with one director of the Company authorizing him, on behalf of the Company, to acquire Primary Mining Licenses (“PMLs”) in the Singida area. As of December 31, 2010, this director has entered into Mineral Properties Sales and Purchase agreements with various PML owners to acquire 60 PMLs in the Singida area. As of March, 31, 2012, the Company has 100% acquired 23 PMLs. On August 9, 2011, the Company relinquished 17 PMLs and the Company has the option to acquire 20 PMLs. Under the terms of these agreements, if the option to purchase is completed on all these PMLs, then the total purchase consideration would be approximately $4,682,075 (TZS7,551,733,325),,outstanding option payments in US Dollar amount is estimated with an exchange rate of 0.00062 as at March 31, 2012), payable by March 09, 2013. Pursuant to the Mineral Financing Agreement, the Company has made payments of $350,512 in fiscal 2012 and $742,180 in fiscal 2011
In September 2009, pursuant to the agreement, we completed an Addendum to the Mineral Properties and Sale and provided notification to all the PML owners involved in Singida Mineral Properties and Sale Agreements that we would extend their due diligence period for an additional 120 days as upon paying $48,782.
On January 19, 2010, we signed second addendums to Singida mineral properties sales and purchase agreements. The addendums revised and extended the second payment of the mineral agreements. The second payment was divided into three payments with $470,927 due on January 27, 2010, $470,927 due on July 27, 2010 and $922,900, due on January 27, 2011.
On July 27, 2010, we signed third addendums to the Singida mineral properties sales and purchase agreements on behalf. The third addendums revised the payment terms of the second addendum. Based on the revised terms, the second installment of $470,927 was divided into two payments, with $281,065 due on July 27, 2010 and $187,426 due on October 24, 2010. We made the payment of $281,065 on July 27, 2010, and the payment of $187,426 on October 26, 2010.
On February 7, 2011, we signed fourth addendums to the Singida mineral properties sales and purchase agreements on behalf. The fourth addendums revised the payment terms of the second addendum. Based on the revised terms, the third installment of approximately $922,900 was divided into three payments, with $92,065 paid on February 9, 2011, $181,998 paid on March 10, 2011 and $646,030 due on August 9, 2011. On August 9, 2011, we relinquished 17 PMLs and paid $350,512 to retain the option to acquire 20 additional PMLs. The option payment of $350,512 was impaired and recorded in the consolidated statement of operations.
On May 6, 2011, we entered into an option and joint venture agreement with Otterburn. On May 20, 2011, we received option payment of $300,770 in cash and 1,100,000 common shares of Otterburn with a fair value of $495,000.
On June 21, 2011, Lake Victoria Resources, a subsidiary, entered into a service agreement with Otterburn to perform all recommended exploration work on optioned properties. As per the agreement, Otterburn agreed to reimburse exploration costs incurred on Singida project from March 2011 up to the day of termination. As of March 31, 2012, we received total reimbursements from Otterburn were $880,258.
On July 8, 2011, Otterburn terminated the option and joint venture agreement. On July 22, 2011, we sold 1,100,000 Otterburn shares to unrelated parties at a price of CAD$0.10 per share.
As of March 31, 2012, under the terms of the mineral properties sales and purchase agreements we have completed option payments in the amount of $2,058,322. Pursuant to the original agreement and the subsequent addendums, we will pay approximately final payment $372,000 on February 08, 2013 and $2,418,000 on March 09, 2013. At the option of the Company, a 2% Net Smelter Production royalty or 2% of the Net Sale Value may be substituted in place of the final payment for each PML.
Acquisition of Prospecting Licenses in Tanzania
14
On April 20, 2011, we entered into a Prospecting License Purchase Agreement with Pili Sadiki, to acquire a 100% interest in a certain prospecting license located in the Kiabakari Musoma District of Tanzania.
On April 20, 2011, we entered into a Prospecting License Purchase Agreement with Rashid Omar, to acquire a 100% interest in a certain prospecting license located in the Handeni Tanga District of Tanzania.
On July 19, 2011, Guardian Investment Ltd, a related party, on behalf of the Company, entered into a mineral properties option agreement to acquire four primary mining licenses within the northern most prospecting license of the seven comprising the Uyowa Gold project.
On March 2, 2012, we were granted one lincese on Geita project for a total consideration of $12,300, of which $6,150 was paid on March 2, 2012 and $6,150 due on July 30, 2012.
On Mach 7, 2012, we were granted one license on Buhamba project for a total consideration of $76,800, of which $6,800 was paid on March 7, $35,000 due on June 5, 2012 and $35,000 due on September 3, 2012.
On March 7, 2012, we were granted one lincese on Handeni project for a total consideration of $4,800, of which $2,400 was paid on March 7, 2012 and $2,400 due on August 14, 2012.
Termination of Option and Joint Venture Agreements
On July 8, 2011, Otterburn Ventures Inc. exercised its rights to terminate four option and joint venture agreements dated May 6, 2011 between Otterburn and we, pursuant to which we granted Otterburn the right to acquire up to an undivided 70% interest in and to certain primary mining licenses and prospecting licenses owned by us known as the Singida Gold Project, North Mara Gold Project, Kalemela Gold Project and Geita Gold Project and Otterburn paid the cash payment of $497,423 and issued 2,200,000 of its common shares to our company. In connection with the termination of the option agreements:
| | (i) | Otterburn agreed to pay such applicable Tanzanian government fees to leave the respective licenses in good standing for a period six months from July 8, 2011. |
| | | |
| | (ii) | Otterburn terminated the exploration service agreement dated May 20, 2011 between Otterburn, Lake Victoria Resources (T) Ltd., our wholly-owned subsidiary, and and agree to pay a reimbursement for the work expenditures incurred by Otterburn during the months of March through the termination date of July 8, 2011 and, if required, certain termination costs, provided such termination costs have been incurred in accordance with the exploration service agreement. |
| | | |
| | (iii) | Otterburn agreed to repurchase the 2,200,000 common shares of Otterburn that we received pursuant to the Option Agreements at a price of $0.10 per share. |
Licenses
The following two charts are complete lists of each gold and uranium prospecting license that we own by project name, license number, the area of location, district of its location and the size in square kilometers. We own no prospecting property other than the following licenses listed on these two charts. There are no known reserves on these properties and any proposed programs by us are exploratory in nature.
Gold Projects and License List
| Project | License No | Area | District | Size | Ownership |
| | | | | (SqKm) | |
| KALEMELA | | | | | |
| | PL 5892/2009 | Magu | Magu | 29.67 | Relinquish |
| | | | | | ed in May, |
| | PL 5912/2009 | Magu | Magu | 56.74 | 2012. New |
| | | | | | application |
15
Project
| License No
| Area
| District
| Size
(SqKm) | Ownership
|
| | | | | | sumbitted |
| | | | | | |
| | | | | | Relinquish |
| | PL 5988/2009 | Bunda South | Magu | 38.92 | ed in May |
| | | | | | 2012 |
| | | | | 125.33 | |
| GEITA | | | | | |
| | HQ-P24628 | Geita | Geita | 1.48 | In Process |
| | PL 5958/2009 | Geita | Geita | 20.85 | Owned |
| | | | | 22.33 | |
| MUSOMA BUNDA | | | | | |
| Murangi | PL 4511/2007 | Masinono | Musoma | 25.82 | Owned |
| Suguti | PL 3966/2006 | Suguti | Musoma | 36.30 | Owned |
| Kinyambwiga | PL 4653/2007 | Kinyambwiga | Musoma | 30.89 | Owned |
| Kinyambwiga -24 PMLs | | Kinyambwiga | Musoma | 2 | Owned |
| | | | | 93.01 | |
| SINGIDA | | | | | |
| 23 PMLs | | Singida - Londoni | Singida | 3.27 | Owned |
| 20 PMLs | | Singida - Londoni | Singida | 1.91 | Optioned |
| | | | | 5.18 | |
| BUHEMBA | | | | | |
| | PL7142/2011 | Buhemba | Kiabakari | 14.94 | Owned |
| | PL 5919/2009 | Buhemba | Serengeti | 34.92 | Owned |
| | HQ-P23869 | Buhemba | Majimoto | 19.19 | In Process |
| | | | | 69.05 | |
| UYOWA | | | | | |
| | PL 4531/2007 | Uyowa | Urambo | 47.33 | Owned |
| | PL 3425/2005 | Uyowa | Uyowa | 42.14 | Owned |
| | PL7245/2011 | Uyowa | Urambo | 199.04 | Owned |
| | PL 5916/2009 | Uyowa | Urambo | 49.89 | Owned |
| | PL 4749/2007 | Kisimani River and Iseramigas | Urambo | 17.03 | Owned |
| | PL 5153/2008 | Uyowa | Uyowa | 65.07 | Owned |
| | 4 PMLs | Uyowa | Uyowa | 0.34 | Optioned |
| | | | | 420.5 | |
| Handeni Project | | | | | |
| | PL7148/2011 | Manga | Handeni | 12.03 | Owned |
| | HQ-P24233 | Handeni | Tanga | 170.40 | In Process |
| | | | | 182.43 | |
| KAHAMA | | | | | |
| | PL 3439/2005 | Salawe | Shinyanga | 11.81 | Owned |
| | PL6437/2011 | Kahama South | Kahama | 183.05 | Owned |
16
Project
| License No
| Area
| District
| Size
(SqKm) | Ownership
|
| | PL6341/2010 | Kahama | Kahama | 60.79 | Owned |
| | | | | 255.65 | |
| NORTH MARA | | | | | |
| Tarime | PL 4882/2007 | Tarime | Nyagisa/Tarime | 30.79 | Owned |
| Tarime | PL 3340/2005 | Ikoma | Tarime | 48.19 | Owned |
| Tarime | PL 4873/2007 | Tarime | Tarime | 19.91 | Owned |
| Tarime | PL 3341/2005 | Utegi | Tarime | 12.68 | Owned |
| Tarime | PL 4225/2007 | Kiagata | Musoma | 21.17 | Owned |
| Nyabigena East | PL 3355/2005 | Nyamwanga/Nyam ongo | Tarime | 6.19 | Expired in June 2012 |
| Kubaisi Kiserya | PL 4833/2007 | Kiterere Hills | Tarime & Serengeti | 19.91 | Owned |
| | | | | 158.12 | |
| 29 Prospecting Licenses (PLs) - Total SqKm | | | 1,326.45 | |
| 71 Primary Mining Licenses (PMLs)- Total SqKm | | | 7.52 | |
Uranium Projects and License List
| Project | License No | Area | District | Size (SqKm) | Ownership |
| MBINGA | | | | | |
| | PL6342/2010 | Mbinga | Mbinga | 199.40 | Owned |
| | PL6509/2010 | Litembo | Mbinga | 199.97 | Owned |
| | | | | 399.37 | |
| | | | | | |
| KIWIRA | | | | | |
| | PL4651/2007 | Makete | Makete & Kyela | 86.11 | Owned |
| | PL4514/2007 | Kyela | Kyela | 69.44 | Owned |
| | | | | 155.55 | |
| | | | | | |
| NJOMBE | | | | | |
| | PL6526/2010 | Njombe | Makete | 199.13 | Owned |
| | | | | 199.13 | |
| | | | | | |
| LAKE RUKWA | | | | |
| | PL6519/2010 | Chunya | Mbeya | 199.02 | Owned |
| | | | | 199.02 | |
| | | | | | |
| 6 Prospecting and Reconnaissance Licenses - Total (Sqkm) | | 953.07 | |
17
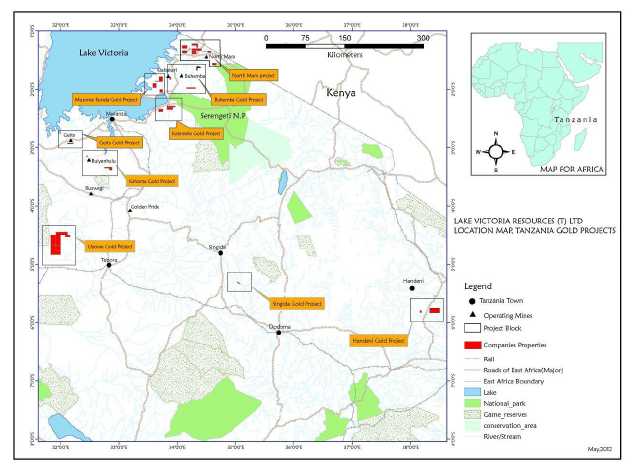
Prospective Projects and Properties
The following map is a gold project location map. For a detailed listing see Licenses – Gold Projects and License List
Gold Project Location Map, March 2012
18
The following map is a uranium project location map. The “red” is the outline of all of our individual Prospecting Licenses (PLs or PLRs) that are combined to make a project. Our projects are outlined in “grey”. For a detailed listing see Licenses – Uranium Projects and License List
Uranium Location Map, March 2011

Prospective Gold Projects
The following is a brief overview of our portfolio of prospective mineral properties, the exploration developments on them where applicable and some of the details of the historical option agreements for them. During the fiscal year ended March 31, 2012, our exploration work was primarily concentrated on the Singida, Kinyambwiga, Uyowa and North Mara gold projects.
Musoma Bunda Murangi Gold Project
Exploration Strategy
The Company recently purchased a mobile auger rig to provide soil sampling services to its gold projects
Much of the low-lying areas, including the drainages around Lake Victoria, in the northern part of Tanzania, are covered by a blanket of dark grey clays known as Black Cotton Soil or locally as “mbuga” clays. These clays, believed to be lacustrine sediments derived from periodic flooding of Lake Victoria, have masked the underlying land surface, covering both in-situ soils and rock outcrops and allowing little to no chemical dispersion from the underlying substrate to pass through to the surface. Depths of the “mbuga” vary between a few centimetres to in excess of 10 meters thick. Exploration for mineral deposits is thus both difficult and costly.
Exploration over these “mbuga” covered areas is largely done by various geophysical techniques to map out the geophysical properties of the underlying rock sequences and the structural imprint in order to interpret potential gold targets. Follow up drilling is required to test these targets.
19
The Company intends to test the geophysical targets interpreted across many of their “mbuga” covered Project areas, including but not limited to the Suguti, Murangi, Kinyambwiga, Kalemela and the Tarime licenses in the Lake Victoria District by utilising the recently acquired auger rig to sample the soil/saprock interface beneath the “mbuga” by systematic sampling programmes. The auger rig has the capability to drill holes to depths in excess of 20 meters and, with the specially designed sampling tool, can collect a sample at the bottom of the hole.
Exploration work has been focused on the Kinyambwiga and Suguti licenses.
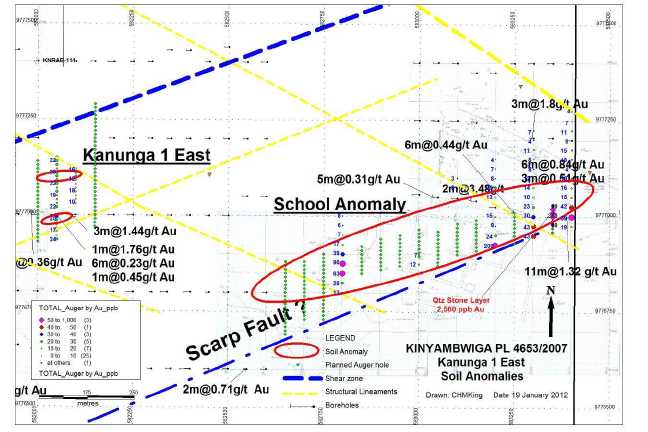
Kinyambwiga PL4653/2007
Exploration has been focused around Kanunga 1 Prospect as a continuation of the exploration activities undertaken during the 3rdQuarter which included:
| i. | Schlumberger N-S profiles (17) completed along strike to the east and west of Kanunga 1 Prospect delineated 2 distinct chargeability anomalies consistent with the strike of the known structure (Map 1) |
Map 1: Plan showing the location of the Schlumberger IP profiles across the interpolated mineralized structure of Kanunga 1.

| ii. | Follow-up pitting and soil sampling, in which 135 soil samples were collected, was undertaken on 4 target areas: |
| | | |
| | Kanunga 1 Far East – within the Kanunga school perimeter and close to the eastern boundary licence. Soil sampling on 25 meters centers along 100 meter spaced N-S traverses on either side of the school did reveal a slight increase in anomalous soil values from 30 to 200 ppb Au (Map 2). |
| | Kanunga 1 East – some 400 metres east along strike of the artisanal working at Kanunga 1. Two N-S traverse lines spaced 50m apart and sampled at an interval of 10 metres returned low, although anomalous gold values ranging from 10 to 30 ppb gold and include 2 narrow ENE trending zones of 24-30 ppb gold. |
| | Kanunga 1 West – 300 meters east of an interpolated intrusive body. Sampling undertaken along 3 N-S traverses spaced 100 meters apart on a sample interval of 25 meters. Results returned low gold-in-soil anomalies ranging between 18 to 30 ppb Au. Repeat sampling taken at the sample position that returned 400 ppb Au (2009) returned 25 ppb Au (Map 2). |
20
| | Schlumberger coincident chargeability/resistivity anomalies. Samples collected from pits spaced 10 meters apart across the IP anomaly, returned low gold values of <14ppb gold. |
Map 2: Plan showing the position of soil anomalies

| iii. | Pitting and trenching programs were undertaken at Kanunga Far East to validate the anomalous Rotary Air Blast (RAB) intercepts reported in 2009. Of the planned 94 meters of trenching, only 76 meters were completed due to the presence of the school. Granite was encountered in all the trenches with no gold values. However, a sample of the quartz stone layer lying above the basement granite did return a value of 2.28 g/t Au. In conclusion, it appears that the anomalous RAB intercepts may have been the result of contamination from the stone layer and therefore would not represent an in situ anomaly. |
iv. Auger drilling
The auger rig arrived in country in November 2011 and has been deployed in testing the immediate strike extensions of the subsurface Kanunga 1 gold vein at the Kinyambwiga Prospect. A number of additional N-S sample traverses have been undertaken further east along strike of the Kanunga 1 vein to validate previously reported soil anomalies
(Table 1).
Table 1. Auger drill programme - Kinyambwiga Project
21
| | | | | | | | Planned | Drilled | Total | |
| Prospect | Section | From | To | Lens | Interval | Spacing | Holes | Holes | Metres | |
| KANUNGA | | | | | | | | | | |
| 1 | 581020E | 9776805 | 9776815 | 2 | 10 | 5 | 3 | 3 | 9 | completed |
| | | | | | | | | | | |
| EXT-WEST | | 9776840 | 9776850 | 1 | 10 | 5 | 3 | 3 | 7.1 | completed |
| | | | | | | | | | | |
| | 580980E | 9776785 | 9776800 | 2 | 15 | 5 | 4 | 4 | 11.5 | completed |
| | | | | | | | | | | |
| | | 9776810 | 9776830 | 1 | 20 | 5 | 5 | 5 | 8.8 | completed |
| | | | | | | | | | | |
| | 580940E | 9776765 | 9776785 | 2 | 20 | 5 | 5 | 5 | 14 | completed |
| | | | | | | | | | | |
| | | 9776795 | 9776815 | 1 | 20 | 5 | 5 | 5 | 14 | completed |
| | | | | | | | | | | |
| | 580900E | 9776740 | 9776795 | 2 | 55 | 5 | 10 | 10 | 5.6 | completed |
| | | | | | | | | | | |
| KANUNGA | 581180E | 9776940 | 9777010 | 2 | 70 | 5 | 15 | 0 | | All in rice pads |
| 1 | | | | | | | | | | |
| EXT-EAST | 581250E | 9776975 | 9777015 | | 40 | 5 | 9 | 0 | | All in rice pads |
| | | | | | | | | | | |
| SCHOOL | 583250E | 9776940 | 9777000 | | 60 | 10 | 7 | 7 | | The same as the third line |
| | | | | | | | | | | below |
| | | | | | | | | | | |
| | | | | | | | | | | Extra sample of the quartz |
| SOIL | 583350E | 9776960 | 9777030 | | 70 | 10 | 8 | 8 | 22.5 | stone line was taken - not |
| | | | | | | | | | | included in this total |
| | | | | | | | | | | |
| ANOMALY | 583250E | 9776930 | 9777010 | | 80 | 10 | 9 | 9 | | |
| | | | | | | | | | | |
| | | | | | | | | | | 8 holes were drilled. Only |
| | 583150E | 9776910 | 9776990 | | 80 | 10 | 9 | 8 | 46 | one hole at 9776920 was |
| | | | | | | | | | | not drilled(Bricks) |
| | | | | | | | | | | |
| | 583100E | 9776900 | 9776980 | | 80 | 10 | 9 | 9 | 23.3 | completed |
| | | | | | | | | | | |
| | 583050E | 9776870 | 9776960 | | 90 | 10 | 10 | 6 | | only 6 holes were drilled |
| | | | | | | | | | | |
| | 583000E | 9776895 | 9776965 | | 70 | 10 | 8 | 8 | 14.4 | completed |
| | | | | | | | | | | |
| | 582950E | 9776870 | 9776950 | | 80 | 10 | 9 | 0 | | in cultivated farm(maize) |
| | | | | | | | | | | |
| | 582900E | 9776860 | 9776940 | | 80 | 10 | 9 | 0 | | in cultivated farm(maize) |
| | | | | | | | | | | |
| | 582850E | 9776850 | 9776920 | | 70 | 10 | 8 | 0 | | in cultivated farm(maize) |
| | | | | | | | | | | |
| | | | | | | | | | | only 5 holes were drilled, at |
| | | | | | | | | | | 9776900,9776890,9776880 |
| | 582750E | 9776730 | 9776900 | | 170 | 10 | 18 | 5 | 13.1 | ,9776870 and 9776860, |
| | | | | | | | | | | other points are in |
| | | | | | | | | | | cultivated farm(cotton) |
| | | | | | | | | | | |
| | | | | | | | | | | only 4 holes were drilled at |
| | | | | | | | | | | 9776860,9776870,9776880 |
| | 582700E | 9776730 | 9776890 | | 160 | 10 | 17 | 4 | 14.2 | and 9776890.The other |
| | | | | | | | | | | points are within cultivated |
| | | | | | | | | | | farm(cotton) |
| | | | | | | | | | | |
| | | | | | | | | | | only one hole at 9776880. |
| | 582650E | 9776690 | 9776880 | | 190 | 10 | 20 | 1 | 4.5 | The other remaining are |
| | | | | | | | | | | within cultivated |
| | | | | | | | | | | farm(cotton) |
| KANUNGA | | | | | | | | | | |
| 1 | 582000E | 9776930 | 9777140 | | 210 | 10 | 22 | 10 | 8.5 | |
| | | | | | | | | | | |
| | | | | | | | | | | only 20 holes were drilled |
| | | | | | | | | | | from 9776970 to 9777160 , |
| | 582150E | 9776970 | 9777290 | | 320 | 10 | 33 | 20 | 36 | the other are in cultivated |
| | | | | | | | | | | farm |
| | | | | | | | | | | |
| KANUNGA | 579000E | 9776750 | 9776870 | | 120 | 10 | 13 | 0 | | within settlements |
| 1 | | | | | | | | | | |
| WEST | | | | | | | | | | |
| (Intrusive) | 578900E | 9776750 | 9776860 | | 110 | 10 | 12 | 12 | 26.7 | all completed |
| | | | | | | | | | | |
| KANUNGA | 581120E | 9777990 | 9778050 | | 60 | 5 | 13 | 0 | | within cultivated farm |
| 3 | | | | | | | | | | |
| | 581050E | 9778000 | 9778050 | | 50 | 5 | 11 | 0 | | within cultivated farm |
| | | | | | | | | | | |
| | 581200E | 9778090 | 9778110 | | 20 | 5 | 5 | 5 | 9.9 | completed |
| | | | | | | | | | | |
| | | | | | | | | | | only one bore hole at |
| | 581150E | 9778090 | 9778110 | | 20 | 5 | 5 | 1 | 2 | 9778100,The other points |
| | | | | | | | | | | are in cultivated |
| | | | | | | | | | | farm(cotton) |
| | | | | | | | | | | |
| | 581100E | 9778070 | 9778105 | | 35 | 5 | 8 | 1 | 1.8 | only one hole at 9778105 |
| | | | | | | | | | | was drilled |
| TOTAL | | | | | | | 322 | 142 | | |
22
Results
A total of 142 auger holes were drilled on Kinyambwiga during the latter part of 2011 and early 2012. Progress was seriously hampered by the onset of the rainy season coupled with local cultivation. The samples (44) collected during 2011 were submitted for 50gm Fire Assay analysis whereas those samples (96) collected during 2012 were submitted for 500 gm BLEG analysis for gold except for 7 rock samples collected from the stone layer that were fire assayed (no sample was collected from one auger hole due to encountering water down-hole).
The thickness of “mbuga” cover was found to average 2.61 meters. Sampling of the immediate underlying granitic saprock was taken with care in order to ensure no contamination with the overlying “mbuga” clays. Logging of the auger hole is undertaken on site, a 1 kilo sample is collected at the bottom of the hole with the designed sample catcher, emptied into a plastic sample bag, labeled and stapled closed. The sample is then packed with the other samples in a rice sack and kept in the vehicle until the end of the day when the samples are returned for safe keeping at the field camp.
Results are shown inTable 2.
Table 2. Summary of Auger drill sample results
| Grade Au (ppb) | No of samples |
| <10 | 57 |
| 10-20 | 53 |
| 20-30 | 15 |
| 30-40 | 7 |
| 40-50 | 1 |
| 50-100 | 4 |
| >100 | 10 |
| TOTAL | 147 |
(Max value 2.56g/t Au)
The results of sampling the quartz stone layer (7 samples) varied from 156 ppb gold to 2.56g/t gold. Five additional samples were collected from different auger holes, the results of which are included inTable 3.
A number of N-S sample traverses on a sample spacing of 5 meters was completed on the western end of the known Kanunga 1 mineralised quartz veins in an attempt to detect the western strike extension of both Lens 1 and 2.
Slightly anomalous gold values of between 20 to 40 ppb were detected in the expected strike position of both lenses for a distance of between 40 to 80 meters along strike before dropping to below detection limit (Map 3).
23
Map 3: Plan of Kanunga 1 Prospect showing results of Auger drill fences in tracing westerly strike of gold veins

One N-S drill fence of 8 Auger holes, spaced 10 meters apart, was completed on the eastern side of the Kanunga School Anomaly. Results indicate a cluster of anomalous values ranging between 30 ppb to 180 ppb gold and averageing 77 ppb gold over a 40 meter interval. A sample of the quartz stone layer was collect for analysis which returned 2.56 g/t gold. It is the same stone layer, located on the contact between the gramite and overlying “mbuga” and representing a transported horizon that is responsible for the anomalous gold values noted in the RAB holes to the north (Map 4).
Future work
The anomalous stone layer as well as the soil anomaly over the school requires further investigation. Once the crops have been harvested, a number of auger drill traverses are planned to test the strike towards the SW where a number of anomalous soil samples have been indicated(Map 4).
Map 4: Kanunga 1 East and School soil anomalies
24
Suguti (PL3966/2006)
Previous exploration undertaken during the course of 2011, has focused mainly on the northern part of the Suguti Licence, north of the major NW trending Suguti Fault zone which bisects the the central part of the licence.
Exploration has included:
| | i. | Ground Magnetic survey |
| | ii. | IP Gradient survey |
| | iii. | Regional Soil sampling surveys on 400 meter x 50 meter grid (554 samples) . |
| | | Regolith and geological mapping. Exposure is limited to minor rock out crops on the northern side of the Suguti Fault. Granite, containing magnetite, occurs as a hill in the northern part of the license. The granite/greenstone contact is masked by coarse textured laterite consisting of laterised basaltic and quartz fragments. The underlying greenstone rocks have been intensely sheared and iron stained along to the NW-SE trending granite contact. Brick-red soils make up the NE part of the license before being masked by the overlying “mbuga” further south. |
| | | The southern part of the licence, south of the Suguti fault comprises of hills of Banded Iron Formation. |
| | iv. | Infill soil sampling surveys on 25 meter centers along the existing soil sample traverses at Target 1 and 2, were completed during 2ndquarter 2011 (106 samples). A number of low order threshold soil anomalies, attaining a maximum of 50 ppb gold, appear to form at least three NE trending, parallel zones of up to 2.5 kilometers strike length (Target 1). |
| | v. | Pitting. |
| | | Orientation pits were dug to determine the depth of the “mbuga” as well as to test the contact between the granite and the greenstone rocks in the northern part of the licence. A total of 14 pits were dug, and on average, the thickness of the “mbuga” varied between 0.8 to 1.20 meters (Table 2). Results are shown in Table 3 and on Map 5. |
25
Table 3: Pits indicate the depth of the underlying lithologies in the northern part of Suguti Licence.
SUGUTI |
Target |
Section |
Stations | Mbuga
Depth (m) | Laterite
Depth(m) | Pits
Depth(m) |
Sample No |
Au ppb |
Lithology |
| Suguti NW | 2 | 578000 | 9802150 | 0.40 | 0.90 | 1.60 | A32105 | <10 | Saprock |
| | 2 | 578000 | 9802174 | 0.30 | 0.30 | 1.40 | A32106 | 10 | Saprock |
| | 2 | 578002 | 9802201 | 0.60 | - | 1.60 | A32107 | <10 | Granite |
| | 2 | 578000 | 9802224 | 0.60 | - | 0.90 | A32108 | 20 | Granite |
| | | | | | | | | | |
| | 2 | 577601 | 9802298 | 0.80 | 0.70 | 1.80 | A32109 | <10 | Saprock |
| | 2 | 577602 | 9802326 | 0.80 | 0.20 | 1.20 | A32110 | <10 | Saprock |
| | 2 | 577597 | 9802348 | 0.60 | 0.50 | 1.50 | A32111 | <10 | Granite |
| | 2 | 577596 | 9802372 | 0.70 | 0.70 | 1.60 | A32112 | <10 | Granite |
| | | | | | | | | | |
| | 2 | 577200 | 9802352 | 0.80 | - | 1.40 | A32113 | <0.01 | Dk grey soil |
| | 2 | 577201 | 9802372 | 0.90 | - | 1.40 | A32114 | 0.01 | Dk grey soil |
| | 2 | 577201 | 9802400 | 0.80 | - | 1.40 | A32115 | pending | Dk grey soil |
| | 2 | 577200 | 9802420 | 0.90 | - | 1.40 | A32116 | pending | Granite |
| | 2 | 577198 | 9802446 | 0.90 | - | 1.30 | A32117 | pending | Granite |
| | | 577198 | 9802478 | 0.70 | - | 1.30 | A32118 | pending | Granite |
All Arsenic values below detection limit (<20 ppm)
| | | Most of the pits encountered granite and failed to intersect the greenstone lithologies whose contact is further south than expected. Consequently the samples collected were barren of gold. |
| | vi. | Schlumberger VES survey. Five N-S profiles totaling 3.6 line-kilometers have been planned across Targets 1 and 2 (Table 4). One N-S profile of 1200 meters in length has been completed on the eastern side of Target 1. Results revealed two sets of coincident chargeability/resistivity anomalies underlying two of the 3 ENE trending soil anomalies in Target 1 (Map 5). |
26
Map 5: Residual Gradient IP map of the Suguti North Prospect showing main lithologic contacts, soil anomalies, termitaria and Schlumberger VES surveys across Targets 1 and 2.
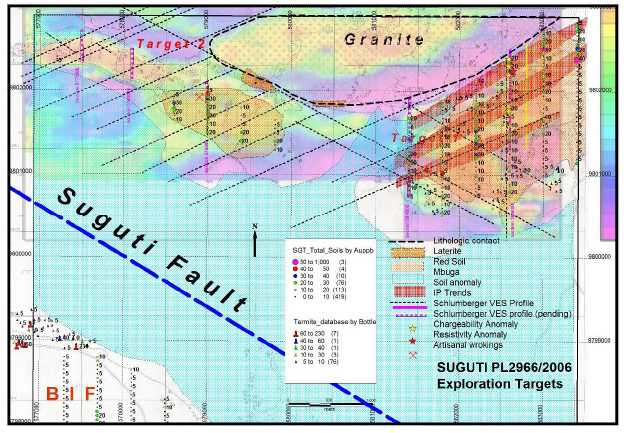
Table 4: Schlumberger VES survey proposed across Targets 1 and 2, Suguti North prospect
| | | | From | To | | |
| Target | Section | Easting | Northing | Northing | Length | Status |
| 1 | 582600E | 582600 | 9802500 | 9802100 | 400 | Completed |
| 1 | | 582600 | 9802100 | 9801700 | 400 | Completed |
| 1 | | 582600 | 9801700 | 9801300 | 400 | Completed |
| 1 | 581400E | 581400 | 9801900 | 9801500 | 400 | Pending |
| 1 | | 581400 | 9801500 | 9801100 | 400 | Pending |
| 1 | | 581400 | 9801100 | 9800700 | 400 | Pending |
| 2 | 579000E | 579000 | 9802100 | 9801700 | 400 | Pending |
| 2 | 578100E | 578100 | 9802500 | 9802100 | 400 | Pending |
| 2 | 577500E | 577500 | 9802700 | 9802300 | 400 | Pending |
| | vii. | Termite samples |
| | | |
| | | Termite sampling has been undertaken across the brown-red soils over Target 1 and in the south of the PL. A total of 89 samples have been collected and have been assayed. Results are generally poor (below detection limit). However, a single anomalous termite mound, located within the soil anomaly of Target 1, returned 70 ppb Au. |
| | | |
| | | A cluster of termites were sampled close to the contact with the lower slopes of the BIF outcrop and the “mbuga” cover on the south-western side of the PL, south of the Suguti Fault. A number of anomalous termite mounds ranging from 40 to 230 ppb gold was identified (Map 5). |
27
| | viii. | Additional infill sampling along 200 metre spaced N-S travers lines at sample interval of x 25 meters was completed across Target 1 and 2. (Table 5). |
Table 5. Infill soil sample traverses across Targets 1 and 2
| | | From | To | | |
Target |
Easting |
Northing |
Length |
No of samples |
| 1 | 582000 | 9801450 | 9801050 | 400 | 17 |
| 1 | 582400 | 9801650 | 9801250 | 400 | 17 |
| 1 | | 9802300 | 9801900 | 400 | 17 |
| 1 | 581600 | 9801300 | 9800950 | 350 | 15 |
| 1 | 583200 | 9802750 | 9802200 | 550 | 23 |
| 1 | 583800 | 9802500 | 9802050 | 450 | 19 |
| 2 | 578800 | 9802000 | 9801750 | 250 | 11 |
| Total | | | | | 119 |
| | ix. | The auger rig, recently purchased by Lake Victoria Resources was mobolised onto the Suguti Project within the 1stquarter of 2012 in order to test the strike extend of the known soil anomalies beneath the “mbuga” cover within the Suguti Fault basin. An initial programme of some 460 holes were initially planned along a number of N-S traverses on a collar spacing (sample positions) of 20 meters apart but was increased to over 1000 holes (Phase 2). Due to cultivated fields less than 50% of the planned holes could be drilled (Table 6 , Map 6) |
Table 6. Auger drill programme to trace the soil anomalies beneath the “mbuga” cover
| TARGETS-Phase 1 | NORTHINGS | | | | | | |
TARGET 1
|
SECTION |
FROM |
TO |
INTERVA
L |
SPACIN
G | TOTAL
HOLES
PLANNED | TOTAL
METRE
S | TOTAL
HOLES
DRILLED |
Comments |
| 581600E | 9800950 | 9801800 | 850 | 10 | 86 | | 0 | In cultivated farms (rice) |
| 581000E | 9800750 | 9801550 | 800 | 10 | 81 | | 0 | In cultivated farms (rice) |
| 580600E | 9800600 | 9801400 | 800 | 10 | 81 | 169.4 | 34 | In cultivated farms (rice) |
| 580200E | 9800400 | 9801200 | 800 | 10 | 81 | 232 | 36 | In cultivated farms (rice) |
| 579800E | 9800200 | 9801000 | 800 | 10 | 81 | 251.6 | 23 | In cultivated farms (rice) |
| 579400E | 9800150 | 9800950 | 800 | 10 | 81 | 58.3 | 3 | In cultivated farms (rice) |
TARGET 2
| 579200E | 9801850 | 9802100 | 250 | 10 | 26 | 32 | 26 | Completed |
| 578800E | 9801800 | 9802050 | 250 | 10 | 26 | 45.1 | 26 | Completed |
| 578400E | 9801650 | 9801800 | 150 | 10 | 16 | 35.1 | 16 | Completed |
| 578000E | 9801450 | 9801800 | 350 | 10 | 36 | 96 | 15 | In cultivated farms (rice) |
| 577600E | 9801350 | 9801700 | 350 | 10 | 36 | 27.8 | 3 | In cultivated farms (rice) |
TARGET 3
| 577700E | 9798810 | 9799650 | 840 | 10 | 85 | 187 | 40 | In cultivated farms (rice) |
| 577300E | 9798850 | 9799750 | 900 | 10 | 91 | 282.2 | 52 | In cultivated farms (rice) |
| 576900E | 9798800 | 9799650 | 850 | 10 | 86 | 188 | 40 | In cultivated farms (rice) |
28
| Sub-Total | 893 | 1604.5 | 314 | |
| Target 1 | Phase 2 |
| Zone 1 | 581200E | 9801650 | 9801500 | 150 | 10 | 16 | 51 | 10 | In cultivated farms (rice) |
| Zone 2 | 581200E | 9801250 | 9801050 | 200 | 10 | 19 | 0 | 0 | In cultivated farms (rice) |
| Zone 3 | 581200E | 9800950 | 9800800 | 150 | 10 | 16 | 40.8 | 8 | In cultivated farms (rice) |
| Zone 1 | 582000E | 9802000 | 9801850 | 150 | 10 | 16 | 66.3 | 13 | In cultivated farms (rice) |
| Zone 2 | 582000E | 9801650 | 9801450 | 200 | 10 | 22 | 112.2 | 22 | Completed |
| Zone 3 | 582000E | 9801300 | 9801150 | 150 | 10 | 16 | 81.6 | 16 | Completed |
| Zone 1 | 582800E | 9802500 | 9802350 | 150 | 10 | 16 | 81.6 | 16 | Completed |
| Zone 2 | 582800E | 9802150 | 9801900 | 250 | 10 | 26 | 132.6 | 26 | Completed |
| Zone 3 | 582800E | 9801600 | 9801500 | 100 | 10 | 11 | 56.1 | 11 | Completed |
| TERMITE | 576800E | 9799000 | 9798900 | 100 | 10 | 12 | 61.2 | 12 | Completed |
| Sub-Total | 170 | 683.4 | 134 | |
| TOTAL | 1063 | 2288 | 448 | |
Map 6: Auger drill programme (Phase 1 & 2)
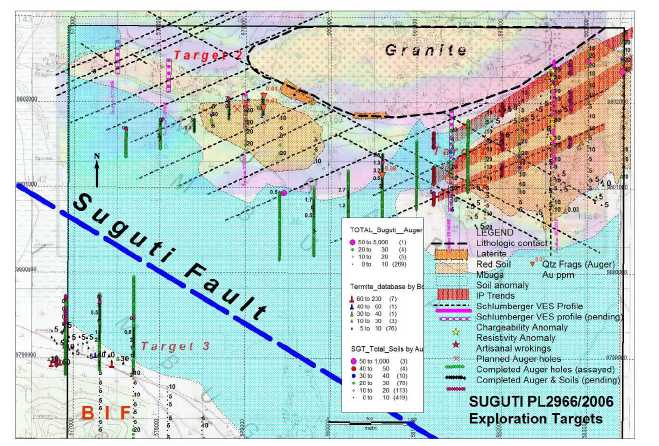
Results
29
Summary of results from samples collected from the interface between the black cotton soil (“mbuga”) and the underlying granite basement as shown onTable 7.
Table 7. Summary of assay results from Auger drilling excluding 22 QA-QC samples.
| Grade Au (ppb) | No of samples |
| <1 | 27 |
| 1-10 | 268 |
| 10-20 | 8 |
| 20-30 | 4 |
| 30-40 | - |
| 40-50 | - |
| >50 | 1 |
| TOTAL | 308 |
| (Max value 220 ppb Au) | |
| Samples pending submission | 140 (+7QA-QC) |
No significant soil anomalies were delineated other than one value of 220 ppb gold situated some 2 kilometers along strike to the SW of Zone 1, Target 1. Due to cultivated rice paddies across the “mbuga” flats, no further drilling is possible until after the rainy season and the crops have been harvested.
Three auger holes encountered a quartz rich stone layer at the base of the Mbuga cover. The quartz fragments were submitted for 50 gm Fire assay and results are shown inTable 8andMap 7.
Table 8.Results of sampling the quartz layer between the mbuga cover and the basement rocks
| AHID | Easting | Northing | Sample_ Id | Depth (m) | Au ppm | Description |
| SAG026 | 580600 | 9801150 | A22545 | 6.7 | 0.08 | Stone layer with qtz fragments |
| SAG105 | 579205 | 9801934 | A22627 | 0.8 | 0.01 | Stone layer with qtz fragments |
| SAG119 | 579210 | 9802070 | A22648 | 1.3 | 0.01 | Stone layer with qtz fragments |
30
Future Exploration
Since results from the auger holes drilled across the interpolated strike extensions of all three target zones failed to encounter any significant gold mineralisation beneath the mbuga, further exploration is to be focused mainly at Target 1 and 3 across the known soil anomalies. Infill soil sampling, including Auger drilling over mbuga covered areas, has been undertaken along 200 meter N-S traverse line on 10 meter sample intervals in order to define the present soil anomalies (Table – work programme). To date 157 samples (excluding 8 QA-QC samples) including 84 auger drill samples, have been collected and are pending submission to SGS laboratories Mwanza. Results will determine whether a trenching programme is warranted across the targets.
Additional auger drill sampling is planned to be undertaken over the cultivated areas once the crops (rice) have been harvested to follow up on the 200 ppb gold anomaly as well as the strike extensions of Zone 1, 2 and 3 of Target 1, where no sampling has yet been undertaken (Map 7).
Map 7:Current state of exploration on the Suguti Licence showing present coverage of Auger drill and soil sampling across 3 target areas.
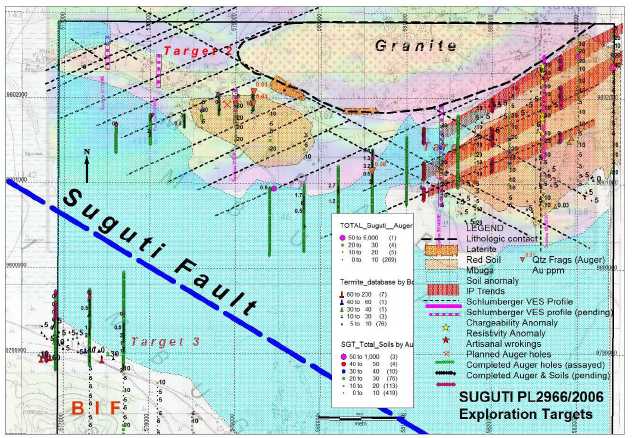
Murangi(PL4511/2007)
No exploration was undertaken on the Murangi Permit during this reporting period. Furthermore, there is no record of previous exploration undertaken on this license.
31
Exploration is to be focused primarily on 5 ground magnetic targets (Map 8) in which the following work is to be undertaken::
i. Mapping of the target areas on 1:2000 scale
ii. Gradient IP survey across the entire license
iii Auger drilling, with the Company’s recently purchased Auger Rig, across each of the Ground magnetic and IP Targets to soil sample beneath the “mbuga” cover.
Map 8. Target generation map of the Murangi PL4511/2007 based on ground magnetic interpretation.

Singida Gold Project
Company personnel first visited the Singida project area during March, 2009 and became aware of the high level of artisanal (small scale) gold mining that was being conducted along an estimated five (5) kilometer mineralized zone. Subsequently, on May 15, 2009, the Company signed a Mineral Financing Agreement with one director of the Company authorizing him, on behalf of the Company, to acquire Primary Mining Licenses (“PMLs”) in the Singida area. As of July 13, 2011, this director has entered into several different Mineral Properties Sales and Purchase agreements with multiple PML owners that hold title to the licenses along the mineralized zone at the Singida project area. Twenty-three (23) PML agreements were executed for an outright purchase of the PMLs and they have been completed. These twenty-three PMLs have been 100% acquired by this director in behalf of the Company. On August 9, 2011, the Company relinquished 17 PMLs. The Company also has option agreements to acquire an additional twenty (20) PMLs within a targeted area at the Singida project. Under the terms of all the agreements, if we complete all twenty (20) of the various agreements, that when combined form the Singida project area, then our total purchase consideration will be approximately $4,531,040 (TZS7,551,733,325) by February, 2013. At the option of the Company, a 2% Net Smelter Production royalty or 2% of the Net Sale Value may be substituted in place of the final payment for each PML and paid on a pro rata basis determined by the total final number of PMLs involved in a Special Mining License.
32
The Company commenced a Phase 2 Reverse Circulation drilling program in March 2011, centered at the Samabaru 2, 3, 4 and 5 Prospects as well as exploring a number of exploration targets within the Singida-Londoni northwest trending shear zone at Sambaru 5 and between Sambaru 3 and Sambaru 4 (Table 8) in which 92 boreholes, totalling 9,023 meters have been drilled. All boreholes, collared along northeast trending drill fences, are inclined at -50 degrees to -65 degrees either to the northeast or to the southwest. Total meters drilled in both Phase 1 (August 2010) and Phase 2 drill programmes amounts to 15,536 meters(Table 9).
Table 9. Summary of Reverse Circulation drilling undertaken at the Singida-Londoni Gold project
| Prospect | Phase 1 | Phase 2 | Total |
| Sambaru 1 | 264 | - | 264 |
| Sambaru 2 | 2348 | 2963 | 5311 |
| Sambaru 3 | 1078 | 2931 | 4009 |
| Sambaru 4 | 2163 | 2328 | 4491 |
| Sambaru 5 | 564 | 897 | 1461 |
| Total | 6417 | 9119 | 15536 |
The two exploration targets were investigated by drilling. The 2ndzone of mineralisation located some 180 meters south of the main mineralised zone at Sambaru 5 was intersected but was found to be narrow and of low grade running 1.04 g/t gold over 1 meter. Similarly, the +100 ppb gold soil anomaly located mid-way between Sambaru 3 and 4 returned anomalous results with only one narrow intersection of 1.57 g/t gold over 1 meter being encountered. No follow-up drilling was undertaken on either of the two targets.
Results
Results of the drilling programme are summarised inTable 10 and Map 9.
Table 10. Summary of Reverse Circulation Drill Results from Sambaru 2, 3, 4 and 5
Hole No. |
Total
Depth (m) |
Section | Azimu
th
(deg) |
Declin (deg) |
From
(m) |
To
(m) |
Interval
(m) |
Grade
(Au g/t) |
| Sambaru 5 |
| SGRC0080 | 40 | 4680W | 40 | -50 | 32 | 35 | 3 | 5.05 |
| SGRC0084 | 40 | 4600W | 40 | -50 | 29 | 35 | 6 | 1.13 |
| SGRC0085 | 60 | 4560W | 40 | -50 | 11 | 15 | 4 | 1.87 |
| Sambaru 4 |
| SGRC0097 | 70 | 3840W | 40 | -50 | 50 | 54 | 4 | 7.35 |
| | (including 1m @20.30 g/t Au) |
| SGRC0100 | 75 | 3920W | 220 | -50 | 59 | 64 | 5 | 2.35 |
| SGRC0103 | 75 | 3880W | 220 | -55 | 79 | 82 | 3 | 6.22 |
| | (including 1m @12.10 g/t Au) |
| SGRC0107 | 90 | 3960W | 220 | -55 | 37 | 40 | 3 | 1.30 |
| SGRC0108 | 125 | 3960W | 220 | -60 | 69 | 72 | 3 | 2.46 |
| SGRC0115 | 55 | 3720W | 220 | -50 | 1 | 5 | 4 | 1.11 |
| Sambaru 3 |
| SGRC0122 | 120 | 2540W | 220 | -50 | 43 | 47 | 4 | 1.14 |
| | | | | and | 144 | 149 | 5 | 2.96 |
| | (including 1m @11.00 g/t Au) |
33
| SGRC0125 | 90 | 2500W | 40 | -58 | 14 | 60 | 46 | 2.64 |
| | (including 3m @9.75 g/t Au) |
| | | | | and | 71 | 74 | 3 | 4.32 |
| SGRC0128 | 90 | 2460W | 220 | -65 | 18 | 19 | 1 | 34.10 |
| SGRC0130 | 136 | 2500W | 220 | -55 | 112 | 115 | 3 | 3.32 |
| SGRC0135 | 120 | 2620W | 220 | -50 | 25 | 30 | 5 | 1.17 |
| | | | | and | 86 | 91 | 5 | 4.27 |
| Sambaru 2 |
| SGRC0137 | 50 | 1980W | 40 | -50 | 0 | 6 | 6 | 1.04 |
| SGRC0140 | 115 | 1980W | 40 | -55 | 111 | 115 | 4 | 3.63 |
| | | | | and | 134 | 145 | 11 | 3.21 |
| | (including 1m @11.90 g/t Au) |
| SGRC0145 | 140 | 2660W | 220 | -60 | 117 | 120 | 3 | 3.02 |
| SGRC0149 | 72 | 1900W | 40 | -50 | 45 | 50 | 5 | 1.31 |
| SGRC0152 | 93 | 2100W | 40 | -55 | 61 | 65 | 4 | 2.01 |
| SGRC0157 | 110 | 2180W | 40 | -65 | 28 | 30 | 2 | 3.16 |
| | | | | and | 67 | 80 | 13 | 1.99 |
| | (including 2 m@ 6.11g/t Au) |
| SGRC0160 | 128 | 2420W | 220 | -55 | 82 | 88 | 6 | 1.94 |
| SGRC0163 | 150 | 2620W | 220 | -60 | 75 | 93 | 18 | 1.05 |
| SGRC0166 | 125 | 2700W | 220 | -50 | 73 | 87 | 14 | 2.15 |
| | (including 1m@10.70g/t Au) |
| SGRC0169 | 150 | 2060W | 40 | -60 | 63 | 65 | 2 | 42.71 |
| | (including 1m@84.40g/t Au) |
| SGRC0170 | 120 | 1860W | 0 | -90 | 75 | 83 | 8 | 3.45 |
Sambaru 5
Drilling has intercepted the narrow and steeply-dipping, arsenopyrite-rich gold zone across a strike length of some 160 meters. Besides the high grade intersection of16.80 g/t gold over 2 metersreported from Section 4640W during the Phase 1 drilling programme, most of the intercepts returned low gold values of between 0.5 to 1 g/t gold over 1 or 2 meter intervals with grade appearing to decrease with depth.
Sambaru 4
The main body of mineralization, having a grade of 3.45 g/t gold over a true thickness of 11 meters and centered over an area of extensive artisanal mining, was traced to a depth of 80 meters before pinching out. The zone, narrowing rapidly out along strike and decreasing in grade, has been traced for 320 meters. Drilling indicated a decrease in grade and width of the mineral zone at depth.
A subsidiary, narrow mineralized lens, located 50 meters to the north-east of the main lens was traced along a strike for 80 meters. Anomalous grades defined the zone further to the northwest.
Sambaru 3
Sambaru 3 is the 2ndlargest of all 5 artisanal sites, comprising of at least 4 parallel but narrow mineralized zones that have been traced continually across a strike length of 280 meters. The main pod of mineralization, averaging 1.93 g/t gold and having a maximum width of 25 meters, pinches out at 110 meters in depth. It has a surface strike extend of approximately 40 meters.
34
The mineral lenses dip sub-vertically to the northeast. Drilling has indicated that a number of lenses appear to extend beyond 110 meters depth and are open along strike both to the northwest and southeast.
Map 9: Plan of the Sambaru Prospects showing main gold intersections
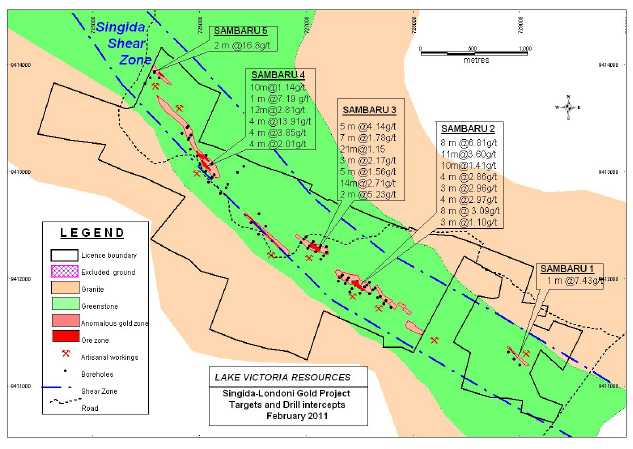
Sambaru 2
Sambaru 2 is the largest of all 5 prospects within the Singida-Londoni Project. Although artisanal workings extend across a strike length of 580 meters, drilling has defined the mineralization to occur within 320 meters of strike length. Four, parallel and vertically to sub-vertically dipping gold lenses, have been intersected to depths of 130 meters although in places the lenses do appear either to pinch out or decrease in grade.
The lenses tend to occur as narrow semi-discontinuous veins “pinching and swelling” along the horizontal and vertical strike with grades typically varying between 3.5g/t to less than 0.5g/t gold.
An evaluation of the total drill results of both Phase 1 and 2 drill programmes have shown that the gold mineralization at the Singida-Londoni project comprises of narrow medium to low grade and often discontinuous lenses. The shear structures hosting the gold-rich zones typically “pinch and swell” along strike, which in places, have resulted in larger pods of limited size as at Sambaru 3 and Sambaru 4.
35
Evaluation of the surface quartz rubble zones at both Sambaru 2 and 3 was undertaken in order to determine whether small, but easily accessible, gold deposits are present. These quartz rubble zones are considered to be due to erosional deflation of the main gold bearing zones at each of the prospects.
Mapping followed by a sampling programme of pits was undertaken on a 25 meter x 80 meter spaced grid (Table 11). A 5 kilogram bulk sample was collected by taking a vertical channel down the pit wall. The volume of the 5 kilogramme sample was maintained for all samples collected by using a measuring box.
The following determinations were made:
- % of quartz fragments to soil by weight (separate <1mm and >1mm size fragments to determine the weight for each population
- % of quartz fragments to soil by volume (plave the <1mm size fraction in a measured container and estimate its volume of ratio of quartz fragments to other rock fragments)
The following sample preparation was undertaken with each 5 kilogram sample:
- Split <1mm soil to 500gm for BLEG (Bottle Leachable Extractable Gold) analysis)
- From the >1mm size fraction of quartz fragments,, an approximately equal size quartz fragments (1 kilogram) for Laboratory crushing and 50 gm Fire analysis
Table 11. Pit sampling programme across zones of surface quartz rubble at Sambaru 2 & 3
Prospect |
Section |
From |
To |
Line-m |
Az |
Section |
From |
To |
Line-m | Total
samples |
| Sambaru 3 | 727240 | 9412248 | 9412308 | 60 | 90 | 727240 | 9412260 | 9412320 | 60 | 4 |
| | 727320 | 9412260 | 9412320 | 60 | 90 | 727320 | 9412270 | 9412320 | 50 | 4 |
| | 727400 | 9412287 | 9412347 | 60 | 90 | 727400 | 9412248 | 9412308 | 60 | 4 |
| Sambaru 2 | 9411980 | 727470 | 727530 | 60 | 0 | 9411980 | 727500 | 727530 | 30 | 4 |
| | 9412060 | 727495 | 727535 | 40 | 0 | 9412000 | 727490 | 727560 | 70 | 3 |
| Sambaru 2b | 9411940 | 727680 | 727780 | 100 | 0 | 9411940 | 727680 | 727780 | 100 | 6 |
| | 9412000 | 727708 | 727788 | 80 | 0 | 9412000 | 727690 | 727800 | 110 | 5 |
| Total | | | | 460 | | | | | | 30 |
Each of the quartz rubble zones were mapped prior to commencing a pitting programme on a 80 meter x 25 meter grid.
Pitting was undertaken according to the mapping and in part followed the programme outlines in Table 11. Depth of pit, to the base of the rubble zone, varied from 0.40 meters to 1.20 meters across all three rubble zones. A total of 32 pits were excavated and sampled.
Results
Each of the 5 kilogram samples was sieved to <1mm and each fraction was weighed. On weighted and volumetric average, 86% of the sample comprised of rock fragments > 1mm. The majority of rock fragments (90%) comprise of quartz fragments. Results of both the fine fraction (<1mm) and coarse fraction (>1mm) are shown inTable 12and summarized in nTable 13 and Map 10.
Table 12. Results of pit sampling
| | | | | Size <1mm | Size >1mm | |
Prospect |
Pit ID |
Easting |
Northing | SANO
1 | Au
g/t | SANO
2 | Au
g/t | % Qtz
frags(>1mm) |
Sambaru
3
| LNP001 | 727394 | 9412316 | A21551 | 0.07 | A21579 | 0.45 | 82.69 |
| LNP002 | 727399 | 9412294 | A21552 | 0.04 | A21580 | 0.3 | 88.89 |
| LNP003 | 727395 | 9412272 | A21553 | 0.04 | A21581 | 0.12 | 86.96 |
36
| LNP004 | 727396 | 9412260 | A21554 | 0.05 | A21582 | 0.01 | 87.76 |
| LNP005 | 727321 | 9412284 | A21555 | 0.10 | A21583 | 0.42 | 84.62 |
| LNP006 | 727313 | 9412296 | A21556 | 0.09 | A21584 | 3.28 | 87.23 |
| LNP007 | 727327 | 9412306 | A21557 | 0.06 | A21585 | 1.38 | 88.46 |
| LNP008 | 727320 | 9412322 | A21558 | 0.04 | A21586 | 5.12 | 87.5 |
| LNP009 | 727230 | 9412282 | A21559 | 0.12 | A21587 | 0.18 | 83.64 |
| LNP010 | 727239 | 9412262 | A21560 | 0.01 | A21588 | 0.11 | 84 |
| LNP011 | 727236 | 9412306 | A21561 | 0.03 | A21589 | 0.06 | 90.57 |
Sambaru
2
| LNP012 | 727690 | 9411960 | A21562 | 0.05 | A21590 | 0.02 | 90.38 |
| LNP013 | 727700 | 9411958 | A21563 | 0.04 | A21591 | 0.01 | 92.31 |
| LNP014 | 727716 | 9411958 | A21564 | 0.02 | A21592 | 0.07 | 89.21 |
| LNP015 | 727728 | 9411962 | A21565 | 0.24 | A21593 | 0.4 | 91.76 |
| LNP016 | 727748 | 9411956 | A21566 | 0.01 | A21594 | 0.28 | 87.76 |
| LNP017 | 727759 | 9411960 | A21567 | 0.01 | A21595 | 0.01 | 86.6 |
| LNP018 | 727773 | 9411958 | A21568 | 0.01 | A21596 | 0.9 | 87.76 |
| LNP019 | 727796 | 9412000 | A21569 | <0.01 | A21597 | 0.02 | 86.96 |
| LNP020 | 727779 | 9412004 | A21570 | 0.02 | A21598 | 0.06 | 87.5 |
| LNP021 | 727768 | 9412014 | A21571 | 0.03 | A21599 | 0.11 | 76.47 |
| LNP022 | 727736 | 9412002 | A21572 | 0.28 | A21600 | 0.05 | 83.67 |
| LNP023 | 727719 | 9412002 | A21573 | 0.03 | A21601 | 0.04 | 83.33 |
| LNP024 | 727703 | 9411988 | A21574 | 0.52 | A21602 | 0.53 | 87.5 |
| LNP025 | 727691 | 9411996 | A21575 | 0.10 | A21603 | 0.29 | 84.78 |
Sambaru
2b
| LNP026 | 727543 | 9411984 | A21576 | 0.03 | A21604 | 0.78 | 86.27 |
| LNP027 | 727534 | 9411992 | A21577 | 0.09 | A21605 | 0.07 | 80.85 |
| LNP028 | 727513 | 9411992 | A21578 | 0.09 | A21606 | 0.07 | 87.76 |
Table 13. Summary of pit results
Grade Au (ppm) | No of samples
(<1mm) | No of samples
(>1mm) |
| <0.1 | 28 | 16 |
| 0.1-0.25 | 3 | 4 |
| 0.25-0.50 | 1 | 6 |
| 0.50-1.00 | 1 | 3 |
| 1.00-5.00 | - | 2 |
| >5.00 | - | 1 |
| TOTAL | 32 | |
| (Max value 5.12ppm | | |
| Au) | | |
37
Map 10. Surface plan showing position of quartz rubble zones and location of pits
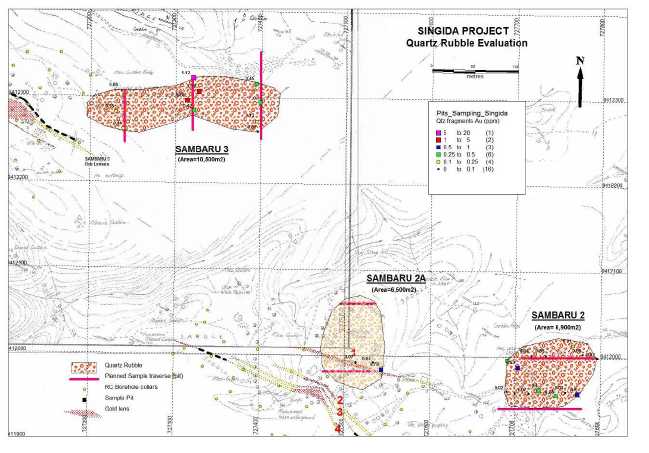
Mapping has shown that the surface areas of the rubble zones cover a relatively small surface area from 6500 square meters at Sambaru 2A to 10,500 square meters at Sambaru 3(Map 10). Furthermore, pitting has revealed thin surface deposits, that comprise mainly of quartz fragments, averaging between 0.5 to 0.75 metres in thickness. Gold grade is predominantly contained in the coarse fraction (Table 13). Sambaru 3 returned an average grade of 1.04 g/t gold whereas Sambaru 2 and 2A returned grades <0.31g/t gold.
Little potential is present to warrant further work to evaluate a resource from these surface quartz rubble zones.
An evaluation of the drill results for both Phase 1 and 2 programs has shown that gold mineralization at the Singida-Londoni project consists of narrow medium to low grade and often discontinuous lenses. The shear structures hosting the gold-rich zones typically “pinch and swell” along strike, which in places, has resulted in larger pods of limited size as at Sambaru 3 and Sambaru 4 which indicates that the gold deposits have limited potential to be developed into a major ore resource contrary to the Company’s vision of discovering substantially larger and economically viable gold deposits in the short term. In this regard, the Company believes that the nature and extent of the mineralization revealed thus far may lend itself rather towards a small-scale commercial mining operation, a joint venture or a possible sale. The Company will therefore endeavor to utilize through Joint Venture or sale the Singida assets to assist in funding its other projects.
The Company has reduced the number of PMLs that were under option from 37 to 20 PMLs and together with the remaining 23 PMLs, the mineral rights of which are under agreement with a Tanzanian company of which full ownership (100%) will be automatically transferred to Lake Victoria once a Mining Licence encompassing the PMLs is taken out.
38
Although the Company completed a Technical report in compliance with Canadian National Instrument 43-101 prior to the June 2010 revised code, it was not submitted. The report is now being prepared under the revised guidleines and will include both drilling campaigns undertaken on the project.
Buhemba Gold Project
The Buhemba Gold Project consists of two (2) Prospecting Licenses (PLs) that cover an area about 107km2.
1. Nyanza PL4892/2007
The Nyanza PL4892/2007 is currently under renewal application. No work was undertaken during this period.
Previously, field investigation of the work undertaken by Randgold Resources has confirmed the presence of at least 4 areas of artisanal workings. Follow-up exploration is planned to target the known areas of artisanal mining as well as to investigate the western sheared basalt/granite contact in PL4892/2007. Although the PMLs of the artisanal workings do not form part of the PL license, we believe that the owners will be amenable to entering an option agreement. Once the Minister of Mines approves the application to renew the license, a number of E-W Schlumberger profiles are planned across the sheared contact in order to prioritize target delineation with a subsequent follow-up reverse circulation (RC) drilling program shortly thereafter.
2. Mageta PL2979/2005 & PL5159/2009
A reconnaissance visit to the two, narrow E-W licences, PL2979/2005 and PL5159/2009, southeast of Buhemba town and directly south of Mageta Village, was made in the latter part of 2011. Both licences are located within granite terrain. Hills of granite outcrop along the northern part of PL 2979/2005 that forms a gently valley slope to the south where streams drain into the Ruvana River. The area is largely covered by black cotton soil (“mbuga”). No outcrops rise out from the depositional plain. Furthermore no artisanal activity appears to have ever taken place on any of the two licences (pers.comm from local inhabitants). The area is considered not prospective for gold and has been relinquished.
Kiabakari East (PL7142/2011)
The Kiabakari East Project is located approximately 55 kilometers southeast of Musoma town, in the Mara Region. The PL, covering 15.2 square kilometres and lying within the central part of the Musoma-Mara Greesntone Belt, was granted to Lake Victoria Resources (T) Ltd. by the Ministry of Mines in April 2011.
The PL was previously investigated by Randgold Resources who excavated a number of N-S trenches across a small hill, rising some 50 meters above the landscape, comprising of Banded Iron Formation (BIF) rocks in the central to southern part of the PL. They also undertook 3 N-S drill fences, totalling 24 reverse circulation drill holes, along strike to the east of the BIF hill. No information is currently available. Minor artisanal mining activities are present on the BIF hill. Recently, the eastern part of the license has been invaded by +500 artisanal miners who have exposed a NNE-SSW trending gold bearing structure hosted by a quartz porphyry dyke within a metasedimentary rock sequence.
Exploration Strategy
Landsat Images for the licence area and surrounding environs were obtained and processed. A variety of band ratio combinations have been used to extract lithology and alteration. Of importance is the recognition of structural features across the Kiabakari licence. A prominent set of NNE fractures, supported by the Total Magnetic Intensity image of the ground magnetometer survey, cut across the eastern part of the permit. The artisanal working at the Kyarano prospect are aligned along this trend(Map 11).
39
Map 11: Landsat Image over the Kiabakari East Prospect showing major structural trends.
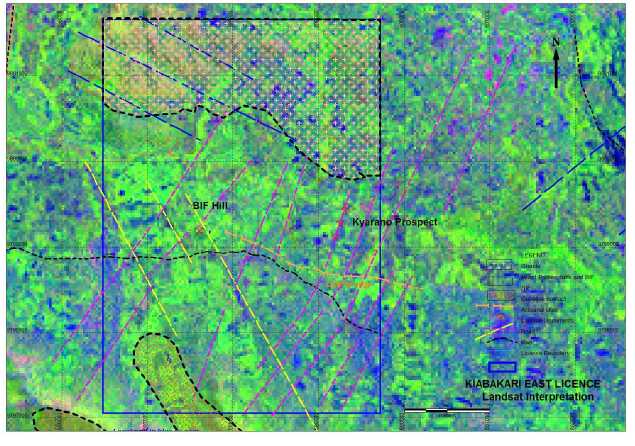
BIF Hill Prospect
Detailed mapping of the BIF Hill and immediate environs were initially undertaken. The BIF is intensely folded and in places sheared. Fold axes trend NW-SE with an apparent plunge to the SE. Artisanal activity is selectively mining the quartz veinlets within the shear zones.
A number of previously dug trenches and artisanal pits were cleared of bush and selective sampling, including grab samples and 2 meter composite channel samples along the sidewall of the trenches and at the base of the pits, were collected (33 samples-Table 14).
A follow-up trench programme, in which a number of the old existing trenches as well as new trenches, totalling 342.7 meters, were re-opened, excavated and sampled. Results are summarised inTable 14 and Map 12.
Table 14. Results of selective trench and pit sampling at BIF Hill
| Trench ID | East (ARC60) | North (ARC60) | AZIMUTH | Interval (m) | Au (g/t ) |
| KP001 | 597505 | 9799528 | 0 | 1.8 | 3.05 |
| KP002 | 597514 | 9799518 | 180 | 1.0 | 2.32 |
| KP003 | 597519 | 9799530 | 180 | 0.9 | 0.70 |
| KP004 | 597531 | 9799526 | 180 | 2.0 | 2.55 |
| KP005 | 597542 | 9799524 | 180 | 1.2 | 1.52 |
| KP006 | 597548 | 9799520 | 180 | 1.2 | 1.32 |
| KP007 | 597552 | 9799530 | 210 | 2.0 | 4.43 |
40
| KP008 | 597543 | 9799520 | 210 | 1.0 | 3.31 |
| KP009 | 597550 | 9799514 | 180 | 0.8 | 4.11 |
| KP010 | 597556 | 9799510 | 200 | 1.5 | 0.36 |
| KP011 | 597563 | 9799514 | 195 | 1.0 | 0.71 |
| KP012 | 597555 | 9799502 | 150 | 1.0 | 0.25 |
| KP013 | 597526 | 9799488 | 90 | 2.0 | 0.81 |
| KP014 | 597523 | 9799490 | 105 | 2.0 | 0.98 |
| KP015 | 597518 | 9799492 | 80 | 1.0 | 0.73 |
| KP016 | 597519 | 9799492 | 150 | 1.0 | 2.87 |
| KP017* | 597517 | 9799488 | | - | 4.47 |
| KP018 | 597522 | 9799506 | 90 | 3.0 | 2.37 |
| KP019 | 597525 | 9799514 | 0 | 2.0 | 1.59 |
| KP020 | 597505 | 9799500 | 30 | 9.4 | 0.40 |
| KP021 | 597505 | 9799500 | 180 | 1.7 | 2.88 |
| KP022 | 597505 | 9799500 | 125 | 8.0 | 0.25 |
| KT001a | 597482 | 9799517 | 4 | 16.00 | 0.50 |
| KT003 | 597532 | 9799525 | 13 | 10.00 | 1.56 |
| KT003b | 597525 | 9799494 | 10 | 32.80 | 1.31 |
| Including | 8.80 | 2.77 |
| KT004 | 597550 | 9799526 | 22 | 31.69 | 1.82 |
| Including | 4.03 | 6.96 |
| KT004c | 597538 | 9799470 | 13 | 3.50 | 1.33 |
| KT005 | 597579 | 9799497 | 23 | 2.10 | 1.31 |
| KT005a | 597585 | 9799512 | 23 | 2.05 | 0.51 |
| KT007a | 597649 | 9799483 | 16 | 4.10 | 0.85 |
| KT008a | 597499 | 9799511 | 130 | 4.30 | 1.14 |
| KT008b | 597506 | 9799505 | 141 | 12.00 | 1.32 |
| KT008c | 597513 | 9799496 | 132 | 12.05 | 1.16 |
| KT009 | 597505 | 9799514 | 70 | 24.80 | 1.45 |
| Including | 6.00 | 3.97 |
| KT010 | 597511 | 9799476 | 51 | 8.00 | 0.71 |
| KT010a | 597526 | 9799487 | 37 | 2.00 | 1.29 |
| KT010a | 597519 | 9799483 | 53 | 2.00 | 1.97 |
| KT010b | 597526 | 9799487 | 37 | 2.00 | 1.48 |
KP017* - grab sample taken at the bottom of a 12 meter deep artisanal shaft
Map 12: Plan of BIF Hill showing geology and results of pit and trench sampling.
41

Regional geological mapping and an in-house ground magnetic survey along 200 meter spaced N-S traverse lines and totalling 78.2 line-kilometers, were completed across the licence. A number of infill and repeat ground magnetic N-S traverses across the southern portion of the licence was undertaken to improve the quality of the data. A total of 20 lines amounting to 103.9 line-kilometers was completed and the data processed and imaged.
The licence is divided by the westward flowing Kyarano River which appears to flow along the contact beween the granite hills to the north and the meta-sedimentary rocks to the south which comprise mainly of argillites and BIF. A outcrop of basalt containing disseminated pyrite is noted in the NW corner of the licence, north of the Kyarano River and forms the western contact with the granite hills. Results of the rock samples are shown inTable 15.
Table 15. Rock samples collected from various localities on the Kiabakari PL.
East(Arc 60) |
North (Arc 60) | SANO
| Au
ppm |
COMMENTS |
| 597525 | 9799486 | A28691 | 0.14 | 5cm silicified & Fe altered unit on limb of fold (IN Trench KP013) |
| 597517 | 9799488 | A28696 | 4.47 | Bottom of 12m deep shaft (KP017) – BIF Hill |
| 597024 | 9800548 | A32247 | 0.02 | Basalt + dessim pyrite |
| 597226 | 9800638 | A32248 | 0.02 | Basalt + dessim pyrite |
| 597086 | 9800718 | A32249 | 0.01 | Basalt + dessim pyrite |
| 596944 | 9800614 | A32250 | 0.04 | Basalt + dessim pyrite |
| 596200 | 9800782 | A32454 | 0.02 | Silicified BIF |
| 596200 | 9800790 | A32455 | 0.16 | Slightly weathered BIF |
| 596851 | 9800502 | A32456 | 0.02 | Quartz pophry |
| 596886 | 9800530 | A32457 | 0.04 | Argillite |
| 596855 | 9800604 | A32458 | 0.02 | Argillite + pyrite |
| 596909 | 9800608 | A32459 | 0.02 | Argillite + pyrite |
Termite sampling
42
A total of 206 termites were collected during mapping. No VG was noted in any of the panned samples. Selective termite samples, based on the regolith profile and totalling 100 samples were submitted to SGS Laboratory for 500gm BLEG analysis for gold. Results are shown inTable 16.
Table 16. Summary of termite sample results collected across the southern part of PL7142/2011
| Range (ppb Au) | Samples |
| <10 | 24 |
| 10-20 | 44 |
| 20-30 | 17 |
| 30-40 | 9 |
| 40-50 | 3 |
| >50 | 3 |
Two linear anomalies, approximately 800 meters apart and trending northwest for a strike length of some 2 kilometers occur across low topographic hills in the central to southern part of the licence. The northern trend encompasses the BIF hill. Furthermore, a similar geochemical anomaly is seen to exist in the eastern side of the licence where some 500 artisanal miners have been active.
Soil Sampling
A regional soil sampling programme on a 200 meter x 50 meter grid has been completed across the central and southern part of the licence, south of the granite outcrops that constitute the northern part of the licence. A total of 801 soil samples were collected and together with 5% QA-QC samples constituting a Commercial Standard and a Blank totalling 43 samples, were submitted to SGS Laboratory Mwanza for gold analysis by Aqua Regia. The summarised results are shown inTable 17.
Table 17. Summary of soil sampling programme carried out across the central to southern part of the Kiabakari East
| Range (ppb Au) | Samples |
| <0.1 | 32 |
| 0.1-5 | 548 |
| 5-10 | 159 |
| 10-20 | 36 |
| 20-30 | 14 |
| 30-40 | 3 |
| 40-50 | 2 |
| >50 | 7 |
| Total | 801 |
Both the BIF hill and the Kyarano artisanal site, located in the central and eastern part of the permit respectively, are clearly shown by subtle but distinct gold-in-soil anomalies (Map 13). At BIF Hill the soil anomaly extends to the southeast for some 1500 meters. Gold mineralisation at the Kyarano Prospect is hosted by a NNE trending, altered quartz porphyry dyke. Soil sampling has doubled the present strike of the mineralised zone, as defined by the artisanal shafts, to at least 800 meters in length before being covered by duricrust to the south.
Soil sampling has also revealed a linear soil anomaly, trending from the Kyarano Prospect 2.6 kilometers to the NW and some 400 meters north of BIF Hill. Furthermore, a NNE trending soil anomaly of up to 600 meters in strike length, similar to that reflected over the Kyarano Prospect, is located 800 meters east of BIF Hill (Map 13).
43
Map 13: Plan showing soil and termite anomalies in the central to southern part of the Kiabakari East permit
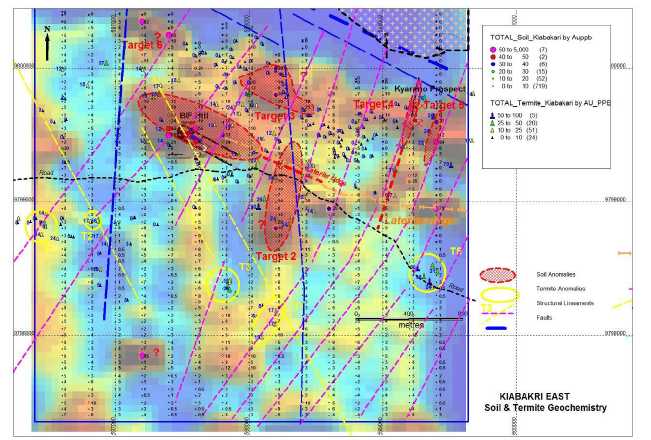
I P Survey
A Gradient array IP survey was undertaken, on a 200 meter spaced N-S grid, across the central part of the Kiabakari East Permit. Problems were encountered in the northern part of the grid to obtain reliable readings due to the westward flowing Kyarano River.
Schlumberger Survey
Schlumberger VES N-S and E-W profiles were undertaken across BIF Hill and the artisanal workings at the Kyarano Prospect respectively (Table 18, Map 14).
Table 18. Schlumberger VES profiles across BIF Hill and the Kyarano Prospect
| BIF HILL | FROM | TO | |
| EASTING | NORTHINGS | LENGTH (m) |
| 597200E | 9799450 | 9799750 | 300 |
| 597400E | 9799400 | 9799700 | 300 |
| 597560E | 9799700 | 9799500 | 200 |
| 597580E | 9799400 | 9799625 | 225 |
| 597600E | 9799400 | 9799700 | 300 |
| 597620E | 9799400 | 9799700 | 300 |
| 597800E | 9799350 | 9799650 | 300 |
| 598000E | 9799300 | 9799600 | 300 |
| 598200E | 9799250 | 9799550 | 300 |
44
| 598400E | 9799200 | 9799500 | 300 |
| 598600E | 9799150 | 9799450 | 300 |
KYARANO PROSPECT
| NORTHING | EASTINGS | |
| 9799850N | 599000 | 599120 | 120 |
| 9799700N | 599000 | 599400 | 400 |
| 9799650N | 599000 | 599400 | 400 |
| 9799500N | 599000 | 599400 | 400 |
| 9799300N | 599000 | 599400 | 400 |
| 9799100N | 599000 | 599400 | 400 |
| 9798900N | 599000 | 599400 | 400 |
| 9798700N | 599000 | 599400 | 400 |
| 9798500N | 599000 | 599400 | 400 |
| Uncompleted | | | |
Inconsistent IP results were noted from the surveys undertaken across the Kyarano workings which failed to distinguish the pyritised quartz porphyry rock.
A distinct chargeability with low resistivity, situated some 100m north of the interpolated strike extensions of the mineralised BIF unit, was noted from a number of N-S Schlumberger profiles undertaken across BIF Hill.
Kyarano Prospect
The Kyarano Prospect, located on the eastern side of the Kiabakari East licence, is a recent and active artisanal site in which up to +500 illegal miners have been present. Shafts, aligned along a NNE trend, were sunk into a quartz porphyry/felsite “dyke” rock, for a strike distance of some 400 meters. Mining activities decreased as flooding of the shafts occurred from 15-20 meters below ground. A number of the shafts were sampled and assayed for gold by 50 gm fire assay, results of which are shown inTable 19 and Map 14.
Table 19. Results of shaft sampling at the Kyarano Prospect
Prospect |
Pit_ID | East
(Arc60) | North
(Arc60) |
SANO | Au
ppm |
Description |
| Kyarano | KP023 | 599210 | 9799682 | A22984 | 0.47 | Qtz vein - 7m depth |
| Kyarano | KP0024 | 599212 | 9799646 | A22985 | 0.06 | Light grey felsite/qtz porphyry -10m depth |
| Kyarano | KP0025 | 599255 | 9799608 | A22986 | 0.11 | Light grey felsite/qtz porphyry -9m depth |
| Kyarano | KP0026 | 599176 | 9799566 | A22987 | 0.01 | Light grey felsite/qtz porphyry -8m depth |
| Kyarano | KP0027 | 599162 | 9799500 | A22988 | 1.74 | Light grey felsite/qtz porphyry -7m depth |
| Kyarano | KP0028 | 599164 | 9799454 | A22989 | 0.93 | Light grey felsite/qtz porphyry -5m depth |
| Kyarano | KP0029 | 599260 | 9799470 | A22990 | 19.8 | Light grey felsite/qtz porphyry -5m depth |
Map 14: Plan of BIF Hill and Kyarano Prospects showing position of Schlumberger profiles and diamond drill collars
45
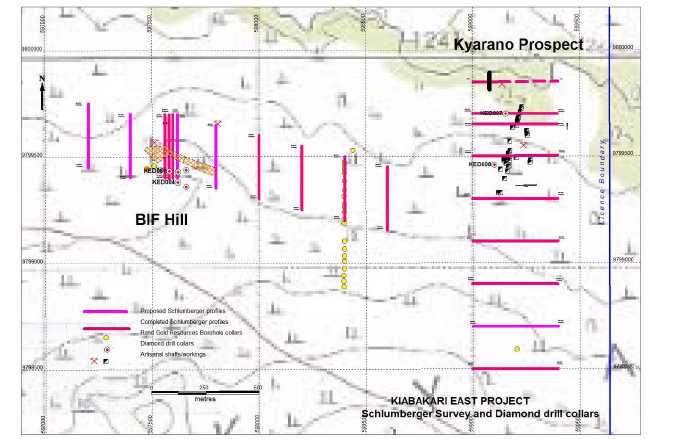
Diamond drilling
A diamond drill programme, amounting to approximately 1000 meters to test both BIF Hill and the Kyarano prospects is currently in progress (Table 20, Map 14). Drilling has commenced at BIF Hill with an inclined hole of -50 degrees to the north being drilled beneath the hill. This will be followed by a number of inclined boreholes collared on 40 meter-spaced N-S sections at the base of the hill in order to define the geometry of the interpolated plunging ore shoot which is hosted by banded iron formation lithologies comprising of chert, siltstones and greywackes.
Table 20. Diamond drill programme planned at Kaiabakari East
| BHID | Prospect | Section | Easting | Northing | Elevation | Az | Dip | Length | Comments |
| KED001 | BIF Hill | 597580E | 597580 | 9799434 | 1280.4 | 0 | -50 | 157.03 | Completed |
| KED002 | BIF Hill | 597540E | 597540 | 9799438 | 1278.8 | 0 | -50 | 154.48 | Completed |
| KED003 | BIF Hill | 597620E | 597620 | 9799430 | 1287.2 | 0 | -50 | 100 | In Progress |
| KED004 | BIF Hill | 597620E | 597620 | 9799380 | 1279.8 | 0 | -55 | 180 | |
| KED005 | BIF Hill | 597660E | 597660 | 9799438 | 1282.5 | 0 | -55 | 100 | Pending results |
| KED006 | BIF Hill | 597660E | 597660 | 9799360 | 1279.1 | 0 | -55 | 200 | of KED004 |
| KED007 | Kyarano | 9799700N | 599153 | 9799700 | 1242.7 | 90 | -50 | 120 | |
| KED008 | Kyarano | 9799460N | 599100 | 9799460 | 1255.1 | 90 | -50 | 120 | |
| Total | | 1131.5 | |
46
A short drilling programme has been planned to test the NNE trending pyritic quartz felsite porphyry at the Kyarano Prospect located on the eastern side of the project area some 1.5 kilometers east of BIF Hill. Two boreholes, collared 240 meters apart on E-W drill fences will test the area 80 meters beneath the active artisanal workings in order to examine the hosting lithologies and alteration associated with this known gold mineralisation.
KED001 intersected a 110 meter wide zone of Banded Iron Formation (BIF) comprising of cyclic sequences of cherts, siltsones and greywackes. Interbedded layers of massive, as well as dessiminated sulphides, predominantly pyrrhotite, occur throughout the rock sequence. The footwall rocks to the BIF units at 110 meters down hole comprise of conglomerates and sediment supported breccias in which “pebbles” of pyrrhotite are commonly observed.
All the core will be cut in half by a rock saw with the half core (or quarter core if over wider intervals of >1 meter) being sampled according to the intervals as per geologic log. Strict quality control will be maintained in which 5% of the sample batch, comprising 20 samples, will contain a blank, a Commercial Standard and a duplicate. The sample batches will be submitted to SGS Laboratory Mwanza for 50gm Fire assay.
Future exploration
Once the Diamond drilling programme has been completed, the following field exploration is planned:
Repeat and infill sampling on 50 meter x 25 meter grids are planned to validate and define the current soil anomalies. Previous termite sampling to the south of BIF Hill and the Kyarano Prospect which returned anomalous values but were not reflected in the surrounding soils, are to be further investigated by pitting in order to determine the validity of the gold values derived from the termite mounds.
A Reverse circulation drill programme will be planned, pending the success of the diamond drill programme, later in the year.
Uyowa Gold Project
The Uyowa Gold project, located 120 kilometers northwest of Tabora town, consists of seven (7) Prospecting Licenses (PLs) that initially cover a total area of 720 square kilometers in the west-central area of Tanzania. Exploration has been mainly focused in the northern license blocks PL 3425/2007 and PL5153/2008.
Exploration Strategy
Initially, exploration work on PL 3425/2007 commenced in the 1stquarter of 2011 and continued until the onset of the rainy season in early May. Field work re-commenced in the last week of July. Prior to the rainy season, the following exploration activities were undertaken:
The raw aeromagnetic data, flown by Geosurvey International G.m.b.H between 1977 to 1980 on a line spacing of 1.0km and at a height of 120m, was purchased from the Geological Survey, Dodoma and has been subsequently reprocessed and interpreted. A number of priority areas were highlighted from Targets 1 to 5 (Map 15). Due to accessibility, exploration has been focused on Target 3 which lies across the central and eastern side of the License Block and includes PL 5916/2009.
47
Map 15: Regional aeromagnetic map across Uyowa Project area showing exploration targets numbered according to priority.
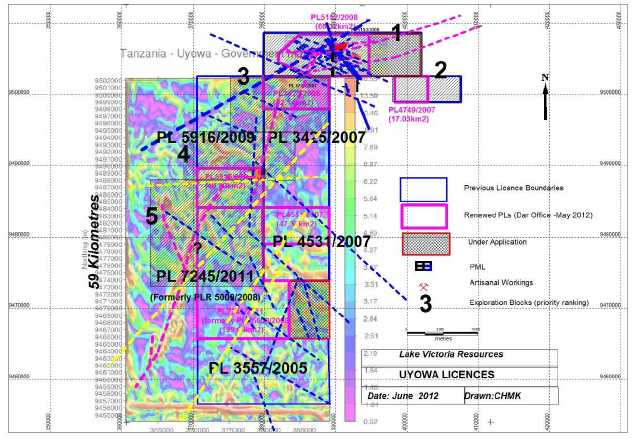
Detailed ground magnetometer survey has been partly undertaken across Target 3 on 200 meter space N-S traverse lines. To date, at total of 35 traverses of 7.5 kilometer each, totaling 265 line-kilometers have been completed along the eastern part of Target 3.
Soil sampling on 400 meter x 50 meter centers has been undertaken. A total of 2,616 samples of 1 kilogram each, including 53 Blanks and 9 Standards, have been collected, prepared on site to 80 meshes. A select consignment of 1182 samples including the QA-QC samples were submitted to SGS Laboratory Mwanza for gold determination by Aqua Regia. The remaining 1434 samples have been stored at site for possible later submission to the laboratory.
Results indicate that 81% of all samples returned below background values (<10 ppb Au)Table 21. All of the anomalous values (>50ppb Au) tend to be isolated single point values. The maximum soil value reported is 1.24g/t Au.
Table 21. Statistical summary of soil sample results collected on Target 3, Uyowa Gold Projecty
Range (ppb Au) |
Samples |
Blanks | Outstanding
samples |
| <10 | 954 | 36 |
|
| 10-20 | 130 | 9 |
| 20-30 | 57 | 6 |
| 30-40 | 18 | |
| 40-50 | 14 | |
| >50 | 9 | 1 |
| Total | 1182 | 52 | 1434 |
48
A total of 12 rock samples were collected and submitted for 50gm Fire Assay. All samples returned <0.02g/t gold.
Termitaria sampling was undertaken but panning revealed no visible gold.
Regolith mapping has been undertaken in conjunction with the soil sampling program across Target 3.
Remote sensing studies have been undertaken using various Band ratios with Landsat Imagery. ASTER imaging has been obtained for the area and has been processed using the various mineral Index ratios. Follow-up ground truthing of the Fe ratios have partly been undertaken and have confirmed the presence of laterite in PL 3425/2005.
Proceeding the rainy season, the exploration focus was shifted to the the northern most licence (PL 5153/2008) where an active artisanal mining site, covering an area of 300 meters x 100 meters, is present. The area of workings and the surrounding environs are covered by 15 PMLs that do not form part of the PL. The Company has entered into an Option agreement with the owners of 4 PMLs that lie across the main zone of workings.
By the time exploration commenced a gold rush of some 5000 artisanal miners, had invaded the site and extended the E-W strike of the known workings up to 1200 meters.
The area was previously investigated by Ashanti Gold in 2003, in which they undertook 999 meters of Reverse Circulation drilling on 100 meter-spaced NNE-SSW drill fences. They intersected 4 narrow zones of gold mineralization along an E-W strike of some 300 meters which returned a number of significant intersections including of 27.16 g/t gold over 4 meters and (Table 22, Map 16).
Table 22 . Summary of RC drill results (after Ashanti, 3 January 2010)
| Hole Id | Easting | Northing | Az | Dip | Length | From (m) | To (m) | Interval(m) | Au g/t |
| MWRC0001 | 389965.00 | 9506207.00 | 190 | -55 | 9 | 0 | 6 | 6 | 1.37 |
| MWRC0003 | 389953.00 | 9506156.00 | 190 | -55 | 75 | 11 | 17 | 6 | 0.5 |
| | | | | | and | 60 | 62 | 2 | 3.91 |
| MWRC0004 | 389943.00 | 9506106.00 | 190 | -55 | 75 | 19 | 25 | 6 | 3.43 |
| MWRC0006 | 390063.00 | 9506192.00 | 190 | -55 | 84 | 10 | 12 | 2 | 2.66 |
| | | | | | and | 76 | 80 | 4 | 27.16 |
| | | | | | | (including 2 metres@52.7 g/t Au) |
| MWRC0007 | 390053.00 | 9506145.00 | 190 | -55 | 102 | 41 | 44 | 3 | 1.14 |
| MWRC0008 | 390162.00 | 9506175.00 | 190 | -55 | 84 | 46 | 47 | 1 | 1.36 |
| MWRC0009 | 390152.00 | 9506123.00 | 190 | -55 | 75 | 6 | 9 | 3 | 0.82 |
| MWRC0010 | 390269.00 | 9506204.00 | 190 | -55 | 102 | 58 | 63 | 5 | 0.8 |
| MWRC0012 | 390328.00 | 9506241.00 | 190 | -55 | 75 | 8 | 9 | 1 | 2.21 |
Map 16: Drill hole location map of Ashanti Gold exploration boreholes showing interpolated gold lenses and grades.
49
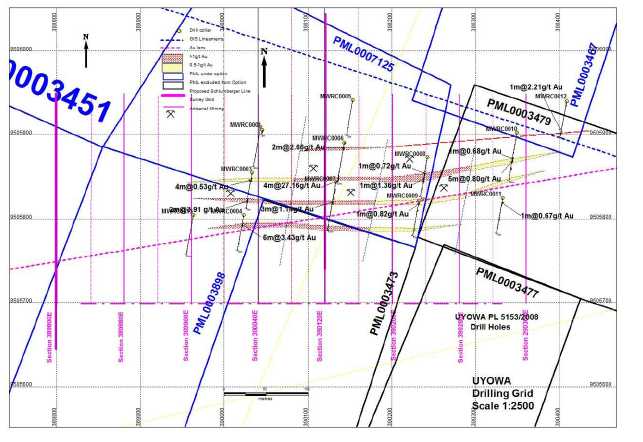
Exploration was focused on PL 5153/2007 in which the following programmes were carried out (Map 17)
- Regional Mag survey on 200 meter spaced N-S lines covering a 12 kilometers x 6 Kilometers grid
- Gradient array survey on 400 meter spaced N-S lines across the optioned PML and extending out along strike across a grid of 10 kilometers x 4 kilometers
- Soil sampling on 200 meters x 50 meter grid across a grid area of 2.25 kilometers x 10 kilometers (excluding the artisanal site
- Schlumberger profiles
- Detailed mapping
- Shaft sampling
- a 1500 meter RC drill programme to test the down-dip continuity of thickness and grade as well as exploring the strike extensions of the 4 main mineralised zones across the PMLs.
Map 17: Grid layouts of proposed exploration surveys to be undertaken across the artisanal workings and environs on PL 5153/2008
50
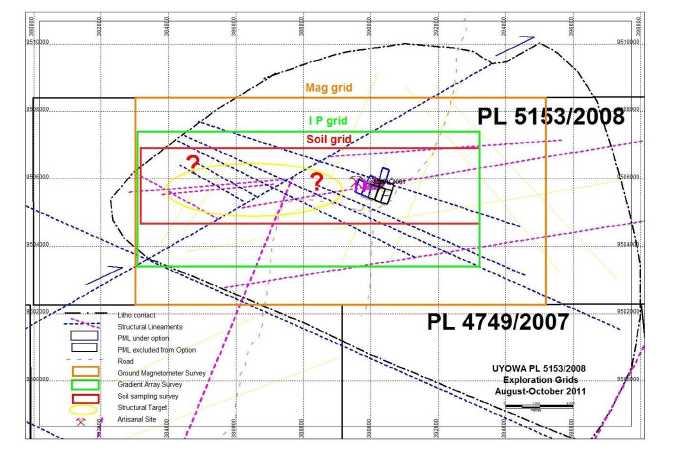
Licence reduction
Many of the licences in the Uyowa project were due for renewal during 2011 and according to Governmnet mining policy, 50% of the areas were relinquished, thereby, reducing the total land package from 729.73 square kilometers to 421.75 square kilometers (Map 18).
Both the eastern and western parts of the PL 5153/2008, largely overlain by the northward and southward flowing Igombe and Gombe Rivers respectively, were relinquished. Subsequent to the relinquishment, the Company has placed an application for the eastern part of the shed-off area since it appears from Landsat imagery that the ENE structural trend is persistent east of the river.
Map 18: Current licence distribution of the Uyowa Project
51
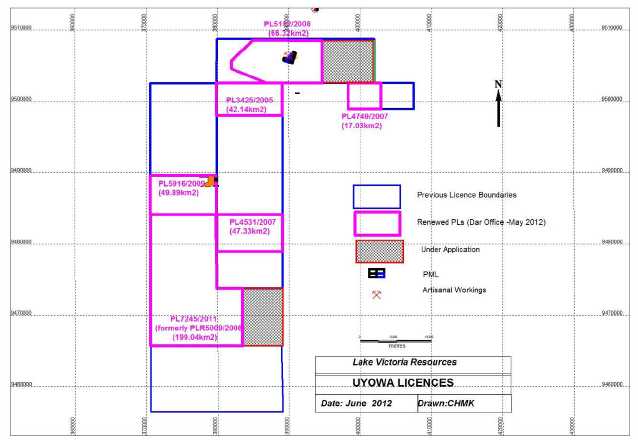
Exploration was immediately focused on mapping in detail the zone of artisanal workings as well as evaluating the mineralization being exposed by the artisanal miners. A number of shafts were selectively chosen on approximately 80 meters spaced centers along the trend in order to coincide with the planned N-S drilling grid. A total of 25 shafts and pits were channel sampled across the working face at depths of between 5 to 22 meters. Samples were collected across the narrow mineralised vein, which ranged between 10 to 35 centimeters wide, as well as hanging and footwall zones. Samples were submitted to SGS Laboratory, Mwanza for 50 gm Fire analysis. Mapping indicated a narrow, high grade quartz-rich gold bearing zone containing disseminated pyrite, striking ENE and dipping steeply to the north, beneath a 10 meter thick sand and lateritic duricrust cover.
Assay results indicate that anomalous gold grades extend into the wall rocks. The mineralised zone dips steeply to the north. A summary of the more significant results taken across the strike of mineralised zone, within the artisanal shafts, is presented inTable 23.
Table 23.Shaft sampling results
| Shaft No. | Depth of shaft (m) | Interval | Vein Position | Au g/t | Location |
UYSH001
| 12
| 0.35 | H/W | 0.30 | East
|
| 0.27 | Qtz Vn | 68.80 |
| 0.4 | F/W | 0.51 |
UYSH002
| 14
| 0.45 | H/W | 0.15 | East
|
| 0.3 | Qtz Vn | 2.89 |
| 0.35 | F/W | 6.01 |
| UYSH003 | 12 | 0.9 | Qtz Vn | 66.70 | East |
52
UYSH004
| 22
| 0.35 | H/W | 2.05 | East
|
| 0.32 | Qtz Vn | 68.30 |
| UYSH005 | 20 | 0.5 | Qtz Vn | 10.50 | East |
UYSH006
| 18
| 0.45 | H/W | 3.77 | East
|
| 0.2 | Qtz Vn | 89.60 |
| 0.35 | F/W | 1.04 |
UYSH007
| 20
| 0.3 | H/W | 20.40 | East
|
| 0.25 | Qtz Vn | 57.10 |
UYSH008
| 18
| 0.6 | H/W | 0.34 | East
|
| 0.15 | Qtz Vn | 4.31 |
UYSH009
| 12
| 0.15 | Qtz Vn | 3.08 | East
|
| 0.35 | F/W | 0.80 |
| UYSH010 | 5 | 0.6 | Shear | 0.97 | East |
UYSH026
| 18
| 0.7 | H/W | 1.86 | East
|
| 0.3 | Vn | 1.78 |
| UYSH025 | 5 | 0.5 | Shear | 0.55 | Central |
UYSH028
| 12
| 0.6 | H/W | 0.53 | Central
|
| 0.15 | Qtz Vn | 29.40 |
| UYSH032 | 5 | 0.7 | Shear | 1.37 | West |
UYSH037
| 12
| 0.24 | H/W | 1.09 | West
|
| 0.51 | Qtz Vn | 88.00 |
| 0.17 | F/W | 6.66 |
Ground Magnetic Survey
In-house ground magnetic survey was conducted along 200 meter spaced N-S traverses across the central part of PL 5153/2008, covering a total area of 75 square kilometers. The ground magnetic signature reflects a large isoclinal EW trending fold, whose northern limb is coincident with the trend of the known gold mineralization as shown onMap 19.
Gold mineralization is co-incident with a prominent magnetic structure that appears to define the northern limb of an E-W trending fold zone. Gold mineralization is related to narrow and intensely silicified shear zones containing disseminated pyrite mineralization. A N-S graben structure on the western end of the trend coincides with the last of the artisanal workings. This area, unlike the artisanal site where laterite is often exposed on surface, is overlain by sand cover for some 500 metres to the west before lateritic soils are again present suggesting possible continuation of the mineralised trend further westwards.
53
Map 19: TMI map over the artisanal area and environs.
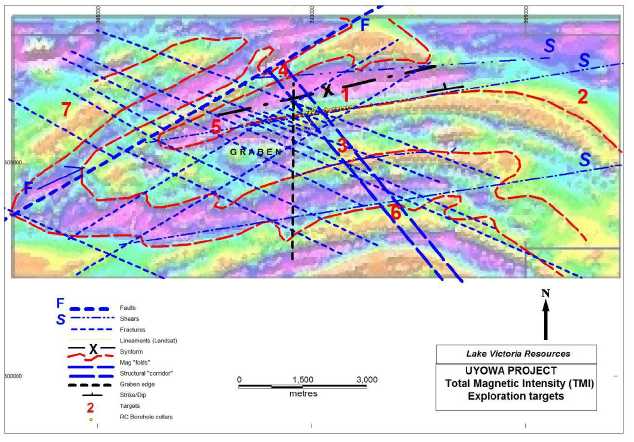
IP Gradient Survey
An in-house gradient IP survey, covering 40 square kilometers, was partly completed across the artisanal workings and surrounding environs. The area was divided into 28 blocks of 1.1 kilometer x 2 kilometer with a N-S line spacing of 200 meters. A total of 16 survey blocks, amounting to 145 line-kilometers, was completed by the end of the year(Map 20).
Results, together with the ground magnetic survey, mapping and soil geochemistry, is expected to refine and improve the structural interpretations and target definition across the project area.
Schlumberger VES orientation, N-S profiles of 300 meters in length were undertaken across the zone of artisanal workings in order to test and define the mineralised zone before applying the method to trace the mineralisation along strike as well as testing a number of ground magnetic targets (Table 24). A total of 12 N-S profiles, amounting to 3.60 line-kilometers, of the 24 planned profiles were completed. Results of the orientation survey across the artisanal mining site indicated that a number of profiles reflected coincident chargeability/resistivity anomalies over the known mineralization.
54
Map 20: Map showing completed Gradient IP survey blocks

Table 24. Schlumberger Survey
| | From | To | | | | |
Section | East (Arc
60) | North
(Arc 60) | North
(Arc 60) |
Az |
Length |
Comments |
Status |
| 390040E | 390040 | 9506300 | 9506000 | 180 | 300 | Central (Orientation) | Completed |
| 390120E | 390120 | 9506300 | 9506000 | 180 | 300 | Central (Orientation) | Completed |
| 389960E | 389960 | 9506300 | 9506000 | 180 | 300 | Central (Orientation) | Completed |
| 390600E | 390600 | 9506350 | 9506050 | 180 | 300 | East | Completed |
| 391000E | 391000 | 9506400 | 9506100 | 180 | 300 | East | Completed |
| 391400E | 391400 | 9506450 | 9506150 | 180 | 300 | East | Completed |
| 389700E | 389700 | 9506250 | 9505950 | 180 | 300 | West | Pending |
| 389320E | 389320 | 9506150 | 9505850 | 180 | 300 | West | Pending |
| 388920E | 388920 | 9506100 | 9506800 | 180 | 300 | West | Pending |
| 390760E | 390760 | 9505500 | 9505200 | 180 | 300 | Target 3 | Completed |
| 391400E | 391400 | 9505350 | 9505050 | 180 | 300 | Target 3 | Completed |
| 392000E | 392000 | 9505450 | 9505150 | 180 | 300 | Target 2 | Pending- |
| 392920E | 392920 | 9506700 | 9506400 | 180 | 300 | Target 2 | Completed |
55
| 392120E | 392120 | 9506600 | 9506300 | 180 | 300 | Target 2 | Completed |
| 394340E | 394340 | 9506800 | 9506500 | 180 | 300 | Target 2 | Completed |
| | 394340 | 9506500 | 9506200 | 180 | 300 | Target 2 | Completed |
| 395700E | 395700 | 9506500 | 9506200 | 180 | 300 | Target 2 | Pending- |
| | 395700 | 9506200 | 9505900 | 180 | 300 | Target 2 | Pending- |
| 392040E | 392040 | 9505400 | 9505100 | 180 | 300 | Target 3 | Pending |
| 394340E | 394340 | 9505300 | 9505000 | 180 | 300 | Target 3 | Pending |
| 392920E | 392920 | 9505400 | 9505100 | 180 | 300 | Target 3 | Pending |
| 388760E | 388760 | 9506900 | 9506600 | 180 | 300 | Target 4 | Pending |
| 389720E | 389720 | 9507300 | 9507000 | 180 | 300 | Target 4 | Pending |
| 390600E | 390600 | 9507600 | 9507300 | 180 | 300 | Target 4 | Pending |
A number of Schlumberger profiles were undertaken along the interpreted northern “limb” of the E-W trending antiform towards the apparent fold closure in the eastern side of the PL. Results revealed a number of coincident chargeability and resistivity anomalies across the “limb” of the fold.
Regolith and Geological mapping
The area, characterized by gentle undulating plains at an altitude of 1100 meters above sea level, is mainly flat and covered by black cotton (“mbuga”) and lateritic soils in which occasional inselbergs comprising of K-feldspathic-rich granitic gneisses occur on the southern part of the licence. The superficial cover is up to +8 meters thick. Three main categories of regolithic are noted:
- Cuirasse (pisolitic and conglomeratic),
- depositional sand cover
- residual sand cover
The underlying geology of PL5153/2008 consists essentially of granitic biotite and pegmatite gneisses. Regional mapping of the granitic gneiss outcrops in the southern part of the licence indicate the presence of sinsitral NW-SE faults zones. These faults may have a controlling influence where they cross the ENE-SWS gold bearing shear zone to the north (Map 19) as is seen by the improved gold grades and widths in the western part of the artisanal mining area.
Soil and termitaria sampling
Soil sampling has been undertaken over the red-brown lateritic soils on a 200 meter x 50 meter N-S grid. A total of 1557 samples of 1 kilogram each have been collected, prepared on site to 80 mesh and submitted together with 5% Blanks and Standards (56 samples), to SGS Laboratory Mwanza for gold and arsenic determination by Aqua Regia in ppb and ppm levels respectively. The remaining samples were collected largely over sand cover and will be retained for possible later submission if warranted by further mapping.
Results indicate that 93% of all samples returned gold values below 10 ppb. No arsenic is present, with all sample values being below detection limit (<20 ppm), refer toTable 25.All the anomalous gold values occur as single point values along the known E-W zone of gold mineralization. A single maximum value of 400 ppb gold occurs on the far eastern side of the trend (Map 21).
56
Table 25. Summary of soil sample results collected over PL 5153/2008
Range (ppb Au) |
Samples |
Blanks/Standards | Outstanding
samples |
| <10 | 860 | 10 |
|
| 10-20 | 39 | 19 |
| 20-30 | 8 | |
| 30-40 | 6 | |
| 40-50 | 3 | |
| >50 | 8 | 27 |
| Total | 924 | 56 | 614 |
Map 21: Soil geochemistry map showing main anomalous gold trends
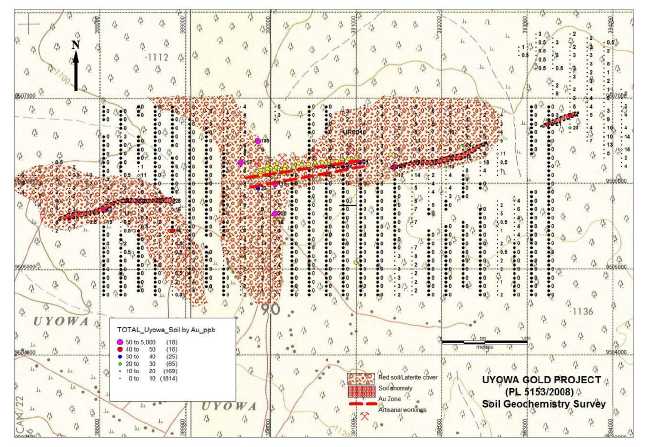
Termitaria sampling has been focused in testing the underlying geochemistry of the various ground magnetic and structural targets. A total of 279 termite mounds of intermediate to cathedral sizes have been sampled and approximately 1 kilogram of sample has been panned at site. Results are generally disappointing with only a few termites returning a single nugget of gold. A number of large termites exist on the artisanal workings and these also failed to return any gold. It is believed that the near surface water table level coupled with sand cover as well as the laterite duricrust has restricted the use of termite mounds as a geochemical sampling method in this district.
RC Drilling
57
A Reverse Circulation drill programme was executed during September and October 2011. A total of 2,486 meters of drilling was completed in 29 boreholes. Drilling was aimed at testing the strike extensions of the known mineralised gold zone beneath the area of intensive artisanal activity as well as to test a number of geophysical targets that have been defined from the recent ground magnetometer and IP Schlumberger surveys.
Drilling was conducted along 80 meter spaced N-S fences across a strike length of 1,300 meters with all boreholes angled between 50-65 degrees to the south.
Drilling identified a number of narrow and anomalous gold bearing zones in which a single continuous gold bearing silicified shear zone, having a grade greater than 0.5g/t gold, over +1 meter interval, is persistent throughout the area being tested. Gold mineralization occurs as free gold as well as in association with pyrite mineralization. Drill samples were collected across the gold bearing zones on 1 meter intervals with the results consequently representing a diluted grade to those higher grade assays that are present over narrow widths within the artisanal shafts (Table 23).
Unlike the central and eastern part of the Prospect, which is represented by a single mineralised structure, the western part comprises of at least 4 mineralised veins that generally, not only have increased widths, but, from the results received to date, also reflect substantially higher gold grades, across a strike length of some 300 meters and to a vertical depth of 60 meters below surface (Table 26, Map 22).
Table 26. Summary of reverse circulation drill results
BHID | Total
Depth (m) |
Section | Azimuth
(deg) | Decline
(deg) | From
(m) | To
(m) | Interval
(m) | Grade
(g/t Au) |
| URC001 | 80 | 390600E | 180 | -50 | 25 | 28 | 3 | 0.68 |
| URC002 | 60 | 390680E | 180 | -50 | 10 | 15 | 5 | 0.55 |
| and | 45 | 46 | 1 | 0.73 |
| URC003 | 80 | 390520E | 180 | -50 | 30 | 31 | 1 | 3.14 |
| and | 58 | 59 | 1 | 6.61 |
| URC004 | 90 | 390440E | 180 | -50 | 77 | 79 | 2 | 6.35 |
| URC005 | 60 | 390760E | 180 | -50 | 2 | 4 | 2 | 24.00* |
| and | 43 | 45 | 2 | 2.32 |
| URC006 | 100 | 390520E | 180 | -50 | 59 | 60 | 1 | 2.01 |
| URC008 | 50 | 390840E | 180 | -50 | 38 | 39 | 1 | 7.73 |
| URC009 | 80 | 390840E | 180 | -60 | 64 | 65 | 1 | 1.00 |
| And | 71 | 74 | 3 | 1.49 |
| URC010 | 70 | 390920E | 180 | -50 | 48 | 49 | 1 | 1.42 |
| URC011 | 80 | 391000E | 180 | -50 | 60 | 61 | 1 | 0.76 |
| URC012 | 100 | 390360E | 180 | -50 | 57 | 58 | 1 | 1.87 |
| And | 60 | 65 | 5 | 0.98 |
| URC013 | 70 | 390280E | 180 | -50 | 19 | 28 | 9 | 7.95 |
| (Including24.65 g/t over 2 metres) |
| URC014 | 80 | 390040E | 180 | -65 | 40 | 42 | 2 | 11.41 |
| And | 53 | 63 | 10 | 4.10 |
| (including 33.3 g/t Au over 1 metres) |
| URC015 | 55 | 390120E | 180 | -70 | 26 | 28 | 2 | 1.23 |
| URC017 | 70 | 389960E | 180 | -55 | 7 | 10 | 3 | 10.41 |
| And | 36 | 42 | 6 | 17.6 |
| (including103g/t over 1 metre) |
| URC018 | 130 | 389960E | 180 | -60 | 15 | 28 | 13 | 4.06 |
58
| (including24.8 g/t over 1 metre) |
| And | 77 | 81 | 4 | 2.01 |
| URC024 | | | | | 48 | 49 | 1 | 1.32 |
*lateritic duricrust
Boreholes URC013 to URC018 were drilled in the western part of the prospect.
Map 22: Borehole collar plan showing gold intercepts along the mineralised zone
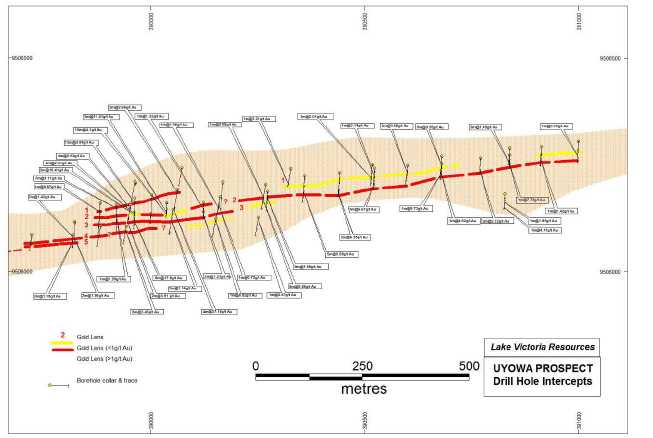
A single drill hole, collared 400 meters to the east of the artisanal workings, targeted the interpolated position along strike of the mineralised shear zone. A number of zones of pyrite mineralization and associated silicification with quartz veining and minor visible gold were noted down-hole indicating the persistence of the mineralised shear zone for at least some 1700 meters along strike. Assay results returned 1meter intercepts of 0.61g/t gold, 0.63 g/t gold and 0.46 g/t gold at 61 meters, 96 meters and 100 meters down-hole respectively.
Two boreholes were drilled to test two ground magnetic targets:
i. Ground magnetic survey indicates that the gold mineralization occurs along the northern limb of an E-W trending antiform that appears to close toward the east (Map 19). Schlumberger profiling has revealed a number of coincident chargeability and resistivity anomalies across the “limb” of the fold. A single borehole was drilled, 3.36 kilometers east from the artisanal workings, to test the magnetic signature and IP Schlumberger anomalies along the fold arc. The area is overlain by red lateritic soils. Drilling intersected a number of zones of increased magnetite alteration down-hole. No pyrite or intense silicification was noted and in effect the borehole failed to intersect any mineralisation.
ii. The second borehole was drilled to test a similar ground magnetic signature that is present within the “inner” core of the fold zone 1.20 kilometers to the south of the artisanal workings and within the NW-SE structural corridor that defines the higher grade portion of the mineralised zone to the north (Map 19). Although the borehole did intersect an anomalous 4 meter zone of disseminated pyrite mineralization overlying a zone of magnetite-rich granitic gneiss, no anomalous gold grade was revealed from the assay results.
59
This first round of drilling has successfully tested the continuity and persistence of the mineralised shear zone along some 1,700 meters of strike and to a depth of upto 60 meters below surface. The potential of the zone, besides being open-ended along strike and open down-dip, is to be focused in the western part of the trend where increased gold grades and widths have been intersected. Regional mapping of granitic gneiss outcrops to the south-east of the zone indicate the presence of NW-SE faults zones that may well have a controlling influence on the emplacement of the gold mineralization. Such features are important structural controls for other gold deposits elsewhere in the Lake Victoria Gold Belt.
Diamond drilling
The 1500 meter diamond drill programme, primarily aimed at defining and understanding the structural controls of the 4 gold veins across 300 meters of strike length within the central to western parts of the 1700 meter long E-W shear zone, was undertaken from March to May 2012. The drilling, planned on 40 metre spaced N-S sections, also tested the down-dip extensions of mineralization to a vertical depth of some 150 meters. A total of 1459 meters was drilled in 11 boreholes (Table 27, Map 23).
Table 27.Diamond drill programme
BHID |
Section | Easting (Arc
60) |
Northing (Arc 60) | Az
(o) | Dip
(o) | Length
(m) |
Elevation |
| UDD001 | 389960E | 389960 | 9506197 | 180 | -65 | 165.18 | 1108 |
| UDD002 | 389920E | 389920 | 9506182 | 180 | -60 | 139.84 | 1108.4 |
| UDD003 | 390000E | 390000 | 9506206 | 180 | -60 | 155.24 | 1109.3 |
| UDD004* | 390040E | 390040 | 9506160 | 180 | -65 | 79.98 | 1110.6 |
| UDD005 | 390040E | 390040 | 9506218 | 180 | -60 | 140.52 | 1110.9 |
| UDD008 | 390200E | 390205 | 9506242 | 180 | -65 | 134.88 | 1112.6 |
| UDD009 | 390320E | 390318 | 9506254 | 180 | -65 | 114.96 | 1113.8 |
| UDD010 | 389720E | 389717 | 9506158 | 180 | -60 | 132.98 | 1110 |
| UDD011 | 390840E | 390840 | 9506315 | 180 | -64 | 116.78 | 1112 |
| UDD06 | 390080E | 390080 | 9506216 | 180 | -60 | 145.83 | 1110.4 |
| UDD07 | 390120E | 390120 | 9506211 | 180 | -65 | 130 | 1105.8 |
| * "Twin" hole to URC014 |
60
Map 23: Diamond drill collar plan

Drilling has revealed that the gold mineralization is hosted by a number of semi-continuous ductile shears zones of up to 7 meters wide and containing disseminated pyrite mineralization, dipping between 55 to 70 degrees to the north. In all sections, the mineralised gold zones have been traced to vertical depths of 100 meters and are open at depth.
A “twin” hole was drilled to compare the gold grades and widths in order to increase gold grade confidence of the previous RC drilling results and to work towards establishing a gold resource.
A single diamond drill hole was drilled at either end of the known mineralised zone, confirming the presence of the mineralised shear zone continuing out along strike both to the east and to the west.
All borehole samples across the mineralised zones have been split, sampled and submitted to SGS Laboratories Mwanza for 50 gm Fire assay. Strict quality control was maintained with 5% of each of the sample batches having a blank, duplicate and commercial standard inserted as part of the sample stream. Results are pending.
Future exploration
PL3425/2007
- Ground truthing of Landsat and ASTER imaging by following up on a number of iron alteration zones
- Field investigation and follow up sampling/pitting/trenching on any of the delineated soil anomalies as delineated from the earlier soil sampling programme completed before the rainy season.
61
- Selected Gradient IP surveys and Schlumberger VES profiling across delineated targets.
- RAB/RC drilling over prioritized targets.
PL5153/2008
Interpretation of the ground magnetic survey suggests the presence of a graben structure that coincides with the last of the artisanal workings on the western side of known mineralised zone. The area, unlike the artisanal site where laterite is often exposed on surface, is overlain by sand cover for some 500 meters to the west before lateritic soils are again present suggesting possible continuation of the mineralised trend further to the west. Landsat imagery clearly shows area of laterite and lateritic soil over the area. Based on the recent soil geochemistry results, follow up specific soil sampling is planned across the interpolated trend of gold mineralization to both the west and east of the artisanal workings covering a total strike length of 3.5 kilometers as shown inMap 24.
Conventional soil sampling is planned across areas of lateritic soil cover. Initially a RAB programme had been recommended to test the intervening areas covered by black cotton soil (“mbuga’). However, prior to embarking on such a programme, an orientation survey using enzyme geochemistry has been recommended as a trial study over a portion of the area to be sampled. Should results be positive further sampling incorporating this geochemical method will continue to be used to outline the gold anomaly?
Follow-up investigation using possibly both methods of soil sampling will be undertaken across a number of ground magnetic targets (Map 19) in order to prioritise targets for later testing by RAB drilling.
Reverse Circulation drilling has been planned to undertake infill drilling on 40 meters spaced N-S sections across the artisanal site in order to undertake a resource calculation. Furthermore, part of the programme will also focus on testing the soil anomaly along strike.
RAB programme is planned to test a number of magnetic targets as indicated inMap 19.
Map 24:Soil sampling plan to trace the strike extensions of the mineralised gold structure across PL5152/2008.
62
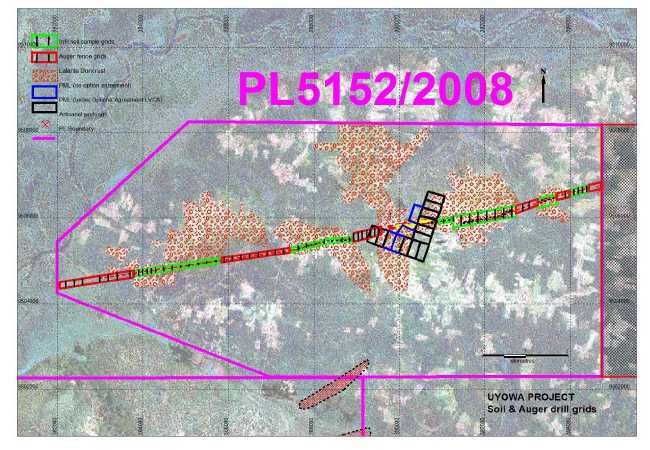
Handeni Gold Project
The Handeni Project, comprising of three (3) Prospecting Licenses and covering a total area of 200.59 square kilometers (Table 28), is located approximately 240 kilometers by road north-west of Dar es Salaam and some 30 kilometers south of Handeni town within the Handeni District (Map 25). The Company has acquired 100% of the mineral rights for PL7148/2011 as well as entering into an “option-to-purchase” agreement for 100% of PL7002/2001 and PL4816/2807 (Table 28).
Table 28. Details of Handeni Region Prospecting Licenses
| License ID | Area | Area (km2) |
| 7002/2011 | Amani | 172.36 |
| 7148/2011 | Mkulima East | 12.00 |
| 4816/2007 | Mkulima | 16.23 |
| Total | 200.59 |
63
Map 25: Location map of the Handeni Project showing the PLs in red.
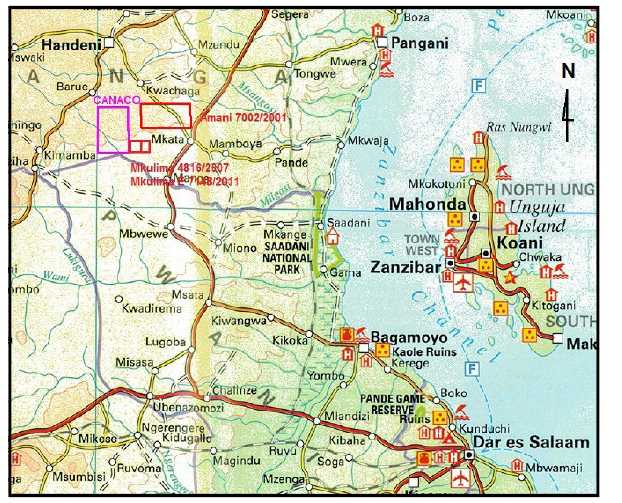
Gold was discovered in 2003 centered around the Magambazi village. However, the area has recently come into the spotlight as a possible new gold district. High grade gold intersections are being reported by Canaco Resources from their drilling programs that are being conducted on their 197 square kilometer Kilindi PL located immediately west of the Company PLs (Map 26) .
The area, situated outside the known boundary of the Tanzanian Craton, has long been overlooked as a major exploration target due primarily to the nature of the high grade metamorphic rocks not being considered suitable to host major gold deposits. Increased attention is now being paid to this area that is situated between the known Tanzanian Craton and the Proterozoic Mozambique Mobile Belt.
The geology of the region is represented by high grade metamorphic rocks within the amphibolite to granulite facies comprising of feldspar-quartz–biotite and garnet-hornblende-biotite gneisses and pegmatites aligned along a regional northwest-southeast trend. The host lithologies for gold mineralisation as reported by Canaco Resources comprise of garnet-silica altered amphibolite together with minor biotite-kyanite-quartz-feldspar gneisses. Folding, with fold axes aligned along the regional structure are evident at Magambazi, where they form, in conjunction with the favourable mafic lithologies, the primary controls to the gold mineralisation.
Exploration Strategy
Prior to commencing fieldwork, the following desktop studies were undertaken:
64
- Structural interpretation of the regional government aeromagnetic data across the area
- Landsat interpretation using the various mineral indexes and alteration ratios.
Stream sediment sampling and follow-up, select soil sampling programmes were undertaken on the Handeni licenses in order to evaluate the potential of the licenses under option as swiftly as possible (Table 29)
Table 29. Summary of samples collected on the Handeni licences
| Prospect | Stream Sediment | Soil | Rock |
| Mkulima | 198
| 142 | 3
7 |
Mkulima
East |
284 |
| Amani | 367 | 1221 | 14 |
| Total | 564 | 1647 | 24 |
The dominant drainage patterns are from the north-west to the south-east and are generally defined along major lithological contacts particularly between units of amphibolite and quartz-feldspar gneiss. The Mligazi River, transecting the SW corner of Mkulima PL4816/2007 and the Kwale River draining the Amani PL7002/2011 are the main river systems that drain both license areas. Secondary tributaries are developed along the NE-SW cross-cutting structures. Regional stream sediment sampling is in progress on 1st, 2nd, 3rdand 4thorder tributaries as planned from the 1:50,000 scale topography maps (Map 26).
65
Map 26: Stream Sediment Sampling Program for Handeni Region Prospecting Licenses
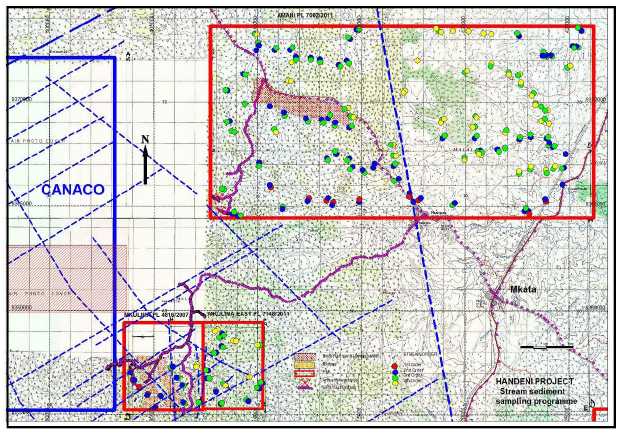
Mkulima PL4816/2007 &Mkulima East PL7148/2011
Stream sediment sampling and mapping of the drainages have been undertaken across the adjoining licences. Samples were collected above the confluences of streams from the gravel layer whenever possible, sieved to 1millimeter in the field and bagged as two x 500 gram samples – one of the samples to be panned at site for visible gold and the other sample being submitted to SGS Laboratory, Mwanza to test for bottle–leachable-extractable gold (BLEG).
Based on the first round of pan results, a number of areas within the PLs were selected for follow-up stream sediment sampling. Selective soil sampling was undertaken across prospective lithologies of amphibolite gneiss.
A total of 198 stream sediment samples were collected from both the Mkulima and Mkulima East Licences, results of which are shown inTable 30.
Table 30. Summary of stream sediment and soil geochemistry results across the Mkulima PLs
| Range (ppb Au) | Stream sediments | Soil samples |
| <10 | 152 | 238 |
| 10-20 | 21 | 94 |
| 20-30 | 18 | 47 |
| 30-40 | 4 | 20 |
| 40-50 | - | 10 |
| >50 | 3 | 17 |
| Total | 198 | 426 |
66
Two main targets (Targets 1 and 1a) were identified on Mkulima PL 4816/2008 (Map 27). Selective soil sampling traverses were undertaken across the targets but results were mostly below detection (<10 ppb Au) as reported in the 3rdQuarterly report. The Licence was relinquished and returned to the owner at the end of the 3 month option period.
Map 27: Stream sediment anomaly map showing soil sampling targets
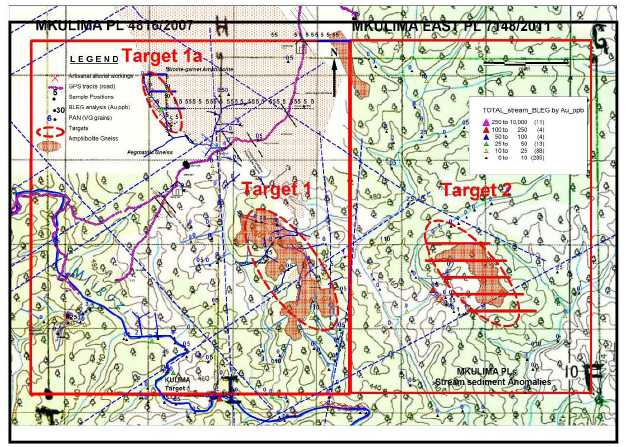
One target (Target 2) was identified to the east on the adjoining Mkulima East PL 7148/2011. Results of the stream sediment sampling programme indicated gold-in-streams draining to the west off a small NW-SE trending ridge in the central part of the licence (Map 27). Old artisanal working was noted on the western hill slope in which outcrops of garnet-kyanite- biotite and amphibolite gneisses occur. A follow-up 200 metre x 25 metre E-W soil sample grid (Map 28), in which 170 soil samples, including 8 QA-QC samples, were submitted to SGS Laboratory Mwanza for Aqua Regia analysis. The results are summarized inTable 31andMap 28.
Table 31. Summary of soil sample results
Range (Au ppb/As
ppm) |
Au Samples |
As samples |
| <10 | 46 | 77 |
| 10-20 | 68 | 7 |
| 20-30 | 20 | |
| 30-40 | 16 | 11 |
| 40-50 | 4 | |
| 50-100 | 7 | 2 |
| >100 | 1 | |
| Total | 162 | 98 |
67
Map 28: Soil sampling grids across Mukulima East outlining potential soil anomalies
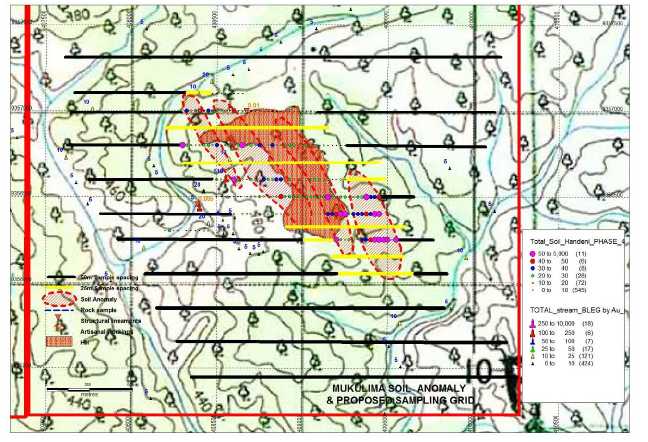
Four, NW-trending, low threshold soil anomalies, having an overall strike length of 1.5 kilometers, are situated on either side of a NNW trending hill. The largest of the four anomalies has an apparent strike length of 550 meters and is 100 meters wide (Map 28). A 2ndphase of infill soil sampling, in which 114 soil samples were collected, was completed across the hill. Results support the present anomalies (Table 32).
Table 32. Summary of Phase 2 soil sampling at Mkulima East Prospect
| Range (Au ppb/As ppm) | Au Samples | As samples |
| <10 | 62 | 76 |
| 10-20 | 19 | 7 |
| 20-30 | 21 | |
| 30-40 | 4 | 17 |
| 40-50 | 4 | |
| 50-100 | 5 | 15 |
| >100 | 4 | 3 |
| Total | 162 | 98 |
Maximum arsenic value is anomaly at 154 ppm and maximum gold value is 140 ppb
Future exploration
68
A further infill soil sampling programme on 100 meter x 25 meter grid is recommended across the hill (188 samples) in order to better define the apparent gold anomalies prior to planning a trenching programme across the main anomalous zones. Should a trenching programme be warranted, further soil sampling on 100 meter x 50 meter grid is proposed around the hill on 200 meter x 50 meter grid (623 samples) to increase the area of investigation and strike extend of the gold anomalies (Table 33 , Map 28).
Table 33. Planned soil grid across the Mkulima East Licence
| | From | To | Length | 50 |
| Section | East (Arc 60 37S) | North (Arc 60 37S) | East (Arc 60 37S) | (m) | Sample Number |
| 9358900E | 407400 | 9358900 | 410250 | 2850 | 58 |
| 9358500E | 407400 | 9358500 | 410250 | 2850 | 58 |
| 9358100E | 407400 | 9358100 | 410250 | 2850 | 58 |
| 9357700E | 407400 | 9357700 | 410250 | 2850 | 58 |
| 9357700E | 407500 | 9357700 | 410200 | 2700 | 55 |
| 9357300E | 407600 | 9357300 | 410150 | 2550 | 52 |
| 9357100E | 407650 | 9357100 | 408300 | 650 | 14 |
| | 408325 | 9357100 | 408450 | 125 | 6 |
| 9357000E | 407700 | 9357000 | 410100 | 2400 | 49 |
| 9356900E | 408200 | 9356900 | 409150 | 950 | 39 |
| 9356800E | 407650 | 9356800 | 408250 | 600 | 13 |
| | 409250 | 9356800 | 410050 | 800 | 17 |
| 9356700E | 408300 | | 409450 | 1150 | 47 |
| 9356600E | 407750 | 9356600 | 408450 | 700 | 15 |
| | 409250 | 9356600 | 409500 | 250 | 6 |
| 9356500E | 409450 | 9356500 | 409650 | 200 | 5 |
| 9356400E | 407800 | 9356400 | 408550 | 750 | 16 |
| 9356325E | 408900 | 9356325 | 409600 | 700 | 29 |
| 9356250E | 408100 | 9356250 | 409200 | 1100 | 23 |
| | 409000 | 9356250 | 409750 | 750 | 31 |
| 9356150E | 409200 | 9356150 | 409600 | 400 | 17 |
| 9356050E | 409200 | 9356050 | 409600 | 400 | 9 |
| | 409200 | 9356050 | 409650 | 450 | 19 |
| | 409700 | 9356050 | 409850 | 150 | 4 |
| 9355850E | 408150 | 9355850 | 409800 | 1650 | 34 |
| 9355850E | 408250 | 9355850 | 410200 | 1950 | 40 |
| 9355450E | 408350 | 9355450 | 410250 | 1900 | 39 |
| Total | | | | | |
| samples | | | | | 811 |
| 25m centres | (Total samples 188) | PHASE 1 | | | |
| 50m centres | (Total samples 623) | PHASE 2 | | | |
Amani PL 7002/2011
The Prospecting Licence (PL), covering an area of 170 square kilometers, is located 32 kilometers southeast of Handeni town and 5 kilometers northeast of the Mkata junction which lies on the main tar road to Tanga. The Magambazi gold occurrence of Canaco is situated 26 kilometers due west of the licence (Map 29).
69
Map 29: Location of the Amani PL 2007/2011 in relation to the Magambazi project of Canaco Resources and other junior mining companies in the Handeni district. The amphibolite units are shown as having high magnetic susceptibility (red) in the TMI image and the structural interpretation in blue lines with the low angle thrust belts in black.

The licence is underlain by alternating lithologies of amphibolites, biotite-garnet-amphibolite gneisses and quartz-feldspar and pegmatatic gneisses striking NW-SE. Low angle reverse thrusts trending NNW-SSW to N-S are noted in the central and western parts of the licence (Map 29).These thrust planes are considered to be related to the Proterozic Mozambique Mobile Belt that becomes increasingly evident towards the SE. Streams, often defining lithological contacts, drain the area to the southeast.
Garnet-silica altered amphibolite with biotite-kyanite-quartz feldspar genisses are the main host lithologies together with the associated sulphides of arsenopyrite-pyrrhotite in the vein-related mineralisation at Magambazi as reported by Canaco Resources.
The only know active artisanal site on the Amani Property is located in the SW corner of the licence where alluvial gold workings occur along the Suwa River. Although isolated artisanal test pits are noted particularly in the headwaters of many of the streams, no extensive artisanals workings are present suggesting that little to no gold was found in the drainages to warrant further work by local miners.
Exploration Strategy
Stream sediment sampling has been undertaken across the whole of the licence. At least 5 target areas were outlined from the anomalous gold-in-streams for follow up soil sampling and mapping (Map 30) .
Map 30: Stream sediment and soil targets on the Amani Licence
70

Soil sampling has been undertaken across selective grids(Map 31). A total of 342 stream sediment and 1221 soil samples have been collected and panned, the results of which are indicated inTable 34andMap 31.
Table 34. Summary of stream sediment and soil geochemistry results across the Amani License
| Range (ppb Au) | Stream sediment | Soil |
| <10 | 242 | 996 |
| 20-30 | 48 | 112 |
| 20-30 | 27 | 50 |
| 30-40 | 8 | 15 |
| 40-50 | 5 | 7 |
| >50 | 12 | 41 |
| Total | 342 | 1221 |
Maximum number of gold grains per pan =2
Maximum soil value of 6.3g/t gold was retuned from Target 1.
Map 31. Stream sediment sampling results and soil sampling targets on Amani PL 7002/2011
71

Generally the results of the stream sediment sampling returned no visible gold in the panned sample and low assay values. The best gold values were reported from streams draining northwards and close to the northern boundary of the licence where gold values ranged between 60 and 110 ppb gold. Although one soil sample did reflect a value of 2.45ppm gold at Target 5 (Map 30), it is considered to have been a QA-QC Standard that had been mistakenly included in the sample results. A number of high grade soil values were returned from Target 1.
Soil sampling Programme
Selective soil sample traverses were completed over prospective amphibolite/granitic gneiss contacts as well as over topographically higher areas in which stream sediment sampling returned anomalous gold values.
Four separate soil sampling programmes were undertaken at various locations on the property.
Phase 1
N-S soil sampling traverses were planned and executed by the project geologist across high magnetic targets as reflected by the regional aeromagnetic signature of the area (Map 29). Five areas were soil sampled (Map 30):
- The amphibolite/granitic gneiss contact in the northern part of the licence (Target 1)
- The ridge in the western part of the prospect (Target 2)
- East of Target 2
- Target 3 and a N-S traverse east of the camp
- Target 4
- Target 5
Target 1
A total of 210 samples were collected and sieved to 1mm. A 500gm sample was submitted to SGS laboratory for 500gm BLEG analysis for gold and arsenic.
72
Soil sample results were, on the whole, spectacular with values attaining a maximum of 6.3 g/t gold as shown inTable 35 and Map 32.
Table 35.Summary of higher grade gold values from 1stPhase of soil sampling
| HANDENI/STREAM SEDIM 17 Sept | | | | | | |
| 2011 (BLEG) | HDI/SOIL/2011/006 | - 16 October 2011 | |
| | | | | Re-sample - 1st Analysis (Aqua regia) | Repeat | |
| | Au | Au | | | ppm | ppb | | | |
| Sano | ppm | ppb | Batch | Sano 2 | Au | Au | As ppm | As ppm | Comments |
| A08785 | 0.1 | 100 | MW114019 | A09431 | <0.01 | 5 | 115 | <20 | |
| A08788 | 0.32 | 320 | MW114019 | A09430 | 0.03 | 30 | 95 | <20 | |
| A08789 | 0.13 | 130 | MW114019 | A09429 | 0.02 | 20 | 110 | <20 | |
| A08792 | 0.17 | 170 | MW114019 | A09428 | 0.02 | 20 | 130 | <20 | |
| A08793 | 4.26 | 4260 | MW114019 | A09427 | <0.01 | 5 | 140 | <20 | |
| A08811 | 1.65 | 1650 | MW114019 | A09412 | <0.01 | 5 | 180 | <20 | |
| A08839 | 3.67 | 3670 | MW114019 | A09413 | <0.01 | 5 | 160 | <20 | |
| | | | | A09414 | <0.01 | 5 | 195 | <20 | DUPLICATE of A09323 |
| A08844 | 0.11 | 110 | MW114019 | A09415 | <0.01 | 5 | 175 | <20 | |
| A08799 | 0.18 | 180 | MW114019 | A09426 | 0.01 | 10 | 135 | <20 | |
| | | | | A09425 | <0.01 | 5 | 125 | <20 | BLANK |
| A08800 | 0.17 | 170 | MW114019 | A09424 | <0.01 | 5 | 145 | <20 | |
| A08912 | 0.09 | 90 | MW114019 | A09423 | <0.01 | 5 | 145 | <20 | |
| A08926 | 0.02 | 20 | MW114019 | A09421 | 0.01 | 10 | 145 | <20 | |
| A08932 | 0.18 | 180 | MW114019 | A09422 | <0.01 | 5 | 145 | <20 | |
| A08879 | 4.17 | 4170 | MW114019 | A09416 | <0.01 | 5 | 115 | <20 | |
| A08887 | 0.11 | 110 | MW114019 | A09418 | 0.03 | 30 | 145 | <20 | |
| A08892 | 3.41 | 3410 | MW114019 | A09417 | <0.01 | 5 | 160 | <20 | |
| A08952 | <0.01 | 5 | MW114019 | A09419 | 0.01 | 10 | 160 | <20 | |
| A08933 | 6.3 | 6300 | MW114019 | A09407 | 0.02 | 20 | 220 | 20 | |
| A08933 | | | | A09408 | <0.01 | 5 | 180 | <20 | |
| A08933 | | | | A09409 | 0.02 | 20 | 220 | 20 | |
| A08933 | | | | A09410 | | | 95 | | BLEG |
| A08939 | 5.23 | 5230 | MW114019 | A09411 | <0.01 | 5 | 135 | <20 | |
| A08967 | 2.28 | 2280 | MW114019 | A09433 | 0.17 | 170 | 80 | <20 | |
| A08980 | 3.17 | 3170 | MW114019 | A09432 | 0.05 | 50 | 120 | <20 | |
| | | | | | | | | | STANDARD OXk48 3.557. 50gms |
| | | | | | | | | | in 1000gms blank= |
| | | | | A09434 | <0.01 | 10 | 130 | <20 | 3.557/30=177ppb |
| A08981 | 2.31 | 2310 | MW114019 | A09435 | 0.01 | 10 | 140 | <20 | Re-assy |
| A08982 | 2.02 | 2020 | MW114019 | A09436 | <0.01 | 5 | 115 | <20 | |
| | | | | | | | LAB | | |
| | | | | | | | ERROR | | |
Map 32: Soil geochemistry map of the 1stphase of sampling undertaken at Targets 1, 2, 3 and 4.
73
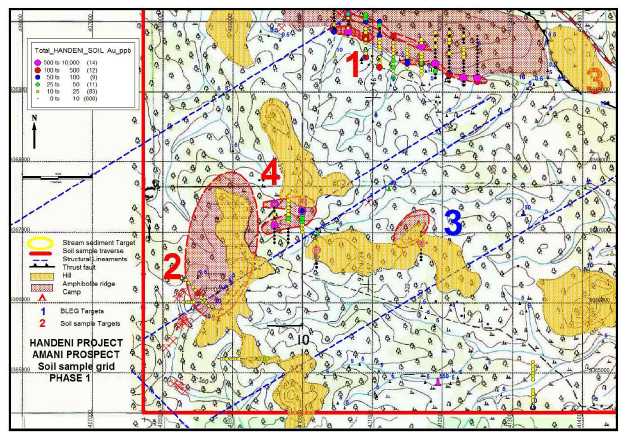
At Target 1, three linear, WNW trending soil anomalies, having an overall strike of 2.4 kilometres, occur on the southern slope of the ampholite ridge. The anomalies, paralleling the structural foliation of the amphibolite, lie proximal to the contact with quartz-feldspar gneisses to the south.
Similar high values were returned from Target 4 in the SW part of the property.
Target 2, 4 and 5
A number of soil sampling traverses were undertaken across Targets 2, 4 and 5 in the western and southwestern parts of the property. Eight E-W traverses were undertaken across the N-S watershed at Target 2. The area is underlain by garnet-amphibolite gneiss. A NW traverse was also sampled across the spur that separates two 2ndorder tributaries of the Suwa River along which current alluvial workings occur further downstream.
A single N-S soil sampling traverse line of 600 meters in length was completed east of the camp in the central part of the property and south of Target 3. Two short N-S soil sampling lines were also completed in the southern part of the property, immediately east of the village of Mazingara through which passes the main Mgata-Handeni all-weather dirt road. A total of 231 samples were collected on 50 meter centers along each of the traverse lines.
Results are summarized inTable 36. The results of Target 2 were generally low with no gold value exceeding 20 ppb gold other than a single soil sample collected on the topographic divide that returned 106 ppb gold(Map 32).
The two samples that returned 3.0 and 4.35 g/t gold occur as isolated values along each of the two traverse lines at Target 5, located east of Mazingara in the southern part of the property.
74
Table 36.Summary of gold values returned from soil sampling across Target 2
| Gold (ppb) | No. of values |
| <1 | 16 |
| 1-10 | 195 |
| 10-25 | 16 |
| 25-50 | .- |
| 50-100 | 1 |
| *>100 | 3 |
| Total | 231 |
| * Maximum values = 3.0 & 4.35g/t Au |
| Arsenic below detection (>20ppm) |
Phase 2
The area was visited in order to validate the high grade soil samples by resampling a number of selected anomalous gold sample positions in the field at Target 1 and 4. The repeat sample was collected from a 30-40 centimeter deep sample pit dug adjacent to the original sample position. The collection of each of the soil samples was carefully monitored and the bags were sealed at site before being transported in grain sacks back to the camp. The samples were submitted to SGS for Aqua Regia analysis of gold.
All soil samples gave low gold values with no correlation to the previous results of soil samples as shown inTable 36. No repeat analysis of the sample batch was possible since the total sample had been used in the Bottle roll.
Phase 3
It was decided to re-sample the entire amphibolite ridge at Target 1 utilising a different geological crew in order to ascertain for certain whether a soil anomaly did exist within the seemingly prospective amphibolite rocks. A total of 230 samples, including 32 QA-QC samples, collected along 200 metres spaced N-S and E-W grid lines at a sample interval of 50 meters, were undertaken across the quartz-feldspar gneiss and amphibolite ridge (Map 33). Approximately 4 kilometers of strike length were covered by the survey. All soil samples were sieved to 180 micron and submitted to SGS laboratories Mwanza for Aqua Regia analysis for ppb level gold as well as arsenic determinations.
Results
Results are summarized inTable 37in which the maximum value reported is 73 ppb Au. No arsenic is reported in any of the samples. Arsenic is an important sulphide associated with the known gold occurrences in the area.
Table 37. Summary of results from the sampling of Target 1
| Gold (ppb) | No. of values |
| <1 | 25 |
| 1-10 | 198 |
| 10-25 | 1 |
| 25-50 | 2 |
| 50-100 | 1 |
| *>100 | - |
75
| Total | 227 |
| * Maximum value = 73 ppb Au |
| Arsenic below detection (>20ppm) |
Map 33. Results of Phase 3 and 4 soil and rock sampling undertaken across the Amani licence.

Phase 4
The area in the SW part of the licence (Target 2) in which artisanal mining is currently active along the Suwa stream was re-investigated. Previous soil sampling during Phase 1 across the ridges and hills that make up the headwaters of the stream returned a number of isolated anomalous gold values (Map 30). A follow-up soil sampling programme, was undertaken on a number of 200 meter spaced, E-W soil sampling traverses at a sample interval of 50 meters. The objective of the soil sampling programme was to detect the source of the gold being found downstream.
Initial results from Phase 1 sampling programme indicated the possibility of gold being released into the streams from a NNE trending narrow topographic spur. The area was subsequently re-sampled with no repeatability of the previous soil sample results being noted. The results of all the samples collected from the E-W traverses across the garnet-amphibolite watershed to the north also returned no anomalous gold values (Map 33).
Mapping of target 1 and 2 were undertaken as part of the reconnaissance investigation across the property. A few shallow artisanal pits were noted on the amphibolite ridge at Target 1 (412470E/9369742N) exposing foliated silicified garnet-amphibole gneiss. A number of rock samples were collected across the ridge and submitted for 50gram Fire analysis to SGS Laboratory, Mwanza. Similarly, a number of rock samples were collected across the soil sample traverse at Target 2 of the foliated quartz-biotite-garnet gneiss. No pyrite or arsenopyrite was noted in any of the outcrops although possible pyrrhotite may be locally present.
76
All the rock samples returned low gold values (Table 38).
Table 38. Results of rock samples collected across the Amani licence
| Target | East | North | SANO | Au ppm | Lithology | COMMENTS |
| 1 | 411807 | 9369576 | A08409 | <0.01 | Amphibolite | massive with disseminated garnet crystals,magnetic |
| East | 419296 | 9368180 | A08766 | 0.03 | Amphibolite | fractured alterd magnetic garnetiferrous amphibolite +- pyrrhotite? |
1 |
412470 |
9369742 |
A08822 |
0.02 |
Amphibolite | highly sheared and silicified garnet amphibolite with epidote
alteration |
| 1 | 411709 | 9369738 | A08895 | 0.02 | Amphibolite | highly sheared garnet amphibolite+_ <sulphide |
| 1 | 410894 | 9369930 | A08903 | 0.02 | Amphibolite | strongly silicified,garnetiferrous and non magnetic , foliated |
| 2 | 408641 | 9365992 | A09094 | 0.01 | Gneiss | garnet-qtz boitite gneiss |
| 2 | 408369 | 9366280 | A09095 | 0.01 | Amphibolite | Massive-foliated |
| 1 | 411630 | 9370578 | A09131 | 0.01 | Amphibolite | Silicified garnet amph |
| 4 | 408884 | 9367486 | A09306 | <0.01 | Amphibolite | Composite channel sample in the trench |
| 4 | 408885 | 9367488 | A09437 | <0.01 | Gneiss | Composite channel sample in the trench |
| East | 424164 | 9371882 | A09588 | 0.02 | Gneiss | Garnet-qtz boitite gneiss with green crystals |
| East | 422234 | 9371264 | A09596 | 0.01 | Gneiss | highly silicified garnet biotite massive gneiss |
| East | 422025 | 9368560 | A09622 | 0.01 | Amphibolite | SIlicified feldspathic gneiss with magnetic garnet amph |
The initial, encouraging results obtained from Phase 1 soil sampling were found to be false. It is not known whether the samples were tampered with at site (salted) or whether there was a serious error/mix-up at the laboratory. A number of rock samples of the garnet-amphibolite gneiss, collected across the ridge returned no gold values suggesting that the unit is not as prospective, based on similar lithologies reported by Canaco Resources to the Magambazi gold project, as previously considered.
The results of the follow-up soil sampling survey (Phase 2 and 3) indicated that no gold anomaly exists across this lithology other than a number of isolated low values not exceeding 73ppb gold. Similarly, no gold anomalies were defined in Targets 2, 3 and 4. No gold was reported from any of the rock samples collected from outcrop.
The source of the gold being won from the Suwa Stream in the SW corner of the property could not be found. It is concluded that the gold may have originated from streams emanating west of the licence boundary.
No arsenic anomalies, which appears to be ubiquitous with gold mineralization in the Handeni region, as reported by Canaco Resources, Brookemonde Capital et al., were associated with any of the soil samples collected. This suggests that no significant gold system is present over any of the areas investigated.
No further work is warranted on the licences and the property has subsequently been returned to the licence owner.
North Mara Gold Projects
The North Mara Gold Project, comprising of 10 Prospecting licences and covering 585.07 square kilometers, have been divided into 3 blocks, namely the Tarime, Nyabigena and the Kubiasi Kiserya project areas which includes the Kiagata Project. A recent addition to the North Mara Gold project is the Maji Moto licence (HQ-P23869), located 28 kilometers to the SW of the African Barrick, North Mara Gold mine.Kiagata Project (PL 4225/2006)
The Kiagata project, located within the North Mara Greestone belt, is situated in the Musoma District and is about 30 kilometers from Musoma Town, the main commercial hub in the area. The project is located immediately south of the Mara river and west of the Serengeti National Park.
77
A reconnaissance survey involving mapping, termite sampling, and selected soil and rock sampling were carried out during the quarter.
No historical or artisanal gold workings are present on the licence.
The area is underlain by granitic rocks that form large granitic hills that cover most of the licence. The central part of the licence is overlain by alluvial gravels and black cotton clays (“mbuga’). Laterite is commonly present at the base of the granitic hills. No greenstone rocks are present on the licence other than minor diorite float noted in the southern part of the licence(Map 34). A number of thin east-west barren quartz veins are noted within the granite.
Map 34. Geology map of Kiagata PL 4225/2006
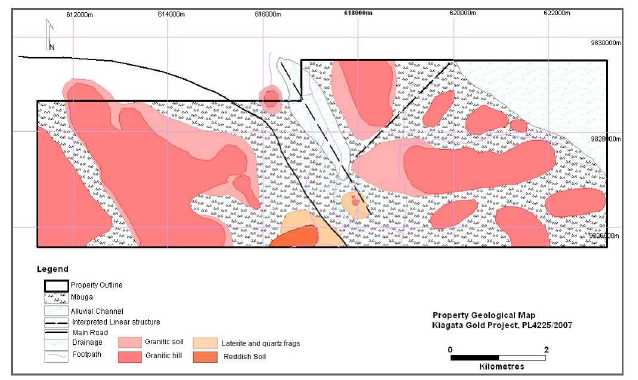
A select number of N-S soil sampling traverses on a 400 meter x 50 meter grid was undertaken across potential targets in the southern part of the licence where red soils, quartz and diorite fragments were noted. A total of 13 soil samples were submitted for Aqua Regia analysis of gold at SGS Laboratory, Mwanza.
Termite sampling was undertaken across non-“mbuga” areas in which 9 samples were submitted for 500 gm Bleg analysis. Five rock samples of quartz veins were analysed by Fire assay. Results are summarized inTable 39.
Table 39. Best results of sampling undertaken on the Kiagata PL 4225/2007
Total samples
| Soil (Au ppb)
| Termite (Au
ppm) | Rock (Au ppm)
|
| 9 | 3 | | |
| 9 | | <0.10 | |
| 5 | | | 0.03 |
The licence is underlain by granitic rocks. Sampling of possible tagets has indicated that no gold is present. No further work is warranted and the licence is recommended to be relinquished.
Kubiasi Kiserya (PL4833/2007)
78
The Kiserya project is located in northeastern Tanzania approximately 18 kilometers southeast from African Barrick’s North Mara Gold Mine, within the N Mara Gold Belt. The licence lies adjacent to the Mara River and to the north of the Serengeti Game Reserve. The northern and western parts of the licence are underlain by greenstone rocks that tend to crop out as a series of large hills that dot the surrounding plains. The remainder of the licence is underlain by granite. Little to no colluvium of black clay “mbuga” is present.
The southeast corner of the licence lies within the Serengeti National park but since mining activities are banned, this area has subsequently been relinquished. A single PML is currently under application for the last 3 years in the central to western part of the licence but, as yet, has not been granted to the Tanzanian national.
An old colonial shaft occurs in the northern part of the PL. Within the centre of the licence, recent artisanal mining has explored an outcropping, vertical dipping, auriferous quartz vein which returned a grade of 8.17 g/t gold over 0.5 meter and 4.58g/t gold across 1 meter in the hanging wall rocks. The quartz vein, exhibiting a “pinch and swell” structure, appears to swing from a strike of 055oin the north and continues in an E-W direction across a strike length of +200 meters. Both sites are hosted by sheared granitic rocks. Additional quartz vein with associated disseminated sulphide mineralisation have been noted in the eastern and southern parts of the licence.
Soil sampling with regional mapping has been completed along a 200 meter x 50 meter N-S grid during the latter part of 2010, but, only samples on 400 meter line spacing have been analysed. Select infilling soil samples on 200 meter x 50 meter line spacing were later carried out. A total 1349 soil samples were collected of which 750 samples were selected and analysed by SGS Laboratory, Mwanza (Table 40). At least 4 regional, low level soil anomalies, having overall strike lengths of between 3 to 4 kilometers and trending ENE were originally outlined but infill sampling refined these targets to 6 smaller anomalies(Map 35). Basically 5 of the anomalies are hosted in granite within the central part of the licence. The 6thanomaly occurs within the mafic rocks close to the granite contact on the western side of the licence. All soil anomalies, having limited strike of up to 1.2 kilometers and appear to trend north-northeast to east-west.
Table 40. Summary of soil geochemistry results
| Range (Au ppb/As ppm) | Au Samples | As samples |
| <10 | 509 | 626 |
| 20-30 | 124 | - |
| 20-30 | 69 | - |
| 30-40 | 32 | - |
| 40-50 | 10 | - |
| 50-100 | 4 | - |
| >100 | 2 | - |
| Total | 750 | 626 |
Follow-up trenching was undertaken over soil-in-gold anomalies (Table 41). Nine trenches, averaging 15 meters in length and totalling 150 meters, were orientated normal to the soil anomaly trend (Map 35). Thin quartz veins not exceeding 25 centimeters in width were encountered in some of the trenches. Two meter channel samples were undertaken at the base of the trench and the quartz veins were individually sampled. Samples were submitted to SGS Laboratory Mwanza for 50 gram Fire assay. Results from the trench sampling returned no gold values in any of the trenches. A total of 31 rock samples have been collected and analysed for gold (Table 42).
Map 35: Soil anomaly map of Kubiasi Kiserya PL4833/2007
79
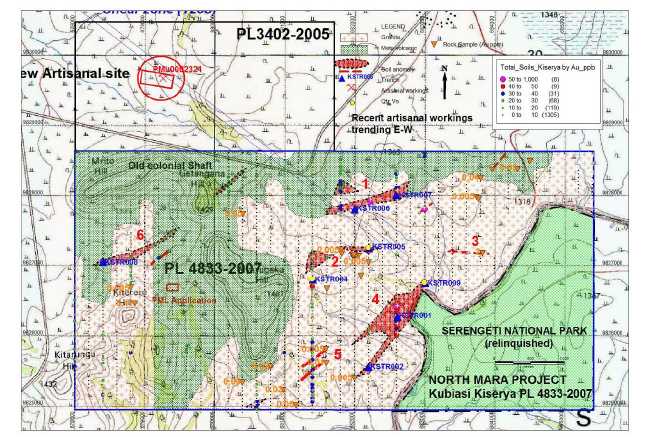
Table 41. Trench programme targeting specific soil anomalies
| | | | | | Soil Anomaly | |
TR_ID |
UTM_E60 |
UTM_N60 |
AZIMUTH |
EOH |
Anomaly |
SANO | Au
(ppb) |
Comments |
| KSTR001 | 682614 | 9826262 | 320 | 30 | 4 | A05417 | 50 | Qtz Vn -10cm, Qtz vn - 5 cm |
| KSTR002 | 682201 | 9825546 | 310 | 15 | 4 | A05767 | 1 | Qtz Vn - 5cm |
| KSTR003 | 682617 | 9826264 | 310 | 15 | | | | |
| KSTR004 | 681406 | 9826796 | 310 | 15 | | A05069 | 10 | Qtv Vn - 5 cm |
| KSTR005 | 682206 | 9827246 | 310 | 15 | 2 | A05300 | 160 | Qtz Vn - 15cm |
| KSTR006 | 682004 | 9827796 | 310 | 15 | 1 | A05246 | 170 | - |
| KSTR007 | 682596 | 9828000 | 310 | 15 | 1 | A05452 | 40 | - |
KSTR008 |
678405 |
9827042 |
310 |
15 |
6 |
NMK_S0141 |
60 | Qtz Vn - 25 cm Qtz Vn - 10
cm Qtz Vn - 5 cm |
| KSTR009 | 683008 | 9826746 | 310 | 15 | 4 | A05532 | 50 | Qtz Vn - 6cm |
Table 42. Results of in situ rock samples collected across PL 4225/2007
80
| SANO | East(Arc 60) | North (Arc 60) | Au ppm | Descriptions |
| A05751 | 680404 | 9827726 | 0.05 | Quartz vein |
| A05752 | 680397 | 9825324 | 0.09 | Quartz vein |
| A05753 | 680800 | 9825554 | 0.02 | Quartz vein |
| A05754 | 680983 | 9825220 | 0.03 | Quartz vein |
| A05755 | 681168 | 9825000 | 0.05 | Quartz vein, boxwork structures, grab sample. |
| A05756 | 681597 | 9825598 | 0.01 | Quartz vein, grab sample. |
| A05757 | 681596 | 9825800 | 0.005 | Quartz vein, grab sample. |
| A05758 | 681609 | 9826666 | 0.02 | Quartz vein, grab sample. |
| A05759 | 681813 | 9827218 | 0.005 | Quartz vein as grab collected from a burren artisanal Pit. |
| A05760 | 681814 | 9827162 | 0.03 | Exposed quartz vein, 290 strike, |
| A05761 | 682006 | 9827140 | 0.005 | Quartz vein, artisanal pit, 300/62 strike/dip |
| A05762 | 682021 | 9827138 | 0.005 | Quartz vein, 300/62 strike/dip |
| A05763 | 682060 | 9827130 | 0.005 | Quartz vein,shaft-artisanal mining |
| A05764 | 682097 | 9826846 | 0.005 | Poorexposed quartz vein,boxwork structures. |
| A05765 | 682000 | 9825384 | 0.005 | Quartz vein. |
| A05766 | 682201 | 9827038 | 0.005 | Quartz vein, . |
| A05767 | 683803 | 9828243 | 0.04 | Quartz vein, 020 strike, Dessiminated sulphide. |
| A05768 | 683745 | 9827974 | 0.005 | Quartz vein, 320 strike |
| A05769 | 683776 | 9827946 | 0.05 | Quartz vein, 270 strike |
| A05770 | 683831 | 9827176 | 2.0 | Quartz vein, minor disseminated sulphide. |
| A05771 | 683970 | 9828364 | 1.99 | Quartz vein, 040 strike |
| A05772 | 684331 | 9828374 | 0.05 | Quartz vein, 040 strike, with disseminated sulphide |
| A05773 | 684507 | 9828482 | 4.98 | Quartz vein,040 strike, with disseminated sulphide |
| NMK-R01 | 678800 | 9826678 | 0.005 | Quartz vein with hematite alterations. |
| NMK-R02 | 678858 | 9826450 | 5.17 | Sheared quartz vein, from artisanal pit. |
| 283653 | 681968 | 9827142 | 8.17 | Quartz vein. |
| 283654 | 681968 | 9827142 | 0.3 | Footwall to Quartz Vein |
| 283655 | 681968 | 9827142 | 4.58 | Hanging wall to Quartz Vein |
| 283656 | 681976 | 9827142 | 0.04 | Ferruginous alteration in artisanal pit |
| 283657 | 681991 | 9827140 | 0.02 | Quartz Vein |
Results of the follow-up exploration on the intial soil sampling anomalies were generally poor, with none of the trenches returning any anomalous gold values.
Future Exploration
Exploration is to be focused on investigating:
| i. | Anomaly 1, located along the granite/metavolcanic contact that has been cut by a prominent NW-SE shear zone. Active artisanal workings occur along the shear zone some 500 meters NW of the licence. |
| ii. | The E-W striking quartz veins in Anomalies 2 and 3 which returned anomalous gold values. |
| iii. | The N-S trending Anomaly 4. |
| iv. | The quartz vein that returned 5.15 g/t gold on the northern slope of Kiterere Hill in the Eastern part of the Prospect. |
| v. | The old colonial shaft at the base of Getangana Hill |
Mapping, trenching and possible Schlumberger VES profiling are planned to complete this phase of exploration.
Maji Moto HQ-P23869
81
A recent acquisition to the North Mara group of licences is the Maji Moto licence that was awarded to the Company by the Ministry of Mines through application and tender in April 2012.
The licence is situated in the North Mara Greenstone Belt (Eastern Musoma Goldfields) approximately 28 kilometers to the SW of African Barrick’s North Mara Gold Mine (Map 36).
Map 36:.Location map of Maji Moto HQ-P23869

Note: HQ-O23869 is the Application number. The licence has yet to be allocated a PL number by the Ministry. Artisanal workings:Three artisanal sites are present in the northern part of the licence (Map 37):
| | 1. | Located at Kitarahota Hill, some 2 kilometres east of Maji Moto village is actively being mined by a relatively small group of artisanal miners. The site, located on the lower slope of the Kitarahota Hill, consists mostly of surface workings. |
| | 2. | Nyamarubiti Hill, located in the north-eastern arm of the licence was an active artisanal site in 1980s and is only be worked sporadically by a handful of artisanal miners. |
| | 3. | Kebosi Hill, situated on the NW arm of the PL and east of the much larger Kitengara Hill. This site appears not as extensively mined as site 2 and is currently not being mined by artisanal miners. |
Map 37 Geology of HQ-P23869
82
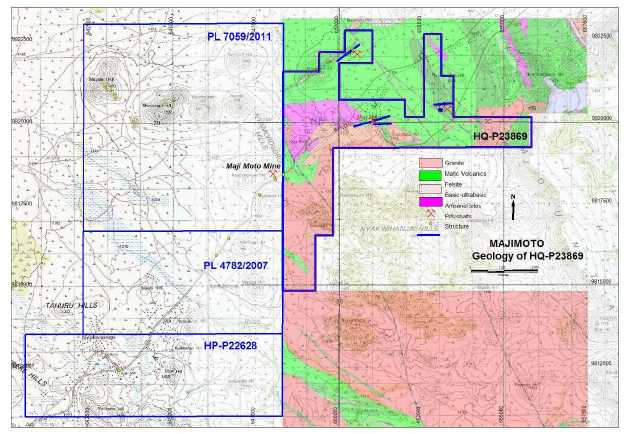
Other than a reconnaissance visit to the licence, exploration has not yet commenced.
The following exploration strategy (Phase 1) will be followed as soon as a field camp is established on site:
- Regional ground Magnetic survey
- Regional mapping of the licence
- Regional soilsampling on 200 meter x 50 meter sample grid
- Detailed mapping and soil/rock sampling at and around the artisanal sites
- Schlumberger profiles across the known artisanal sites.
Phase 2 will be dependant on the results achieved from the Phase 1 exploration programme.
83
| ITEM 3. | LEGAL PROCEEDINGS. |
We are not a party to any litigation.
| ITEM 4. | MINE SAFETY DISCLOSURES. |
Not Applicable.
PART II
ITEM 5. | MARKET FOR THE REGISTRANT’S COMMON EQUITY, RELATEDSTOCKHOLDER MATTERS AND ISSUER PURCHASES OF EQUITY SECURITIES. |
Market for Securities
Our company’s common stock is traded on the FINRA OTC Bulletin Board under the symbol “LVCA”. Set forth below are the range of high and low bid quotations for the periods indicated as reported by the FINRA. The market quotations reflect inter-dealer prices, without retail mark-up, mark-down or commissions and may not necessarily represent actual transactions.
| Quarter Ending | High | Low |
| March 31, 2012 | $0.20 | $0.04 |
| December 31, 2011 | $0.16 | $0.01 |
| September 30, 2011 | $0.30 | $0.08 |
| June 30, 2011 | $0.37 | $0.22 |
| March 31, 2011 | $0.26 | $0.22 |
| December 31, 2010 | $0.35 | $0.32 |
| September 30, 2010 | $0.37 | $0.32 |
| June 30, 2010 | $0.35 | $0.28 |
Our transfer agent is Pacific Stock Transfer Company, of 4045 South Spencer Street, Suite 403, Las Vegas, NV 89119; telephone number: 702.361.3033; facsimile: 702.433.1979.
Holders of our Common Stock
As of June 29, 2012, there were 209 registered stockholders holding 111,770,733 shares of our issued and outstanding common stock.
Dividend Policy
There are no restrictions in our articles of incorporation or bylaws that prevent us from declaring dividends. The Nevada Revised Statutes, however, do prohibit us from declaring dividends where, after giving effect to the distribution of the dividend:
| | 1. | We would not be able to pay our debts as they become due in the usual course of business; or |
| | | |
| | 2. | Our total assets would be less than the sum of our total liabilities plus the amount that would be needed to satisfy the rights of shareholders who have preferential rights superior to those receiving the distribution. |
We have not declared any dividends and we do not plan to declare any dividends in the foreseeable future.
84
Recent Sales of Unregistered Securities
In April, 2012 we completed a first closing of a private placement of 14,285,000 shares at a price of $0.06 per share for gross proceeds of $857,100. We issued an aggregate of 2,000,000 shares to one subscriber that each represented that it was not a US person (as that term is defined in Regulation S of the Securities Act of 1933) in an offshore transaction pursuant to Regulation S and/or Section 4(2) of the Securities Act of 1933 and an additional 12,285,000 shares to eight accredited investors, who represented that they were each a “US Person” as defined in Regulation S, pursuant to Rule 506 of Regulation D and/or Section 4(2) of the Securities Act of 1933. Proceeds of the private placement are intended to be applied to the Company’s ongoing work program on its mining projects, continued exploration for new projects and general working capital.
Purchases of Equity Securities by the Issuer and Affiliated Purchasers
We did not purchase any of our shares of common stock or other securities during our fiscal year ended March 31, 2012.
| ITEM 6. | SELECTED FINANCIAL DATA. |
Not Applicable.
ITEM 7. | MANAGEMENT’S DISCUSSION AND ANALYSIS OF FINANCIAL CONDITION ANDRESULTS OF OPERATIONS. |
The following discussion should be read in conjunction with our audited financial statements and the related notes that appear elsewhere in this annual report. The following discussion contains forward-looking statements that reflect our plans, estimates and beliefs. Our actual results could differ materially from those discussed in the forward looking statements. Factors that could cause or contribute to such differences include those discussed below and elsewhere in this annual report.
Our audited consolidated financial statements are stated in United States dollars and are prepared in accordance with United States generally accepted accounting principles.
Plan of Operation
As of March 31, 2012, we had working capital of approximately $366,713. We plan to spend approximately $94,000 for our property acquisitions and $625,000 for exploration activities through 2013, with work being conducted on several projects including soil sampling, trenching, IP gradient, magnetic survey and drilling. We will need to raise additional funds to finance the exploration activities on our projects. There is no assurance that such financing would be available at this time.
Our estimated expenses over the next twelve months are as follows:
Cash Requirements during the Next Twelve Months
| Expense | ($) |
| Property acquisition and holding costs | 94,000 |
| Exploration expenses | 625,000 |
| Professional fee | 170,000 |
| General and administration fee | 500,000 |
| Total | 1,389,000 |
There is no historical financial information about us upon which to base an evaluation of our performance. We are an exploration stage corporation and have not generated any revenues from operations. We cannot guarantee we will be successful in our business operations. Our business is subject to risks inherent in the establishment of a new business enterprise, including limited capital resources, possible delays in the exploration of our properties, possible cost overruns due to price and cost increases for services and economic conditions. Because we do not currently derive any production revenue from operations, its ability to conduct exploration and development on properties is largely based upon its ability to raise capital by equity funding.
85
Our exploration objective is to find an economic mineral body containing gold. Our success depends upon finding mineralized material. This includes a determination by our contracted consultants and professional staff whether the property contains resources and/or reserves. Mineralized material is a mineralized body, which has been delineated by appropriately spaced drilling or underground sampling to support sufficient tonnage and average percentage grade of metals to justify removal. If we don’t find mineralized material or we cannot remove mineralized material, either because we do not have the money to do so or because it is not economically feasible to do so, we will cease operations or seek other properties.
In addition, we may not have enough capital to complete exploration of our properties. If we have not raised sufficient funds to complete our exploration program, we will try to raise additional funds from another equity or debt offering or rely on loans from shareholders. If we require additional funds and are unable to raise the required amounts, we will have to suspend or cease operations until we succeed in raising the additional funds.
RESULTS OF OPERATIONS
The following summary of our results of operations should be read in conjunction with our audited financial statements for the financial years ended March 31, 2012 and 2011 which are included herein.
Our operating results for the years ended March 31, 2012 and 2011 are summarized as follows:
| | | Years Ended | |
| | | March31, | |
| | | 2012 | | | 2011 | |
| Revenue | $ | - | | $ | - | |
| Operating Expenses | | 3,043,395 | | | 4,943,936 | |
| Other Income (Expenses) | | 658,702 | | | (76,775 | ) |
| Net Loss | $ | 2,384,693 | | $ | 5,020,711 | |
Revenue
We had no operating revenues for the fiscal years ended March 31, 2012 and 2011. We do not anticipate earning any revenue from our operations until such time as we have entered into commercial production at one or more of our mineral projects or we sell one or more of our mineral properties. We are currently in the exploration stage of our business and we can provide no assurance that we will discover a reserve on our properties or, if we do discover a reserve that we will be able to enter into commercial production.
Operating Costs and Expenses
The major components of our expenses for the years ended March 31, 2012 and 2011 are outlined in the table below:
| | | For the Year Ended | |
| | | March 31, | |
| | | 2012 | | | 2011 | |
| | | $ | | | $ | |
| EXPENSES | | | | | | |
| Amortization and depreciation | | 36,210 | | | 24,221 | |
| Exploration costs | | 1,084,929 | | | 1,194,934 | |
| General and administrative | | 329,603 | | | 330,415 | |
| Impairment of mineral property acquisition costs | | 441,612 | | | 742,180 | |
| Management and director fees | | 32,000 | | | 102,000 | |
| Professional fees | | 275,130 | | | 831,947 | |
| Salaries | | 563,101 | | | 101,739 | |
| Stock-based compensation | | 213,825 | | | 1,593,989 | |
| Travel and accommodation | | 66,985 | | | 22,511 | |
| Total Operating Expenses | | 3,043,395 | | | 4,943,936 | |
86
The decrease of $812 in our general and administrative expenses for the year ended March 31, 2012 as compared to the same period in fiscal 2011 was primarily due to the decrease in promotion and shareholder relation expenses and filing fees which offsets the increase in licenses holding costs, computer related expenses, office rent and insurance expenses.
Exploration costs were decreased by $110,005 to $1,084,929 during the current period as a result of the decreased exploration activity in the Company. On June 21, 2011, we entered into exploration service agreement with Otterburen to perform exploration services on optioned projects. As per the service agreement, Otterburn agreed to pay exploration cost incurred on Singida project from the month of March through the termination date of July 8, 2011. The reimbursement of exploration cost on Singida for was 623,290 in 2012 as compared to $256,968 in 2011.
Professional fees for the twelve months ended March 31, 2012 decreased to $275,130 compared to $831,947 for the same period of 2011. A main factor to this reduction is a higher level of advice the Company required for geological consulting, legal and accouting services in last fiscal year. In addition, three officers were employeed in 2012 which was paid as professional fee in 2011.
In 2012, we have paid $998,362 to acquire minerial property interests on the Geita, Singida, Uyowa, Handeni and Buhemba Projects in comparison to the property option payment of $742,180 on the Singida Project. As of March 31, 2012, we assessed our minerial properties and recognized an impairement loss on acquisition costs of $441,612 compared to impairement loss of $742,180 recognized in 2011.
| | | 2012 | | | 2011 | |
| Geita Project | | 6,150 | | | - | |
| Singida Project | | 350,512 | | | 742,180 | |
| Uyowa Project | | 40,000 | | | - | |
| Handeni Project | | 344,750 | | | - | |
| Buhemba Project | | 256,950 | | | - | |
| | $ | 998,362 | | $ | 742,180 | |
Since November, 2009 we have used our wholly owned subsidiary Lake Victoria Resources (T) Limited to perform all exploration and contracting within Tanzania. Geo Can, a Tanzania corporation, was initially founded by three common directors of the Company to identify prospective mineral properties in Tanzania. Through time Geo Can had acquired a portfolio of prospective licenses. On May 4, 2009, Kilimanjaro completed a Property Purchase Agreement with Geo Can. Under the terms of the agreement Kilimanjaro acquired 100% interests of the mineral property assets of Geo Can, which included 33 gold prospecting licenses and 13 uranium licenses. Prior to the closing of the Property Purchase Agreement between Geo Can and Kilimanjaro, Geo Can had entered into Option to Purchase Property agreements, regarding some of its resource properties, with Lake Victoria. As of the execution of the Property Purchase Agreement, May 5, 2009, Geo Can no longer had any interest in those prior property agreements with Lake Victoria. As of the date of this annual report, Geo Can holds property titles in trust for Kilimanjaro as the sole Beneficiary, in accordance with the terms of the Statutory Declaration, Declaration of Trust and Release dated July 23, 2009. Geo Can will act on the direction of Kilimanjaro as the Beneficiary to transfer the title or interest to the Beneficiary or as directed by the Beneficiary.
On June 1, 2011, we paid Geo Can $121,480 which was the difference between amounts owing for exploration services totaling $620,523 and advances of $499,043 made to Geo Can through our subsidiary, Kilimanjaro Mining Company. As of March 31, 2012, we owed $Nil (2011 - $121,480) to Geo Can for reimbursement of licenses holding costs paid on behalf of us which has been included in accounts payable to related parties.
Liquidity and Capital Resources
| Working Capital | | | | | | | | | |
| | | | | | | | | Percentage | |
| | | As at | | | As at | | | Increase / | |
| | | March 31, 2012 | | | March 31, 2011 | | | (Decrease) | |
| Current Assets | $ | 586,592 | | $ | 3,071,597 | | | (81% | ) |
| Current Liabilities | $ | 219,879 | | $ | 961,420 | | | (77% | ) |
| Working Capital (Deficiency) | $ | 366,713 | | $ | 2,110,177 | | | (83% | ) |
87
| Cash Flows | | | | | | | | | |
| | | | | | | | | Percentage | |
| | | Year Ended | | | Year Ended | | | Increase / | |
| | | March 31, 2012 | | | March 31, 2011 | | | (Decrease) | |
| Cash used by Operating Activities | $ | (2,390,112 | ) | $ | (2,604,021 | ) | | (8% | ) |
| Cash provided (used) by Investing Activities | $ | (106,484 | ) | $ | (768,838 | ) | | (86% | ) |
| Cash provided by Financing Activities | $ | 737,100 | | $ | 4,700,360 | | | (84% | ) |
| Net Increase (Decrease) in Cash | $ | (1,759,497 | ) | $ | 1,327,501 | | | (233% | ) |
We had a cash balance of $523,405 and working capital of $366,713 as of March 31, 2012 compared to cash of $2,282,902 and working capital of $2,110,177 as of March 31, 2011. We anticipate that we will incur approximately $1,389,000 for operating expenses, including professional, legal and accounting expenses associated with our reporting requirements under the Exchange Act during the next twelve months.
Effective April 17, 2012, we issued 14,285,000 units at a price of $0.06 per unit for gross proceeds of $857,100. Each unit consisted of one share of common stock and one share purchase warrant entitling the warrant holder to purchase an additional share of common stock at a price of $0.12 per share for a period of six months from closing. We issued an aggregate of 2,000,000 units to one subscriber in an offshore transaction pursuant to Regulation S and/or Section 4(2) of theSecurities Act of 1933.We issued an additional 12,285,000 units to eight subscribers, who represented that they were accredited investors as that term is defined in Rule 501 of Regulation D.
Going Concern
The audited financial statements accompanying our annual report on Form 10-K for the year ended March 31, 2012 have been prepared on a going concern basis, which implies that our company will continue to realize its assets and discharge its liabilities and commitments in the normal course of business. Our company has not generated revenues since inception and has never paid any dividends and is unlikely to pay dividends or generate earnings in the immediate future. The continuation of our company as a going concern is dependent upon the continued financial support from our shareholders, the ability of our company to obtain necessary equity financing to achieve our operating objectives, and the attainment of profitable operations. As of March 31, 2012, we had cash of $523,405 and we estimate that we will require approximately $670,000 for general and administration costs and professional fees, and $719,000 for property acquisition holding and exploration costs associated with our plan of operation over the next twelve months. We do not have sufficient funds for general and administration activities and we do not have sufficient funds for planned mineral property acquisition and exploration activities. Therefore we will be required to raise additional funds. No assurance can be given that additional financing will be available, or that it can be obtained on terms acceptable to the Company and its shareholders.
The advancement of our business is dependent upon us raising additional financial support. The issuance of additional equity securities by us could result in a significant dilution in the equity interests of our current stockholders. Obtaining commercial loans, assuming those loans would be available, will increase our liabilities and future cash commitments.
Future Financings
We had a cash balance of $523,405 and working capital of $366,713 as of March 31, 2012 compared to cash of $2,282,902 and working capital of $2,110,177 as of March 31, 2011 and we estimate that we will require approximately $1,389,000 for costs associated with our plan of operation over the next twelve months. Accordingly, we do not have sufficient funds for planned operations and we will be required to raise additional funds for operations. We intend to raise additional funds from another equity offering or loans. If we need additional funds and are unable to raise them, we will have to suspend or cease operations until we succeed in raising additional funds.
Outstanding shares and options
On December 7, 2010, our shareholders approved a resolution to amend the articles of incorporation to increase the number of authorized shares of our common stock from 100,000,000 shares to 250,000,000 shares. As of June 29, 2012, we have 111,770,733 shares of common stock outstanding, 9,520,000 stock options outstanding and 37,040,401 warrants outstanding.
88
Off-Balance Sheet Arrangements
We have no off-balance sheet arrangements that have or are reasonably likely to have a current or future effect on our financial condition, changes in financial condition, revenues or expenses, results of operations, liquidity, capital expenditures or capital resources that are material to stockholders.
Critical Accounting Policies
The following are the accounting policies that we consider to be critical accounting policies. Critical accounting policies are those that are both important to the portrayal of our financial condition and results and those that require the most difficult, subjective, or complex judgments, often as results of the need to make estimates about the effect of matters that are subject to a degree of uncertainty.
Business Combinations
We follow the guidance in ASC 805, Business Combinations, and ASC 810, Consolidation. The non-controlling interest recognized at March 31, 2010 was previously the minority interest held by certain passive shareholders at the consolidated financial statement level of Kilimanjaro, and whose interests were eliminated for accounting purposes by the August 7, 2009 share exchange agreement. We, after August 7, 2009, had no further non-controlling interests.
As of March 31, 2012, a cumulative loss of $8,719,455 had been attributed to the non-controlling interest of the Company’s controlled subsidiary.
89
Basic and Diluted Net Income (Loss) Per Share
We compute net income (loss) per share in accordance with ASC 260, Earnings per Share, which requires presentation of both basic and diluted earnings per share (EPS) on the face of the income statement. Basic EPS is computed by dividing net income (loss) available to common shareholders (numerator) by the weighted average number of shares outstanding (denominator) during the period. Diluted EPS gives effect to all dilutive potential common shares outstanding during the period using the treasury stock method and convertible preferred stock using the if-converted method. In computing diluted EPS, the average stock price for the period is used in determining the number of shares assumed to be purchased from the exercise of stock options or warrants. Diluted EPS excludes all dilutive potential shares if their effect is anti dilutive. As of March 31, 2012 and 2011, we had 26,004,901 and 45,604,901, respectively, dilutive securities outstanding.
Cash and Cash Equivalents
We consider all highly liquid instruments with a maturity of three months or less at the time of issuance to be cash equivalents.
As of March 31, 2012 and 2011, we have approximately $40,000 and $2,234,000, respectively, deposited at FDIC insured banks in the United States. FDIC deposit insurance covers the balance of each depositor’s account up to $250,000 per insured bank.
As of March 31 2012 and 2011, we have approximately $365,000 and $Nil deposited in Canada including $34,594 (CAD$ 34,500) and $Nil, respectively, of guaranteed investment certificates bearing variable interest at prime rate less 2.05% which is restricted in use for corporation credit cards.
As of March 31, 2012, we have Tanzania shillings of 84,496,000 (approximately $52,400 USD) and $141,600 deposited in Tanzania. The Deposit Insurance Board in Tanzania insures up to 1,500,000 Tanzanian Shillings (approximately $930 USD as of March 31, 2012) per customer per bank. Any amount beyond the basic insurance amount may expose the Company to loss.Property and Equipment
Property and equipment consists of mining tools and equipment, furniture and equipment and computers and software which are depreciated on a straight line basis over their expected lives of five years.
Mineral Property Costs
Under US GAAP mineral property acquisition costs are ordinarily capitalized when incurred using FASB ASC Topic 805-20-55-37, Whether Mineral Rights are Tangible or Intangible Assets. The carrying costs are assessed for impairment under ASC Topic 360-36-10-35-20, Accounting for Impairment or Disposal of Long-Lived Assets, whenever events or changes in circumstances indicate that the carrying costs may not be recoverable. The Company expenses as incurred all property maintenance and exploration costs.
The Company also evaluates the carrying value of acquired mineral property rights in accordance with ASC Topic 930-360-35-1, Mining Assets: Impairment and Business Combinations, using the Value Beyond Proven and Probable (VBPP) method. The fair value of a mining asset generally includes both VBPP and an estimate of the future market price of the minerals.
When the Company has capitalized mineral property costs, these properties will be periodically assessed for impairment of value. Once a property reaches the production stage, the related capitalized costs will be amortized, using the units of production method. During the years ended March 31, 2012 and 2011, the Company records its interests in mining properties and areas of geological interest at cost. The Company has capitalized mineral properties costs of $556,750 and $Nil for the years ended at March 31, 2012 and 2011, respectively. The Company has recognized impairment charges of $441,612 and $742,180 for the years ended at March 31, 2012 and 2011, respectively, which were determined not be recoverable and therefore, were written down to their estimated fair values of $Nil.
Long-Lived Assets
90
In accordance with ASC 360, Property Plant and Equipment we tests long-lived assets or asset groups for recoverability when events or changes in circumstances indicate that their carrying amount may not be recoverable. Circumstances which could trigger a review include, but are not limited to: significant decreases in the market price of the asset; significant adverse changes in the business climate or legal factors; accumulation of costs significantly in excess of the amount originally expected for the acquisition or construction of the asset; current period cash flow or operating losses combined with a history of losses or a forecast of continuing losses associated with the use of the asset; and current expectation that the asset will more likely than not be sold or disposed significantly before the end of its estimated useful life. Recoverability is assessed based on the carrying amount of the asset and the sum of the undiscounted cash flows expected to result from the use and the eventual disposal of the asset, as well as specific appraisal in certain instances. An impairment loss is recognized when the carrying amount is not recoverable and exceeds fair value.
Asset Retirement Obligations
We accounts for asset retirement obligations in accordance with the provisions of ASC 440, Asset Retirement and Environmental Obligations which requires we to record the fair value of an asset retirement obligation as a liability in the period in which it incurs a legal obligation associated with the retirement of tangible long-lived assets that result from the acquisition, construction, development and/or normal use of the assets. We did not have any asset retirement obligations as of March 31, 2012.
Foreign Currency Translation
We’s functional and reporting currency is the United States dollar. Monetary assets and liabilities denominated in foreign currencies are translated to United States dollars in accordance with ASC 740, Foreign Currency Translation Matters, using the exchange rate prevailing at the balance sheet date. Gains and losses arising on translation or settlement of foreign currency denominated transactions or balances are included in the determination of income.
To the extent that we incur transactions that are not denominated in its functional currency, they are undertaken in Canadian dollars and the Tanzanian Schilling. A portion of business transactions in Tanzania and mineral option purchase agreements are denominated in the Tanzanian Schilling. We has not, to the date of these financials statements, entered into derivative instruments to offset the impact of foreign currency fluctuations.
Segment Information
At March 31, 2012, approximately $168,900 of property and equipment is located in Tanzania and $34,600 in Canada. Although Tanzania is considered economically stable, it is always possible that unanticipated events in foreign countries could disrupt the Company’s operations.
Comprehensive Loss
ASC 220, Comprehensive Income, establishes standards for the reporting and display of comprehensive loss and its components in the consolidated financial statements. As at March 31, 2012 and 2011, we had no items that represent other comprehensive loss, and therefore has not included a schedule of comprehensive loss in the consolidated financial statements.
Income Taxes
We accounts for income taxes using the asset and liability method in accordance with ASC 740, Income Taxes. The asset and liability method provides that deferred tax assets and liabilities are recognized for the expected future tax consequences of temporary differences between the financial reporting and tax bases of assets and liabilities, and for operating loss and tax credit carryforwards. Deferred tax assets and liabilities are measured using the currently enacted tax rates and laws that will be in effect when the differences are expected to reverse. We record a valuation allowance to reduce deferred tax assets to the amount that is believed more likely than not to be realized.
Stock-Based Compensation
We records stock-based compensation in accordance with ASC 718, Compensation – Stock Based Compensation and ASC 505, Equity Based Payments to Non-Employees, which requires the measurement and recognition of compensation expense based on estimated fair values for all share-based awards made to employees and directors, including stock options.
91
ASC 718 requires companies to estimate the fair value of share-based awards on the date of grant using an option-pricing model. We uses the Black-Scholes option-pricing model as its method of determining fair value. This model is affected by we’s stock price as well as assumptions regarding a number of subjective variables. These subjective variables include, but are not limited to we’s expected stock price volatility over the term of the awards, and actual and projected employee stock option exercise behaviours. The value of the portion of the award that is ultimately expected to vest is recognized as an expense in the statement of operations over the requisite service period.
All transactions in which goods or services are the consideration received for the issuance of equity instruments are accounted for based on the fair value of the consideration received or the fair value of the equity instrument issued, whichever is more reliably measurable.
Recent Accounting Pronouncements
In January 2010, the FASB issued Accounting Standards Update (ASU) No. 2010-06, Improving Disclosures about Fair Value Measurements, which amends the ASC Topic 820, Fair Value Measurements and Disclosures. ASU No. 2010-06 amends the ASC to require disclosure of transfers into and out of Level 1 and Level 2 fair value measurements, and also requires more detailed disclosure about the activity within Level 3 fair value measurements. The new disclosures and clarifications of existing disclosures are effective for interim and annual reporting periods beginning after December 15, 2009, except for the disclosures concerning purchases, sales, issuances, and settlements in the roll forward of activity in Level 3 fair value measurements. Those disclosures are effective for fiscal years beginning after December 15, 2010, and for interim periods within those fiscal years. The adoption of this amendment is not expected to have a material effect on we’s financial statements.
We has evaluated all other recent accounting pronouncements and determined that they would not have a material impact on our financial statements or disclosures.
| ITEM 7A. | QUANTITATIVE AND QUALITATIVE DISCLOSURES ABOUT MARKET RISK. |
Not Applicable.
| ITEM 8. | FINANCIAL STATEMENTS AND SUPPLEMENTARY DATA. |
92
Lake Victoria Mining Company, Inc.
(An Exploration Stage Company)
March 31, 2012
F-1

Report of Independent Registered Public Accounting Firm
To the Board of Directors and Stockholders of
Lake Victoria Mining Company, Inc.
(An Exploration Stage Company)
We have audited the accompanying consolidated balance sheets of Lake Victoria Mining Company, Inc. (An Exploration Stage Company) as of March 31, 2012 and 2011, and the related consolidated statements of operations, cash flows and stockholders’ equity (deficit) for the years then ended, and for the period from December 11, 2006 (Date of Inception) to March 31, 2012. These financial statements are the responsibility of the Company's management. Our responsibility is to express an opinion on these financial statements based on our audits. The consolidated financial statements as of March 31, 2010, and for the period from December 11, 2006 (Date of Inception) to March 31, 2010, were audited by another firm of independent accountants, which expressed an unqualified audit opinion on those financial statements in its report dated July 13, 2010. Our opinion on the consolidated statements of operations, cash flows and stockholders’ equity (deficit) for the period from December 11, 2006 (Date of Inception) to March 31, 2012, insofar as it relates to the amounts for prior periods through March 31, 2010, is based on the reports of the other auditors. The predecessor auditor has not reissued its reports because the firm has ceased its operations.
We conducted our audits in accordance with the standards of the Public Company Accounting Oversight Board (United States). Those standards require that we plan and perform the audit to obtain reasonable assurance about whether the financial statements are free of material misstatement. An audit includes examining, on a test basis, evidence supporting the amounts and disclosures in the financial statements. The Company is not required to have, nor were we engaged to perform, an audit of its internal control over financial reporting. An audit includes consideration of internal control over financial reporting as a basis for designing audit procedures that are appropriate in the circumstances, but not for the purpose of expressing an opinion on the effectiveness of internal control over financial reporting. An audit also includes assessing the accounting principles used and significant estimates made by management, as well as evaluating the overall financial statement presentation. We believe that our audits provide a reasonable basis for our opinion.
In our opinion, based on our audits and the report of other auditors, the consolidated financial statements referred to above present fairly, in all material respects, the financial position of Lake Victoria Mining Company, Inc. (An Exploration Stage Company) as of March 31, 2012 and 2011, and the results of its operations, cash flows and stockholders’ equity (deficit) for the years then ended and accumulated for the period from December 11, 2006 (Date of Inception) to March 31, 2012 in conformity with accounting principles generally accepted in the United States.
The accompanying consolidated financial statements have been prepared assuming the Company will continue as a going concern. As discussed in Note 1 to the consolidated financial statements, the Company has accumulated losses since inception and has no revenue. These factors raise substantial doubt about the Company’s ability to continue as a going concern. Management’s plans in regard to these matters are also discussed in Note 1. The consolidated financial statements do not include any adjustments that might result from the outcome of this uncertainty.
/s/ “Manning Elliott LLP”
CHARTERED ACCOUNTANTS
Vancouver, Canada
June 26, 2012
F-2
To the Board of Directors and Stockholders of
Lake Victoria Mining Company, Inc.
REPORT OF INDEPENDENT REGISTERED PUBLIC ACCOUNTING FIRM1
We have audited the accompanying consolidated balance sheets of Lake Victoria Mining Company, Inc. (an exploration stage company) as of March 31, 2010 and 2009, and the related consolidated statements of operations, stockholders’ equity (deficit) and cash flows for the years then ended and for the period from December 11, 2006 (inception) to March 31, 2010. These consolidated financial statements are the responsibility of the Company’s management. Our responsibility is to express an opinion on these consolidated financial statements based on our audit.
We conducted our audit in accordance with the standards of the Public Company Accounting Oversight Board (United States). Those standards require that we plan and perform the audit to obtain reasonable assurance about whether the financial statements are free of material misstatement. The Company is not required to have, nor were we engaged to perform, an audit of its internal control over financial reporting. Our audit included consideration of internal control over financial reporting as a basis for designing audit procedures that are appropriate in the circumstances, but not for the purpose of expressing an opinion on the effectiveness of the Company’s internal control over financial reporting. Accordingly, we express no such opinion. An audit includes examining, on a test basis, evidence supporting the amounts and disclosures in the financial statements. An audit also includes assessing the accounting principles used and significant estimates made by management, as well as evaluating the overall financial statement presentation. We believe that our audit provides a reasonable basis for our opinion.
In our opinion, the consolidated financial statements referred to above present fairly, in all material respects, the financial position of Lake Victoria Mining Company, Inc. as of March 31, 2010 and 2009, and the results of their operations and their cash flows for the years then ended and for the period from December 11, 2006 (inception) to March 31, 2010, in conformity with accounting principles generally accepted in the United States of America.
The accompanying consolidated financial statements have been prepared assuming that the Company will continue as a going concern. As discussed in Note 2 to the consolidated financial statements, the Company has suffered recurring losses and has an accumulated deficit at March 31, 2010. These factors raise substantial doubt about its ability to continue as a going concern. Management's plans in regard to these matters are also described in Note 2. The consolidated financial statements do not include any adjustments that might result from the outcome of this uncertainty.
BEHLERMICK PS
BehlerMick PS
Spokane, Washington July 13, 2010
________________________________
1This is a copy of auditor’s report dated on July 13, 2010 previously issued on the Company’s Form 10-K for the fiscal year ended March 31,2010. The predecessor auditor has not reissued its reports because the firm has ceased its operations.
PCAOB Section 9508 - Reports on Audited Financial Statements: Auditing Interpretations of Section 508 and the Division of Corp Fin - Reporting Manual 4820 Accountant’s Inability to Reissue Reports [AU 9508, Interpretation 15; Regulation C, Rule 437]
F-3
Lake Victoria Mining Company, Inc.
(An Exploration Stage Company)
Consolidated Balance Sheets
(Expressed in US dollars)
| | | March 31, | | | March 31, | |
| | | 2012 | | | 2011 | |
| | | $ | | | $ | |
| ASSETS | | | | | | |
| Current Assets | | | | | | |
| Cash and cash equivalents | | 523,405 | | | 2,282,902 | |
| Advances and deposits (Note 3(e)) | | 63,187 | | | 32,684 | |
| Amounts receivable (Note 7(e)) | | – | | | 256,968 | |
| Advances to related party (Note 3(a)) | | – | | | 499,043 | |
| Total Current Assets | | 586,592 | | | 3,071,597 | |
| Property and Equipment (Note 5) | | 129,248 | | | 103,302 | |
| Mineral Properties (Note 7) | | 556,750 | | | – | |
| Total Assets | | 1,272,590 | | | 3,174,899 | |
| | | | | | | |
| LIABILITIES AND STOCKHOLDERS’ EQUITY | | | | | | |
| Current Liabilities | | | | | | |
| Accounts payable | | 168,655 | | | 212,721 | |
| Accounts payable to related party (Note 3(a)) | | 500 | | | 624,773 | |
| Accrued expenses | | 47,094 | | | 119,540 | |
| Other payables (Note 6) | | 3,630 | | | 4,386 | |
| Total Liabilities | | 219,879 | | | 961,420 | |
| | | | | | | |
| Nature of Operations and Going Concern (Note 1) | | | | | | |
| Commitments (Note 12) | | | | | | |
| Subsequent Events (Note 13) | | | | | | |
| Stockholders’ Equity | | | | | | |
Preferred Stock, 100,000,000 shares authorized, $0.00001 par value;
No shares issued and outstanding (Note 8) | | – | | | – | |
Common Stock, 250,000,000 shares authorized, $0.00001 par value;
97,485,733 shares issued and outstanding (2011 - 96,346,900) (Note 8) | | 975 | | | 964 | |
| Additional Paid-in Capital | | 16,142,289 | | | 15,620,475 | |
| Common Stock and Warrants Issuable (Notes 8(a) and (d)) | | 737,100 | | | 35,000 | |
| Deficit Accumulated During the Exploration Stage | | (15,827,653 | ) | | (13,442,960 | ) |
| Total Stockholders’ Equity | | 1,052,711 | | | 2,213,479 | |
| Total Liabilities and Stockholders’ Equity | | 1,272,590 | | | 3,174,899 | |
The accompanying notes are an integral part of these consolidated financial statements
F-4
Lake Victoria Mining Company, Inc.
(An Exploration Stage Company)
Consolidated Statements of Operations
(Expressed in US dollars)
| | | | | | | | | Accumulated From | |
| | | For the | | | For the | | | December 11, 2006 | |
| | | Year Ended | | | Year Ended | | | (Date of Inception) to | |
| | | March 31, | | | March 31, | | | March 31, | |
| | | 2012 | | | 2011 | | | 2012 | |
| | | $ | | | $ | | | $ | |
| | | | | | | | | | |
| Revenue | | – | | | – | | | – | |
| | | | | | | | | | |
| Expenses | | | | | | | | | |
| Amortization and depreciation | | 36,210 | | | 24,221 | | | 74,312 | |
| Exploration costs (Notes 3 and 7) | | 1,084,929 | | | 1,194,934 | | | 4,097,841 | |
| General and administrative | | 329,603 | | | 330,415 | | | 2,286,902 | |
| Impairment of mineral property acquisition costs (Note 7) | | 441,612 | | | 742,180 | | | 11,584,703 | |
| Management and director fees | | 32,000 | | | 102,000 | | | 556,017 | |
| Professional and consulting fees | | 275,130 | | | 831,947 | | | 3,570,749 | |
| Salaries | | 563,101 | | | 101,739 | | | 706,783 | |
| Stock-based compensation (Note 9) | | 213,825 | | | 1,593,989 | | | 1,807,814 | |
| Travel and accommodation | | 66,985 | | | 22,511 | | | 399,616 | |
| | | | | | | | | | |
| Total Operating Expenses | | 3,043,395 | | | 4,943,936 | | | 25,084,737 | |
| | | | | | | | | | |
| Operating Loss | | (3,043,395 | ) | | (4,943,936 | ) | | (25,084,737 | ) |
| | | | | | | | | | |
| Other Income (Expenses) | | | | | | | | | |
| Loss on sales of investments (Note 4) | | (757,489 | ) | | – | | | (752,489 | ) |
| Foreign exchange loss | | (73,669 | ) | | (15,612 | ) | | (159,432 | ) |
| Interest income | | 2,437 | | | 3,112 | | | 11,024 | |
| Interest expense | | – | | | (523 | ) | | (1,045 | ) |
| Loss on debt settlement | | – | | | (63,752 | ) | | (63,752 | ) |
| Other income | | – | | | – | | | 15,900 | |
Income from options granted on mineral properties
(Notes 4 and 7 a), b), e) and g)) | | 1,487,423 | | | – | | | 1,487,423 | |
| | | | | | | | | | |
| Total Other Income (Expenses) | | 658,702 | | | (76,775 | ) | | 537,629 | |
| Net loss | | (2,384,693 | ) | | (5,020,711 | ) | | (24,547,108 | ) |
| Net loss attributable to non-controlling interest | | – | | | – | | | 8,719,455 | |
| | | | | | | | | | |
| Net Loss Attributable to the Company | | (2,384,693 | ) | | (5,020,711 | ) | | (15,827,653 | ) |
| Net Loss Per Share – Basic and Diluted | | (0.02 | ) | | (0.07 | ) | | | |
| Weighted Average Shares Outstanding | | 97,233,696 | | | 73,469,406 | | | | |
The accompanying notes are an integral part of these consolidated financial statements
F-5
Lake Victoria Mining Company, Inc.
(An Exploration Stage Company)
Consolidated Statements of Cash Flows
(Expressed in US dollars)
| | | For the | | | For the | | | Accumulated From | |
| | | Year Ended | | | Year Ended | | | December 11, 2006 | |
| | | March 31, | | | March 31, | | | (Date of Inception) | |
| | | 2012 | | | 2011 | | | to March 31, 2012 | |
| | | $ | | | $ | | | $ | |
| Operating Activities | | | | | | | | | |
| Net Income (Loss) | | (2,384,693 | ) | | (5,020,711 | ) | | (15,827,653 | ) |
| Adjustments to reconcile net loss to cash used in operating activities | | | | | | | | | |
| Amortization and depreciation | | 36,210 | | | 24,221 | | | 74,312 | |
| Directors' compensation share payments | | – | | | – | | | 35,000 | |
| Impairment of mineral property acquisition cost | | 441,612 | | | 742,180 | | | 11,584,703 | |
| Loss on debt settlement | | – | | | 63,752 | | | 63,752 | |
| Loss on sales of investments | | 757,489 | | | – | | | 752,489 | |
| Loss in subsidiary attributed to non-controlling interest | | – | | | – | | | (8,719,455 | ) |
| Restructuring charges | | – | | | – | | | (110,019 | ) |
| Share payment for consulting services | | 48,900 | | | 207,475 | | | 2,746,498 | |
| Share payments received for options granted on mineral properties | | (990,000 | ) | | – | | | (990,000 | ) |
| Cash received from options granted on mineral properties | | (497,423 | ) | | – | | | (497,423 | ) |
| Stock-based compensation | | 213,825 | | | 1,593,989 | | | 1,807,814 | |
| Changes in operating assets and liabilities: | | | | | | | | | |
| Increase in advances and deposits | | (30,502 | ) | | (28,460 | ) | | (63,187 | ) |
| Increase in amounts receivable | | 256,968 | | | (256,968 | ) | | – | |
| Increase (Decrease) in amounts due to/from related parties | | (125,230 | ) | | (75,750 | ) | | 500 | |
| Increase (Decrease) in accounts payable | | (44,066 | ) | | 112,984 | | | 168,658 | |
| Increase (Decrease) in accrued expenses | | (72,446 | ) | | 58,055 | | | 47,094 | |
| Increase (Decrease) in other payables | | (756 | ) | | (24,788 | ) | | 3,630 | |
| Net Cash Provided By (Used In) Operating Activities | | (2,390,112 | ) | | (2,604,021 | ) | | (8,923,287 | ) |
| Investing Activities | | | | | | | | | |
| Acquisition of property, plant and equipment | | (62,157 | ) | | (26,658 | ) | | (203,560 | ) |
| Cash payment for acquisition of mineral properties | | (774,262 | ) | | (742,180 | ) | | (4,237,053 | ) |
| Cash received from options granted on mineral properties | | 497,423 | | | – | | | 497,423 | |
| Proceeds of subsidiary stock issuances | | – | | | – | | | 1,600,300 | |
| Purchase of investment | | – | | | – | | | (5,000 | ) |
| Proceeds from sale of investments | | 232,511 | | | – | | | 242,511 | |
| Net Cash Used In Investing Activities | | (106,485 | ) | | (768,838 | ) | | (2,105,379 | ) |
| Financing Activities | | | | | | | | | |
| Proceeds from note payable | | – | | | 12,750 | | | 12,750 | |
| Repayment of note payable | | – | | | (12,750 | ) | | (12,750 | ) |
| Proceeds from issuance of stock, net | | 737,100 | | | 4,700,360 | | | 11,566,071 | |
| Payment for cancellation of stock | | – | | | – | | | (14,000 | ) |
| Net Cash Provided By Financing Activities | | 737,100 | | | 4,700,360 | | | 11,552,071 | |
| Net (Decrease) Increase In Cash and Cash Equivalents | | (1,759,497 | ) | | 1,327,501 | | | 523,405 | |
| Cash and Cash Equivalents at Beginning of Period | | 2,282,902 | | | 955,401 | | | – | |
| Cash and Cash Equivalents at End of Period | | 523,405 | | | 2,282,902 | | | 523,405 | |
Supplemental Cash Flow information (Note 11)
The accompanying notes are an integral part of these consolidated financial statements
F-6
Lake Victoria Mining Company, Inc.
(An Exploration Stage Company)
Consolidated Statements of Stockholders’ Equity (Deficit)
(Expressed in US dollars)
| | | | | | | | | | | | | | | | | | Accumulated | | | Total | | | | |
| | | | | | | | | | | | | | | Common | | | Deficit During | | | Stockholders' | | | Non- | |
| | | Common Stock | | | Additional | | | Subscription | | | Stock | | | Exploration | | | Equity | | | Controlling | |
| | | Shares | | | Amount | | | Paid-in Capital | | | Receivable | | | Issuable | | | Stages | | | (Deficit) | | | Interest | |
| | | | | | $ | | | $ | | | $ | | | $ | | | $ | | | $ | | | $ | |
| Balance, at December 11, 2006 | | – | | | – | | | – | | | – | | | – | | | – | | | – | | | – | |
| Common stock issued in December for cash at $0.001 per share | | 14,730,000 | | | 147 | | | 12,128 | | | (9,775 | ) | | – | | | – | | | 2,500 | | | – | |
| Common stock issued in February for consulting service provided at $0.10 per share | | 2,370,000 | | | 24 | | | 197,476 | | | – | | | – | | | – | | | 197,500 | | | – | |
| Subsidiary equity interest purchased in March by non-controlling interests | | – | | | – | | | – | | | – | | | – | | | – | | | – | | | 10 | |
| Net loss for period | | – | | | – | | | – | | | – | | | – | | | (294,102 | ) | | (294,102 | ) | | (7,441 | ) |
| Balance, at March 31, 2007 | | 17,100,000 | | | 171 | | | 209,604 | | | (9,775 | ) | | – | | | (294,102 | ) | | (94,102 | ) | | (7,431 | ) |
| Common stock issued in April for cash at $0.10 per share | | 5,172,000 | | | 52 | | | 430,948 | | | (3,500 | ) | | – | | | – | | | 427,500 | | | – | |
| Common stock issued in October for cash at $0.75 per share | | 2,201,923 | | | 22 | | | 1,375,748 | | | – | | | – | | | – | | | 1,375,770 | | | – | |
| Common stock issued in November for cash at $0.75 per share | | 48,000 | | | – | | | 30,000 | | | – | | | – | | | – | | | 30,000 | | | – | |
| As of October, Subsidiary equity interest purchased by non-controlling interests | | – | | | – | | | – | | | – | | | – | | | – | | | – | | | 100,300 | |
| Miscellaneous adjustments to Equity | | – | | | – | | | – | | | (5 | ) | | – | | | – | | | (5 | ) | | – | |
| Common stock issued in February for cash at $0.75 per share | | 60,720 | | | 1 | | | 37,949 | | | – | | | – | | | – | | | 37,950 | | | – | |
| Net loss for year | | – | | | – | | | – | | | – | | | – | | | (619,622 | ) | | (619,622 | ) | | (8,705 | ) |
| Balance, March 31, 2008 | | 24,582,643 | | | 246 | | | 2,084,249 | | | (13,280 | ) | | – | | | (913,724 | ) | | 1,157,491 | | | 84,164 | |
| Common stock issued in April for cash at $0.75 per share | | 208,000 | | | 2 | | | 129,998 | | | – | | | – | | | – | | | 130,000 | | | – | |
| Common stock issued in December for cash at $0.50 per share | | 1,765,765 | | | 18 | | | 735,667 | | | – | | | – | | | – | | | 735,684 | | | – | |
| As of May, Subsidiary equity interest purchased by non-controlling interests | | – | | | – | | | – | | | – | | | – | | | – | | | – | | | 250,000 | |
The accompanying notes are an integral part of these consolidated financial statements
F-7
Lake Victoria Mining Company, Inc.
(An Exploration Stage Company)
Consolidated Statements of Stockholders’ Equity (Deficit)
(Expressed in US dollars)
| | | | | | | | | | | | | | | | | | Accumulated | | | Total | | | | |
| | | | | | | | | | | | | | | Common | | | Deficit During | | | Stockholders' | | | Non- | |
| | | Common Stock | | | Additional | | | Subscription | | | Stock | | | Exploration | | | Equity | | | Controlling | |
| | | Shares | | | Amount | | | Paid-in Capital | | | Receivable | | | Issuable | | | Stages | | | (Deficit) | | | Interest | |
| | | | | | $ | | | $ | | | $ | | | $ | | | $ | | | $ | | | $ | |
| As of November, Subsidiary equity interest purchased by non-controlling interests | | – | | | – | | | – | | | – | | | – | | | – | | | – | | | 250,000 | |
| As of November, Subsidiary equity interest purchased by non-controlling interests | | – | | | – | | | – | | | – | | | – | | | – | | | – | | | 1,000,000 | |
| Subsidiary equity interest issued in December for mineral properties acquisition | | – | | | – | | | – | | | – | | | – | | | – | | | – | | | 2,350,300 | |
| Common stock cancelled for refund at $0.50 per share | | (33,600 | ) | | – | | | (14,000 | ) | | – | | | – | | | – | | | (14,000 | ) | | – | |
| Subsidiary equity interest issued in January for mineral properties acquisition | | – | | | – | | | – | | | – | | | – | | | – | | | – | | | 1,690,000 | |
| Subsidiary equity interest issued in January for mineral properties acquisition | | – | | | – | | | – | | | – | | | – | | | – | | | – | | | 1,840,000 | |
| Net loss for year | | – | | | – | | | – | | | – | | | – | | | (1,401,282 | ) | | (1,401,282 | ) | | (6,776,084 | ) |
| Balance, March 31, 2009 | | 26,522,808 | | | 266 | | | 2,935,914 | | | (13,280 | ) | | – | | | (2,315,006 | ) | | 607,894 | | | 688,380 | |
| Subsidiary equity interest issued in April for directors compensation | | – | | | – | | | – | | | – | | | – | | | – | | | – | | | 35,000 | |
| Common stock issued in May for mineral properties acquisition | | 6,211,500 | | | 62 | | | 2,588,063 | | | – | | | – | | | – | | | 2,588,125 | | | – | |
| Common stock issued in June for cash at $0.25 per share | | 1,747,200 | | | 17 | | | 363,983 | | | – | | | – | | | – | | | 364,000 | | | – | |
| Common stock issued in June for consulting service provided | | 186,000 | | | 2 | | | 38,748 | | | – | | | – | | | – | | | 38,750 | | | – | |
| Common stock issued in June for consulting service provided | | 1,186,200 | | | 12 | | | 322,113 | | | – | | | – | | | – | | | 322,125 | | | – | |
| Common stock issued in June for consulting service provided | | 1,620,720 | | | 16 | | | 337,634 | | | – | | | – | | | – | | | 337,650 | | | – | |
| Common stock issued in June for consulting service provided | | 179,122 | | | 2 | | | 59,705 | | | – | | | – | | | – | | | 59,706 | | | – | |
| Subsidiary equity interest issued in June for mineral properties acquisition | | – | | | – | | | – | | | – | | | – | | | – | | | – | | | 1,800,000 | |
| As of August, loss attributable to non-controlling interest | | – | | | – | | | – | | | – | | | – | | | – | | | – | | | (1,927,226 | ) |
| As of August, Reverse acquisition restructuring of the non-controlling interest and investment held by parent company | | 18,198,000 | | | 182 | | | (2,102,180 | ) | | 5 | | | – | | | – | | | (2,101,993 | ) | | (596,154 | ) |
The accompanying notes are an integral part of these consolidated financial statements
F-8
Lake Victoria Mining Company, Inc.
(An Exploration Stage Company)
Consolidated Statements of Stockholders’ Equity (Deficit)
(Expressed in US dollars)
| | | | | | | | | | | | | | | | | | Accumulated | | | Total | | | | |
| | | | | | | | | | | | | | | Common | | | Deficit During | | | Stockholders' | | | Non- | |
| | | Common Stock | | | Additional | | | Subscription | | | Stock | | | Exploration | | | Equity | | | Controlling | |
| | | Shares | | | Amount | | | Paid-in Capital | | | Receivable | | | Issuable | | | Stages | | | (Deficit) | | | Interest | |
| | | | | | $ | | | $ | | | $ | | | $ | | | $ | | | $ | | | $ | |
| Common stock attached with warrants issued in September for cash at $0.60 per share | | 200,000 | | | 2 | | | 119,998 | | | – | | | – | | | – | | | 120,000 | | | – | |
| Common stock issued in November for consulting service provided | | 255,000 | | | 3 | | | 152,997 | | | – | | | – | | | – | | | 153,000 | | | – | |
| Common stock issued in November for consulting service provided | | 201,250 | | | 2 | | | 120,748 | | | – | | | – | | | – | | | 120,750 | | | – | |
| Common stock issued in November for consulting service provided | | 1,450,000 | | | 15 | | | 1,217,986 | | | – | | | – | | | – | | | 1,218,000 | | | – | |
| Common stock issued in December for consulting service provided | | 68,775 | | | 1 | | | 42,639 | | | – | | | – | | | – | | | 42,640 | | | – | |
| Common stock attached with warrants issued | | 2,501,001 | | | 25 | | | 1,454,679 | | | – | | | – | | | – | | | 1,454,704 | | | – | |
| Received subscription payment | | – | | | – | | | – | | | 13,275 | | | – | | | – | | | 13,275 | | | – | |
| Common stock attached with warrants issuable for private placement at $0.20 per share | | 7,343,650 | | | 73 | | | 1,457,157 | | | (20,000 | ) | | – | | | – | | | 1,437,230 | | | – | |
| Net loss for year | | – | | | – | | | – | | | – | | | – | | | (6,107,243 | ) | | (6,107,243 | ) | | – | |
| Balance, at March 31, 2010 | | 67,871,225 | | | 679 | | | 9,110,183 | | | (20,000 | ) | | – | | | (8,422,249 | ) | | 668,613 | | | – | |
| Common stock attached with warrants issued in May for cash at $0.20 per share | | 3,129,350 | | | 31 | | | 625,839 | | | – | | | – | | | – | | | 625,870 | | | – | |
| Common stock issued in April to settle debt | | 153,525 | | | 2 | | | 58,338 | | | – | | | – | | | – | | | 58,340 | | | – | |
| Common stock issued in April to settle debt | | 85,000 | | | 1 | | | 34,849 | | | – | | | – | | | – | | | 34,850 | | | – | |
| Common stock attached with warrants issued in May for cash at $0.20 per share | | – | | | – | | | – | | | 20,000 | | | – | | | – | | | 20,000 | | | – | |
| Common stock attached with warrants issued in August for cash at $0.225 per share, net of cost of $23,416 | | 4,790,700 | | | 48 | | | 1,054,442 | | | – | | | – | | | – | | | 1,054,490 | | | – | |
| Common stock issued in October to settle debt | | 217,100 | | | 2 | | | 102,036 | | | – | | | – | | | – | | | 102,038 | | | – | |
| Stock options granted to directors and officers and consultant | | | | | | | | 1,593,989 | | | – | | | – | | | – | | | 1,593,989 | | | – | |
| Common stock issued in November for consulting services | | 100,000 | | | 1 | | | 40,999 | | | – | | | – | | | – | | | 41,000 | | | – | |
| Common stock issuable in February to settle debt | | – | | | – | | | – | | | – | | | 35,000 | | | – | | | 35,000 | | | – | |
The accompanying notes are an integral part of these consolidated financial statements
F-9
Lake Victoria Mining Company, Inc.
(An Exploration Stage Company)
Consolidated Statements of Stockholders’ Equity (Deficit)
(Expressed in US dollars)
| | | | | | | | | | | | | | | | | | Accumulated | | | Total | | | | |
| | | | | | | | | | | | | | | Common | | | Deficit During | | | Stockholders' | | | Non- | |
| | | Common Stock | | | Additional | | | Subscription | | | Stock | | | Exploration | | | Equity | | | Controlling | |
| | | Shares | | | Amount | | | Paid-in Capital | | | Receivable | | | Issuable | | | Stages | | | (Deficit) | | | Interest | |
| | | | | | $ | | | $ | | | $ | | | $ | | | $ | | | $ | | | $ | |
| Common stock attached with warrants issued in March for cash at $0.15 per share | | 20,000,000 | | | 200 | | | 2,999,800 | | | – | | | – | | | – | | | 3,000,000 | | | – | |
| Net loss for year | | – | | | – | | | – | | | – | | | – | | | (5,020,711 | ) | | (5,020,711 | ) | | – | |
| Balance, at March 31, 2011 | | 96,346,900 | | | 964 | | | 15,620,475 | | | – | | | 35,000 | | | (13,442,960 | ) | | 2,213,479 | | | – | |
| Common stock issued in February to settle debt | | 145,833 | | | 1 | | | 34,999 | | | – | | | (35,000 | ) | | – | | | – | | | – | |
| Common stock issued in July to settle debt | | 163,000 | | | 2 | | | 48,898 | | | – | | | – | | | – | | | 48,900 | | | – | |
| Common stock issued in July for mineral property acquisition | | 830,000 | | | 8 | | | 224,092 | | | – | | | – | | | – | | | 224,100 | | | – | |
| Stock option re-pricing and issued in November | | – | | | – | | | 213,825 | | | – | | | – | | | – | | | 213,825 | | | – | |
| Common stock and warrants issuable | | – | | | – | | | – | | | – | | | 737,100 | | | – | | | 737,100 | | | – | |
| Net loss for year | | – | | | – | | | – | | | – | | | – | | | (2,384,693 | ) | | (2,384,693 | ) | | – | |
| Balance, at March 31, 2012 | | 97,485,733 | | | 975 | | | 16,142,289 | | | – | | | 737,100 | | | (15,827,653 | ) | | 1,052,711 | | | – | |
The accompanying notes are an integral part of these consolidated financial statements
F-10
Lake Victoria Mining Company, Inc.
(An Exploration Stage Company)
Notes to the Consolidated Financial Statements
March 31, 2012
(Expressed in US dollars)
| 1. | Nature of Operations and Going Concern |
| | | |
| Lake Victoria Mining Company, Inc. (the “Company”) was incorporated on December 11, 2006 under the laws of the State of Nevada. The Company’s administrative office is located in Vancouver, Canada. The Company is an Exploration Stage Company, as defined by Financial Accounting Standards Board (“FASB”) Accounting Standards Codification (“ASC”) 915, Development Stage Entities. The Company has been in the exploration stage since inception and has not yet realized any revenues from its planned operations. |
| | | |
| The principal business of the Company is to search for mineral deposits or reserves which are not in either the development or production stage. The Company is conducting exploration activities on gold and uranium properties located in Tanzania. |
| | | |
| As of March 31, 2012, none of the Company’s mineral property interests had proven or probable reserves as determined under the requirements of SEC Industry Guide No. 7. Planned principal activities have not yet begun. The ability of the Company to emerge from the exploration stage with respect to any planned principal business activity is dependent upon its successful efforts to raise additional debt or equity financing and/or attain profitable mining operations. As shown in the accompanying financial statements, the Company has an accumulated deficit of $15,827,653 incurred through March 31, 2012. The Company also has no revenues. These factors raise substantial doubt about the Company’s ability to continue as a going concern. Management intends to seek additional capital from new equity securities offerings that will provide funds needed to continue the exploration for gold and uranium. No assurance can be given that additional financing will be available, or that it can be obtained on terms acceptable to the Company and its shareholders. The financial statements do not include any adjustments relating to the recoverability and classification of recorded assets, or the amounts and classification of liabilities that might be necessary in the event the Company cannot continue as a going concern. |
| | | |
| 2. | Summary of Significant Accounting Policies |
| | | |
| a) | Basis of Presentation |
| | | |
| | These consolidated financial statements and related notes are presented in accordance with accounting principles generally accepted in the United States, and are expressed in U.S. dollars. These consolidated financial statements include the accounts of the Company and its wholly-owned subsidiaries, Kilimanjaro Mining Company, Inc. (“Kilimanjaro”), Lake Victoria Resources Company, (T) Ltd., Jin 179 Company Tanzania Ltd. and Chrysos 197 Company Tanzania Ltd. Significant intercompany accounts and transactions have been eliminated. The Company’s fiscal year-end is March 31. |
| | | |
| b) | Use of Estimates |
| | | |
| | The preparation of financial statements in accordance with United States generally accepted accounting principles requires management to make estimates and assumptions that affect the reported amounts of assets and liabilities at the date of the financial statements and the reported amounts of revenue and expenses in the reporting period. The Company regularly evaluates estimates and assumptions related to long-lived assets, mineral property costs, asset retirement obligations, stock-based compensation, financial instrument valuations and deferred income tax asset valuations. The Company bases its estimates and assumptions on current facts, historical experience and various other factors that it believes to be reasonable under the circumstances, the results of which form the basis for making judgments about the carrying values of assets and liabilities and the accrual of costs and expenses that are not readily apparent from other sources. The actual results experienced by the Company may differ materially and adversely from the Company’s estimates. To the extent there are material differences between the estimates and the actual results, future results of operations will be affected. |
| | | |
| c) | Business Combinations |
| | | |
| | The Company follows the guidance in ASC 805, Business Combinations, and ASC 810, Consolidation. The net loss attributable to non-controlling interest recognized during the period from December 11, 2006 (date of inception) to March 31, 2012 was previously the minority interest held by certain passive shareholders at the consolidated financial statement level of Kilimanjaro, and whose interests were eliminated for accounting purposes by the August 7, 2009 share exchange agreement. The Company, after August 7, 2009, had no further non-controlling interests. As of March 31, 2012, a cumulative loss of $8,719,455 had been attributed to the non-controlling interest of the Company’s controlled subsidiary. |
F-11
Lake Victoria Mining Company, Inc.
(An Exploration Stage Company)
Notes to the Consolidated Financial Statements
March 31, 2012
(Expressed in US dollars)
| 2. | Summary of Significant Accounting Policies (continued) |
| | | |
| d) | Basic and Diluted Net Income (Loss) Per Share |
| | | |
| | The Company computes net income (loss) per share in accordance with ASC 260, Earnings per Share, which requires presentation of both basic and diluted earnings per share (EPS) on the face of the income statement. Basic EPS is computed by dividing net income (loss) available to common shareholders (numerator) by the weighted average number of shares outstanding (denominator) during the period. Diluted EPS gives effect to all dilutive potential common shares outstanding during the period using the treasury stock method and convertible preferred stock using the if-converted method. In computing diluted EPS, the average stock price for the period is used in determining the number of shares assumed to be purchased from the exercise of stock options or warrants. Diluted EPS excludes all dilutive potential shares if their effect is anti dilutive. As of March 31, 2012, the Company had 26,004,901 potentially dilutive securities outstanding. |
| | | |
| e) | Cash and Cash Equivalents |
| | | |
| | The Company considers all highly liquid instruments with a maturity of three months or less at the time of issuance or may be redeemed without significant penalties to be cash equivalents. |
| | | |
| | As of March 31, 2012 and 2011, the Company has approximately $40,000 and $2,234,000, respectively, deposited at FDIC insured banks in the United States. FDIC deposit insurance covers the balance of each depositor’s account up to $250,000 per insured bank. |
| | | |
| | As of March 31 2012 and 2011, the Company has approximately $365,000 and $Nil deposited in Canada including $34,594 (CAD$ 34,500) and $Nil, respectively, of guaranteed investment certificates bearing variable interest at primate less 2.05% which is restricted in use for corporation credit cards. |
| | | |
| | As of March 31, 2012, the Company has Tanzania shillings of 84,496,000 (approximately $52,400) and $141,600 deposited in Tanzania. The Deposit Insurance Board in Tanzania insures up to 1,500,000 Tanzanian Shillings (approximately $930 as of March 31, 2012) per customer per bank. Any amount beyond the basic insurance amount may expose the Company to loss. |
| | | |
| f) | Property and Equipment |
| | | |
| | Property and equipment consists of mining tools and equipment, furniture and equipment and computers and software which are depreciated on a straight line basis over their expected lives of five years. |
| | | |
| g) | Mineral Property Costs |
| | | |
| | Under US GAAP mineral property acquisition costs are ordinarily capitalized when incurred using FASB ASC Topic 805-20-55-37, Whether Mineral Rights are Tangible or Intangible Assets. The carrying costs are assessed for impairment under ASC Topic 360-10-35-21, Accounting for Impairment or Disposal of Long- Lived Assets, whenever events or changes in circumstances indicate that the carrying costs may not be recoverable. The Company expenses as incurred all property maintenance and exploration costs. |
| | | |
| | The Company also evaluates the carrying value of acquired mineral property rights in accordance with ASC Topic 930-360-35-1, Mining Assets: Impairment and Business Combinations, using the Value Beyond Proven and Probable (VBPP) method. The fair value of a mining asset generally includes both VBPP and an estimate of the future market price of the minerals. |
| | | |
| | When the Company has capitalized mineral property costs, these properties will be periodically assessed for impairment of value. Once a property reaches the production stage, the related capitalized costs will be amortized, using the units of production method. The Company records its interests in mining properties and areas of geological interest at cost. The Company has capitalized mineral properties costs of $556,750 and $Nil as at March 31, 2012 and 2011, respectively. The Company has recognized impairment charges of $441,612 and $742,180 for the years ended at March 31, 2012 and 2011, respectively, which were determined not be recoverable and therefore, were written down to their estimated fair values of $Nil. |
F-12
Lake Victoria Mining Company, Inc.
(An Exploration Stage Company)
Notes to the Consolidated Financial Statements
March 31, 2012
(Expressed in US dollars)
| 2. | Summary of Significant Accounting Principles (continued) |
| | | |
| h) | Long-Lived Assets |
| | | |
| | In accordance with ASC 360, Property Plant and Equipment the Company tests long-lived assets or asset groups for recoverability when events or changes in circumstances indicate that their carrying amount may not be recoverable. Circumstances which could trigger a review include, but are not limited to: significant decreases in the market price of the asset; significant adverse changes in the business climate or legal factors; accumulation of costs significantly in excess of the amount originally expected for the acquisition or construction of the asset; current period cash flow or operating losses combined with a history of losses or a forecast of continuing losses associated with the use of the asset; and current expectation that the asset will more likely than not be sold or disposed significantly before the end of its estimated useful life. Recoverability is assessed based on the carrying amount of the asset and the sum of the undiscounted cash flows expected to result from the use and the eventual disposal of the asset, as well as specific appraisal in certain instances. An impairment loss is recognized when the carrying amount is not recoverable and exceeds fair value. |
| | | |
| i) | Asset Retirement Obligations |
| | | |
| | The Company accounts for asset retirement obligations in accordance with the provisions of ASC 440, Asset Retirement and Environmental Obligations which requires the Company to record the fair value of an asset retirement obligation as a liability in the period in which it incurs a legal obligation associated with the retirement of tangible long-lived assets that result from the acquisition, construction, development and/or normal use of the assets. The Company did not have any asset retirement obligations as of March 31, 2012. |
| | | |
| j) | Financial Instruments |
| | | |
| | ASC 825, Financial Instruments requires an entity to maximize the use of observable inputs and minimize the use of unobservable inputs when measuring fair value. ASC 825 establishes a fair value hierarchy based on the level of independent, objective evidence surrounding the inputs used to measure fair value. A financial instrument’s categorization within the fair value hierarchy is based upon the lowest level of input that is significant to the fair value measurement. ASC 825 prioritizes the inputs into three levels that may be used to measure fair value: |
| | | |
| | Level 1 |
| | | |
| | Level 1 applies to assets or liabilities for which there are quoted prices in active markets for identical assets or liabilities. |
| | | |
| | Level 2 |
| | | |
| | Level 2 applies to assets or liabilities for which there are inputs other than quoted prices that are observable for the asset or liability such as quoted prices for similar assets or liabilities in active markets; quoted prices for identical assets or liabilities in markets with insufficient volume or infrequent transactions (less active markets); or model-derived valuations in which significant inputs are observable or can be derived principally from, or corroborated by, observable market data. |
| | | |
| | Level 3 |
| | | |
| | Level 3 applies to assets or liabilities for which there are unobservable inputs to the valuation methodology that are significant to the measurement of the fair value of the assets or liabilities. |
| | | |
| | The Company’s financial instruments consist principally of cash and cash equivalents, advances and deposits, accounts payable, accounts payable to related party and other payables. |
| | | |
| | Pursuant to ASC 825, the fair value of cash and cash equivalents are determined based on “Level 1” inputs, which consist of quoted prices in active markets for identical assets. The Company believes that the recorded values of advances and deposits, accounts payable, accounts payable to related party and other payables approximate their current fair values because of their nature and respective relatively short maturity dates or durations. |
F-13
Lake Victoria Mining Company, Inc.
(An Exploration Stage Company)
Notes to the Consolidated Financial Statements
March 31, 2012
(Expressed in US dollars)
| 2. | Summary of Significant Accounting Policies (continued) |
| | | |
| j) | Financial Instruments (continued) |
| | | |
| | Assets measured at fair value on a recurring basis were presented on the Company’s balance sheet as of March 31, 2012 as follows: |
| | | | Fair Value Measurements Using | |
| | | | Quoted Prices in | | | Significant | | | | | | | |
| | | | Active Markets | | | Other | | | Significant | | | | |
| | | | For Identical | | | Observable | | | Unobservable | | | Balance | |
| | | | Instruments | | | Inputs | | | Inputs | | | March 31, | |
| | | | (Level 1) | | | (Level 2) | | | (Level 3) | | | 2012 | |
| | | | $ | | | $ | | | $ | | | $ | |
| | Assets: | | | | | | | | | | | | |
| | Cash and cash equivalents | | 523,405 | | | – | | | – | | | 523,405 | |
| | k) | Foreign Currency Translation |
| | | |
| | | The Company’s functional and reporting currency is the United States dollar. Monetary assets and liabilities denominated in foreign currencies are translated to United States dollars in accordance with ASC 740, Foreign Currency Matters, using the exchange rate prevailing at the balance sheet date. Gains and losses arising on translation or settlement of foreign currency denominated transactions or balances are included in the determination of income. |
| | | |
| | | To the extent that the Company incurs transactions that are not denominated in its functional currency, they are undertaken in Canadian dollars and the Tanzanian Schilling. A portion of business transactions in Tanzania and mineral option purchase agreements are denominated in Tanzanian Schilling. The Company has not, to the date of these financials statements, entered into derivative instruments to offset the impact of foreign currency fluctuations. |
| | | |
| | l) | Segment Information |
| | | |
| | | At March 31, 2012, approximately $112,091 of property and equipment is located in Tanzania and $17,157 in Canada. Mineral properties are located in Tanzania. Although Tanzania is considered economically stable, it is always possible that unanticipated events in foreign countries could disrupt the Company’s operations. |
| | | |
| | m) | Comprehensive Loss |
| | | |
| | | ASC 220, Comprehensive Income, establishes standards for the reporting and display of other comprehensive loss and its components in the consolidated financial statements. As at March 31, 2012 and 2011, the Company had no items that represent other comprehensive loss, and therefore has not included a schedule of comprehensive loss in the consolidated financial statements. |
| | | |
| | n) | Income Taxes |
| | | |
| | | The Company accounts for income taxes using the asset and liability method in accordance with ASC 740, Income Taxes. The asset and liability method provides that deferred tax assets and liabilities are recognized for the expected future tax consequences of temporary differences between the financial reporting and tax bases of assets and liabilities, and for operating loss and tax credit carryforwards. Deferred tax assets and liabilities are measured using the currently enacted tax rates and laws that will be in effect when the differences are expected to reverse. The Company records a valuation allowance to reduce deferred tax assets to the amount that is believed more likely than not to be realized. |
F-14
Lake Victoria Mining Company, Inc.
(An Exploration Stage Company)
Notes to the Consolidated Financial Statements
March 31, 2012
(Expressed in US dollars)
| 2. | Summary of Significant Accounting Policies (continued) |
| | | |
| o) | Stock-Based Compensation |
| | | |
| | The Company records stock-based compensation in accordance with ASC 718, Compensation – Stock Based Compensation and ASC 505, Equity Based Payments to Non-Employees, which requires the measurement and recognition of compensation expense based on estimated fair values for all share-based awards made to employees and directors, including stock options. |
| | | |
| | ASC 718 requires companies to estimate the fair value of share-based awards on the date of grant using an option-pricing model. The Company uses the Black-Scholes option-pricing model as its method of determining fair value. This model is affected by the Company’s stock price as well as assumptions regarding a number of subjective variables. These subjective variables include, but are not limited to the Company’s expected stock price volatility over the term of the awards, and actual and projected employee stock option exercise behaviours. The value of the portion of the award that is ultimately expected to vest is recognized as an expense in the statement of operations over the requisite service period. |
| | | |
| | All transactions in which goods or services are the consideration received for the issuance of equity instruments are accounted for based on the fair value of the consideration received or the fair value of the equity instrument issued, whichever is more reliably measurable. |
| | | |
| p) | Recent Accounting Pronouncements |
| | | |
| | In January 2010, the FASB issued Accounting Standards Update (ASU) No. 2010-06, Improving Disclosures about Fair Value Measurements, which amends the ASC Topic 820, Fair Value Measurements and Disclosures. ASU No. 2010-06 amends the ASC to require disclosure of transfers into and out of Level 1 and Level 2 fair value measurements, and also requires more detailed disclosure about the activity within Level 3 fair value measurements. The new disclosures and clarifications of existing disclosures are effective for interim and annual reporting periods beginning after December 15, 2009, except for the disclosures concerning purchases, sales, issuances, and settlements in the roll forward of activity in Level 3 fair value measurements. Those disclosures are effective for fiscal years beginning after December 15, 2010, and for interim periods within those fiscal years. The adoption of this amendment did not have a material effect on the Company’s financial statements. |
| | | |
| | The Company has evaluated all other recent accounting pronouncements and determined that they would not have a material impact on the Company’s financial statements or disclosures. |
| | | |
| q) | Reclassifications |
| | | |
| | Certain reclassifications have been made to the prior period’s financial statements to conform to the current period’s presentation. |
| | | |
| 3. | Related Party Transactions and Balances |
| | | |
| a) | Prior to incorporation of the Company’s wholly-owned subsidiary in Tanzania, the Company contracted with Geo Can Resources Company Ltd (Geo Can), a related company with a shared common director, to perform exploration services on all of the properties. On June 1, 2011, the Company paid Geo Can $121,480 which was the difference between amounts owing for exploration services totaling $620,523 and advances of $499,043 made to Geo Can through Company’s subsidiary, Kilimanjaro Mining Company. |
| | | |
| | As of March 31, 2012, the Company owed $Nil (2011 - $121,480) to Geo Can for reimbursement of licenses holding costs paid on behalf of the Company which has been included in accounts payable to related parties. Refer to Note 7. |
| | | |
| b) | As at March 31, 2012, the Company owed $nil (2011- $3,000) to a director of the Company. During the year ended March 31, 2012, the Company incurred $32,000 (2011 - $15,000) of directors fees to the director and $73,459 (2011 - $73,136) of salaries to the director. |
| | | |
| c) | At March 31, 2012, the Company owed $500 (2011 - $2,450) of accounting fees to an individual related to an officer of the Company which has been included in accounts payable. During the twelve months ended March 31, 2012, the Company incurred $6,000 (2011 - $3,150) of accounting fees to the individual. |
| | | |
| d) | During the year ended March 31, 2012, the Company incurred $42,000 (2011 - $81,000) of geologist consulting fees to a director of the Company (See Note12(c)). |
| | | |
| e) | As at March 31, 2012, the Company held $27,750 in trust with a company sharing a common director, which has been included in advances and deposits. |
F-15
Lake Victoria Mining Company, Inc.
(An Exploration Stage Company)
Notes to the Consolidated Financial Statements
March 31, 2012
(Expressed in US dollars)
| 4. | Short-term Investments |
| | |
| The Company classifies its short-term investments as available-for-sale securities and carries them at fair value. The Company determines fair values for investments in public companies using quoted market prices with unrealized gains and losses included in accumulated other comprehensive income or loss. Realized gains and losses and unrealized losses that are other than temporary are recognized in earnings. |
| | |
| The Company received 2,200,000 of common shares of stock from Otterburn Ventures Inc. pursuant to four option and joint venture agreements dated May 6, 2011 (Refer to Notes 7 a), b), e), and g)) regarding four Tanzanian properties. The fair value of shares was valued at $990,000 on the grant date. |
| | |
| On July 22, 2011, the Company entered into agreements to sell 2,200,000 common shares of Otterburn to private purchasers unrelated to the Company at a price of CAD$0.10 (approximate $0.11) per share for total proceeds of $232,511. These shares were held in escrow and released on September 22, 2011. The Company recognized a loss of $757,489 on the sale of the shares. |
| | |
| 5. | Property and Equipment |
| | |
| Property and equipment consists of the following: |
| | | | As at March 31, 2012 | | | As at March 31, 2011 | |
| | | | | | | Accumulated | | | Net Book | | | | | | Accumulated | | | Net Book | |
| | | | Cost | | | Amortization | | | Value | | | Cost | | | Amortization | | | Value | |
| | | | $ | | | $ | | | $ | | | $ | | | $ | | | $ | |
| | Mining tools and equipment | | 143,272 | | | 50,853 | | | 92,419 | | | 101,495 | | | 25,278 | | | 76,217 | |
| | Moto Vehicle | | 12,800 | | | 2,133 | | | 10,667 | | | – | | | – | | | – | |
| | Furniture and equipment | | 12,127 | | | 3,769 | | | 8,358 | | | 10,101 | | | 1,794 | | | 8,307 | |
| | Computer and software | | 35,361 | | | 17,557 | | | 17,804 | | | 29,808 | | | 11,030 | | | 18,778 | |
| | | | 203,560 | | | 74,312 | | | 129,248 | | | 141,404 | | | 38,102 | | | 103,302 | |
| 6. | Other Payables |
| | |
| As of March 31, 2012 and 2011, one subsidiary of the Company withheld tax deductions of $3,111 and $4,386, respectively, to conform to local tax law. |
| | |
| 7. | Mineral Property Acquisition and Exploration Costs |
| | |
| On May 4, 2009, Kilimanjaro completed a Property Acquisition Agreement (the “Geo Can Agreement”) with Geo Can (a related party, see Note 3). Under the terms of the agreement Kilimanjaro acquired a 100% interest in the mineral property assets, which included 33 gold prospecting licenses and 13 uranium licenses. Included in this agreement were the Kalemela project’s licenses, Geita project’s license, Uyowa Project’s licenses and Kinyambwiga project’s license and other projects’ licenses. Geo Can had entered into property option agreements, regarding some of these resource properties, with Lake Victoria before the share exchange agreement between Lake Victoria and Kilimanjaro on August 7, 2009, as a consequence Geo Can no longer has any interest in those prior property agreements. |
| | |
| All of the Company’s mineral property interests are located in Tanzania. Geo Can holds resource properties in trust for the Company. Most of the resource property interests are still formally registered to Geo Can to save on registration fees. When the annual filing for each property comes due then the formal registration of each property will be transferred to Kilimanjaro or as directed by Kilimanjaro. |
F-16
Lake Victoria Mining Company, Inc.
(An Exploration Stage Company)
Notes to the Consolidated Financial Statements
March 31, 2012
(Expressed in US dollars)
| 7. | Mineral Property Acquisition and Exploration Costs (continued) |
| | |
| The following is a continuity of mineral property acquisition costs incurred during the years ended March 31, 2012 and 2011: |
| | | Kalemela | | | Geita | | | Kinyambwiga | | | Singida | | | Uyowa | | | North | | | Handeni | | | Buhemba | | | Other | | | | |
| | | Gold Project | | | Project | | | Project | | | Project | | | Project | | | Mara | | | Project | | | Project | | | Projects | | | Total | |
| | | $ | | | $ | | | $ | | | $ | | | $ | | | $ | | | $ | | | $ | | | $ | | | $ | |
| | | (a) | | | (b) | | | (c) | | | (e) | | | (f) | | | (g) | | | (h) | | | (i) | | | | | | | |
| March 31, 2010 | | - | | | - | | | - | | | - | | | - | | | - | | | - | | | - | | | - | | | - | |
| Related payments: | | | | | | | | | | | | | | | | | | | | | | | | | | | | | | |
| Cash consideration | | - | | | - | | | - | | | 742,180 | | | - | | | - | | | - | | | - | | | - | | | 742,180 | |
| Impairment | | - | | | - | | | - | | | (742,180 | ) | | - | | | - | | | - | | | - | | | - | | | (742,180 | ) |
| March 31, 2011 | | - | | | - | | | - | | | - | | | - | | | - | | | - | | | - | | | - | | | - | |
| Related payments: | | | | | | | | | | | | | | | | | | | | | | | | | | | | | | |
| Cash consideration | | - | | | 6,150 | | | - | | | 350,512 | | | 40,000 | | | - | | | 228,650 | | | 148,950 | | | - | | | 774,262 | |
| Shares issued | | - | | | - | | | - | | | - | | | - | | | - | | | 116,100 | | | 108,000 | | | - | | | 224,100 | |
| Impairment | | - | | | - | | | - | | | (350,512 | ) | | - | | | - | | | (91,100 | ) | | - | | | - | | | (441,612 | ) |
| March 31, 2012 | | - | | | 6,150 | | | - | | | - | | | 40,000 | | | - | | | 253,650 | | | 256,950 | | | - | | | 556,750 | |
The following is a continuity of mineral property exploration costs incurred during the years ended March 31, 2012 and 2011:
| | | | | | | | | Kinyambwig | | | | | | | | | | | | North | | | | | | Buhemb | | | Other | | | | |
| | | Kalemela | | | Geita | | | a | | | Suguti | | | Singida | | | Uyowa | | | Mara | | | Handeni | | | a | | | Project | | | Total | |
| | | $ | | | $ | | | $ | | | $ | | | $ | | | $ | | | $ | | | $ | | | $ | | | $ | | | $ | |
| | | (a) | | | (b) | | | (c) | | | (d) | | | (e) | | | (f) | | | (g) | | | (h) | | | (i) | | | | | | | |
| Balance, March 31, 2010 | | 633,895 | | | 408,972 | | | 209,224 | | | - | | | 565,269 | | | 618 | | | - | | | - | | | - | | | -- | | | 1,817,978 | |
| | | | | | | | | | | | | | | | | | | | | | | | | | | | | | | | | | |
| Exploration Expenditures: | | | | | | | | | | | | | | | | | | | | | | | | | | | | | | | | | |
| Camp, Field Supplies and Travel | | - | | | 511 | | | 14,869 | | | 14,968 | | | 89,808 | | | 7,654 | | | 3,597 | | | - | | | - | | | 2,593 | | | 134,001 | |
| Geological Consulting and Wages | | - | | | - | | | 136,381 | | | - | | | 544,533 | | | - | | | - | | | - | | | - | | | - | | | 680,914 | |
| Geophysical and Geochemical | | 6,509 | | | 2,442 | | | 88,413 | | | 13,732 | | | 229,162 | | | 15,555 | | | 12,749 | | | - | | | - | | | 8,338 | | | 376,900 | |
| Parts and Equipment | | - | | | 1,200 | | | 18,250 | | | 4,439 | | | 81,745 | | | 4,450 | | | 7,140 | | | - | | | - | | | 133 | | | 117,357 | |
| Project Administration Fee | | - | | | 206 | | | 12,129 | | | 719 | | | 12,625 | | | 2,543 | | | 650 | | | - | | | - | | | 1,211 | | | 30,082 | |
| Vehicle and Fuel expenses | | - | | | 2,458 | | | 15,595 | | | 17,782 | | | 53,710 | | | 5,467 | | | 7,608 | | | - | | | - | | | 10,028 | | | 112,648 | |
| Expense Reimbursements | | - | | | - | | | - | | | - | | | (256,968 | ) | | - | | | - | | | - | | | - | | | - | | | (256,968 | ) |
| | | 6,509 | | | 6,817 | | | 285,637 | | | 51,640 | | | 754,615 | | | 35,669 | | | 31,744 | | | - | | | - | | | 22,303 | | | 1,194,934 | |
| | | | | | | | | | | | | | | | | | | | | | | | | | | | | | | | | | |
| Balance, March 31, 2011 | | 640,404 | | | 415,789 | | | 494,861 | | | 51,640 | | | 1,319,884 | | | 36,287 | | | 31,744 | | | - | | | - | | | 22,303 | | | 3,012,912 | |
| | | | | | | | | | | | | | | | | | | | | | | | | | | | | | | | | | |
| Exploration Expenditures: | | | | | | | | | | | | | | | | | | | | | | | | | | | | | | | | | |
| Camp, Field Supplies and Travel | | - | | | 5 | | | 20,109 | | | 15,324 | | | 34,632 | | | 51,730 | | | 4,698 | | | 19,335 | | | 18,772 | | | 6,296 | | | 170,901 | |
| Drilling Cost | | - | | | - | | | - | | | - | | | 364,159 | | | 258,674 | | | - | | | - | | | 2,694 | | | - | | | 625,527 | |
| Geological Consulting and Wages | | 288 | | | 2,045 | | | 58,304 | | | 19,939 | | | 123,502 | | | 199,670 | | | 29,792 | | | 69,138 | | | 55,707 | | | 23,926 | | | 582,311 | |
| Geophysical and Geochemical | | - | | | - | | | 4,196 | | | 11,605 | | | 56,853 | | | 55,188 | | | 5,393 | | | 28,292 | | | 13,679 | | | - | | | 175,206 | |
| Parts and Equipment | | - | | | - | | | 6,027 | | | 2,747 | | | 1,802 | | | 17,238 | | | 133 | | | 2,393 | | | 1,191 | | | 146 | | | 31,677 | |
| Vehicle and Fuel expenses | | - | | | - | | | 14,475 | | | 16,482 | | | 15,119 | | | 32,600 | | | 6,181 | | | 17,715 | | | 13,798 | | | 6,227 | | | 122,597 | |
| Expense Reimbursements | | - | | | - | | | - | | | - | | | (623,290 | ) | | - | | | - | | | - | | | | | | - | | | (623,290 | ) |
| | | 288 | | | 2,050 | | | 103,111 | | | 66,097 | | | (27,223 | ) | | 615,100 | | | 46,197 | | | 136,873 | | | 105,841 | | | 36,595 | | | 1,084,929 | |
| | | | | | | | | | | | | | | | | | | | | | | | | | | | | | | | | | |
| Balance, March 31, 2012 | | 640,692 | | | 417,839 | | | 597,972 | | | 117,737 | | | 1,292,661 | | | 651,387 | | | 77,941 | | | 136,873 | | | 105,841 | | | 58,898 | | | 4,097,841 | |
| | a) | Kalemela Gold Project |
| | | |
| | | As a part of the Geo Can Agreement, Kilimanjaro owns 100% interest in the Kalemela Gold Project’s three prospecting licenses PL2747/2004, PL3006/2005 and PL2910/2004. The original three prospecting licenses have been divided into six licenses. As of March 31, 2012, the project is now comprised of three licenses and original three licenses were expired. The Kalemela Gold Project is located within the Southeastern Lake Victoria Goldfields in Northern Tanzania in Magu District, Mwanza Region. |
| | | |
| | | On May 6, 2011, the Company entered into an option and joint venture agreement with Otterburn. On May 20, 2011, the Company received option payment of $61,898 in cash and 300,000 common shares of Otterburn with a fair value of $135,000. On July 8, 2011, Otterburn terminated the option and joint venture agreement. On July 22, 2011, the Company sold 300,000 Otterburn shares to unrelated parties at a price of CAD$0.10 per share. Refer to Note 4. |
F-17
Lake Victoria Mining Company, Inc.
(An Exploration Stage Company)
Notes to the Consolidated Financial Statements
March 31, 2012
(Expressed in US dollars)
| 7. | Mineral Property Acquisition and Exploration Costs (continued) |
| | | |
| b) | Geita Project |
| | | |
| | As a part of the Geo Can Agreement, the Company acquired prospecting license PL2806 which were divided into two prospecting licenses. The original license was expired and the project is now comprised of one license and one license under application. The Geita Gold Project is located in Northern Tanzania within the Lake Victoria Goldfields in the Geita District, Mwanza Region. |
| | | |
| | On May 6, 2011, the Company entered into an option and joint venture agreement with Otterburn. On May 20, 2011, the Company received option payment of $42,740 in cash and 300,000 common shares of Otterburn with a fair value of $135,000. On July 8, 2011, Otterburn terminated the option and joint venture agreement. On July 22, 2011, the Company sold 300,000 Otterburn shares to unrelated parties at a price of CAD$0.10 per share. Refer to Note 4. |
| | | |
| | On March 2, 2012, the Company was granted one license on Geita project for a total consideration of $12,300, of which $6,150 was paid on March 2, 2012 and $6,150 due on July 30, 2012. |
| | | |
| c) | Musoma Bunda - Kinyambwiga Project: |
| | | |
| | The Musoma Bunda Gold Project comprise of three prospecting licenses that are located on the eastern side of Lake Victoria. |
| | | |
| | Kinyambwiga project is part of the Musoma Bunda Gold Project. As a part of the Geo Can Agreement, the Company owns 100% interest of Kinyambwiga project’s one prospecting license and 24 primary mining licenses. The Kinyambwiga Gold Project is about 208 kilometers northeast of the city of Mwanza in northern Tanzania. |
| | | |
| | A director of the Company entered into Mineral Purchase agreements on behalf of the Company with 24 Primary Mining Licenses (PMLs) which are part of the Kinyambwiga Project and which are recorded in his name and are to be transferred over to the Company at a future date. |
| | | |
| d) | Musoma Bunda - Suguti Project |
| | | |
| | Suguti project is part of the Musoma Bunda Gold Project. As a part of the Geo Can Agreement, the Company owns 100% interest of Suguti project’s one prospecting license. |
| | | |
| e) | Singida Project |
| | | |
| | On May 15, 2009, the Company signed a Mineral Financing Agreement with one director of the Company authorizing him, on behalf of the Company, to acquire Primary Mining Licenses (“PMLs”) in the Singida area. As of December 31, 2010, this director has entered into Mineral Properties Sales and Purchase agreements with various PML owners to acquire 60 PMLs in the Singida area. As of March, 31, 2012, the Company has 100% acquired 23 PMLs. On August 9, 2011, the Company relinquished 17 PMLs and the Company has the option to acquire 20 PMLs. Under the terms of these agreements, if the option to purchase is completed on all these PMLs, then the total purchase consideration would be approximately $4,682,075 (TZS7,551,733,325),outstanding option payments in US Dollar amount is estimated with an exchange rate of 0.00062 as at March 31, 2012), payable by March 9, 2013. Pursuant to the Mineral Financing Agreement, the Company has made payments of $350,512 in fiscal 2012 and $742,554 in fiscal 2011. |
In September 2009, pursuant to the agreement, the Company completed an Addendum to the Mineral Properties and Sale and provided notification to all the PML owners involved in Singida Mineral Properties and Sale Agreements that the Company would extend their due diligence period for an additional 120 days as upon paying $48,782.
On January 19, 2010, a director on behalf of the Company signed second addendums to Singida mineral properties sales and purchase agreements. The addendums revised and extended the second payment of the mineral agreements. The second payment was divided into three payments with $470,927 due on January 27, 2010, $470,927 due on July 27, 2010 and $922,900, due on January 27, 2011.
On July 27, 2010, the director signed third addendums to the Singida mineral properties sales and purchase agreements on behalf of the Company. The third addendums revised the payment terms of the second addendum. Based on the revised terms, the second installment of $470,927 was divided into two payments, with $281,065 due on July 27, 2010 and $187,426 due on October 24, 2010. The Company made the payment of $281,065 on July 27, 2010, and the payment of $187,426 on October 26, 2010.
F-18
Lake Victoria Mining Company, Inc.
(An Exploration Stage Company)
Notes to the Consolidated Financial Statements
March 31, 2012
(Expressed in US dollars)
| 7. | Mineral Property Acquisition and Exploration Costs (continued) |
| | | |
| e) | Singida Project (continued) |
| | | |
| | On February 7, 2011, a director signed fourth addendums to the Singida mineral properties sales and purchase agreements on behalf of the Company. The fourth addendums revised the payment terms of the second addendum. Based on the revised terms, the third installment of approximately $922,900 was divided into three payments, with $92,065 paid on February 9, 2011, $181,998 paid on March 10, 2011 and $646,030 due on August 9, 2011. On August 9, 2011, the Company relinquished 17 PMLs and paid $350,512 to retain the option to acquire 20 additional PMLs. The option payment of $350,512 was impaired and recorded in the consolidated statement of operations. |
| | | |
| | On May 6, 2011, the Company entered into an option and joint venture agreement with Otterburn. On May 20, 2011, the Company received option payment of $300,770 in cash and 1,100,000 common shares of Otterburn with a fair value of $495,000. |
| | | |
| | On June 21, 2011, Lake Victoria Resources, a subsidiary of the Company, entered into a service agreement with Otterburn to perform all recommended exploration work on optioned properties. As per the agreement, Otterburn agreed to reimburse exploration costs incurred on Singida project from March 2011 up to the day of termination. By March 31, 2012, the Company has received total reimbursements from Otterburn of $880,258. As of March 31, 2011, $256,968 was receivable from Otterburn under this agreement |
| | | |
| | On July 8, 2011, Otterburn terminated the option and joint venture agreement. On July 22, 2011, the Company sold 1,100,000 Otterburn shares to unrelated parties at a price of CAD$0.10 per share. Refer to Note 4. |
| | | |
| | As of March 31, 2012, under the terms of the mineral properties sales and purchase agreements the Company has completed option payments in the amount of $2,058,322. Pursuant to the original agreement and the subsequent addendums, to exercise the option the Company must pay approximately $372,000 on February 8, 2013 and $2,418,000 on March 9, 2013. At the option of the Company, a 2% Net Smelter Production royalty or 2% of the Net Sale Value may be substituted in place of the final payment for each PML. |
| | | |
| f) | Uyowa Project |
| | | |
| | As a part of the Geo Can Agreement the Company owns 100% interest in the Uyowa project’s prospecting licenses. As of March 31, 2012, the Uyowa Gold project consists of six prospecting licenses and a total of four legal PMLs. |
| | | |
| | On July 19, 2011, Guardian Investment Ltd, a related party, on behalf of the Company, entered into a mineral properties option agreement to acquire four primary mining licenses within the northern most prospecting license of the seven comprising the Uyowa Gold project. Total consideration includes: |
1) paying $20,000 within 7 days after execution date. The payment was made on July 21, 2011;
2) paying $20,000 on or before the earlier of location of a drilling rig on each PML in good working condition or January 16, 2012. The payment was made on September 6, 2011.
3) paying a total amount of $450,000, of which $25,000 due in July 2012, $25,000 due in 2013 January, $360,000 due in 2013 July and $40,000 due in 2014 January.
4) A royalty of 1% of net profit interest may be purchased at any time after completing $400,000 of payments by paying $250,000 per PML.
| | g) | North Mara Project |
| | | |
| | | As of March 31, 2012, the North Mara Project comprised of seven prospecting licenses. |
| | | |
| | | On May 6, 2011, the Company entered into an option and joint venture agreement with Otterburn. On May 20, 2011, the Company received option payment of $92,015 in cash and 500,000 common shares of Otterburn with a fair value of $225,000. On July 8, 2011, Otterburn terminated the option and joint venture agreement. On July 22, 2011, the Company sold 500,000 Otterburn shares to unrelated parties at a price of CAD$0.10 per share. Refer to Note 4. |
F-19
Lake Victoria Mining Company, Inc.
(An Exploration Stage Company)
Notes to the Consolidated Financial Statements
March 31, 2012
(Expressed in US dollars)
| 7. | Mineral Property Acquisition and Exploration Costs (continued) |
| | | | |
| h) | Handeni Project |
| | | | |
| | On April 20, 2011, the Company signed license purchase agreement to acquire one prospecting license. The total consideration was $113,250, of which $77,250 was paid on May 13, 2011 and $36,000 was paid on July 14, 2011. On June 14 and June 20, 2011 the Company paid a finder’s fee of $30,000 in cash and issued 400,000 common shares with a fair value of $108,000. |
| | | | |
| | On May 30, 2011, the Company signed prospecting license purchase agreement to acquire a second prospecting license. The total consideration was $450,000 of which $10,000 paid on June 16, 2011. On June 14 and 20, 2011, the Company paid $3,000 in cash and issued 30,000 common shares with a fair value of $8,100. On September 20, 2011, the Company terminated this purchase agreement. Capitalized acquisition costs of $21,100 were determined to be impaired. On July 1, 2011, the Company signed prospecting license purchase agreement to acquire a third prospecting license. The total consideration includes: |
| | | | |
| | 1) | paying a total amount of $470,000 to earn up to 90% of interest, of which $20,000 paid on July 6, 2011 and $50,000 paid on Sept 21, 2011, $50,000 due in 2012, $100,000 due in 2013, $125,000 due in 2014 and $125,000 due in 2015; |
| | | | |
| | 2) | paying $1,500,000 on or before September 21, 2015 to earn final 10% interest. |
| | | | |
| | On March 21, 2012, the Company terminated this agreement. Capitalized acquisition costs of $70,000 were determined to be impaired. |
| | | | |
| | On March 7, 2012, the Company was granted one license on Handeni project for a total consideration of $4,800, of which $2,400 was paid on March 7, 2012 and $2,400 due on August 14, 2012. |
| | | | |
| i) | Buhemba Project |
| | | | |
| | Buhemba Project consists of two prospecting licenses. One prospecting license is a part of the Geo Can Agreement the Company owns 100% interest. |
| | | | |
| | On April 20, 2011, the Company signed license purchase agreement to acquire one prospecting license. The total consideration was $112,150, of which $89,650 was paid on April 29, 2011 and $22,500 was paid on July 14, 2011. On June 14 and June 20, 2011 the Company paid a finder’s fee of $30,000 in cash and issued 400,000 common shares with a fair value of $108,000. |
| | | | |
| | On March 7, 2012, the Company was granted one license on Buhemba project for a total consideration of $76,800, of which $6,800 was paid on March 7, 2012, $35,000 is due on June 5, 2012 and $35,000 is due on September 3, 2012. |
| | | | |
| 8. | Capital Stock |
| | | | |
| Preferred Stock |
| | | | |
| The Company is authorized to issue 100,000,000 shares of preferred stock with a par value of $0.00001. As of March 31, 2012, the Company has not issued any preferred stock. |
| | | | |
| Common Stock |
| | | | |
| On December 7, 2010, the Company’s shareholders approved a resolution to amend the Company’s articles of incorporation to increase the number of authorized shares of common stock from 100,000,000 shares to 250,000,000 shares. All shares have equal voting rights, are non-assessable and have one vote per share. Voting rights are not cumulative and, therefore, the holders of more than 50% of the common stock could, if they choose to do so, elect all of the directors of the Company. |
| | | | |
| a) | On January 23, 2012, the Company approved a non-brokered private placement offering of up to 50,000,000 units at $0.06 per share for total consideration of $3,000,000. Each unit consists of one share of common stock and one share purchase warrant. One warrant entitles the holder to purchase one additional share of common stock at $0.12 per share until April 17, 2014. As at March 31, 2012, the Company received subscribed payment of $737,100. The units were issued on April 20, 2012 (See Note 13 (a)). |
| | | | |
| b) | On April 20 and May 30, 2011, the Company entered into three prospecting licenses purchase agreements to acquire three prospecting licenses. As per the agreements, the Company agreed to pay a finder’s fee of 830,000 common shares. On June 20, 2011, the Company issued 830,000 common shares with a fair value of $224,100 as finders’ fee to a company. |
F-20
Lake Victoria Mining Company, Inc.
(An Exploration Stage Company)
Notes to the Consolidated Financial Statements
March 31, 2012
(Expressed in US dollars)
| 8. | Capital Stock (continued) |
| | | |
| Common Stock(continued) |
| | | |
| c) | On April 8, 2011, the Company signed a debt settlement agreement with a consultant to settle a consulting fee of $80,614 for geological and business development services provided. The Company agreed to pay $31,714 cash and 163,000 shares with a fair value of $0.30 per share to settle an outstanding balance of $48,900. |
| | | |
| d) | On February 24, 2011, the Company signed debt settlement and subscription agreement with a director to settle a consulting fee of $35,000 in exchange for 145,833 shares of common stock with a fair value of $0.24 per share. On June 20, 2011, the Company issued the shares to the director. |
| | | |
| e) | On March 7, 2011, the Company completed a private placement of 20,000,000 units at $0.15 per share for total consideration of $3,000,000. Each unit consists of one share of common stock and one share purchase warrant. One warrant entitles the holder to purchase one additional share of common stock at $0.30 per share until September 7, 2011. The units were issued on March 7, 2011. |
| | | |
| f) | On November 9, 2010, the Company issued 100,000 shares of common stock to a consultant. The shares were valued at $41,000 representing their fair value on the date of issuance. |
| | | |
| g) | On October 18, 2010, the Company signed debt settlement and subscription agreement with a consultant to settle a consulting fee of $54,275 for geological and business development services provided. On October 18, 2010, the Company issued 217,100 restricted shares of common stock at $0.25 to settle the outstanding balance. The shares were valued at $102,037 representing their fair value on the date of the agreement. The company recognized a loss on debt settlement of $47,762. |
| | | |
| h) | On September 7, 2010, the Company completed a private placement of 4,790,700 units at $0.225 per share for gross consideration of $1,077,907. The Company incurred share issuance costs of $23,416. Each unit consists of one share of common stock and two redeemable warrants. One redeemable warrant entitles the holder to purchase one additional share of common stock at $0.40 per share until August 12, 2013. The other redeemable warrant entitles the holder to purchase one additional share of common stock at $0.60 per share until August 12, 2013. The redeemable warrants are callable by the Company upon 20 days written notice to the warrant holder. If the redeemable warrants are not exercised within 20 days of being called, they will terminate and may not be exercised thereafter. The units were issued on November 9, 2010. |
| | | |
| i) | On April 15, 2010, the Company issued 153,525 restricted shares of common stock and paid $21,265 to settle debt related to geological and business development services provided by a consultant. The services were valued at $58,340. The company recognized a loss on debt settlement of $8,342.50. |
| | | |
| j) | On April 15, 2010, the Company issued 85,000 restricted shares of common stock to settle debt relating to consulting and business development services provided by a consulting company. The services were valued at $34,850. The company recognized a loss on debt settlement of $7,650. |
| | | |
| k) | On January 28, 2010, the Company opened a private placement offering a maximum of 10,473,000 units at $0.20 per unit. Each unit consisted of one share of common stock and one redeemable warrant. One redeemable warrant and payment of $1.25 entitles the holder to purchase one additional common share until January 28, 2013. The redeemable warrants are callable by the Company upon 30 days written notice to the warrant holder. If the redeemable warrants are not exercised within 30 days of being called, they will terminate and may not be exercised thereafter. |
| | | |
| | As of March 31, 2010, the Company received a total cash payment of $1,448,730 and subscription receivable of $20,000 for 7,343,650 units. As of May 19, 2010, the Company issued additional 3,129,350 units for cash of $645,870, to complete a private placement of 10,473,000 units at $0.20 per share for gross consideration of $2,094,600. The Company incurred share issuance costs of $11,500. |
| | | |
| 9. | Stock Options and Warrants |
| | | |
| On October 7, 2010, the Company adopted the 2010 Stock Option Plan under which the Company is authorized to grant stock options to acquire up to a total of 10,000,000 shares of common stock. |
| | | |
| On November 4, 2011, the Company re-priced the exercise price of 120,000 stock options with an exercise price of $0.29 per share to $0.15 per share. The maturity date was also extended from October 7, 2013 to November 4, 2014. These stock options were granted on October 7, 2010. Modifications to the terms of an award are treated as an exchange of the original award for a new award. Incremental stock based compensation is measured as the excess, if any, of the fair value of the original award immediately before its terms are modified, measured based on the share price and other pertinent factors at that date. During the twelve months ended March 31, 2012, the Company recognized an incremental compensation cost of $3,510 for these modified stock options. |
F-21
Lake Victoria Mining Company, Inc.
(An Exploration Stage Company)
Notes to the Consolidated Financial Statements
March 31, 2012
(Expressed in US dollars)
| 9 | Stock Options and Warrants (continued) |
| | |
| On November 4, 2011, the Company re-priced the exercise price of 4,080,000 stock options with an exercise price of $0.45 per share to $0.15 per share. The maturity date was also extended from October 21, 2013 to November 4, 2014. These stock options were granted on October 21, 2010. Modifications to the terms of an award are treated as an exchange of the original award for a new award. Incremental stock based compensation is measured as the excess, if any, of the fair value of the original award immediately before its terms are modified, measured based on the share price and other pertinent factors at that date. During the twelve months ended March 31, 2012, the Company recognized an incremental compensation cost of $161,531 for these modified stock options. |
| | |
| On November 4, 2011, the Company granted 100,000 stock options to an officer and 300,000 stock options to a senior geological consultant at an exercise price of $0.15 per share which will expire on November 4, 2014. All stock options are non-qualified and vested immediately. The weighted average grant date fair value of stock options granted during the twelve months ended March 31, 2012 was $0.12. During the twelve months ended March 31, 2012, the Company recorded stock-based compensation of $48,784 for these stock options. |
| | |
| On October 21, 2010, the Company granted 3,580,000 stock options to six directors and officers, and 500,000 stock options to a senior geological consultant at an exercise price of $0.45 per share which will expire on October 21, 2013. All stock options are non-qualified and vested immediately. The fair value of $1,564,711 was recorded as stock-based compensation. |
| | |
| On October 7, 2010, the Company entered into a consulting agreement with Misac Noubar Nabighian to provide geophysical data processing, geophysical data interpretation services. The Company granted the Consultant an option to acquire 120,000 shares of common stock of the Company pursuant to the terms of the Company’s 2010 Stock Option Plan, at an exercise price of $0.29 per share, exercisable until October 7, 2013 and vesting immediately. The fair value of $29,278 was recorded as stock-based compensation. |
| | |
| The weighted average assumptions used in the Black-Scholes valuation model were as follows: |
| | | | | | | Year Ended | |
| | | | March 31, | | | March 31, | |
| | | | 2012 | | | 2011 | |
| | Expected dividend yield | | 0% | | | 0% | |
| | Risk-free interest rate | | 0.37% | | | 0.52% | |
| | Expected volatility | | 152% | | | 170% | |
| | Expected option life (in years) | | 3.00 | | | 3.00 | |
The total intrinsic value of stock options exercised during the years ended March 31, 2012, and 2011 was $nil. The following table summarizes the continuity of the Company’s stock options:
| | | | | | | | | | Weighted- | | | | |
| | | | | | | Weighted | | | Average | | | | |
| | | | | | | Average | | | Remaining | | | Aggregate | |
| | | | Number of | | | Exercise | | | Contractual | | | Intrinsic | |
| | | | Options | | | Price | | | Life (years) | | | Value | |
| | | | | | | $ | | | | | | $ | |
| | Outstanding, March 31, 2010 | | 4,312,500 | | | 1.01 | | | | | | | |
| | Granted | | 4,200,000 | | | 0.45 | | | | | | | |
| | Expired | | (4,312,500 | ) | | 1.01 | | | | | | | |
| | | | | | | | | | | | | | |
| | Outstanding, March 31, 2011(1) | | 4,200,000 | | | 0.15 | | | | | | | |
| | Granted | | 400,000 | | | 0.15 | | | | | | | |
| | Outstanding, March 31, 2012 | | 4,600,000 | | | 0.15 | | | 2.60 | | | – | |
| | | | | | | | | | | | | | |
| | Exercisable, March 31, 2012 | | 4,600,000 | | | 0.15 | | | 2.60 | | | – | |
At March 31, 2012 and 2011, the Company did not have any unvested options.
(1)March 31, 2011, weighted average exercise price was revised to the November 4, 2011 option amendment agreement
F-22
Lake Victoria Mining Company, Inc.
(An Exploration Stage Company)
Notes to the Consolidated Financial Statements
March 31, 2012
(Expressed in US dollars)
| 9. | Stock Options and Warrants (continued) |
| | |
| The following table summarizes the continuity of the Company’s warrants: |
| | | | Number of | | | | | | Weighted- | | | | |
| | | | Shares | | | Weighted | | | Average | | | | |
| | | | Issuable | | | Average | | | Remaining | | | Aggregate | |
| | | | Upon | | | Exercise | | | Contractual | | | Intrinsic | |
| | | | Exercise | | | Price | | | Life (years) | | | Value | |
| | | | | | | $ | | | | | | $ | |
| | Outstanding, March 31, 2010 | | 13,006,651 | | | 1.25 | | | | | | | |
| | Granted | | 32,710,750 | | | 1.01 | | | | | | | |
| | Expired | | (4,312,500 | ) | | 1.01 | | | | | | | |
| | Outstanding, March 31, 2011 | | 41,404,901 | | | 1.08 | | | | | | | |
| | Expired | | (20,000,000 | ) | | 0.30 | | | | | | | |
| | Outstanding, March 31, 2012 | | 21,404,901 | | | 0.91 | | | 1.05 | | | – | |
The Company had the following warrants outstanding as of March 31, 2012:
| | | | Exercise Price per | | | | |
| | | | Share | | | Shares Issuable | |
| | Expiration Date | | $ | | | Upon Exercise | |
| | | | | | | | |
| | September 9, 2012 | | 1.25 | | | 1,350,501 | |
| | January 28, 2013(1) | | 1.25 | | | 10,473,000 | |
| | August 13, 2013(2) | | 0.40 | | | 4,790,700 | |
| | August 13, 2013(2) | | 0.60 | | | 4,790,700 | |
| | | | | | | 21,404,901 | |
(1)These redeemable warrants are callable by the Company upon 30 days written notice to the warrant holder. If the redeemable warrants are not exercised within 30 days of being called, they will terminate and may not be exercised thereafter.
(2)These redeemable warrants are callable by the Company upon 20 days written notice to the warrant holder. If the redeemable warrants are not exercised within 20 days of being called, they will terminate and may not be exercised thereafter.
F-23
Lake Victoria Mining Company, Inc.
(An Exploration Stage Company)
Notes to the Consolidated Financial Statements
March 31, 2012
(Expressed in US dollars)
| 10. | Income Taxes |
| | |
| The Company has adopted the provisions of ASC 740, Income Taxes.Pursuant to ASC 740 the Company is required to compute tax asset benefits for net operating losses carried forward. The potential benefit of net operating losses have not been recognized in the consolidated financial statements because the Company cannot be assured that it is more likely than not that it will utilize the net operating losses carried forward in future years. |
| | |
| The components of the net deferred tax asset at March 31, 2012 and 2011, the statutory tax rate, the effective tax rate, and the amount of the valuation allowance are indicated below: |
| | | | March 31, | | | March 31, | |
| | | | 2012 | | | 2011 | |
| | | | $ | | | $ | |
| | | | | | | | |
| | Net loss before taxes | | (2,384,692 | ) | | (5,020,711 | ) |
| | Statutory rate | | 34% | | | 34% | |
| | | | | | | | |
| | Computed expected tax (recovery) | | (810,795 | ) | | (1,707,042 | ) |
| | Permanent differences | | 72,701 | | | 541,956 | |
| | Other | | 53,747 | | | – | |
| | Change in valuation allowance | | 684,347 | | | 1,165,086 | |
| | | | | | | | |
| | Income taxes | | – | | | – | |
| | | | March 31, | | | March 31, | |
| | | | 2012 | | | 2011 | |
| | | | $ | | | $ | |
| | | | | | | | |
| | Net operating loss carryforwards | | 2,510,742 | | | 2,262,433 | |
| | Mineral property acquisition and exploration | | 5,072,976 | | | 4,636,938 | |
| | Deferred tax assets | | 7,583,718 | | | 6,899,371 | |
| | Valuation allowance | | (7,583,718 | ) | | (6,899,371 | ) |
| | Net deferred tax assets | | – | | | – | |
The Company has incurred operating losses of approximately $7,543,886 which, if unutilized, will expire through to 2032. Future tax benefits, which may arise as a result of these losses, have not been recognized in these consolidated financial statements, and have been offset by a valuation allowance. The following table lists the fiscal years in which loss carryforwards expire:
| | | Expiration | |
| Loss | | Date | |
| $ | | | |
| | | | |
| 722,397 | | 2027 | |
| 554,471 | | 2028 | |
| 1,258,790 | | 2029 | |
| 2,344,312 | | 2030 | |
| 987,895 | | 2031 | |
| 321,547 | | 2032 | |
| 1,354,474 | | Indefinitely | |
| 7,543,886 | | | |
F-24
Lake Victoria Mining Company, Inc.
(An Exploration Stage Company)
Notes to the Consolidated Financial Statements
March 31, 2012
(Expressed in US dollars)
| 11. | Supplemental Cash Flow Information |
| | | | For the | | | For the | | | Accumulated From | |
| | | | Year Ended | | | Year Ended | | | December 11, 2006 | |
| | | | March 31, | | | March 31, | | | (Date of Inception) | |
| | | | 2012 | | | 2011 | | | to March 31, 2012 | |
| | | | $ | | | $ | | | $ | |
| | Non-cash Investing and Financing Activities | | | | | | | | | |
| | Accounts receivable payable exchanged for long-term investment | | – | | | – | | | 460,019 | |
| | Accounts receivable exchanged for mineral property acquisition | | – | | | – | | | 1,039,981 | |
| | Investment acquired for amount payable | | 12,530 | | | – | | | 12,530 | |
| | Receivable exchange for long-term investment | | – | | | – | | | 10,000 | |
| | Share payments received for options granted on mineral properties | | 990,000 | | | – | | | 990,000 | |
| | Stock issued for mineral interest acquisition costs | | 224,100 | | | – | | | 7,904,400 | |
| | Stock issued for services | | – | | | 41,000 | | | 2,382,523 | |
| | Stock issued for subscription receivable | | – | | | – | | | 33,275 | |
| | Stock issued to settle debt | | 83,900 | | | 230,227 | | | 230,227 | |
| | Supplemental Disclosures | | | | | | | | | |
| | Interest paid | | – | | | 523 | | | 1,045 | |
| | Income tax paid | | – | | | – | | | – | |
| 12. | Commitments |
| | | | |
| a) | On May 11, 2010, the Company entered into an agreement with a consultant to provide services as a Senior Geological Consultant. In consideration of the foregoing the Company will pay a base compensation of $15,000 per month for the first six months, to be increased to $20,000 per month after the initial six months; eligibility of a bonus of 100,000 shares of common stock at the end of six months; and at the end of 12 months the Company will grant the consultant 300,000 stock options. On November 9, 2010, the Company issued 100,000 shares of common stock to the consultant. On October 21, 2010, the Company passed a board resolution to grant the Consultant 500,000 stock options at an exercise price of $0.45 per share. On November 11, 2010, the Company signed an amendment with the consultant to the original May 11th consulting agreement. The amendment extended the term of the agreement to three years from the ending date (May 1, 2011) of the initial consulting period, and the Company agreed to pay $17,500 per month for the first 12 months and $20,000 per month thereafter. The Company granted the Consultant 300,000 stock options on November 1, 2011 (Refer to Note 9). The Company will grant the Consultant 300,000 stock options on each of November 1, 2012 and 2013. |
| | | | |
| b) | On October 7, 2010, the Company entered into a consulting agreement with Misac Noubar Nabighian to provide geophysical data processing and geophysical data interpretation services to the Company in consideration for: |
| | | | |
| | i. | granting the Consultant an option to acquire 120,000 shares of common stock of the Company pursuant to the terms of the Company’s 2010 Stock Option Plan, at an exercise price of $0.29 per share, exercisable until October 7, 2013 and vesting immediately. On October 7, 2010, the Company granted 120,000 options to the Consultant; |
| | | | |
| | ii. | paying the Consultant 0.5% of the net proceeds from the sale of any mining properties; |
| | | | |
| | iii. | granting the Consultant a royalty on producing properties as follows: (a) $1.00 per ounce of gold produced or 0.25% of net smelter returns (as such term is defined in the Agreement), whichever is greater, and (b) 0.25% of net smelter returns for all other commercial production. |
| | | | |
| | The agreement is for a term of 36 months and may be renewed at the option of the Company upon 30 days written notice. |
| | | | |
| c) | On April 26, 2011, the Company entered into an agreement with a director to provide geologist consulting services commencing April 1, 2011 for a period of two years. The Company will pay the consultant $3,500 per month, and will grant 250,000 stock options annually at each anniversary of the agreement. |
F-25
Lake Victoria Mining Company, Inc.
(An Exploration Stage Company)
Notes to the Consolidated Financial Statements
March 31, 2012
(Expressed in US dollars)
| 13. | Subsequent Events |
| | | |
| a) | On April 17, 2012, the Company completed first closing of a private placement of 14,285,000 units at $0.06 per unit for gross consideration of $857,100. Each unit consists of one share of common stock and one redeemable warrant. One redeemable warrant entitles the holder to purchase one additional share of common stock at $0.12 per share until April 17, 2014. The redeemable warrants are callable by the Company if the closing sales price of the common shares is equal to or greater than $0.18 per common share in 10 consecutive trading days. In 2012 May, the Company received additional subscription payment of $156,000 for 2,600,000 units. |
| | | |
| b) | On April 30, 2012, the Company granted 4,800,000 stock options to seven directors and officers, and 120,000 stock options to a senior geological consultant at an exercise price of $0.09 per share which will expire on April 27, 2015. All stock options are non-qualified and vested immediately. |
F-26
93
ITEM 9. | CHANGES IN AND DISAGREEMENTS WITH ACCOUNTANTS ON ACCOUNTINGAND FINANCIAL DISCLOSURE. |
None.
| ITEM 9A. | CONTROLS AND PROCEDURES. |
Disclosure Controls and Procedures
As required by paragraph (b) of Rules 13a-15 or 15d-15 under the Exchange Act, our principal executive officer and our principal financial officer evaluated our company’s disclosure controls and procedures (as defined in Rules 13a-15(e) and 15d-15(e) of the Exchange Act) as of the end of the period covered by this annual report on Form 10-K. Based on this evaluation, these officers concluded that as of the end of the period covered by this annual report on Form 10-K, these disclosure controls and procedures were not effective. Disclosure controls and procedures are controls and other procedures that are designed to ensure that the information required to be disclosed by our company in reports it files or submits under the Exchange Act is recorded, processed, summarized and reported within the time periods specified in the rules and forms of the Securities Exchange Commission and include controls and procedures designed to ensure that such information is accumulated and communicated to our company’s management, including our company’s principal executive officer and our principal financial officer, to allow timely decisions regarding required disclosure. The conclusion that our disclosure controls and procedures were not effective was due to the presence of material weaknesses in internal control over financial reporting as identified below under the heading “Management’s Report on Internal Control Over Financial Reporting.” Management anticipates that such disclosure controls and procedures will not be effective until the material weaknesses are remediated. Our company intends to remediate the material weaknesses as set out below.
Management’s Report on Internal Control Over Financial Reporting
Our company’s management is responsible for establishing and maintaining adequate internal control over financial reporting (as defined in Rules 13a-15(f) and 15d-15(f) of the Exchange Act) for our company. Our company’s internal control over financial reporting is designed to provide reasonable assurance, not absolute assurance, regarding the reliability of financial reporting and the preparation of financial statements for external purposes in accordance with generally accepted accounting principles in the United States of America. Internal control over financial reporting includes those policies and procedures that: (i) pertain to the maintenance of records that, in reasonable detail, accurately and fairly reflect the transactions and dispositions of our company’s assets; (ii) provide reasonable assurance that transactions are recorded as necessary to permit preparation of financial statements in accordance with generally accepted accounting principles in the United States of America, and that our company’s receipts and expenditures are being made only in accordance with authorizations of our management and directors; and (iii) provide reasonable assurance regarding prevention or timely detection of unauthorized acquisition, use or disposition of our assets that could have a material effect on the financial statements.
Because of its inherent limitations, internal control over financial reporting may not prevent or detect misstatements. In addition, projections of any evaluation of effectiveness to future periods are subject to the risk that controls may become inadequate because of changes in conditions and that the degree of compliance with the policies or procedures may deteriorate.
Our management, including our principal executive officer and our principal financial officer, conducted an evaluation of the design and operation of our internal control over financial reporting as of March 31, 2012 based on the criteria set forth in Internal Control – Integrated Framework issued by the Committee of Sponsoring Organizations of the Treadway Commission. This evaluation included review of the documentation of controls, evaluation of the design effectiveness of controls, testing of the operating effectiveness of controls and a conclusion on this evaluation. Based on this evaluation, our management concluded our internal control over financial reporting was not effective as at March 31, 2012. The ineffectiveness of our internal control over financial reporting was due to the following material weaknesses which are indicative of many small companies with small staff: (i) inadequate segregation of duties and effective risk assessment; and (ii) insufficient written policies and procedures for accounting and financial reporting with respect to the requirements and application of both US GAAP and SEC guidelines.
94
Our company plans to take steps to enhance and improve the design of our internal controls over financial reporting. During the period covered by this annual report on Form 10-K, we have not been able to remediate the material weaknesses identified above. To remediate such weaknesses, we plan to implement the following changes during our fiscal year ending March 31, 2013: (i) appoint additional qualified personnel to address inadequate segregation of duties and ineffective risk management; and (ii) adopt sufficient written policies and procedures for accounting and financial reporting. The remediation efforts set out in (i) is largely dependent upon our company securing additional financing to cover the costs of implementing the changes required. If we are unsuccessful in securing such funds, remediation efforts may be adversely effected in a material manner.
Because of the inherent limitations in all control systems, no evaluation of controls can provide absolute assurance that all control issues, if any, within our company have been detected. These inherent limitations include the realities that judgments in decision-making can be faulty and that breakdowns can occur because of simple error or mistake.
Changes in Internal Control Over Financial Reporting.
There were no changes in our company’s internal control over financial reporting during the quarter ended March 31, 2012 that have materially affected, or are reasonably likely to materially affect, our company’s internal control over financial reporting.
| ITEM 9B. | OTHER INFORMATION |
None.
PART III
| ITEM 10. | DIRECTORS, EXECUTIVE OFFICERS AND CORPORATE GOVERNANCE. |
Directors and Executive Officers
Our directors and executive officers, their ages, positions held, and duration of such, are as follows:
Name | Position Held with the
Company |
Age | Date First Elected
or Appointed |
David Kalenuik
| President, Chief Executive
Officer and Director | 54
| October 7, 2010
|
| Ming Zhu | Chief Financial Officer | 40 | October 7, 2010 |
| Heidi Kalenuik | Secretary, Treasurer and Director | 45 | June 28, 2008 |
| Roger Newell | Director | 69 | June 28, 2008 |
| Ahmed A. Magoma | Director | 45 | June 28, 2008 |
Ian A. Shaw
| Director, Chairman of Audit
Committee | 72
| April 8, 2010
|
| Lorne Anderson | Director | 77 | April 24, 2012 |
Business Experience
The following is a brief account of the education and business experience of each director and executive officer during at least the past five years, indicating each person’s principal occupation during the period, and the name and principal business of the organization by which he was employed.
David Kalenuik, President, Chief Executive Officer, and Director
Mr. Kalenuik became a director and was appointed President and Chief Executive Officer on October 7, 2010. Mr. Kalenuik has spent the last 35 years primarily as founder and owner of his own businesses. These businesses have ranged from product or service oriented to investor relations for publicly traded companies. Since December 2006, David has been actively involved with Kilimanjaro Mining Company Inc. and Lake Victoria Mining Company, Inc. in the identification, negotiation and acquisitions of mineral resource properties in Tanzania, East Africa. David as an International Businessman has extensive experience in start up operations, business development, strategic planning and management of both private and public companies. To date, he has been directly and indirectly responsible for the financing of each of the companies that he has been involved with. His previous experience includes being the President and Co-Founder of Larrearx, Inc./Larrea Biosciences Inc., a patented nutritional and health care supplements company, and, the President and Founder of Mitropolis Solutions Inc., a Vancouver based investor relations/investment banking firm that successfully financed and created public awareness programs for numerous public companies.
95
We believe Mr. Kalenuik is qualified to serve on our board of directors because of his knowledge of our current operations, in addition to his business experiences described above.
Ming Zhu, Chief Financial Officer
Ming Zhu (B.Comm. MA) has worked along side the management team since 2006. Ming attained a Bachelor's Degree in Accounting and Finance in 1995. He has more than 10 years’ experience specializing in corporate finance and accounting. His portfolio includes working for multinational companies as their finance manager in New York and China. He worked as a financial controller for an international trading firm for 2 years before graduating from the University of Newcastle in the UK with his Master's Degree in 2003 where he majored in Financial Analysis. He worked with a Canadian CA accounting firm prior to joining our management team as the Financial Controller and a Director in Kilimanjaro Mining Company Inc., a gold and uranium exploration company that is now a wholly owned subsidiary. From August 2009, he has been serving as the Financial Controller for we and on October 7, 2010 became the Chief Financial Officer for we.
Heidi Kalenuik, Secretary, Treasurer and a Director
Heidi Kalenuik, originally from South Africa, was the founder and President of Kilimanjaro Mining Company Inc., in December, 2006, a private company concentrating on resource property acquisitions, exploration and joint ventures in the United Republic of Tanzania. Ms. Kalenuik has been extensively involved in the precious mineral industry and has worked with over 150 private and public companies in British Columbia, Canada.
Heidi Kalenuik was appointed as an Officer and Director of Lake Victoria Mining Company in June 2008 due to her knowledge and working experience in Africa and her interest in we’s activities having been the President of Kilimanjaro Mining Company, now a wholly owned subsidiary. We believe Ms. Kalenuik is qualified to serve on our board of directors for the same reasons.
Roger Newell, Director
Roger Newell has been a director of our company since June 2008 and was our President, Principal Executive Officer from June 2008 to October 7, 2010. In December 2009 Dr. Newell was appointed an Independent Director of Midway Gold Corporation a Canadian public corporation that trades on both the Toronto TSX-V Exchange with symbol MDW and the US NYSE-AMEX also with symbol MDW. Midway Gold is a mineral exploration and development company with properties in the western United States.
In October 2007, Dr. Newell joined the management team as Executive Vice President and Director of Kilimanjaro Mining Company Inc. a private company involved in the acquisition and exploration of highly prospective mineral resource properties in Tanzania, East Africa. In June 2008 Dr. Newell was appointed President and Director of Lake Victoria Mining Company (OTCBB; LVCA) in consideration of his history in gold exploration and mining. We believe Dr. Newell is qualified to serve on our board of directors for the same reasons.
Dr. Newell served as Vice President-Development and a Board Member of Capital Gold Corp. (NYSE-AMEX;CGC and Toronto TSX;CGC) from 2000 to September 2007. As such he was responsible for much of Capital Gold’s engineering and business development at El Chanate Gold, Mexico and continued to serve on Capital Gold Corp’s Board of Directors until November 2009. He also served as President (2000 to 2006) of Capital Gold’s Mexican subsidiary, Minera Santa Rita.
96
Prior to this time at Capital Gold, he served as Exploration Manager/Senior Geologist for the Newmont Mining Company; Exploration Manager for Gold Fields Mining Company; and Vice President-Development, for Western Exploration Company.
Ahmed Magoma, Director
Ahmed Magoma has a B.Sc. in geology from the University of Dar es Salaam (1992) and 16 years of experience in the mining industry, wherein he has held progressively more responsible management and supervisory roles. Mr. Magoma joined Kilimanjaro Mining Company Inc., in March of 2007, a private company involved in the acquisition and exploration of highly prospective resource properties in Tanzania, East Africa. Mr. Magoma has been a director of Geo Can Resources Company Ltd., a private company, from April 2007 to present. In addition to being a director with Kilimanjaro, Mr. Magoma is responsible for all resource property acquisitions, negotiations and property owner and government relations within Tanzania. His experience encompasses gold projects from grassroots through to mining production. His field experience included working with Tanex, a subsidiary of DeBeers and other South African companies as a field geologist. Mr. Magoma worked with the Ministry of Energy and Minerals in Tanzania for a period to learn, through study, the techniques of small-scale miners to enhance their production. Mr. Magoma has worked with major gold companies Barrick and Randgold as a project geologist and then as senior project geologist with Tanzanite Africa. From 2005 to December 2007, Mr. Magoma was the Senior Project Geologist for Tanzanite Africa Ltd., a private Africa company.
Mr. Magoma was appointed as a Director in Lake Victoria Mining Company in June 2008. He was considered for this position because of his familiarity with we projects and operations in Africa. His experience in the Mining Law and activities native to Tanzania were also deemed to be very valuable to we by acting as a Director for we. We believe Mr. Magoma is qualified to serve on our board of directors for the same reasons.
Ian A Shaw,Director and Chairman of the Audit Committee
Ian A. Shaw, B.Comm., C.A. - Mr. Shaw, is a graduate of Trinity College, University of Toronto (B.Comm., 1964) and obtained his Chartered Accountant designation in 1969 with Deloitte, Plender, Haskins & Sells, Toronto. In 1993, after a total of 18 years in financial positions with producing mining companies he established Shaw & Associates with the objective of providing corporate finance, regulatory reporting and compliance services to clients that are typically junior public companies in the mineral resource industry. In addition to his directorship with us he is currently a director of Pelangio Exploration Inc. and Chief Financial Officer of Olivut Resources Ltd., all of which are located in Canada and listed on the TSX Venture Exchange.
We believe Mr. Shaw is qualified to serve on our board of directors because of his knowledge of our current operations, in addition to his business experiences described above.
Lorne Anderson, Director
Lorne B Anderson CA. Mr. Anderson has been an Independent Financial consultant to the minerals industry since 1998. Mr. Anderson has over 20 years of experience in the minerals industry during which time he was involved with administration, both equity and bank financings and investor relations programs. He serves on the board of directors of Tahoe Resources Inc. He serves as the CFO of SnipGold Corp. He was the CFO of Tyhee Gold Corp from May 2005 until January 2012. He was the CFO and Treasurer of Glamis Gold Ltd from 1988 to 1998. He has been a Director of Lake Victoria Mining, Inc. since May 2012. He has served as an independent director on a number of boards listed on the TSX and the TSX venture exchange.
Term of Office
Our directors are appointed for a one-year term to hold office until the next annual general meeting of our shareholders or until removed from office in accordance with our bylaws. Our officers are appointed by our board of directors and hold office until removed by the board.
Family Relationships
There are no family relationships among our directors or officers, other than David Kalenuik and Heidi Kalenuik who are husband and wife.
97
Involvement in Certain Legal Proceedings
Our directors and executive officers have not been involved in any of the following events during the past ten years:
| | 1. | any bankruptcy petition filed by or against any business of which such person was a general partner or executive officer either at the time of the bankruptcy or within two years prior to that time; |
| | | |
| | 2. | any conviction in a criminal proceeding or being subject to a pending criminal proceeding (excluding traffic violations and other minor offenses); |
| | | |
| | 3. | being subject to any order, judgment, or decree, not subsequently reversed, suspended or vacated, of any court of competent jurisdiction, permanently or temporarily enjoining, barring, suspending or otherwise limiting his involvement in any type of business, securities or banking activities; |
| | | |
| | 4. | being found by a court of competent jurisdiction (in a civil action), the Securities and Exchange Commission or the Commodity Futures Trading Commission to have violated a federal or state securities or commodities law, and the judgment has not been reversed, suspended, or vacated; |
| | | |
| | 5. | being the subject of, or a party to, any federal or state judicial or administrative order, judgment, decree, or finding, not subsequently reversed, suspended or vacated, relating to an alleged violation of: (i) any federal or state securities or commodities law or regulation; or (ii) any law or regulation respecting financial institutions or insurance companies including, but not limited to, a temporary or permanent injunction, order of disgorgement or restitution, civil money penalty or temporary or permanent cease- and-desist order, or removal or prohibition order; or (iii) any law or regulation prohibiting mail or wire fraud or fraud in connection with any business entity; or |
| | | |
| | 6. | being the subject of, or a party to, any sanction or order, not subsequently reversed, suspended or vacated, of any self-regulatory organization (as defined in Section 3(a)(26) of the Securities Exchange Act of 1934), any registered entity (as defined in Section 1(a)(29) of the Commodity Exchange Act), or any equivalent exchange, association, entity or organization that has disciplinary authority over its members or persons associated with a member. |
Code of Ethics
We adopted a Code of Ethics applicable to all of our directors, officers, employees and consultants, which is a “code of ethics” as defined by applicable rules of the SEC. Our Code of Ethics was attached as an exhibit to our annual report filed on Form 10-K with the SEC on June 26, 2008.
Section 16(a) Beneficial Ownership Reporting Compliance
Section 16(a) of the Exchange Act requires our executive officers and directors and persons who own more than 10% of a registered class of our equity securities to file with the SEC initial statements of beneficial ownership, reports of changes in ownership and annual reports concerning their ownership of our common stock and other equity securities, on Forms 3, 4 and 5 respectively. Executive officers, directors and greater than 10% shareholders are required by the SEC regulations to furnish us with copies of all Section 16(a) reports that they file.
Based solely on our review of the copies of such forms received by us, or written representations from certain reporting persons, we believe that other than as disclosed below, all filing requirements applicable to our officers, directors and greater than ten percent beneficial owners were complied with.
Name |
Number of Late Reports | Number of Transactions
Not Reported on a
Timely Basis |
Failure to File
Requested Forms |
| David Kaleniuk | 1(1) | 3 | Nil |
| Heidi Kalenuik | 1(1) | 2 | Nil |
| Roger Newell | 3(1) | 6 | Nil |
98
Ian A. Shaw
| 1(2)
2(1) | 2
5 | Nil
Nil |
| Ahmed Magoma | 1(1) | 1 | Nil |
| Ming Zhu | 1(2) | 1 | Nil |
| (1) | Filed a Form 4 – Statement of Changes in Beneficial Ownership late. |
| (2) | Filed a Form 3 – Initial Statement of Beneficial Ownership of Securities late. |
| ITEM 11. | EXECUTIVE COMPENSATION. |
The particulars of compensation paid to the following persons:
| | (a) | our principal executive officers during the year ended March 31, 2012; |
| | | |
| | (b) | each of our two most highly compensated executive officers other than our principal executive officers who were serving as executive officers at March 31, 2012; and |
| | | |
| | (c) | up to two additional individuals for whom disclosure would have been provided under (b) but for the fact that the individual was not serving as our executive officer at March 31, 2012, |
who we collectively refer to as the “named executive officers”, for the fiscal years ended March 31, 2012 and 2011, are set out in the following summary compensation table:
99
| SUMMARY COMPENSATION TABLE |
Name
and
Principal
Position |
Year
|
Salary
($)
|
Bonus
($)
|
Stock
Awards
($)
|
Option
Awards
($)
|
Non-
Equity
Incentive
Plan
Compensa-
tion
($)
|
Nonqualified
Deferred
Compensation
Earnings
($)
|
All
Other
Compensa
-tion
($)
|
Total
($)
|
David
Kalenuik(1)
President and
Chief
Executive
Officer | 2012
2011
| 202,198(2)
53,250(2)
| Nil
Nil
| Nil
Nil
| 39,591(9)
383,508(8)
| Nil
Nil
| Nil
750(2)
| Nil
Nil
| 241,789
437,508
|
Ming Zhu(3)
Chief
Financial
Officer | 2012
2011
| 90,605(4)
60,000(4)
| 1,035(4)
Nil
| Nil
Nil
| 20,114(9)(10)
76,702(8)
| Nil
Nil
| Nil
Nil
| Nil
Nil
| 111,754
136,702
|
Heidi
Kalenuik
Secretary and
Treasurer | 2012
2011
| 102,604(5)
98,500(5)
| 1,035(5)
Nil
| Nil
Nil
| 33,256(9)
322,146(8)
| Nil
Nil
| Nil
3,500(5)
| Nil
Nil
| 136,895
420,646
|
Roger
Newell(6)
Former
President,
Chief
Executive
Officer and
Chief
Financial
Officer | 2012
2011
| 42,000(7)
81,000(7)
| Nil
Nil
| Nil
Nil
| 33,256(9)
322,146(8)
| Nil
Nil
| Nil
Nil
| Nil
Nil
| 75,256
403,146
|
Notes
| | (1) | David Kalenuik was appointed our President and Chief Executive Officer on October 7, 2010. |
| | | |
| | (2) | During the fiscal year ended March 31, 2012, David Kalenuik received consulting fees of $202,198 in Cash. During the fiscal year ended March 31, 2011, David Kalenuik received consulting fees from our wholly owned subsidiary, Kilimanjaro Mining Company, of $53,250 in cash and deferred compensation of $750 to be paid for his services rendered. |
| | | |
| | (3) | Ming Zhu was appointed our Chief Financial Officer on October 7, 2010. |
| | | |
| | (4) | During the fiscal year ended March 31, 2012, Ming Zhu received salary of $90,605 and bonus of $1,035 in cash. During the fiscal year ended March 31, 2011, Ming Zhu received accounting fees from our wholly owned subsidiary, Kilimanjaro Mining Company, of $60,000 in cash for his services rendered. |
| | | |
| | (5) | During the fiscal year ended March 31, 2012, Heidi Kalenuik received salary of $102,604 and bonus of $1,035 in Cash. During the fiscal year ended March 31, 2011, Heidi Kalenuik received management fees from our wholly owned subsidiary, Kilimanjaro Mining Company, of $98,500 in cash and deferred compensation of $3,500 to be paid for her services rendered. |
100
| | (6) | Roger Newell resigned as our President, Chief Executive Officer and Chief Financial Officer on October 7, 2010. |
| | | |
| | (7) | During the fiscal year ended March 31, 2012, Roger Newll received $42,000 in cash for his geological professional services rendered. During the fiscal year ended March 31, 2011, Roger Newell received $81,000 in cash from our wholly owned subsidiary, Kilimanjaro Mining Company for his geological professional service rendered. |
| | | |
| | (8) | On October 21, 2010, we passed a resolution to grant 3,580,000 stock options to six directors and officers at an exercise price of $0.45 per share which will expire on October 21, 2013. David Kalenuik was granted 1,000,000 options with a fair value of $383,508, Heidi Kalenuik was granted 840,000 options with a fair value of $322,146, Roger Newell was granted 840,000 options with a fair value of $322,146 and Ming Zhu was granted 200,000 options with a fair value of $76,702. The fair value of the options was estimated using the Black-Scholes pricing model based on the following assumptions: dividend yield of 0%; risk-free interest rate of 0.52%; expected life of three years; and volatility of 170%. |
| | | |
| | (9) | On November 4, 2011, we re-priced the exercise price of 4,080,000 stock options with an exercise price of $0.29 per share to $0.15 per share. The maturity date was also extended from October 7, 2013 to November 4, 2014. These stock options were granted on October 21, 2010 and originally expire on October 21, 2013. During the twelve months ended March 31, 2012, the Company recognized an incremental compensation cost of $161,531 for these modified stock options. |
| | | |
| | | David Kalenuik received an incremental compensation cost of $39,591, Heidi Kalenuik received an incremental compensation cost of $33,256, Ming Zhu received an incremental compensation cost of $7,918, Roger Newell received an incremental compensation cost of $33,256. |
| | | |
| | (10) | On November 4, 2011, Ming Zhu received 100,000 stock options at an exercise price of $0.15 per share which will expire on November 4, 2014. All stock options are non-qualified and vested immediately. The fair value was estimated at $12,196. |
Employment Contracts
On April 26, 2011, we entered into a consulting agreement with Roger Newell, pursuant to which we engaged Mr. Newell to, among other things: provide the services to the corporate management, reporting to the president and subsequently to the board of directors including without limiting the generality of the foregoing, reviewing and editing technical data/press releases, finding and assessing new projects and assisting in investor relations, corporate presentations and financing requirements. As consideration for the performance of his consulting services under the agreement, we agreed to pay Mr. Newell USD$3,500 per month commencing April 1, 2011, plus applicable taxes. Contingent upon Mr. Newell executing the consulting agreement and as part of the consideration for Mr. Newell’s services, we agreed to grant Mr. Newell upon the completion of twelve (12) months of April 26, 2011 and annually on the anniversary each and every year that follows, during Mr. Newell’s continuous consulting, an option to purchase 250,000 shares’s restricted common stock. The consulting agreement is for a term of two years and may be renewed at the option of the Company by giving 30 days written notice prior to the expiry of the initial term.
On April 26, 2011, we entered into an employment letter agreement with Heidi Kalenuik, pursuant to which we employed Mrs. Kalenuik to, among other things: carry out the duties and responsibilities of the position of Secretary, Treasurer and Supervisor of Operations of the Company. As consideration for the performance of her duties under the employment letter agreement, we agreed to pay Mrs. Kalenuik CDN$102,000 (approximately US$107,017) per year commencing April 1, 2011. Mrs. Kalenuik is also entitled to receive a one-time bonus in the amount of CDN$1,000 (approximately US$1,049).
101
On April 26, 2011, we entered into a consulting agreement with David Kalenuik, pursuant to which we engaged Mr. Kalenuik to, among other things: provide the services of corporate management, reporting to the board of directors including without limiting the generality of the foregoing, hiring other managers and employees as required, finding new projects and assisting in financing requirements. As consideration for the performance of his consulting services under the agreement, we agreed to pay Mr. Kalenuik CDN$10,000 (approximately US$10,492) per month commencing April 1, 2011, plus applicable taxes. Contingent upon Mr. Kalenuik executing the consulting agreement and as part of the consideration for Mr. Kalenuik’s services, we will grant Mr. Kalenuik upon the completion of twelve (12) months of April 26, 2011 and annually on the anniversary each and every year that follows, during Mr. Kalenuik’s continuous consulting, an option to purchase 500,000 shares ’s restricted common stock. The consulting agreement is for a term of two years and may be renewed at the option of the Company by giving 30 days written notice prior to the expiry of the initial term.
Effective April 26, 2011, we entered into an employment letter agreement with Ming Zhu, pursuant to which we employed Mr. Zhu to, among other things: carry out the duties and responsibilities of the position of Chief Financial Officer. As consideration for the performance of his duties under the employment letter agreement, we agreed to pay Mr. Zhu CDN$90,000 (approximately US$94,427) per year commencing April 1, 2011. Mr. Zhu is also entitled to receive a one-time bonus in the amount of CDN$1,000 (approximately US$1,049).
Retirement or Similar Benefit Plans
There are no arrangements or plans in which we provide pension, retirement or similar benefits for directors or executive officers. Our directors and executive officers may receive stock options at the discretion of our board of directors in the future. We do not have any material bonus or profit sharing plans pursuant to which cash or non-cash compensation is or may be paid to our directors or executive officers, except that stock options may be granted at the discretion of our board of directors from time to time.
Resignation, Retirement, Other Termination, or Change in Control Arrangements
We have no plans or arrangements in respect of remuneration received or that may be received by our directors or executive officers to compensate such directors or officers in the event of termination of employment (as a result of resignation, retirement, change of control) or a change of responsibilities following a change of control.
102
Outstanding Equity Awards at Fiscal Year-End
The following table sets forth for each executive officer certain information concerning the outstanding equity awards as of March 31, 2012.
| | OPTION AWARDS | STOCK AWARDS |
Name
|
Number of
Securities
Underlying
Unexercised
Options (#)
Exercisable
|
Number of
Securities
Underlying
Unexercised
Options (#)
Unexercisable
|
Equity
Incentive
Plan
Awards:
Number of
Securities
Underlying
Unexercised
Unearned
Options
(#)
|
Option
Exercise
Price
($)
|
Option
Expiration
Date
|
Number
of
Shares
or
Units
Stock
That
Have
Not
Vested
(#) |
Market
Value of
Shares
or
Units
of Stock
That
Have
Not
Vested
($)
|
Equity
Incentive
Plan
Awards:
Numberof
Unearned
Shares,
Units or
Other
of Rights
That
Have Not
Vested
(#)
| Equity
Incentive
Plan
Awards:
Market or
Payout
Value of
Unearned
Shares,
Units or
Other
Rights
That
Have Not
Vested
(#)
|
David
Kalenuik(1)
President and
Chief
Executive
Officer | 1,000,000
| Nil
| Nil
| $0.15
| November
04, 2014
| Nil
| Nil
| Nil
| Nil
|
Ming Zhu(2)
Chief
Financial
Officer | 300,000
| Nil
| Nil
| $0.15
| November
4, 2014
| Nil
| Nil
| Nil
| Nil
|
Heidi
Kalenuik
Secretary and
Treasurer | 840,000
| Nil
| Nil
| $0.15
| November
4, 2014
| Nil
| Nil
| Nil
| Nil
|
Roger
Newell(3)
Former
President,
Chief
Executive
Officer and
Chief
Financial
Officer | 840,000
| Nil
| Nil
| $0.15
| November
4, 2014
| Nil
| Nil
| Nil
| Nil
|
| (1) | David Kalenuik was appointed our President and Chief Executive Officer on October 7, 2010. |
| | |
| (2) | Ming Zhu was appointed our Chief Financial Officer on October 7, 2010. |
| | |
| (3) | Roger Newell resigned as our President, Chief Executive Officer and Chief Financial Officer on October 7, 2010. |
Aggregated Options Exercised in the Year Ended March 31, 2012 and Year End Option Values
There were no stock options exercised during the year ended March 31, 2012.
103
Repricing of Options/SARS
On November 4, 2011, we re-priced the exercise price of 120,000 stock options with an exercise price of $0.29 per share to $0.15 per share. The maturity date was also extended from October 7, 2013 to November 4, 2014. These stock options were granted on October 7, 2010 and originally expire on October 7, 2013. Modifications to the terms of an award are treated as an exchange of the original award for a new award. Incremental stock based compensation is measured as the excess, if any, of the fair value of the original award immediately before its terms are modified, measured based on the share price and other pertinent factors at that date. During the twelve months ended March 31, 2012, we recognized an incremental compensation cost of $3,510 for these modified stock options.
On November 4, 2011, we re-priced the exercise price of 4,080,000 stock options with an exercise price of $0.45 per share to $0.15 per share. The maturity date was also extended from October 21, 2013 to November 4, 2014. These stock options were granted on October 21, 2010 and originally expire on October 21, 2013. Modifications to the terms of an award are treated as an exchange of the original award for a new award. Incremental stock based compensation is measured as the excess, if any, of the fair value of the original award immediately before its terms are modified, measured based on the share price and other pertinent factors at that date. During the twelve months ended March 31, 2012, we recognized an incremental compensation cost of $161,531 for these modified stock options.
Director Compensation
The following table sets forth the compensation for each director who is not a named executive officer for the fiscal year ended March 31, 2012:
| DIRECTOR COMPENSATION |
Name | Fees
earned or
paid in
cash
($) |
Stock
awards
($) |
Option
awards
($) | Non-equity
incentive
plan
compensation
($) | Nonqualified
deferred
compensation
earnings
($) |
All other
compensation
($) |
Total
($) |
Ahmed A.
Magoma | 105,459(1)
| Nil
| 19,795(2)
| Nil
| Nil
| Nil
| 125,254
|
| Ian A. Shaw(3) | Nil | Nil | 7,918(2) | Nil | Nil | Nil | 7,918 |
| | (1) | Mr. Ahmed Magoma is a director of the Company and a director of its two subsidiaries, Kilimanjaro Mining Company Inc. and Lake Victoria Resources (T) Limited and he is an employee of Lake Victoria Resources (T) Limited. During the fiscal year ended March 31, 2012, he received total director’s fee of $32,000. During the fiscal year ended March 31, 2012, Ahmed was paid salary of $73,459 from Lake Victoria Resources (T) Limited; his monthly gross pay was approximately $6,130. |
| | | |
| | (2) | On November 4, 2011, we re-priced the exercise price of 4,080,000 stock options with an exercise price of $0.29 per share to $0.15 per share. The maturity date was also extended from October 7, 2013 to November 4, 2014. These stock options were granted on October 21, 2010 and originally expire on October 21, 2013. During the twelve months ended March 31, 2012, the Company recognized an incremental compensation cost of $161,531 for these modified stock options. Ahmed Magoma received an incremental compensation cost of $19,795 and Ian Shaw received an incremental compensation cost of $7,918. |
| | | |
| | (3) | Mr. Ian A. Shaw was appointed as a director on April 8, 2010. |
We have no formal plan for compensating our directors for their services in their capacity as directors. Our directors are entitled to reimbursement for reasonable travel and other out-of-pocket expenses incurred in connection with attendance at meetings of our board of directors. Our board of directors may award special remuneration to any director undertaking any special services on our behalf other than services ordinarily required of a director
104
ITEM 12. | SECURITY OWNERSHIP OF CERTAIN BENEFICIAL OWNERS AND MANAGEMENTAND RELATED STOCKHOLDER MATTERS |
As of June 29, 2012, there were 111,770,733 shares of our common stock outstanding. The following table sets forth certain information known to us with respect to the beneficial ownership of our common stock as of that date by (i) each of our directors, (ii) each of our executive officers, and (iii) all of our directors and executive officers as a group. Except as set forth in the table below, there is no person known to us who beneficially owns more than 5% of our common stock.
Title of Class
Directors and Officers: | Name and Address
of Beneficial Owner | Number of Shares
Beneficially Owned (1) | Percentage of Class
(1),(2) |
| | | | |
| Common Stock | David Kalenuik | 23,011,000(3) | 20.59% |
| | Suite 810 – 675 West | | |
| | Hastings Street | | |
| | Vancouver, BC V6B 1N2 | | |
| | | | |
| Common Stock | Heidi Kalenuik | 23,011,000(4) | 20.59% |
| | Suite 810 – 675 West | | |
| | Hastings Street | | |
| | Vancouver, BC V6B 1N2 | | |
| | | | |
| Common Stock | Ming Zhu | 900,000(5) | 0.81% |
| | Suite 810 – 675 West | | |
| | Hastings Street | | |
| | Vancouver, BC V6B 1N2 | | |
| | | | |
| Common Stock | Roger Newell | 2,585,000(6) | 2.31% |
| | Suite 810 – 675 West | | |
| | Hastings Street | | |
| | Vancouver, BC V6B 1N2 | | |
| | | | |
| Common Stock | Ahmed Magoma | 1,423,750(7) | 1.27% |
| | Suite 810 – 675 West | | |
| | Hastings Street | | |
| | Vancouver, BC V6B 1N2 | | |
| | | | |
| Common Stock | Ian A. Shaw | 1,250,000(8) | 1.12% |
| | 98 Crimson Millway | | |
| | Toronto, ON M2L 1T6 | | |
| | | | |
| Common Stock | Lorne Anderson | 300,000(9) | 0.27% |
| | | | |
| | | | |
| Common Stock | Directors and Officers as | 29,469,750(10) | 26.37% |
| | a group (6) | | |
| | | | |
| 5% Stockholders |
| | | | |
| Common Stock | David Kalenuik | 23,011,000(3) | 20.59% |
| | Suite 810 – 675 West | | |
| | Hastings Street | | |
| | Vancouver, BC V6B 1N2 | | |
| | | | |
| Common Stock | Heidi Kalenuik | 23,011,000(4) | 20.59% |
| | Suite 810 – 675 West | | |
| | Hastings Street | | |
| | Vancouver, BC V6B 1N2 | | |
| (1) | Under Rule 13d-3, a beneficial owner of a security includes any person who, directly or indirectly, through any contract, arrangement, understanding, relationship, or otherwise has or shares: (i) voting power, which includes the power to vote, or to direct the voting of shares; and (ii) investment power, which includes the power to dispose or direct the disposition of shares. Certain shares may be deemed to be beneficially owned by more than one person (if, for example, persons share the power to vote or the power to dispose of the shares). In addition, shares are deemed to be beneficially owned by a person if the person has the right to acquire the shares (for example, upon exercise of an option) within 60 days of the date as of which the information is provided. In computing the percentage ownership of any person, the amount of shares outstanding is deemed to include the amount of shares beneficially owned by such person (and only such person) by reason of these acquisition rights. |
105
| (2) | The percentage of class is based on 111,770,733 shares of common stock issued and outstanding and as of June 29, 2012. |
| | |
| (3) | Includes 720,000 shares held directly, 16,186,000 shares held by Heidi Kalenuik, the spouse of David Kalenuik and 15,000 shares held by their children. Also includes 1,500,000 shares acquirable on exercise of options held directly, 3,840,000 shares acquirable on exercise of options held indirectly by Heidi Kalenuik and 750,000 shares acquirable on exercise of warrants held indirectly by Heidi Kalenuik within 60 days of the date hereof. |
| | |
| (4) | Includes 16,186,000 shares held directly, 720,000 shares held by David Kalenuik, the spouse of Heidi Kalenuik and 15,000 shares held by their children. Also includes 3,840,000 shares acquirable on exercise of options held directly, 1,500,000 shares acquirable on exercise of options held indirectly by David Kalenuik and 750,000 shares acquirable on exercise of warrants held directly within 60 days of the date hereof. |
| | |
| (5) | Includes 600,000 shares acquirable on exercise of options within 60 days of the date hereof. |
| | |
| (6) | Includes 1,090,000 shares acquirable on exercise of options and 450,000 shares acquirable on exercise of warrants within 60 days of the date hereof. |
| | |
| (7) | Includes 750,000 shares acquirable on exercise of options within 60 days of the date hereof. |
| | |
| (8) | Includes 400,000 shares acquirable on exercise of options and 450,000 shares acquirable on exercise of warrants within 60 days of the date hereof. |
| | |
| (9) | Includes 300,000 shares acquirable on exercise of options |
| | |
| (10) | Includes 8,480,000 shares acquirable on exercise of options and 1,650,000 shares acquirable on exercise of warrants within 60 days of the date hereof. |
Changes in Control
We are unaware of any contract or other arrangement the operation of which may at a subsequent date result in a change of control of our company.
Securities Authorized for Issuance Under Equity Compensation Plans
Effective October 7, 2010, we adopted our 2010 Stock Option Plan. The purpose of our 2010 Stock Option Plan is to retain the services of directors, officers, valued key employees and consultants and such other persons as the plan administrator selects, and to encourage such persons to acquire a greater proprietary interest in our company, thereby strengthening their incentive to achieve the objectives’s stockholders, and to serve as an aid and inducement in the hiring of new employees. Under the plan, the plan administrator is authorized to grant stock options to acquire up to a total of 10,000,000 shares of our common stock.
On October 7, 2010, we granted options to one of our consultants to acquire 120,000 shares of common stock exercisable at a price of $0.29 until October 7, 2013. These options vest immediately. On October 21, 2010 we granted an aggregate of 4,080,000 options at an exercise price of $0.45 for a term of three years to our directors, officers and certain consultants. The options vest immediately. On November 4, 2011, we re-priced the exercise price of 4,080,000 stock options with an exercise price of $0.45 per share to $0.15 per share. The maturity date was also extended from October 21, 2013 to November 4, 2014.
106
On November 4, 2011, we granted 100,000 stock options to an officer and 300,000 stock options to a senior geological consultant at an exercise price of $0.15 per share which will expire on November 4, 2014. All stock options are non-qualified and vested immediately.
On April 30, 2012, we granted 4,800,000 stock options to seven directors and officers, and 120,000 stock options to a senior geological consultant at an exercise price of $0.09 per share which will expire on April 30, 2015. All stock options are non-qualified and vested immediately.
The following table provides a summary of the number of stock options granted under the 2010 Stock Option Plan, the weighted average exercise price and the number of stock options remaining available for issuance under our option plan as at March 31, 2012:
| Equity Compensation Plan Information |
Plan category |
Number of securities to
be issued upon exercise
of outstanding options,
warrants and rights
(a) |
Weighted-Average
exercise price of
outstanding options,
warrants and rights
(b) | Number of
securities remaining
available for future
issuance under
equity
compensation plan
(excluding securities
reflected in column
(a)) |
Equity compensation plans not
approved by security holders (2010
Stock Option Plan) | 4,600,000
| $0.15
| 5,400,000
|
ITEM 13. | CERTAINRELATIONSHIPSANDRELATEDTRANSACTIONS,ANDDIRECTORINDEPENDENCE. |
Except as noted below, none of the following parties has, since commencement of our fiscal year ended March 31, 2010, had any material interest, direct or indirect, in any transaction with us or in any presently proposed transaction that has or will materially affect us, in which our company is a participant and the amount involved exceeds the lesser of $120,000 or 1% of the average of our company’s total assets for the last two completed financial years:
| | (i) | Any of our directors or officers; |
| | | |
| | (ii) | Any person proposed as a nominee for election as a director; |
| | | |
| | (iii) | Any person who beneficially owns, directly or indirectly, shares carrying more than 5% of the voting rights attached to our outstanding shares of common stock; |
| | | |
| | (iv) | Any of our promoters; and |
| | | |
| | (v) | Any member of the immediate family (including spouse, parents, children, siblings and in- laws) of any of the foregoing persons. |
Related Party Transactions and Balances:
| | a) | Prior to incorporation of the Company’s wholly-owned subsidiary in Tanzania, the Company contracted with Geo Can Resources Company Ltd (Geo Can), a related company with a shared common director, to perform exploration services on all of the properties. On June 1, 2011, the Company paid Geo Can $121,480 which was the difference between amounts owing for exploration services totaling $620,523 and advances of $499,043 made to Geo Can through Company’s subsidiary, Kilimanjaro Mining Company. |
107
| | | As of March 31, 2012, the Company owed $Nil (2011 - $121,480) to Geo Can for reimbursement of licenses holding costs paid on behalf of the Company which has been included in accounts payable to related parties. Refer to Note 7. |
| | | |
| | b) | As at March 31, 2012, the Company owed $nil (2011- $3,000) to a director of the Company. During the year ended March 31, 2012, the Company incurred $32,000 (2011 - $15,000) of directors fees to the director and $73,459 (2011 - $73,136) of salaries to the director. |
| | | |
| | c) | At March 31, 2012, the Company owed $500 (2011 - $2,450) of accounting fees to an individual related to an officer of the Company which has been included in accounts payable. During the twelve months ended March 31, 2012, the Company incurred $6,000 (2011 - $3,150) of accounting fees to the individual. |
| | | |
| | d) | During the year ended March 31, 2012, the Company incurred $42,000 (2011 - $81,000) of geologist consulting fees to a director of the Company (See Note12(c)). |
| | | |
| | e) | As at March 31, 2012, the Company held $27,750 in trust with a company sharing a common director, which has been included in advances and deposits. |
Director Independence
Our common stock is quoted on the OTC bulletin board interdealer quotation system, which does not have director independence requirements. Under NASDAQ rule 5605(a)(2), a director is not considered to be independent if he or she is also an executive officer or employee of the corporation. David Kaleniuk is our president and chief executive officer, Heidi Kalenuik is our secretary and treasurer and Ahmed Magoma is an employee of a subsidiary and therefore are not considered independent. Messrs. Anderson and Shaw are considered to be independent as they are not officers or employees of our company.
Audit Committee and Charter
Our audit committee consists of three directors. Two of them, Ian Shaw and Lorne Anderson are independent and Ian Shaw is the designated Chair of the Committee when it is constituted. Our audit committee is responsible for: (1) selection and oversight of our independent accountant; (2) establishing procedures for the receipt, retention and treatment of complaints regarding accounting, internal controls and auditing matters; (3) establishing procedures for the confidential, anonymous submission by our employees of concerns regarding accounting and auditing matters; (4) engaging outside advisors; and, (5) funding for the outside auditory and any outside advisors engagement by the audit committee. A copy of our audit committee charter was filed with the Securities and Exchange Commission on June 26, 2008 with our Form 10-K.
Audit Committee Financial Expert
The Board has determined that the Chairman of the Audit Committee is Ian A. Shaw. Ian A. Shaw and Lorne Anderson are independent directors, qualify as “audit committee financial expert” as defined by the SEC and also meets the additional criteria for independence of Audit Committee members set forth in Rule 10A-3(b)(l) under the Securities Exchange Act of 1934, as amended (the “Exchange Act”).
Disclosure Committee and Charter
We have a disclosure committee and disclosure committee charter. Our disclosure committee is comprised of all of our officers and directors. The purpose of the committee is to provide assistance to the Chief Executive Officer and the Chief Financial Officer in fulfilling their responsibilities regarding the identification and disclosure of material information about us and the accuracy, completeness and timeliness of our financial reports. A copy of the disclosure committee charter was filed with the Securities and Exchange Commission on June 26, 2008 our Form 10-K.
National Instrument 58-101
We are a reporting issuer in the Province of British Columbia. National Instrument 58-101 of the Canadian Securities Administrators requires our company to disclose annually in our annual report certain information concerning corporate governance disclosure.
108
Board of Directors
Our board of directors currently consists of Roger A Newell, David Kalenuik, Heidi Kalenuik, Ian A. Shaw, Lorne Anderson and Ahmed A. Magoma. We have determined that Mr. Kalenuik, Mrs. Kalenuik, Mr. Newell and Mr. Magoma are not independent as that term is defined in National Instrument 52-110 due to the fact that they are directors, officers and employees of our company. Messrs. Shaw and Anderson are independent.
Our board of directors facilitates its exercise of independent supervision over management by endorsing the guidelines for responsibilities of the board as set out by regulatory authorities on corporate governance in Canada and the United States. Our board’s primary responsibilities are to supervise the management of our company, to establish an appropriate corporate governance system, and to set a tone of high professional and ethical standards. The board is also responsible for:
selecting and assessing members of the board;
choosing, assessing and compensating the chief executive officer of our company, approving the compensation of all executive officers and ensuring that an orderly management succession plan exists;
reviewing and approving our company’s strategic plan, operating plan, capital budget and financial goals, and reviewing its performance against those plans;
adopting a code of conduct and a disclosure policy for our company, and monitoring performance against those policies;
ensuring the integrity of our company’s internal control and management information systems;
approving any major changes to our company’s capital structure, including significant investments or financing arrangements; and
reviewing and approving any other issues which, in the view of the board or management, may require board scrutiny.
Directorships
The following directors are also directors of other reporting issuers (or the equivalent in a foreign jurisdiction), as identified next to their name:
Director | Reporting Issuers or Equivalent in a Foreign
Jurisdiction |
| David Kalenuik | N/A |
| Heidi Kalenuik | N/A |
| Roger Newell | Midway Gold, Corp |
| Ian A. Shaw | Pelangio Exploration Inc. |
| Ahmed A. Magoma | N/A |
| Lorne Anderson | Tahoe Resources Inc |
109
Orientation and Continuing Education
We have an informal process to orient and educate new members to the board regarding their role on the board, our committees and our directors, as well as the nature and operations of our business. This process provides for an orientation with key members of the management staff, and further provides access to materials necessary to inform them of the information required to carry out their responsibilities as a board member. This information includes the most recent board approved budget, the most recent annual report, the audited financial statements and copies of the interim quarterly financial statements.
The board does not provide continuing education for its directors. Each director is responsible to maintain the skills and knowledge necessary to meet his or her obligations as directors.
Nomination of Directors
The board is responsible for identifying new director nominees. In identifying candidates for membership on the board, the board takes into account all factors it considers appropriate, which may include strength of character, mature judgment, career specialization, relevant technical skills, diversity and the extent to which the candidate would fill a present need on the board. As part of the process, the board, together with management, is responsible for conducting background searches, and is empowered to retain search firms to assist in the nominations process. Once candidates have gone through a screening process and met with a number of the existing directors, they are formally put forward as nominees for approval by the board.
Assessments
The board intends that individual director assessments be conducted by other directors, taking into account each director’s contributions at board meetings, service on committees, experience base, and their general ability to contribute to one or more of our company’s major needs. However, due to our stage of development and our need to deal with other urgent priorities, the board has not yet implemented such a process of assessment.
| ITEM 14. | PRINCIPAL ACCOUNTANT FEES AND SERVICES. |
The aggregate fees billed for the completed fiscal years ended March 31, 2012 and 2011 for professional services rendered by Manning Elliott LLP for the audit of our annual financial statements, quarterly reviews of our interim financial statements and services normally provided by the independent accountant in connection with statutory and regulatory filings or engagements for these fiscal periods were as follows:
| Year Ended
March 31,
2012 | Year Ended
March 31,
2011 |
| Audit Fees and Audit Related Fees | $58,812 | $16,136 |
| Tax Fees | $Nil | $Nil |
| All Other Fees | $Nil | $Nil |
| Total | $58,812 | $16,136 |
In the above tables, “audit fees” are fees billed by our company’s external auditors for services provided in auditing our company’s annual financial statements for the subject year. “Audit-related fees” are fees not included in audit fees that are billed by the auditors for assurance and related services that are reasonably related to the performance of the audit review of our company’s financial statements. “Tax fees” are fees billed by the auditors for professional services rendered for tax compliance, tax advice and tax planning. “All other fees” are fees billed by the auditors for products and services not included in the foregoing categories.
110
Policy on Pre-Approval by Audit Committee of Services Performed by Independent Auditors
The board of directors pre-approves all services provided by our independent auditors. All of the above services and fees were reviewed and approved by the board of directors before the respective services were rendered.
The board of directors has considered the nature and amount of fees billed by Manning Elliott LLP and believes that the provision of services for activities unrelated to the audit is compatible with maintaining their respective independence.
PART IV. OTHER INFORMATION
| ITEM 15. | EXHIBITS AND FINANCIAL STATEMENT SCHEDULES. |
| Exhibit | |
| Number | Description |
| 3.1 | Articles of Incorporation (incorporated by reference from our Registration Statement on Form SB-2, filed on June 6, 2007) |
| 3.2 | Certificate of Amendment dated December 7, 2010 (incorporated by reference from our Current Report on Form 8-K dated December 10, 2010) |
| 3.3 | Amended and Restated Bylaws (incorporated by reference from our Current Report on Form 8-K filed on June 7, 2011) |
| 4.1 | Specimen Stock Certificate (incorporated by reference from our Registration Statement on Form SB-2 filed on June 6, 2007) |
| 4.2 | Form of Warrant Certificate for Offering Completed September 7, 2010 (incorporated by reference from our Quarterly Report on Form 10-Q filed on November 23, 2010) |
| 10.1 | License (incorporated by reference from our Registration Statement on Form SB-2, filed on June 6, 2007) |
| 10.2 | Amendment to License Agreement, dated June 3, 2008 (incorporated by reference from our Annual Report on Form 10-K filed on June 26, 2008) |
| 10.3 | Option Agreement with Geo Can Resources Company Limited (incorporated by reference from our Annual Report on Form 10-K filed on July 14, 2009) |
| 10.4 | Binding Letter Agreement with Kilimanjaro Mining Company Inc. (incorporated by reference from our Annual Report on Form 10-K filed on July 14, 2009) |
| 10.5 | Consulting Services Agreement with Stocks That Move (incorporated by reference from our Quarterly Report on Form 10-Q filed on November 23, 2009) |
| 10.6 | Consulting Agreement with Robert Lupo (incorporated by reference from our Quarterly Report on Form 10-Q filed on February 22, 2010) |
| 10.7 | Addendum to the Consulting Agreement with Robert Lupo (incorporated by reference from our Quarterly Report on Form 10-Q filed on February 22, 2010) |
| 10.8 | Finder’s Fee Agreement with Robert A. Young and the RAYA Group (incorporated by reference from our Annual Report on Form 10-K filed on July 14, 2019) |
| 10.9 | Termination of the Consulting Agreement with Robert Lupo (incorporated by reference from our Annual Report on Form 10-K filed on July 14, 2010) |
| 10.10 | Consulting Agreement with Clive Howard Matthew King (incorporated by reference from our Annual Report on Form 10-K filed on July 14, 2010) |
| 10.11 | Consulting Agreement dated October 7, 2010 between we and Misac Noubar Nabighian (incorporated by reference from our Current Report on Form 8-K filed on October 13, 2010) |
| 10.12 | 2010 Stock Option Plan (incorporated by reference from our Current Report on Form 8-K filed on October 13, 2010) |
| 10.13 | Stock Exchange Agreement with Kilimanjaro Mining Company, Inc. and their selling shareholders (incorporated by reference from our Quarterly Report on Form 10-Q filed on November 23, 2009) |
| 10.14 | Form of Subscription Agreement for Offering Completed September 7, 2010 (incorporated by reference from our Quarterly Report on Form 10-Q filed on November 23, 2010) |
| 10.15 | Amendment No. 1 to Consulting Agreement between we and Clive King dated effective November 11, 2010.(incorporated by reference from our Quarterly Report on Form 10-Q filed on November 23, 2010) |
| 10.16 | Form of Mineral Property Sales Agreement dated May 15, 2009, July 29, 2009, August 28, 2009 and November 19, 2009 between a director and the landowners listed below (collectively the “Landowners”) (incorporated by reference from our Quarterly Report on Form 10-Q filed on November 23, 2010): |
| Exhibit | |
| Number | Description |
| | No | Owners Name |
| | S01 | Pius Joackim Game in Parenership with Mustafa Kaombwe and Msua Mkumbo |
| | S03 | Mohamed Suleimani and Partners Plus Chombo, Alfred Joakim and Heri S. Mhula |
| | S04 | Maswi Marwa In Partnership with Robert Malando, Andrew Julius Marando and Mathew Melania |
| | S05 | John Bina Wambura in Partnership with Fabiano Lango |
| | S06 | Elizabeth Shango |
| | S07 | Athuman Chiboni in Partnership with Maswi Marwa and Robert Malando |
| | S08 | Malando Maywili in Partnership with Charles Mchembe |
| | S09 | Robert Malando |
| | S10 | Raymond Athumani Munyawi |
| S11 | Jeremia K. Lulu in Partnership with Agnes Musa, Juma Shashu, Neema Safari, Neema Tungaraza, Safari Neema Tungaraza, Safari Meema and Simon Gidazada |
| | S12 | Heri S. Mhula and partners Samweli Sumbuka, Plus Gam and Shambulingole |
| | S13 | Limbu Magambo Nyoda and Partners Saba Joseph, Bakari Kahinda |
| | S14 | Shambuli Sumbuka in Partnership with Limbu Gambo |
| | S15 | Salama Mselemu |
| | S16 | John Bina Wambura in Partnership with Bosco Sevelin Chaila; Plus Game; Saimon Jonga |
| S17 | John Bina Wambura in Partnership with Jumanne Mtemi; Anton Gidion; Bosco Sevelin Chaila; Plus Game; Saimon Jonga |
| | S18 | Limbu Magambo in Partnership with Pous GamI and Shambuli Sumbuka |
| S19 | Lukas Mmary in Partnership with Henry Pajero, John Bina, Massanja Game, Mwajuma Joseph, Mwita Magita and Plus Game |
| | S20 | Maswi Marwa In Partnership with Shagida malando; Marwa Marwa; Benidict Mitti and Fred Mgongo |
| | S21 | Mustafa IDD Kaombwe |
| S22 | Mustafa IDD Kaombwe in Partnership with Mahega Malugoyi; Julias Kamana; Ramadhani Lyanga and Abas Mustafa |
| | S23 | Ramadhani Mohamed Lyanga In partnership With Mustafa Kaombwe and Bethod Njega |
| | S24 | Ales David Kajoro in partnership with Henry Ignas; Daud Peter and Julias Charles Rugiga |
| | S25 | Joel Mazemle in Partnership with Christina Mazemle, Plus Chombo and Limbu Magambo Nyoda |
| S26 | Idd Ismail in Partnership with Bakari Abdi, Elizabeth U. Yohana, Emanuel Marco, Hamisi Ramadhan, Husein Hasan, Mnaya Hosea, and Sanane Msigalali |
| 10.17 | Form of Addendum No. 1 to Mineral Property Sales Agreement dated September 18, 2009 between a director and the Landowners (incorporated by reference from our Quarterly Report on Form 10-Q filed on November 23, 2010) |
| 10.18 | Form of Addendum No. 2 to Mineral Property Sales Agreement dated January 18, 2010 between a director and the Landowners (incorporated by reference from our Quarterly Report on Form 10-Q filed on November 23, 2010) |
| 10.19 | Form of Addendum No. 3 to Mineral Property Sales Agreement dated July 27, 2010 between a director and the Landowners (incorporated by reference from our Quarterly Report on Form 10-Q filed on November 23, 2010) |
| 10.20 | Mineral Financing Agreement between we and Ahmed Magoma dated October 19, 2009 (incorporated by reference from our Quarterly Report on Form 10-Q filed on November 23, 2010) |
| 10.21 | Property Purchase Agreement between Geo Can Resources Company Limited and Kilimanjaro Mining Company, Inc dated May 5, 2009(incorporated by reference from our Quarterly Report on Form 10-Q filed on November 23, 2010) |
| 10.22 | Amendment to Mineral Financing Agreement between we and Ahmed Magoma dated October 27, 2009 (incorporated by reference from our Quarterly Report on Form 10-Q filed on November 23, 2010) |
| 10.23 | Declaration of Trust of Geo Can Resources Company Limited dated July 23, 2009 (incorporated by reference from our Quarterly Report on Form 10-Q filed on November 23, 2010) |
| 10.24 | Form of Subscription Agreement for non US Subscribers (incorporated by reference from our Current Report on Form 8-K filed on March 11, 2011) |
| 10.25 | Form of Subscription Agreement for US Subscribers (incorporated by reference from our Current Report on Form 8-K filed on March 11, 2011) |
| 10.26 | Consulting Agreement dated April 26, 2011 between David Kalenuik and we (incorporated by reference from our Current Report on Form 8-K filed on May 2, 2011) |
| Exhibit | |
| Number | Description |
| 10.27 | Consulting Agreement dated April 26, 2011 between Roger Newell and we (incorporated by reference from our Current Report on Form 8-K filed on May 2, 2011) |
| 10.28 | Employment Agreement dated April 26, 2011 between Heidi Kalenuik and we (incorporated by reference from our Current Report on Form 8-K filed on May 2, 2011) |
| 10.29 | Employment Agreement dated April 26, 2011 between Ming Zhu and we (incorporated by reference from our Current Report on Form 8-K filed on May 2, 2011) |
| 10.30 | Geita Option Agreement dated May 6, 2011 between Otterburn Ventures Inc. and we (incorporated by reference from our Current Report on Form 8-K filed on May 12, 2011) |
| 10.31 | Kalemela Option Agreement dated May 6, 2011 between Otterburn Ventures Inc. and we (incorporated by reference from our Current Report on Form 8-K filed on May 12, 2011) |
| 10.32 | North Mara Option Agreement dated May 6, 2011 between Otterburn Ventures Inc. and we (incorporated by reference from our Current Report on Form 8-K filed on May 12, 2011) |
| 10.33 | Singida Option Agreement dated May 6, 2011 among Otterburn Ventures Inc., we and Ahmed Abubakar Magoma (incorporated by reference from our Current Report on Form 8-K filed on May 12, 2011) |
| 14.1 | Code of Ethics (incorporated by reference from our Annual Report on Form 10-K filed on June 26, 2008) |
| 16.1 | Letter dated October 8, 2010 from BehelerMick PS (incorporated by reference from our Current Report on Form 8-K filed on October 8, 2010) |
| 21.1* | List of Subsidiaries |
| 31.1* | Certification of Chief Executive Officer pursuant to Section 302 of the Sarbanes-Oxley Act of 2002 |
| 31.2* | Certification of Chief Financial Officer pursuant to Section 302 of the Sarbanes-Oxley Act of 2002 |
| 32.1* | Certification of Chief Executive Officer pursuant Section 906 Certifications under Sarbanes-Oxley Act of 2002 |
| 32.2* | Certification of Chief Financial Officer pursuant Section 906 Certifications under Sarbanes-Oxley Act of 2002 |
| 99.2 | Audit Committee Charter (incorporated by reference from our Annual Report on Form 10-K filed on June 26, 2008) |
| 99.3 | Disclosure Committee Charter (incorporated by reference from our Annual Report on Form 10-K filed on June 26, 2008) |
SIGNATURES
Pursuant to the requirements of Section 13 or 15(d) of the Securities Exchange Act of 1934, the registrant has duly caused this report to be signed on its behalf by the undersigned, thereunto duly authorized.
| | LAKE VICTORIA MINING COMPANY, INC. |
| | | |
| | | |
| | BY: | /s/ David Kalenuik |
| | | David Kalenuik |
| | | President and Chief Executive Officer |
| | | (Principal Executive Office) |
| | | |
| | Date: | June 29, 2012 |
Pursuant to the requirements of the Securities Exchange Act of 1934, this report has been signed below by the following persons on behalf of the registrant and in the capacities and on the dates indicated.
| By | /s/ David Kalenuik | |
| | David Kalenuik | |
| | President, Chief Executive Officer | |
| | and Director | |
| | (Principal Executive Officer) | |
| | Date: June 29, 2012 | |
| | | |
| | | |
| By | /s/ Ming Zhu | |
| | Ming Zhu | |
| | Chief Financial Officer | |
| | (Principal Accounting Officer and Principal Financial Officer) | |
| | Date: June 29, 2012 | |
| | | |
| | | |
| By | /s/ Heidi Kalenuik | |
| | Heidi Kalenuik | |
| | Director | |
| | June 29, 2012 | |
| | | |
| By | /s/ Roger A. Newell | |
| | Roger A. Newell | |
| | Director | |
| | June 29, 2012 | |
| | | |
| By | /s/ Ahmed A. Magoma | |
| | Ahmed A. Magoma | |
| | Director | |
| | June 29, 2012 | |
| | | |
| By | /s/ Ian A. Shaw | |
| | Ian A. Shaw | |
| | Director | |
| | June 29, 2012 | |
| | | |
| By | /s/ Lorne Anderson | |
| | Lorne Anderson | |
| | Director | |
| | June 29, 2012 | |