UNITED STATES
SECURITIES AND EXCHANGE COMMISSION
Washington, D.C. 20549
FORM N-CSR
CERTIFIED SHAREHOLDER REPORT OF REGISTERED
MANAGEMENT INVESTMENT COMPANIES
Investment Company Act file number 811-22077
Prospector Funds, Inc.
(Exact name of registrant as specified in charter)
370 Church St., Guilford, CT 06437
(Address of principal executive offices) (Zip code)
Prospector Partners Asset Management, LLC, 370 Church St., Guilford, CT 06437
(Name and address of agent for service)
(203) 458-1500
Registrant's telephone number, including area code
Date of fiscal year end: December 31, 2019
Date of reporting period: June 30, 2019
Item 1. Report to Stockholders.
Prospector Capital Appreciation Fund
Prospector Opportunity Fund
Beginning on April 30, 2021, as permitted by regulations adopted by the Securities and Exchange Commission, paper copies of the Funds’ shareholder reports will no longer be sent by mail, unless you specifically request paper copies of the reports. Instead, the reports will be made available on the Funds’ website, www.prospectorfunds.com, and you will be notified by mail each time a report is posted and provided with a website link to access the report.
If you already elected to receive shareholder reports electronically, you will not be affected by this change and you need not take any action. You may elect to receive shareholder reports and other communications from the Funds electronically by contacting your financial intermediary (such as a broker-dealer or bank) or, if you are a direct investor, by calling (877) 734-7862.
You may elect to receive all future reports in paper free of charge. If you invest through a financial intermediary, you can contact your financial intermediary to request that you continue to receive paper copies of your shareholder reports. If you invest directly with the Funds, you can call (877) 734-7862 to let the Funds know you wish to continue receiving paper copies of your shareholder reports. Your election to receive reports in paper will apply to all funds held in your account if you invest through your financial intermediary or all funds held with the fund complex if you invest directly with the Funds.
| | Semi-Annual Report |
| | |
| www.prospectorfunds.com | June 30, 2019 |
PROSPECTOR FUNDS, INC.
July 24, 2019
Dear Shareholders of the Prospector Capital Appreciation Fund and Prospector Opportunity Fund,
It’s been a bit over a year since Jerome Powell led his first FOMC meeting as Chairman. Powell’s outlook on the economy at the time was rosy. During the March, 2018 meeting the economic outlook strengthened and the 2019 GDP growth forecast rose from 2.1% to 2.4% with benign inflation expectations. Despite political pressure from the White House, the Fed’s “dot plot” indicated three rate hikes in 2018, three in 2019, and two in 2020. Additionally, Powell stated the Fed’s balance sheet would continue to run off barring a significant and unexpected weakening in the outlook.
Fast forward 15 months and the Fed outlook has changed entirely. The 2019 GDP growth outlook has slowed. The Fed is also expressing concern regarding current market sentiment and global growth. Internationally, 10-year government yields have once again gone negative in Germany and Japan. In the words of Chairman Powell during his June testimony, “Apparent progress on trade turned to greater uncertainty, and our contacts in business and agriculture report heightened concerns over trade developments. These concerns may have contributed to the drop in business confidence in some recent surveys and may have started to show through to incoming data…While the baseline outlook remains favorable, the question is whether these uncertainties will continue to weigh on the outlook and thus call for additional monetary policy accommodation.” The Fed, now likely to cut rates in the near future, will also halt the run off of the $4.0 trillion balance sheet at the end of September.
The market’s prognosis on the economy is equally gloomy. The yield curve is partially inverted (which could be indicative of a looming recession) and the market is assigning a significant probability the Fed will cut rates this year. No doubt the White House will pressure the Fed to cut rates in front of the upcoming 2020 election.
In our last letter, we asserted that there are no immediate signs of a U.S. recession, despite what the curve is indicating. To summarize, credit quality is excellent, GDP growth is robust (albeit slower), most investment-grade corporate balance sheets are in good shape, the consumer remains healthy, and there aren’t obvious financial excesses. The only recession indicators we can point to is a widening of credit spreads off the early 2018 low levels and inversions in the yield curve – which can be a false flag. That said, recessions are often sourced from exogenous events which arrive with little warning.
If a recession occurs in the near term, it will likely be a mild one and unlike the 2008 recession. It has been some time since we experienced a garden-variety recession (the last one occurring in 2001 when the U.S. economy realized a mere 0.6% contraction). We also do not see asset bubbles that could result in a disastrous implosion. However, one area of concern is in the private equity and leveraged lending markets. Given this extended period of low rates, investors have “chased” returns by flocking to illiquid assets. The private credit market alone has nearly quadrupled in size since 2007. There has also been a dramatic rise in “dry powder” and deal valuations. The average private equity deal through the cycle has risen from 7x Enterprise Value / EBITDA to 13x, coupled with an increase in leverage. Our interpretation is too much capital is chasing too few deals. This results in private investment firms paying higher prices and/or accepting a lower return. In the event of a “normal” recession, lower-quality leveraged loans and portfolio companies will likely come under pressure. While not a large systemic risk to the economy, pressure on private markets could create a negative wealth effect, freeze up the alternative credit market, and leave many portfolio companies “broken” which could exacerbate an economic contraction.
PROSPECTOR FUNDS, INC.
Another area of concern is the national debt level of the U.S. which now stands at $22 trillion. This figure represents a $2 trillion increase since President Trump took office. Today, national Debt / GDP stands at 104%, far above the 63% level in 2007. A higher debt level constrains future growth and makes it harder to engage in discretionary fiscal spending to limit the impact of an economic contraction. Additionally, the recent tax cut will further exacerbate the fiscal deficit, effectively removing a fiscal tool that could have been used in the next downturn.
As for the international markets, China is worrisome. The U.S. / China trade talks are a wildcard with an uncertain outcome. However, our greatest concern is the Chinese leveraging cycle of the past decade. Total debt / GDP is estimated to be over 300% which has almost doubled in size since 2007. With growth in China modestly slowing (if you trust the official numbers) and a surge in known defaults ($120B yuan defaults in 2018, four times the 2017 rate), China looks increasingly due for a deleveraging cycle. While we are not experts on China and hold no direct exposure in your portfolio, any economic contraction will inevitably spill over to the global economy.
If a recession or economic shock is around the corner, we believe our focus on first questioning the downside of every potential investment will act as a buffer. The Funds are invested in companies with conservatively stated balance sheets, substantial franchise values, significant cash flow generating capabilities, trading at reasonable valuations, and avoiding excessive risk taking. That said, if an economic contraction does not occur, your portfolio should continue to produce acceptable risk adjusted returns.
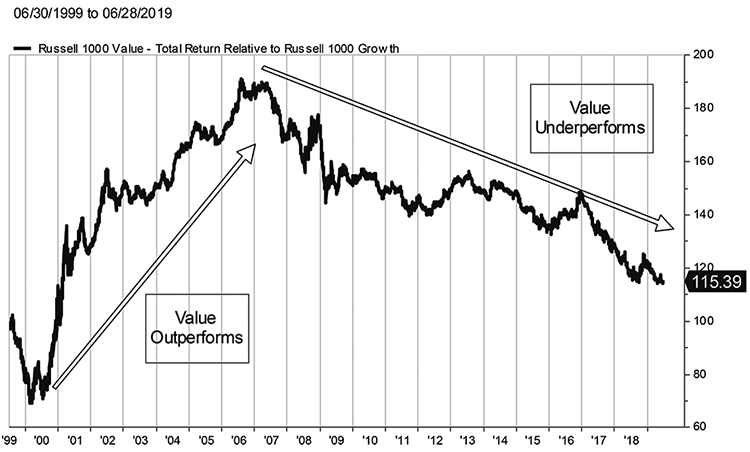
A Contemplation of Value Investing
As can be seen in the above chart, value investing has underperformed growth investing significantly over the past thirteen years. This has resulted in broad market benchmarks such as the S&P 500 and the Russell 1000 tilting further and further towards growth investing as a consequence of their market cap weighting methodology. As long as the growth over value cycle persists, boosted by the powerful passive over active cycle, value portfolios will continue to struggle to beat increasingly growth-tilted general market benchmarks. Consequently, value investors continue to experience redemptions, further exacerbating the down cycle.
PROSPECTOR FUNDS, INC.
Are all value investors the same? Do they utilize a common set of techniques to select stocks and construct portfolios? The short answer is, no. Underneath the value investing umbrella, portfolio managers utilize a wide variety of strategies and techniques such as: low price to earnings ratio, low price to book value, high dividend yield, private market value (PMV), free cash flow yield (FCF), low price to earnings before income taxes, depreciation and amortization (EBITDA), and pure contrarian investing.
All these techniques have merit and many serve to reinforce others. At Prospector, we heavily rely on two of these techniques in order to identify value and we are especially attracted to situations where we can use both at the same time. Our fundamental favorites are PMV and FCF. Below, we describe several methods of value investing we employ, along with examples of investments made using those techniques. Each stock mentioned is held in either or both the Opportunity and Capital Appreciation Fund.
Private Market Value (part 1):
Private market value can mean different things to different people. At Prospector, we engage in two types of private market value analysis. First, there is the most common PMV technique which is to compare the selling price and metrics of whole companies which have been sold to independent third parties to the metrics of share prices (which are partial, minority stakes) of public companies in the same industries. If the public shares sell at a meaningful discount (creating a margin of safety) to the implied takeout prices, that could create an opportunity for a successful investment if there is a decent chance that the public company would agree to a sale within a reasonable timeframe. A corollary PMV analysis we execute is to calculate the PMV of various units of a diversified company in order to determine if a wide discount exists between the value of the public share versus the sum of the parts of the company on a PMV basis if management were to sell parts of the company rather than the whole.
A relevant example of this type of analysis is our sum of the parts (SOTP) work on Berkshire Hathaway (BRK-B). We have developed, over a very long time, a proprietary model whereby we strive to measure whether the company is selling at a discount or premium to our SOTP analysis. Simplistically, we start by calculating the required capital each of Berkshire’s insurance units would need were they to be stand-alone companies. Our history of analyzing insurance companies (and serving on insurance-company boards) gives us valuable insight here. From that, we then determine how much of their investment portfolio would be considered “excess capital” and we mark the stock portfolio to market. Then, we attribute a private market value to Berkshire’s other, non-insurance subsidiaries and also take into consideration parent-company debt. We feel our Berkshire SOTP model has done a good job through the years of signaling buy points and sell points for the stock.
Private Market Value (part 2):
The second type of PMV analysis we perform at Prospector is to transform a GAAP balance sheet into a statement of net asset value (NAV). Essentially, we mark a balance sheet to market using our own proprietary research into the carrying values as determined by management. This is a crucial technique for analyzing balance sheet driven financial institutions such as lenders and insurers where half of the balance sheet is a “blind pool.” By that we mean that the stated values on the balance sheet for a loan portfolio in a lender or the claims reserves for an insurer are management estimates. In other words, management gets to grade their own exams over the short term. We try to identify managements whose estimates are consistently either conservative or optimistic over time.
A recent portfolio addition, medical malpractice and workers comp insurer ProAssurance Corp. (PRA), is a good example of the aforementioned. Management, who we have long followed and admired, has consistently set reserves very conservatively over a long period of time – an important quality when dealing with such “long tail”
PROSPECTOR FUNDS, INC.
insurance lines (where the ultimate cost of claims isn’t known until years after the business is written). While management’s history of conservatism could be relatively easily ascertained by most investors, we also take the extra step of manipulating the company’s statutory reserve data to try to get a rough estimate of how over-reserved the company currently is. We feel ProAssurance continues to have “equity in their reserves” and the valuation of the company does not fully reflect this position. Additionally, we view PRA as a potential merger & acquistion (“M&A”) target. Our estimate of the company’s private market value, based on recent acquisitions of specialty insurance companies as well as our view of PRA’s excess reserve position both factored meaningfully in our decision to establish a position in PRA stock.
Free Cash Flow Yield Analysis:
This brings us to free cash flow yield analysis. Free cash flow means just what it sounds like. It is the dollars of cash left over after management has properly tended to the required reinvestment of capital into their business. That capital can be in the form of hard asset capital expenditures or even additional investment in working capital to support the core business. The actual FCF metric we use is to estimate the sustainable free cash generated by a company and divide it by the enterprise value, which is the equity market value plus the balance sheet debt net of cash. We like companies that generate more cash than they need. These companies tend to carry low levels of debt which may help protect them during unsettled equity market conditions and/or economic downturns. The easiest route to a permanent loss is when a financing happens during adverse market conditions. The cost of equity and/or debt spikes and permanently confiscates value from pre-transaction equity holders.
Portfolio holding, Oracle Corp. (ORCL) is one example of a company we were attracted to based on their FCF profile, and rock-solid balance sheet. Oracle, which the market perceived as having missed the move to the cloud (led by Amazon Web Services and Microsoft’s Azure) had underperformed peers. However, we recognized that ORCL had what we deem a “second-mover advantage.” With the company’s large customer base remaining intact, Oracle has the ability to transition customers to the cloud at the clients’ own pace. When we made our initial purchases of ORCL stock (mid-2018), the company traded at close to a 9% 2019 estimated FCF yield, while Microsoft (for example) traded at a 5% FCF yield. Microsoft has executed splendidly, and deserves their valuation. However, we feel as ORCL makes the transition to the cloud, this valuation gap will close. Meanwhile, Oracle has a very solid balance sheet and is aggressively buying back stock.
To Conclude:
Popular press has postulated over the past few years, “Is value investing dead?” We say no. During our careers, we have experienced long cycles of outperformance by both growth and value investing. In other words, there is an ultimate tendency to regress towards the mean between growth and value. Current market conditions are reminiscent of the late 1990’s with extended valuations for a relatively short list of large capitalization growth companies plus speculative valuations on technology-centric initial public offerings. When that cycle ended abruptly in early 2000, a seven-year period of value investing dominance ensued. While we cannot predict the timing of an inflection point, we are confident that it will ultimately occur. When it does, we plan to be ready.
Prospector Opportunity Fund Highlights
The Prospector Opportunity Fund rose by 19.22% during the first half of 2019, a terrific absolute result. This compared to a 21.35% increase in the Russell Midcap and a 16.98% lift in the Russell 2000 over the same period. Once again growth companies outperformed their value brethren with technology and industrial shares leading the way.
PROSPECTOR FUNDS, INC.
Your portfolio is significantly overweight financial stocks and consumer staples. During the first six months, the financial stocks in POPFX rose roughly in line with the portfolio and the benchmarks. Within the financials, insurance outperformed banks. The consumer staples area of the portfolio significantly outperformed, a nice accomplishment since the consumer staples stocks in general were notable market laggards. Other sectors where our stock selection contributed to overall performance were in the technology, energy, and industrials.
Portfolio trading activity in the first half consisted more of trading around existing positions than meaningful portfolio restructuring. We bought and sold banks and insurers, tilting more towards insurance early in the year and more recently starting to emphasize banks. The same could be said for technology and industrial companies where we trimmed standout performers such as Microsoft, Xilinx and Circor in favor of better risk adjusted return potential in Maxim, Faro Technologies, and Powell Industries.
Significant new positions established include CBOE Global Markets (CBOE) and E*Trade Financial (ETFC). CBOE’s best business earns transaction fees from options and futures on the S&P 500 and Russell 2000 indices which they license and the CBOE Volatility Index or VIX which they own. CBOE has an exceptional business model, having averaged 46% operating margins in its nine-year history as a public company. The balance sheet is strong. Revenues have grown each year and they generate free cash flow in excess of their net income on average. Since trading activity in these proprietary products tend to rise sharply during unsettled equity markets, we view CBOE as a “call option on chaos” in the markets.
E*Trade is a solid, growing online company offering banking, investment, and stock brokerage services. We view the company as similar to a bank with limited credit risk since their assets are mostly agency mortgage-backed securities. The stock has come under pressure recently as investors fret over the Fed’s dovish stance and its potential impact upon the net interest margin. ETFC has a very strong balance sheet, generates excellent free cash, and sells for a modest bank-like valuation.
Prospector Capital Appreciation Fund Highlights
Your Prospector Capital Appreciation Fund investment gained a respectable 16.40% in the first half of 2019. Given the “risk-on” nature of the rally thus far in 2019, PCAFX modestly lagged the S&P 500’s return of 18.54% for the same period. Once again, technology stocks led the S&P 500 with the sector realizing a 27% return during the period – far and away the market leader. We continue to avoid the “buy growth regardless of price” segment of the market in general. Value investing, with an emphasis on mitigating downside risk remains our focus.
The two largest common stock purchases made year to date were life and supplemental-health insurer, Torchmark (TMK), and the aforementioned ProAssurance (PRA). Torchmark is somewhat unique in the life insurance sector; the company only sells plain-vanilla products directly to consumers and through exclusive agencies. This model has generated long-term single-digit revenue growth with high returns on equity (10-year average of 13%) and exceptional cash flows, with very little volatility or accounting adjustments. This business is also relatively capital “light” and Torchmark has returned over 90% of the total operating income generated in the aggregate during the last 10 years, via dividends and share repurchases. We believe TMK, an approximately $10 billion market cap company, would be an attractive asset for a larger domestic company or a foreign enterprise. It’s worth noting that portfolio holding, Berkshire Hathaway, owns 5.8% of TMK shares. The valuation (13x 2019 estimated earnings per share) is attractive, short interest is meaningful (7 days to cover), and sell-side sentiment is poor (2 buy, 2 hold, 5 sell).
PROSPECTOR FUNDS, INC.
The largest sale during the first half was the elimination of our long-term holding in Johnson & Johnson (JNJ), which has recently been on the wrong end of many negative headlines and lawsuits related to accusations of talc-induced cancer, as well as the company’s alleged part in opiate crisis. These issues had caused the stock to sell off dramatically at the end of 2018. When JNJ rebounded significantly this year despite an increasingly negative fact pattern, we deemed the downside too great, and moved on.
We also eliminated positions in two banks which were highlighted in our last letter – SunTrust (STI) and Oritani (ORIT). We sold SunTrust soon after the stock rallied on the agreement to merge (really be acquired by) BB&T. While we feel there are many positive attributes which drove this deal (and, we think, will drive more bank M&A), the post-deal valuation, combined with our concerns over integration risk (sparked by our conversations with industry contacts who indicated that client and lender retention were likely issues), caused us to take gains and reinvest into other attractive lenders. Oritani was sold as it appreciated towards our view of private market value. Soon thereafter, it was announced that Valley National Bancorp was to buy ORIT for stock at prices very close to our selling price.
Outlook
After a ten-year post-financial crisis period of consistent underlying conditions for equity investing, fundamentals are shifting. Modestly slowing economic growth and macro concerns have given investors pause and led to a rerating of certain risk assets. Regardless, the U.S. economy remains fundamentally healthy and continues to be a global leader.
Interest and mortgage rates continue near historically low levels, having retraced by over 120 basis points from the October highs as inflation remains benign and economic growth moderates. Although we are clearly late in the economic cycle, the odds of a 2019 recession without a full-blown trade war seem low.
Investment-grade corporations have decent balance sheets and are currently producing acceptable free cash flows. We are carefully monitoring aggregate corporate debt levels (especially the BBB- debt which is a single notch above junk status), which now sit above pre-2008 crisis levels. The 2018 corporate tax cuts and the ability to repatriate foreign cash holdings should continue to drive higher employment, M&A activity, and capital returns including buybacks and dividends. Profit margins remain near all-time high levels, currently 11%, and look to be at some risk from higher wages and input costs.
In our estimation, equity valuations have quickly bounced back to elevated levels. During the last four months of 2018, we moved to the seventh decile from the tenth decile on trailing operating earnings only to rebound back to the ninth decile. Equities look most reasonable when comparing earnings yields to Treasury or even high-grade corporate bond yields. In any case, the values inherent in your portfolio should attract acquirers and other investors over time. Meanwhile, we believe equities are a superior asset allocation alternative to bonds over the longer term.
Thank you for entrusting us with your money.
Respectfully submitted,
| John D. Gillespie | Kevin R. O’Brien | Jason A. Kish | |
PROSPECTOR FUNDS, INC.
Performance data quoted represents past performance; past performance does not guarantee future results.
Opinions expressed are those of the Funds and are subject to change, are not guaranteed, and should not be considered a recommendation to buy or sell any security.
Mutual fund investing involves risk. Principal loss is possible. Investments in debt securities typically decrease in value when interest rates rise. This risk is usually greater for longer-term debt securities. The Funds invest in foreign securities which involve greater volatility and political, economic and currency risks and differences in accounting methods. The Funds invest in smaller and mid-cap companies, which involve additional risks such as limited liquidity and greater volatility. The Funds may hold restricted securities purchased through private placements. Such securities can be difficult to sell without experiencing delays or additional costs. Derivatives involve risks different from, and in certain cases, greater than the risks presented by more traditional investments. These risks are fully disclosed in the prospectus.
The S&P 500 Index is a broad based unmanaged index of 500 stocks, which is widely recognized as representative of the equity market in general. You cannot invest directly in an index.
The Russell 2000 Index is an unmanaged small-cap index that measures the performance of the 2,000 smallest companies in the Russell 3000 Index. You cannot invest directly in an index.
The Russell 1000 Index is an unmanaged index that measures the performance of the highest-ranking 1,000 stocks in the Russell 3000 Index. Which represents about 90% of the total market capitalization of that index. You cannot invest directly in an index.
The Russell MidCap Index is an unmanaged mid-cap index that measures the performance of the 800 smallest companies in the Russell 1000 Index. You cannot invest directly in an index.
The CBOE Volatility Index is a benchmark index that measures the market’s expectation of future volatility. The VIX Index is based on options of the S&P 500® Index.
Enterprise Value is a measure of the theoretical takeover price that an investor would have to pay in order to acquire a particular company.
EBITDA – ”Earnings Before Income Taxes, Depreciation and Amortization” is calculated by adding back the non-cash expenses of depreciation and amortization to a firm’s operating income.
Price to earnings ratio is the ratio for valuing a company that measures its current share price relative to its per-share earnings.
Price to book value measures a company’s market price in relation to its book value. The ratio denotes how much equity investors are paying for each dollar in net assets.
Basis point is a unit that is equal to 1/100th of 1% and is used to denote the change in a financial instrument.
Free cash flow is revenue less operating expenses including interest expenses and maintenance capital spending. It is the discretionary cash that a company has after all expenses and is available for purposes such as dividend payments, investing back into the business or share repurchases.
Private Market Value is the break-up market value of all divisions of a company if divisions were each independent and established their own market stock prices.
Fund holdings and/or security allocations are subject to change at any time and are not recommendations to buy or sell any security. Please see the Schedule of Investments section in this report for a full listing of the Fund’s holdings.
Prospector Funds, Inc. are distributed by Quasar Distributors, LLC.
PROSPECTOR FUNDS, INC.
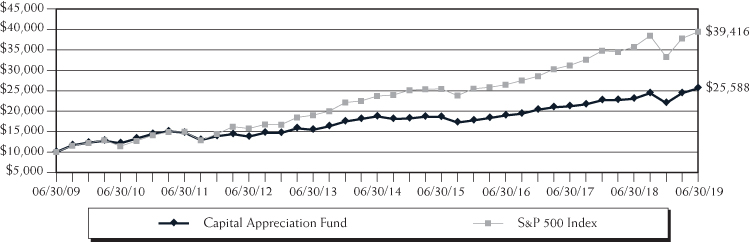
Capital Appreciation Fund
The chart assumes an initial investment of $10,000. Performance reflects waivers of fee and operating expenses in effect. In the absence of such waivers, total return would be reduced. Past performance is not predictive of future performance. Investment return and principal value will fluctuate, so that your shares, when redeemed, may be worth more or less than their original cost. Performance assumes the reinvestment of capital gains and income distributions. The performance does not reflect the deduction of taxes that a shareholder would pay on Fund distributions or the redemption of Fund shares.
Average Annual Rates of Return (%) – As of June 30, 2019
| | One Year | Three Year | Five Year | Ten Year | Since Inception(1) |
| Capital Appreciation Fund | 11.06% | 10.53% | 6.44% | 9.85% | 6.02% |
S&P 500 Index(2) | 10.42% | 14.19% | 10.71% | 14.70% | 7.99% |
| (1) | September 28, 2007 |
| (2) | The Standard & Poor’s 500 Index (S&P 500) is an unmanaged, capitalization-weighted index generally representative of the U.S. market for large capitalization stocks. This Index cannot be invested in directly. |
PROSPECTOR FUNDS, INC.
Opportunity Fund
The chart assumes an initial investment of $10,000. Performance reflects waivers of fee and operating expenses in effect. In the absence of such waivers, total return would be reduced. Past performance is not predictive of future performance. Investment return and principal value will fluctuate, so that your shares, when redeemed, may be worth more or less than their original cost. Performance assumes the reinvestment of capital gains and income distributions. The performance does not reflect the deduction of taxes that a shareholder would pay on Fund distributions or the redemption of Fund shares.
Average Annual Rates of Return (%) – As of June 30, 2019
| | One Year | Three Year | Five Year | Ten Year | Since Inception(1) |
| Opportunity Fund | 11.33% | 12.63% | 9.85% | 13.13% | 9.40% |
Russell 2000 Index(2) | -3.31% | 12.30% | 7.06% | 13.45% | 7.20% |
Russell Midcap Index(3) | 7.83% | 12.16% | 8.63% | 15.16% | 8.25% |
| (1) | September 28, 2007 |
| (2) | An unmanaged small-cap index that measures the performance of the 2,000 smallest companies in the Russell 3000 Index. This index cannot be invested in directly. |
| (3) | An unmanaged mid-cap index that measures the performance of the 800 smallest companies in the Russell 1000 Index. This index cannot be invested in directly. |
PROSPECTOR FUNDS, INC.
Expense Example (Unaudited)
June 30, 2019
As a shareholder of the Fund, you incur two types of costs: (1) transaction costs, which may include but are not limited to, redemption fees, wire transfer fees, maintenance fee (IRA accounts), and exchange fees; and (2) ongoing costs, including management fees; distribution and/or service fees; and other Fund expenses. This Example is intended to help you understand your ongoing costs (in dollars) of investing in the Fund and to compare these costs with the ongoing costs of investing in other mutual funds. The Example is based on an investment of $1,000 invested at the beginning of the period and held for the entire period (January 1, 2019 – June 30, 2019).
ACTUAL EXPENSES
The first line of the table below provides information about actual account values and actual expenses. Although the Fund charges no sales load or transaction fees, you will be assessed fees for outgoing wire transfers, returned checks and stop payment orders at prevailing rates charged by U.S. Bancorp Fund Services, LLC, the Fund’s transfer agent. The example below includes, but is not limited to, management fees, shareholder servicing fees and other Fund expenses. However, the example below does not include portfolio trading commissions and related expenses, interest expense and other extraordinary expenses as determined under generally accepted accounting principles. You may use the information in this line, together with the amount you invested, to estimate the expenses that you paid over the period. Simply divide your account value by $1,000 (for example, an $8,600 account value divided by $1,000 = 8.6), then multiply the result by the number in the first line under the heading entitled “Expenses Paid During Period” to estimate the expenses you paid on your account during this period.
HYPOTHETICAL EXAMPLE FOR COMPARISON PURPOSES
The second line of the table below provides information about hypothetical account values and hypothetical expenses based on the Fund’s actual expense ratio and an assumed rate of return of 5% per year before expenses, which is not the Fund’s actual return. The hypothetical account values and expenses may not be used to estimate the actual ending account balance or expenses you paid for the period. You may use this information to compare the ongoing costs of investing in the Fund and other funds. To do so, compare this 5% hypothetical example with the 5% hypothetical examples that appear in the shareholder reports of the other funds.
Please note that the expenses shown in the table are meant to highlight your ongoing costs only and do not reflect any transactional costs, such as redemption fees or exchange fees. Therefore, the second line of the table is useful in comparing ongoing costs only, and will not help you determine the relative total costs of owning different funds. In addition, if these transactional costs were included, your costs would have been higher.
| | | | Expenses Paid |
| | Beginning Account | Ending Account | During Period(1) |
| | Value (01/01/19) | Value (06/30/19) | (01/01/19 to 06/30/19) |
Capital Appreciation Actual(2) | $1,000.00 | $1,164.00 | $6.98 |
Capital Appreciation Hypothetical | | | |
(5% return before expenses) | 1,000.00 | 1,018.35 | 6.51 |
| | | | |
Opportunity Actual(2) | 1,000.00 | 1,192.20 | 7.07 |
Opportunity Hypothetical | | | |
(5% return before expenses) | 1,000.00 | 1,018.35 | 6.51 |
| (1) | Expenses are equal to the Fund’s annualized expense ratio for the most recent six-month period of 1.30% and 1.30% for Capital Appreciation Fund and Opportunity Fund, respectively, multiplied by the average account value over the period, multiplied by 181/365 to reflect the one-half year period. |
| (2) | Based on the actual returns for the six-month period ended June 30, 2019 of 16.40% and 19.22% for Capital Appreciation Fund and Opportunity Fund, respectively. |
PROSPECTOR FUNDS, INC.
Sector Allocation (% of net assets) (Unaudited)
as of June 30, 2019(1)(2)
Capital Appreciation Fund
Top 10 Holdings (% of net assets) (Unaudited)
as of June 30, 2019(1)(3)
Capital Appreciation Fund
| | RenaissanceRe Holdings | | | 3.9 | % |
| | Brown & Brown | | | 3.1 | % |
| | Verint Systems, 1.500%, 06/01/2021 | | | 3.0 | % |
| | Abbott Laboratories | | | 2.9 | % |
| | Hess | | | 2.9 | % |
| | Forestar Group, 3.750%, 03/01/2020 | | | 2.9 | % |
| | Coca-Cola | | | 2.5 | % |
| | Merck & Co. | | | 2.4 | % |
| | Berkshire Hathaway, Class B | | | 2.4 | % |
| | Nestle | | | 2.4 | % |
| | (1) | Fund holdings and sector allocations are subject to change at any time and are not recommendations to buy or sell any security. | |
| | (2) | Sector allocation includes all investment types. | |
| | (3) | Invesco Treasury Portfolio excluded from top 10 holdings. | |
PROSPECTOR FUNDS, INC.
Sector Allocation (% of net assets) (Unaudited)
as of June 30, 2019(1)(2)
Opportunity Fund
Top 10 Holdings (% of net assets) (Unaudited)
as of June 30, 2019(1)(3)
Opportunity Fund
| | Brown & Brown | | | 4.0 | % |
| | RenaissanceRe Holdings | | | 3.9 | % |
| | Torchmark | | | 3.1 | % |
| | Federated Investors, Class B | | | 2.8 | % |
| | Axis Capital Holdings | | | 2.2 | % |
| | Hanover Insurance Group | | | 2.2 | % |
| | Mercury General | | | 2.2 | % |
| | White Mountains Insurance Group | | | 2.1 | % |
| | Nestle | | | 2.0 | % |
| | Newmont Mining | | | 2.0 | % |
| | (1) | Fund holdings and sector allocations are subject to change at any time and are not recommendations to buy or sell any security. | |
| | (2) | Sector allocation includes all investment types. | |
| | (3) | Invesco Treasury Portfolio excluded from top 10 holdings. | |
PROSPECTOR FUNDS, INC.
Schedule of Investments (Unaudited)
June 30, 2019
Capital Appreciation Fund
Description | | Shares | | | Value | |
| | | | | | | |
| COMMON STOCKS – 76.8% | | | | | | |
| | | | | | | |
| Banks – 4.3% | | | | | | |
Berkshire Hills Bancorp | | | 5,700 | | | $ | 178,923 | |
Comerica | | | 2,300 | | | | 167,072 | |
Dime Community Bancshares | | | 18,200 | | | | 345,618 | |
Kearny Financial | | | 25,000 | | | | 332,250 | |
KeyCorp | | | 11,600 | | | | 205,900 | |
| | | | | | | | 1,229,763 | |
| | | | | | | | | |
| Communication Services – 1.8% | | | | | | | | |
Telephone & Data Systems | | | 16,375 | | | | 497,800 | |
| | | | | | | | | |
| Consumer Discretionary – 2.0% | | | | | | | | |
Lowe’s Companies | | | 5,500 | | | | 555,005 | |
| | | | | | | | | |
| Consumer Staples – 12.0% | | | | | | | | |
Campbell Soup | | | 6,600 | | | | 264,462 | |
Coca-Cola | | | 14,225 | | | | 724,337 | |
Colgate-Palmolive | | | 8,400 | | | | 602,028 | |
Mondelez International, Class A | | | 8,250 | | | | 444,675 | |
Nestle | | | 6,600 | | | | 683,258 | |
Tootsie Roll Industries | | | 11,521 | | | | 425,471 | |
Walgreens Boots Alliance | | | 5,150 | | | | 281,550 | |
| | | | | | | | 3,425,781 | |
| | | | | | | | | |
| Energy – 5.6% | | | | | | | | |
Exxon Mobil | | | 3,750 | | | | 287,362 | |
Hess | | | 12,900 | | | | 820,053 | |
Suncor Energy | | | 15,600 | | | | 486,096 | |
| | | | | | | | 1,593,511 | |
| | | | | | | | | |
| Healthcare – 7.0% | | | | | | | | |
Abbott Laboratories | | | 9,850 | | | | 828,385 | |
AstraZeneca – ADR | | | 11,700 | | | | 482,976 | |
Merck & Co. | | | 8,300 | | | | 695,955 | |
| | | | | | | | 2,007,316 | |
| | | | | | | | | |
| Industrials – 3.9% | | | | | | | | |
Eaton | | | 8,150 | | | | 678,732 | |
Pentair | | | 3,800 | | | | 141,360 | |
Regal Beloit | | | 3,700 | | | | 302,327 | |
| | | | | | | | 1,122,419 | |
See Notes to the Financial Statements
PROSPECTOR FUNDS, INC.
Schedule of Investments (Unaudited) – Continued
June 30, 2019
Capital Appreciation Fund
Description | | Shares | | | Value | |
| | | | | | | |
COMMON STOCKS – 76.8% (Continued) | | | | | | |
| | | | | | | |
| Information Technology – 10.2% | | | | | | |
FARO Technologies* | | | 7,000 | | | $ | 368,060 | |
FLIR Systems | | | 12,450 | | | | 673,545 | |
Leidos Holdings | | | 5,500 | | | | 439,175 | |
Microsoft | | | 4,850 | | | | 649,706 | |
Oracle | | | 5,700 | | | | 324,729 | |
Paychex | | | 2,100 | | | | 172,809 | |
Science Applications International | | | 3,200 | | | | 276,992 | |
| | | | | | | | 2,905,016 | |
| | | | | | | | | |
| Insurance Brokers – 3.1% | | | | | | | | |
Brown & Brown | | | 26,700 | | | | 894,450 | |
| | | | | | | | | |
| Life & Health Insurance – 4.2% | | | | | | | | |
Aflac | | | 10,400 | | | | 570,024 | |
Torchmark | | | 3,400 | | | | 304,164 | |
Voya Financial | | | 5,700 | | | | 315,210 | |
| | | | | | | | 1,189,398 | |
| | | | | | | | | |
| Materials – 3.2% | | | | | | | | |
Domtar | | | 11,951 | | | | 532,178 | |
Louisiana-Pacific | | | 14,800 | | | | 388,056 | |
| | | | | | | | 920,234 | |
| | | | | | | | | |
| Multi-line Insurance – 1.7% | | | | | | | | |
Loews | | | 9,100 | | | | 497,497 | |
| | | | | | | | | |
| Property & Casualty Insurance – 11.0% | | | | | | | | |
Axis Capital Holdings | | | 9,600 | | | | 572,640 | |
Berkshire Hathaway, Class B* | | | 3,250 | | | | 692,802 | |
First American Financial | | | 7,575 | | | | 406,778 | |
Hanover Insurance Group | | | 3,900 | | | | 500,370 | |
Lancashire Holdings | | | 37,100 | | | | 324,389 | |
Mercury General | | | 6,700 | | | | 418,750 | |
ProAssurance | | | 5,900 | | | | 213,049 | |
| | | | | | | | 3,128,778 | |
| | | | | | | | | |
| Real Estate – 2.9% | | | | | | | | |
Four Corners Property Trust | | | 16,948 | | | | 463,189 | |
Howard Hughes* | | | 2,950 | | | | 365,328 | |
| | | | | | | | 828,517 | |
| | | | | | | | | |
| Reinsurance – 3.9% | | | | | | | | |
RenaissanceRe Holdings | | | 6,289 | | | | 1,119,505 | |
| Total Common Stocks | | | | | | | | |
| (Cost $15,952,110) | | | | | | | 21,914,990 | |
See Notes to the Financial Statements
PROSPECTOR FUNDS, INC.
Schedule of Investments (Unaudited) – Continued
June 30, 2019
Capital Appreciation Fund
Description | | Par | | | Value | |
| | | | | | | |
| CONVERTIBLE BONDS – 16.2% | | | | | | |
| | | | | | | |
| Communication Services – 2.2% | | | | | | |
Liberty Media | | | | | | |
2.125%, 03/31/2048 (a) | | $ | 636,300 | | | $ | 617,609 | |
| | | | | | | | | |
| Consumer Discretionary – 0.5% | | | | | | | | |
Booking Holdings | | | | | | | | |
0.900%, 09/15/2021 | | | 127,000 | | | | 145,275 | |
| | | | | | | | | |
| Industrials – 2.4% | | | | | | | | |
Chart Industries | | | | | | | | |
1.000%, 11/15/2024 (a) | | | 384,000 | | | | 546,042 | |
Kaman | | | | | | | | |
3.250%, 05/01/2024 | | | 127,000 | | | | 148,909 | |
| | | | | | | | 694,951 | |
| | | | | | | | | |
| Information Technology – 6.6% | | | | | | | | |
Akamai Technologies | | | | | | | | |
0.125%, 05/01/2025 | | | 639,000 | | | | 682,645 | |
Synaptics | | | | | | | | |
0.500%, 06/15/2022 | | | 368,500 | | | | 329,116 | |
Verint Systems | | | | | | | | |
1.500%, 06/01/2021 | | | 810,000 | | | | 867,979 | |
| | | | | | | | 1,879,740 | |
| | | | | | | | | |
| Materials – 1.6% | | | | | | | | |
RTI International | | | | | | | | |
1.625%, 10/15/2019 | | | 460,000 | | | | 464,681 | |
| | | | | | | | | |
| Real Estate – 2.9% | | | | | | | | |
Forestar Group | | | | | | | | |
3.750%, 03/01/2020 | | | 825,000 | | | | 819,956 | |
| Total Convertible Bonds | | | | | | | | |
| (Cost $4,414,220) | | | | | | | 4,622,212 | |
| | | | | | | | | |
| | | | | | | | | |
| CORPORATE BONDS – 4.2% | | | | | | | | |
| | | | | | | | | |
| Consumer Staples – 2.8% | | | | | | | | |
Campbell Soup | | | | | | | | |
3.650%, 03/15/2023 | | | 500,000 | | | | 514,759 | |
CVS Health | | | | | | | | |
2.250%, 08/12/2019 | | | 263,000 | | | | 262,901 | |
| | | | | | | | 777,660 | |
See Notes to the Financial Statements
PROSPECTOR FUNDS, INC.
Schedule of Investments (Unaudited) – Continued
June 30, 2019
Capital Appreciation Fund
Description | | Par | | | Value | |
| | | | | | | |
CORPORATE BONDS – 4.2% (Continued) | | | | | | |
| | | | | | | |
| Information Technology – 1.4% | | | | | | |
FLIR Systems | | | | | | |
3.125%, 06/15/2021 | | $ | 400,000 | | | $ | 403,911 | |
| Total Corporate Bonds | | | | | | | | |
| (Cost $1,183,895) | | | | | | | 1,181,571 | |
| | | | | | | | | |
| | | Shares | | | | | |
| SHORT-TERM INVESTMENT – 3.7% | | | | | | | | |
Invesco Treasury Portfolio, 2.232%^ | | | | | | | | |
| (Cost $1,066,044) | | | 1,066,044 | | | | 1,066,044 | |
| Total Investments – 100.9% | | | | | | | | |
| (Cost $22,616,269) | | | | | | | 28,784,817 | |
| Other Assets and Liabilities, Net – (0.9)% | | | | | | | (256,686 | ) |
| Total Net Assets – 100.0% | | | | | | $ | 28,528,131 | |
| * | Non-income producing security |
| (a) | Security purchased within the terms of a private placement memorandum, except from registration under Rule 144A of the Securities Act of 1933, as amended, and may be sold only to dealers in that program or other “qualified institutional buyers.” As of June 30, 2019, the value of this investment was $1,163,651 or 4.1% of total net assets. |
| ^ | The rate shown is the seven-day yield effective June 30, 2019. |
ADR – American Depositary Receipt
The industry classifications included in the Schedule of Investments are in accordance with the Global Industry Classification Standard (GICS®) was developed by and/or is the exclusive property of MSCI, Inc. and Standard & Poor Financial Services LLC (S&P). GICS is a service mark of MSCI and S&P and has been licensed for use by U.S. Bank Global Fund Services.
See Notes to the Financial Statements
PROSPECTOR FUNDS, INC.
Schedule of Investments (Unaudited)
June 30, 2019
Opportunity Fund
Description | | Shares | | | Value | |
| | | | | | | |
| COMMON STOCKS – 95.2% | | | | | | |
| | | | | | | |
| Banks – 15.7% | | | | | | |
Bank of N.T. Butterfield & Son | | | 47,200 | | | $ | 1,602,912 | |
Berkshire Hills Bancorp | | | 25,800 | | | | 809,862 | |
Central Pacific Financial | | | 57,900 | | | | 1,734,684 | |
Central Valley Community Bancorp | | | 31,200 | | | | 669,864 | |
Citigroup | | | 13,870 | | | | 971,316 | |
Comerica | | | 24,800 | | | | 1,801,472 | |
Dime Community Bancshares | | | 92,900 | | | | 1,764,171 | |
HarborOne Bancorp* | | | 31,800 | | | | 595,614 | |
HomeTrust Bancshares | | | 48,290 | | | | 1,214,011 | |
Kearny Financial | | | 201,226 | | | | 2,674,293 | |
KeyCorp | | | 136,500 | | | | 2,422,875 | |
OceanFirst Financial | | | 30,100 | | | | 747,985 | |
PCSB Financial | | | 70,800 | | | | 1,433,700 | |
Waterstone Financial | | | 78,000 | | | | 1,330,680 | |
Western New England Bancorp | | | 107,735 | | | | 1,006,245 | |
| | | | | | | | 20,779,684 | |
| | | | | | | | | |
| Consumer Discretionary – 7.7% | | | | | | | | |
Darden Restaurants | | | 7,000 | | | | 852,110 | |
eBay | | | 54,700 | | | | 2,160,650 | |
Home Depot | | | 10,200 | | | | 2,121,294 | |
Hyatt Hotels, Class A | | | 16,600 | | | | 1,263,758 | |
Noodles & Company* | | | 232,704 | | | | 1,833,707 | |
Ruth’s Hospitality Group | | | 52,800 | | | | 1,199,088 | |
William Hill | | | 426,200 | | | | 836,509 | |
| | | | | | | | 10,267,116 | |
| | | | | | | | | |
| Consumer Staples – 8.5% | | | | | | | | |
Carlsberg A/S, Class B | | | 6,100 | | | | 808,668 | |
Church & Dwight | | | 28,400 | | | | 2,074,904 | |
Colgate-Palmolive | | | 32,000 | | | | 2,293,440 | |
Mondelez International, Class A | | | 34,000 | | | | 1,832,600 | |
Nestle | | | 26,100 | | | | 2,701,973 | |
Tootsie Roll Industries | | | 40,468 | | | | 1,494,483 | |
| | | | | | | | 11,206,068 | |
| | | | | | | | | |
| Diversified Financial Services – 6.7% | | | | | | | | |
CBOE Global Markets | | | 10,500 | | | | 1,088,115 | |
E*TRADE Financial | | | 22,100 | | | | 985,660 | |
Federated Investors, Class B | | | 114,100 | | | | 3,708,250 | |
See Notes to the Financial Statements
PROSPECTOR FUNDS, INC.
Schedule of Investments (Unaudited) – Continued
June 30, 2019
Opportunity Fund
Description | | Shares | | | Value | |
| | | | | | | |
COMMON STOCKS – 95.2% (Continued) | | | | | | |
| | | | | | | |
Diversified Financial Services – 5.4% (Continued) | | | | | | |
Franklin Resources | | | 32,600 | | | $ | 1,134,480 | |
Invesco | | | 48,100 | | | | 984,126 | |
Jefferies Financial Group | | | 50,500 | | | | 971,115 | |
| | | | | | | | 8,871,746 | |
| | | | | | | | | |
| Energy – 3.1% | | | | | | | | |
Hess | | | 35,100 | | | | 2,231,307 | |
Noble Energy | | | 58,200 | | | | 1,303,680 | |
Schlumberger | | | 14,000 | | | | 556,360 | |
| | | | | | | | 4,091,347 | |
| | | | | | | | | |
| Healthcare – 4.4% | | | | | | | | |
AstraZeneca – ADR | | | 16,900 | | | | 697,632 | |
Medtronic | | | 14,000 | | | | 1,363,460 | |
Merck & Co. | | | 25,648 | | | | 2,150,585 | |
Patterson Companies | | | 73,150 | | | | 1,675,135 | |
| | | | | | | | 5,886,812 | |
| | | | | | | | | |
| Industrials – 5.7% | | | | | | | | |
CIRCOR International* | | | 21,000 | | | | 966,000 | |
Landstar System | | | 13,100 | | | | 1,414,669 | |
Moog | | | 7,600 | | | | 711,436 | |
Pentair | | | 18,100 | | | | 673,320 | |
Powell Industries | | | 51,983 | | | | 1,975,354 | |
Regal Beloit | | | 21,400 | | | | 1,748,594 | |
| | | | | | | | 7,489,373 | |
| | | | | | | | | |
| Information Technology – 9.7% | | | | | | | | |
FARO Technologies* | | | 33,700 | | | | 1,771,946 | |
FLIR Systems | | | 43,100 | | | | 2,331,710 | |
Leidos Holdings | | | 30,900 | | | | 2,467,365 | |
Maxim Integrated Products | | | 25,100 | | | | 1,501,482 | |
Microsoft | | | 14,900 | | | | 1,996,004 | |
Paychex | | | 24,450 | | | | 2,011,991 | |
Xilinx | | | 6,150 | | | | 725,208 | |
| | | | | | | | 12,805,706 | |
| | | | | | | | | |
| Insurance Brokers – 4.0% | | | | | | | | |
Brown & Brown | | | 158,950 | | | | 5,324,825 | |
See Notes to the Financial Statements
PROSPECTOR FUNDS, INC.
Schedule of Investments (Unaudited) – Continued
June 30, 2019
Opportunity Fund
Description | | Shares | | | Value | |
| | | | | | | |
COMMON STOCKS – 95.2% (Continued) | | | | | | |
| | | | | | | |
| Life & Health Insurance – 5.3% | | | | | | |
Aflac | | | 26,300 | | | $ | 1,441,503 | |
Primerica | | | 12,150 | | | | 1,457,392 | |
Torchmark | | | 46,000 | | | | 4,115,160 | |
| | | | | | | | 7,014,055 | |
| | | | | | | | | |
| Materials – 2.8% | | | | | | | | |
Domtar | | | 9,700 | | | | 431,941 | |
Kinross Gold* | | | 97,100 | | | | 376,748 | |
Newmont Mining | | | 70,200 | | | | 2,700,594 | |
Victoria Gold* | | | 887,800 | | | | 269,270 | |
| | | | | | | | 3,778,553 | |
| | | | | | | | | |
| Property & Casualty Insurance – 16.3% | | | | | | | | |
Axis Capital Holdings | | | 49,100 | | | | 2,928,815 | |
Cincinnati Financial | | | 20,850 | | | | 2,161,519 | |
Employers Holdings | | | 48,200 | | | | 2,037,414 | |
Hanover Insurance Group | | | 22,750 | | | | 2,918,825 | |
Lancashire Holdings | | | 236,500 | | | | 2,067,870 | |
Mercury General | | | 46,100 | | | | 2,881,250 | |
ProAssurance | | | 17,600 | | | | 635,536 | |
Safety Insurance Group | | | 14,850 | | | | 1,412,681 | |
Selective Insurance Group | | | 23,600 | | | | 1,767,404 | |
White Mountains Insurance Group | | | 2,681 | | | | 2,738,534 | |
| | | | | | | | 21,549,848 | |
| | | | | | | | | |
| Real Estate – 1.4% | | | | | | | | |
Cousins Properties | | | 32,723 | | | | 1,183,591 | |
Howard Hughes* | | | 5,900 | | | | 730,656 | |
| | | | | | | | 1,914,247 | |
| | | | | | | | | |
| Reinsurance – 3.9% | | | | | | | | |
RenaissanceRe Holdings | | | 28,950 | | | | 5,153,390 | |
| Total Common Stocks | | | | | | | | |
| (Cost $98,466,823) | | | | | | | 126,132,770 | |
| | | | | | | | | |
| | | Par | | | | | |
| | | | | | | | | |
| CONVERTIBLE BOND – 0.3% | | | | | | | | |
| | | | | | | | | |
| Real Estate – 0.3% | | | | | | | | |
Forestar Group | | | | | | | | |
3.750%, 03/01/2020 | | | | | | | | |
| (Cost $453,675) | | $ | 450,000 | | | | 447,248 | |
See Notes to the Financial Statements
PROSPECTOR FUNDS, INC.
Schedule of Investments (Unaudited) – Continued
June 30, 2019
Opportunity Fund
Description | | Shares | | | Value | |
| | | | | | | |
| SHORT-TERM INVESTMENT – 4.9% | | | | | | |
Invesco Treasury Portfolio, 2.232%^ | | | | | | |
| (Cost $6,483,630) | | | 6,483,630 | | | $ | 6,483,630 | |
| Total Investments – 100.4% | | | | | | | | |
| (Cost $105,404,128) | | | | | | | 133,063,648 | |
| Other Assets and Liabilities, Net – (0.4)% | | | | | | | (571,625 | ) |
| Total Net Assets – 100.0% | | | | | | $ | 132,492,023 | |
| * | Non-income producing security |
| ^ | The rate shown is the seven-day yield effective June 30, 2019. |
ADR – American Depositary Receipt
The industry classifications included in the Schedule of Investments are in accordance with the Global Industry Classification Standard (GICS®) was developed by and/or is the exclusive property of MSCI, Inc. and Standard & Poor Financial Services LLC (S&P). GICS is a service mark of MSCI and S&P and has been licensed for use by U.S. Bank Global Fund Services.
See Notes to the Financial Statements
PROSPECTOR FUNDS, INC.
Statements of Assets and Liabilities (Unaudited)
June 30, 2019
| | | Capital Appreciation Fund | | | Opportunity Fund | |
| ASSETS: | | | | | | |
| Investments, at market value | | | | | | |
| (Cost of $22,616,269 and $105,404,128, respectively) | | $ | 28,784,817 | | | $ | 133,063,648 | |
| Receivable for dividends and interest | | | 61,340 | | | | 162,561 | |
| Receivable for capital shares sold | | | – | | | | 401,172 | |
| Receivable for investments sold | | | 285,742 | | | | 51,344 | |
| Prepaid expenses | | | 12,528 | | | | 16,768 | |
| Total assets | | | 29,144,427 | | | | 133,695,493 | |
| | | | | | | | | |
| LIABILITIES: | | | | | | | | |
| Payable for capital shares redeemed | | | — | | | | 16,256 | |
| Payable for investments purchased | | | 557,614 | | | | 999,320 | |
| Payable to Adviser, net | | | 10,303 | | | | 95,192 | |
| Accrued distribution fees | | | 779 | | | | 17,049 | |
| Accrued expenses and other liabilities | | | 47,600 | | | | 75,653 | |
| Total liabilities | | | 616,296 | | | | 1,203,470 | |
| | | | | | | | | |
| NET ASSETS | | $ | 28,528,131 | | | $ | 132,492,023 | |
| | | | | | | | | |
| COMPOSITION OF NET ASSETS: | | | | | | | | |
| Portfolio capital | | $ | 21,509,536 | | | $ | 100,733,477 | |
| Total distributable earnings | | | 7,018,595 | | | | 31,758,546 | |
| Total net assets | | $ | 28,528,131 | | | $ | 132,492,023 | |
| | | | | | | | | |
CAPITAL STOCK, $0.001 par value | | | | | | | | |
| Authorized | | | 500,000,000 | | | | 500,000,000 | |
| Issued and outstanding | | | 1,500,026 | | | | 6,017,428 | |
| | | | | | | | | |
| NET ASSET VALUE, REDEMPTION PRICE, | | | | | | | | |
| AND OFFERING PRICE PER SHARE | | $ | 19.02 | | | $ | 22.02 | |
See Notes to the Financial Statements
PROSPECTOR FUNDS, INC.
Statements of Operations (Unaudited)
For the Six Months Ended June 30, 2019
| | | Capital Appreciation Fund | | | Opportunity Fund | |
| INVESTMENT INCOME: | | | | | | |
Interest income | | $ | 51,587 | | | $ | 71,922 | |
Dividend income | | | 246,330 | | | | 1,573,389 | |
Less: Foreign taxes withheld | | | (3,893 | ) | | | (12,585 | ) |
Total investment income | | | 294,024 | | | | 1,632,726 | |
| | | | | | | | | |
| EXPENSES: | | | | | | | | |
Investment advisory fees | | | 149,615 | | | | 681,384 | |
Administration fees | | | 25,452 | | | | 62,735 | |
Audit & tax fees | | | 23,007 | | | | 23,007 | |
Fund accounting fees | | | 20,377 | | | | 23,199 | |
Transfer agent fees | | | 12,849 | | | | 26,144 | |
Registration fees | | | 11,819 | | | | 13,904 | |
Distribution fees | | | 6,212 | | | | 44,060 | |
Directors’ fees | | | 5,892 | | | | 24,803 | |
Legal fees | | | 5,584 | | | | 25,326 | |
Custodian fees | | | 2,983 | | | | 4,673 | |
Other expenses | | | 2,707 | | | | 10,852 | |
Postage and printing fees | | | 1,637 | | | | 7,274 | |
Total expenses | | | 268,134 | | | | 947,361 | |
Less: Fee waivers | | | (91,316 | ) | | | (142,089 | ) |
Total net expenses | | | 176,818 | | | | 805,272 | |
| NET INVESTMENT INCOME | | | 117,206 | | | | 827,454 | |
| | | | | | | | | |
| REALIZED AND UNREALIZED GAINS: | | | | | | | | |
Net realized gain on investments | | | 861,126 | | | | 3,005,580 | |
Net change in unrealized | | | | | | | | |
appreciation/depreciation of investments | | | 3,118,423 | | | | 17,806,678 | |
Net gain on investments | | | 3,979,549 | | | | 20,812,258 | |
| NET INCREASE IN NET ASSETS | | | | | | | | |
| RESULTING FROM OPERATIONS | | $ | 4,096,755 | | | $ | 21,639,712 | |
See Notes to the Financial Statements
PROSPECTOR FUNDS, INC.
Statements of Changes in Net Assets
| | | Capital Appreciation Fund | |
| | | Six Months Ended | | | | |
| | | June 30, 2019 | | | Year Ended | |
| | | (Unaudited) | | | December 31, 2018 | |
| OPERATIONS: | | | | | | |
Net investment income | | $ | 117,206 | | | $ | 180,678 | |
Net realized gain on investments | | | 861,126 | | | | 794,617 | |
Net change in unrealized appreciation/ | | | | | | | | |
depreciation of investments | | | 3,118,423 | | | | (1,752,060 | ) |
Net increase (decrease) resulting from operations | | | 4,096,755 | | | | (776,765 | ) |
| | | | | | | | | |
| CAPITAL SHARE TRANSACTIONS: | | | | | | | | |
Proceeds from shares sold | | | 69,925 | | | | 85,822 | |
Proceeds from reinvestment of distributions | | | — | | | | 1,050,298 | |
Payments for shares redeemed | | | (817,962 | ) | | | (848,281 | ) |
Net increase (decrease) from capital share transactions | | | (748,037 | ) | | | 287,839 | |
| | | | | | | | | |
| DISTRIBUTIONS PAID TO SHAREHOLDERS | | | — | | | | (1,096,660 | ) |
| | | | | | | | | |
| TOTAL INCREASE (DECREASE) IN NET ASSETS | | | 3,348,718 | | | | (1,585,586 | ) |
| | | | | | | | | |
| NET ASSETS: | | | | | | | | |
Beginning of period | | | 25,179,413 | | | | 26,764,999 | |
End of period | | $ | 28,528,131 | | | $ | 25,179,413 | |
| | | | | | | | | |
| TRANSACTIONS IN SHARES: | | | | | | | | |
Shares sold | | | 4,107 | | | | 4,959 | |
Shares issued in reinvestment of distributions | | | — | | | | 64,753 | |
Shares redeemed | | | (45,353 | ) | | | (46,542 | ) |
Net increase (decrease) | | | (41,246 | ) | | | 23,170 | |
See Notes to the Financial Statements
PROSPECTOR FUNDS, INC.
Statements of Changes in Net Assets
| | | Opportunity Fund | |
| | | Six Months Ended | | | | |
| | | June 30, 2019 | | | Year Ended | |
| | | (Unaudited) | | | December 31, 2018 | |
| OPERATIONS: | | | | | | |
Net investment income | | $ | 827,454 | | | $ | 1,119,160 | |
Net realized gain on investments | | | 3,005,580 | | | | 7,722,717 | |
Net change in unrealized appreciation/ | | | | | | | | |
depreciation of investments | | | 17,806,678 | | | | (14,581,541 | ) |
Net increase (decrease) resulting from operations | | | 21,639,712 | | | | (5,739,664 | ) |
| | | | | | | | | |
| CAPITAL SHARE TRANSACTIONS: | | | | | | | | |
Proceeds from shares sold | | | 7,425,055 | | | | 20,253,107 | |
Proceeds from reinvestment of distributions | | | — | | | | 7,888,798 | |
Payments for shares redeemed | | | (10,825,054 | ) | | | (16,227,515 | ) |
Redemption fees | | | 1,253 | | | | 4,959 | |
Net increase (decrease) from capital share transactions | | | (3,398,746 | ) | | | 11,919,349 | |
| | | | | | | | | |
| DISTRIBUTIONS PAID TO SHAREHOLDERS | | | — | | | | (8,537,974 | ) |
| | | | | | | | | |
| TOTAL INCREASE (DECREASE) IN NET ASSETS | | | 18,240,966 | | | | (2,358,289 | ) |
| | | | | | | | | |
| NET ASSETS: | | | | | | | | |
Beginning of period | | | 114,251,057 | | | | 116,609,346 | |
End of period | | $ | 132,492,023 | | | $ | 114,251,057 | |
| | | | | | | | | |
| TRANSACTIONS IN SHARES: | | | | | | | | |
Shares sold | | | 360,317 | | | | 958,762 | |
Shares issued in reinvestment of distributions | | | — | | | | 430,611 | |
Shares redeemed | | | (528,835 | ) | | | (796,796 | ) |
Net increase (decrease) | | | (168,518 | ) | | | 592,577 | |
See Notes to the Financial Statements
PROSPECTOR FUNDS, INC.
Financial Highlights
| | | Capital Appreciation Fund | |
| | | Six Months | | | | | | | | | | | | | | | | |
| | | Ended | | | | | | | | | | | | | | | | |
| | | June 30, | | | | | | | | | | | | | | | | |
| | | 2019 | | | Year Ended December 31, | |
| | | (Unaudited) | | | 2018 | | | 2017 | | | 2016 | | | 2015 | | | 2014 | |
For a Fund share outstanding | | | | | | | | | | | | | | | | | | |
throughout the period | | | | | | | | | | | | | | | | | | |
| | | | | | | | | | | | | | | | | | | |
| NET ASSET VALUE: | | | | | | | | | | | | | | | | | | |
Beginning of period | | $ | 16.34 | | | $ | 17.63 | | | $ | 16.80 | | | $ | 14.84 | | | $ | 15.61 | | | $ | 17.11 | |
| | | | | | | | | | | | | | | | | | | | | | | | | |
| OPERATIONS: | | | | | | | | | | | | | | | | | | | | | | | | |
Net investment income | | | 0.08 | | | | 0.12 | | | | 0.09 | | | | 0.22 | | | | 0.21 | | | | 0.11 | |
Net realized and unrealized | | | | | | | | | | | | | | | | | | | | | | | | |
gain (loss) on investments | | | 2.60 | | | | (0.67 | ) | | | 1.82 | | | | 1.96 | | | | (0.60 | ) | | | 0.63 | |
Total from operations | | | 2.68 | | | | (0.55 | ) | | | 1.91 | | | | 2.18 | | | | (0.39 | ) | | | 0.74 | |
| | | | | | | | | | | | | | | | | | | | | | | | | |
| LESS DISTRIBUTIONS: | | | | | | | | | | | | | | | | | | | | | | | | |
From net investment income | | | — | | | | (0.12 | ) | | | (0.09 | ) | | | (0.22 | ) | | | (0.37 | ) | | | (0.27 | ) |
From net realized gains | | | — | | | | (0.62 | ) | | | (0.99 | ) | | | — | | | | (0.01 | ) | | | (1.97 | ) |
Total distributions | | | — | | | | (0.74 | ) | | | (1.08 | ) | | | (0.22 | ) | | | (0.38 | ) | | | (2.24 | ) |
| | | | | | | | | | | | | | | | | | | | | | | | | |
| NET ASSET VALUE: | | | | | | | | | | | | | | | | | | | | | | | | |
End of period | | $ | 19.02 | | | $ | 16.34 | | | $ | 17.63 | | | $ | 16.80 | | | $ | 14.84 | | | $ | 15.61 | |
| | | | | | | | | | | | | | | | | | | | | | | | | |
TOTAL RETURN(1) | | | 16.40 | % | | | (3.07 | )% | | | 11.38 | % | | | 14.68 | % | | | (2.52 | )% | | | 4.18 | % |
| | | | | | | | | | | | | | | | | | | | | | | | | |
| SUPPLEMENTAL DATA AND RATIOS: | | | | | | | | | | | | | | | | | | | | | | | | |
Net assets, end of period (in thousands) | | $ | 28,528 | | | $ | 25,179 | | | $ | 26,765 | | | $ | 25,663 | | | $ | 24,328 | | | $ | 38,398 | |
Ratio of expenses to average net assets: | | | | | | | | | | | | | | | | | | | | | | | | |
Before expense reimbursement(2) | | | 1.97 | % | | | 1.97 | % | | | 2.02 | % | | | 2.06 | % | | | 1.88 | % | | | 1.74 | % |
After expense reimbursement(2) | | | 1.30 | % | | | 1.30 | % | | | 1.30 | % | | | 1.30 | % | | | 1.30 | % | | | 1.30 | % |
Ratio of net investment income (loss) | | | | | | | | | | | | | | | | | | | | | | | | |
to average net assets: | | | | | | | | | | | | | | | | | | | | | | | | |
Before expense reimbursement(2) | | | 0.19 | % | | | (0.00 | )% | | | (0.23 | )% | | | 0.58 | % | | | 0.47 | % | | | 0.05 | % |
After expense reimbursement(2) | | | 0.86 | % | | | 0.67 | % | | | 0.49 | % | | | 1.34 | % | | | 1.05 | % | | | 0.49 | % |
Portfolio turnover rate(1) | | | 11 | % | | | 28 | % | | | 23 | % | | | 32 | % | | | 35 | % | | | 48 | % |
(1) | Not annualized for periods less than one year. |
(2) | Annualized for periods less than one year. |
See Notes to the Financial Statements
PROSPECTOR FUNDS, INC.
Financial Highlights
| | | Opportunity Fund | |
| | | Six Months | | | | | | | | | | | | | | | | |
| | | Ended | | | | | | | | | | | | | | | | |
| | | June 30, | | | | | | | | | | | | | | | | |
| | | 2019 | | | Year Ended December 31, | |
| | | (Unaudited) | | | 2018 | | | 2017 | | | 2016 | | | 2015 | | | 2014 | |
For a Fund share outstanding | | | | | | | | | | | | | | | | | | |
throughout the period | | | | | | | | | | | | | | | | | | |
| | | | | | | | | | | | | | | | | | | |
| NET ASSET VALUE: | | | | | | | | | | | | | | | | | | |
Beginning of period | | $ | 18.47 | | | $ | 20.85 | | | $ | 20.17 | | | $ | 17.29 | | | $ | 20.75 | | | $ | 21.51 | |
| | | | | | | | | | | | | | | | | | | | | | | | | |
| OPERATIONS: | | | | | | | | | | | | | | | | | | | | | | | | |
Net investment income | | | 0.14 | | | | 0.19 | | | | 0.11 | | | | 0.13 | | | | 0.14 | | | | 0.13 | |
Net realized and unrealized | | | | | | | | | | | | | | | | | | | | | | | | |
gain (loss) on investments | | | 3.41 | | | | (1.11 | ) | | | 1.98 | | | | 3.50 | | | | 0.18 | | | | 1.48 | |
Total from operations | | | 3.55 | | | | (0.92 | ) | | | 2.09 | | | | 3.63 | | | | 0.32 | | | | 1.61 | |
| | | | | | | | | | | | | | | | | | | | | | | | | |
| LESS DISTRIBUTIONS: | | | | | | | | | | | | | | | | | | | | | | | | |
From net investment income | | | — | | | | (0.19 | ) | | | (0.10 | ) | | | (0.22 | ) | | | (0.17 | ) | | | (0.16 | ) |
From net realized gains | | | — | | | | (1.27 | ) | | | (1.31 | ) | | | (0.53 | ) | | | (3.61 | ) | | | (2.21 | ) |
Total distributions | | | — | | | | (1.46 | ) | | | (1.41 | ) | | | (0.75 | ) | | | (3.78 | ) | | | (2.37 | ) |
| | | | | | | | | | | | | | | | | | | | | | | | | |
| NET ASSET VALUE: | | | | | | | | | | | | | | | | | | | | | | | | |
End of period | | $ | 22.02 | | | $ | 18.47 | | | $ | 20.85 | | | $ | 20.17 | | | $ | 17.29 | | | $ | 20.75 | |
| | | | | | | | | | | | | | | | | | | | | | | | | |
TOTAL RETURN(1) | | | 19.22 | % | | | (4.38 | )% | | | 10.33 | % | | | 21.02 | % | | | 1.33 | % | | | 7.36 | % |
| | | | | | | | | | | | | | | | | | | | | | | | | |
| SUPPLEMENTAL DATA AND RATIOS: | | | | | | | | | | | | | | | | | | | | | | | | |
Net assets, end of period (in thousands) | | $ | 132,492 | | | $ | 114,251 | | | $ | 116,609 | | | $ | 106,542 | | | $ | 86,128 | | | $ | 91,448 | |
Ratio of expenses to average net assets: | | | | | | | | | | | | | | | | | | | | | | | | |
Before expense reimbursement(2) | | | 1.53 | % | | | 1.53 | % | | | 1.58 | % | | | 1.59 | % | | | 1.61 | % | | | 1.53 | % |
After expense reimbursement(2) | | | 1.30 | % | | | 1.30 | % | | | 1.30 | % | | | 1.30 | % | | | 1.30 | % | | | 1.30 | % |
Ratio of net investment income | | | | | | | | | | | | | | | | | | | | | | | | |
to average net assets: | | | | | | | | | | | | | | | | | | | | | | | | |
Before expense reimbursement(2) | | | 1.11 | % | | | 0.66 | % | | | 0.23 | % | | | 0.41 | % | | | 0.28 | % | | | 0.23 | % |
After expense reimbursement(2) | | | 1.34 | % | | | 0.89 | % | | | 0.51 | % | | | 0.70 | % | | | 0.59 | % | | | 0.46 | % |
Portfolio turnover rate(1) | | | 11 | % | | | 39 | % | | | 26 | % | | | 42 | % | | | 36 | % | | | 40 | % |
(1) | Not annualized for periods less than one year. |
(2) | Annualized for periods less than one year. |
See Notes to the Financial Statements
PROSPECTOR FUNDS, INC.
Notes to the Financial Statements (Unaudited)
June 30, 2019
1. ORGANIZATION
Prospector Funds, Inc. (the “Corporation”) was organized as a Maryland corporation on June 6, 2007 and is registered under the Investment Company Act of 1940 (the “1940 Act”), as amended, as an open-end diversified management investment company. The Corporation issues its shares in series, each series representing a distinct portfolio with its own investment objectives and policies. There are two series presently authorized, the Prospector Capital Appreciation Fund and the Prospector Opportunity Fund (individually a “Fund” and collectively the “Funds”). Each Fund is an investment company and accordingly follows the investment company accounting and reporting guidance of the Financial Accounting Standards Board (“FASB”) Accounting Standard Board Codification Topic 946 Financial Services – Investment Companies. The Funds commenced operations on September 28, 2007.
2. FAIR VALUE MEASUREMENT
The following is a summary of significant accounting policies consistently followed by each Fund:
Security Valuation – The Fund has adopted fair value accounting standards which establish an authoritative definition of fair value and set out a hierarchy for measuring fair value. These standards require additional disclosures about the various inputs and valuation techniques used to develop the measurements of fair value, a discussion in changes in valuation techniques and related inputs during the period and expanded disclosure of valuation levels for major security types. These inputs are summarized in the three broad levels listed below:
| Level 1 – | Unadjusted quoted prices in active markets for identical assets or liabilities that the Fund has the ability to access. |
| | |
| Level 2 – | Observable inputs other than quoted prices included in Level 1 that are observable for the asset or liability, either directly or indirectly. These inputs may include quoted prices for the identical instrument on an inactive market, prices for similar instruments, interest rates, prepayment speeds, credit risk, yield curves, default rates, discounts and similar data. |
| | |
| Level 3 – | Unobservable inputs for the asset or liability, to the extent relevant observable inputs are not available, representing the Fund’s own assumptions about the assumptions a market participant would use in valuing the asset or liability, and would be based on the best information available. |
Following is a description of the valuation techniques applied to the Fund’s major categories of assets and liabilities measured at fair value on a recurring basis. The Fund’s investments are carried at fair value.
Common Stock – Securities that are primarily traded on a national securities exchange are valued at the last sale price on the exchange on which they are primarily traded on the day of valuation or, if there has been no sale on such day, at the last bid price on the day of valuation. To the extent these securities are actively traded and valuation adjustments are not applied, they are categorized in Level 1 of the fair value hierarchy.
Convertible and Corporate Bonds – Convertible and corporate bonds, including listed issues, are valued at fair value on the basis of valuations furnished by an independent pricing service which utilizes both dealer-supplied valuations and formula-based techniques. The pricing service may consider recently executed transactions in securities of the issuer or comparable issuers, market price quotations (where observable), bond spreads, and fundamental data relating to the issuer. Convertible and corporate bonds are generally categorized in Level 2 of the fair value hierarchy.
PROSPECTOR FUNDS, INC.
Notes to the Financial Statements (Unaudited) – Continued
June 30, 2019
Investment Companies – Investments in other mutual funds, including money market funds, are valued at their net asset value per share. To the extent these securities are actively traded and valuation adjustments are not applied, they are categorized in Level 1 of the fair value hierarchy.
Securities for which market quotations are not readily available, or if the closing price does not represent fair value, are valued following procedures approved by the Funds’ board of directors. These procedures consider many factors, including the type of security, size of holding, trading volume and news events. There can be no assurance that the Fund could obtain the fair value assigned to a security if they were to sell the security at approximately the time at which the Fund determines their net asset values per share.
The inputs or methodology used for valuing securities are not an indication of the risk associated with investing in those securities.
As of June 30, 2019, each Fund’s investments in securities were classified as follows:
| | | Level 1 | | | Level 2 | | | Level 3 | | | Total | |
| | | | | | | | | | | | | |
| Capital Appreciation Fund | | | | | | | | | | | | |
| Common Stocks | | $ | 21,914,990 | | | $ | — | | | $ | — | | | $ | 21,914,990 | |
| Convertible Bonds | | | — | | | | 4,622,212 | | | | — | | | | 4,622,212 | |
| Corporate Bonds | | | — | | | | 1,181,571 | | | | — | | | | 1,181,571 | |
| Short-Term Investment | | | 1,066,044 | | | | — | | | | — | | | | 1,066,044 | |
| Total Investments | | $ | 22,981,034 | | | $ | 5,803,783 | | | $ | — | | | $ | 28,784,817 | |
| | | | | | | | | | | | | |
| | | Level 1 | | | Level 2 | | | Level 3 | | | Total | |
| | | | | | | | | | | | | | | | | |
| Opportunity Fund | | | | | | | | | | | | | | | | |
| Common Stocks | | $ | 126,132,770 | | | $ | — | | | $ | — | | | $ | 126,132,770 | |
| Convertible Bond | | | — | | | | 447,248 | | | | — | | | | 447,248 | |
| Short-Term Investment | | | 6,483,630 | | | | — | | | | — | | | | 6,483,630 | |
| Total Investments | | $ | 132,616,400 | | | $ | 447,248 | | | $ | — | | | $ | 133,063,648 | |
Refer to each Fund’s Schedule of Investments for further sector breakout.
The Funds may invest in derivative financial instruments in order to manage risk or gain exposure to various other investments or markets. The Funds’ investment objectives allow the Funds to enter into various types of derivative contracts, including, but not limited to, futures contracts, forward foreign exchange contracts, and purchased and written options. Derivatives may contain various risks including the potential inability of the counterparty to fulfill their obligations under the terms of the contract, the potential for an illiquid secondary market, and the potential for market movements which may expose the funds to gains or losses in excess of the amounts shown on the Statements of Assets and Liabilities. As of and for the six months ended June 30, 2019, the Funds held no derivative instruments.
3. SIGNIFICANT ACCOUNTING POLICIES
Distributions to Shareholders – Dividends from net investment income and distributions of net realized capital gains, if any, will be declared and paid at least annually. The character of distributions made during the period from net investment income or net realized gains may differ from the characterization for federal income tax purposes due to differences in the recognition of income, expense and gain items for financial statement and tax purposes. All short-term capital gains are included in ordinary income for tax purposes.
PROSPECTOR FUNDS, INC.
Notes to the Financial Statements (Unaudited) – Continued
June 30, 2019
Use of Estimates – The preparation of financial statements in conformity with accounting principles generally accepted in the United States of America (“U.S. GAAP”) requires management to make estimates and assumptions that affect the reported amounts of assets and liabilities and disclosure of contingent assets and liabilities at the date of the financial statements and the reported amounts of revenues and expenses during the reporting period. Actual results could differ from those estimates.
Federal Income Taxes – The Funds intend to meet the requirements of subchapter M of the Internal Revenue Code applicable to regulated investment companies and to distribute substantially all net taxable investment income and net realized gains to shareholders in a manner which results in no tax cost to the Funds. Therefore, no federal income or excise tax provision is required. As of December 31, 2018, the Funds did not have any tax positions that did not meet the “more-likely-than-not” threshold of being sustained by the applicable tax authority. Generally, each of the tax years in the four-year period ended December 31, 2018 remains subject to examination by taxing authorities.
Foreign Currency Translation – The books and records relating to the Funds’ non-U.S. dollar denominated investments are maintained in U.S. dollars on the following bases: (1) market value of investment securities, assets, and liabilities are translated at the current rate of exchange; and (2) purchases and sales of investment securities, income, and expenses are translated at the relevant rates of exchange prevailing on the respective dates of such transactions. The Funds do not isolate the portion of gains and losses on investments in equity securities that is due to changes in the foreign exchange rates from that which is due to changes in market prices of equity securities. The Funds report certain foreign currency-related transactions as components of realized gains for financial reporting purposes, whereas such components are treated as ordinary income for federal income tax purposes.
Illiquid or Restricted Securities – A security may be considered illiquid if it lacks a readily available market. Securities are generally considered liquid if they can be sold or disposed of in the ordinary course of business within seven days at approximately the price at which the security is valued by the Fund. Illiquid securities may be valued under methods approved by the Funds’ board of directors as reflecting fair value. Each Fund intends to invest no more than 15% of its total assets in illiquid securities. Certain restricted securities may be considered illiquid. Restricted securities are often purchased in private placement transactions, are not registered under the Securities Act of 1933, may have contractual restrictions on resale, and may be valued under methods approved by the Funds’ board of directors as reflecting fair value. Certain restricted securities eligible for resale to qualified institutional investors, including Rule 144A securities, are not subject to the limitation on a Fund’s investment in illiquid securities if they are determined to be liquid in accordance with procedures adopted by the Funds’ board of directors. At June 30, 2019, the Funds had no investments in illiquid securities.
Expenses – Expenses directly attributable to a Fund are charged to that Fund, while expenses attributable to more than one Fund are allocated among the respective Funds based on relative net assets or another appropriate basis.
Other – Investment and shareholder transactions are recorded on the trade date. Each Fund determines the gain or loss realized from the investment transactions on the basis of identified cost. Dividend income is recognized on the ex-dividend date. Interest income, including amortization of bond premium and discount, is recognized on an accrual basis.
Subsequent Events – Management of the Funds has evaluated fund related events and transactions that occurred subsequent to June 30, 2019, through the date of issuance of the Funds’ financial statements. There were no events or transactions that occurred during this period that materially impacted the amounts or disclosures in the Funds’ financial statements.
PROSPECTOR FUNDS, INC.
Notes to the Financial Statements (Unaudited) – Continued
June 30, 2019
4. INVESTMENT TRANSACTIONS, DISTRIBUTABLE EARNINGS, AND DISTRIBUTIONS PAID
During the six months ended June 30, 2019, purchases of securities and proceeds from sales of securities, other than temporary investments in short-term securities, were as follows:
| | | Purchases | | | Sales | |
| | | | | | | | | |
Capital Appreciation Fund | | $ | 2,993,236 | | | $ | 3,819,040 | |
Opportunity Fund | | | 12,878,134 | | | | 16,508,838 | |
There were no purchases or sales of long-term U.S. Government securities.
The aggregate gross unrealized appreciation and depreciation of securities held by the Funds and the total cost of securities for federal income tax purposes at December 31, 2018, the Funds’ most recently completed fiscal year end, were as follows:
| | | Aggregate | | | Aggregate | | | Net | | | Federal | |
| | | Gross | | | Gross | | | Appreciation/ | | | Income | |
| | | Appreciation | | | Depreciation | | | (Depreciation) | | | Tax Cost | |
| | | | | | | | | | | | | | | | | |
Capital Appreciation Fund | | $ | 3,849,596 | | | $ | (886,928 | ) | | $ | 2,962,668 | | | $ | 22,227,525 | |
Opportunity Fund | | | 18,147,000 | | | | (8,303,264 | ) | | | 9,843,736 | | | | 105,098,829 | |
The difference between book-basis and tax-basis unrealized appreciation is attributable primarily to wash sales and different book and tax accounting methods for certain securities.
At December 31, 2018, the components of accumulated earnings (deficit) on a tax-basis were as follows:
| | | Undistributed | | | Undistributed | | | Other | | | | | | Total | |
| | | Ordinary | | | Long-Term | | | Accumulated | | | Unrealized | | | Distributable | |
| | | Income | | | Capital Gains | | | Losses | | | Appreciation | | | Earnings | |
| | | | | | | | | | | | | | | | | | | | | |
Capital Appreciation Fund | | $ | — | | | $ | — | | | $ | (40,828 | ) | | $ | 2,962,668 | | | $ | 2,921,840 | |
Opportunity Fund | | | 48,717 | | | | 230,800 | | | | (4,419 | ) | | | 9,843,736 | | | | 10,118,834 | |
As of December 31, 2018, the Funds did not have any capital loss carryovers. A regulated investment company may elect for any taxable year to treat any portion of any qualified late year loss as arising on the first day of the next taxable year. Qualified late year losses are certain capital, and ordinary losses which occur during the portion of the Fund’s taxable year subsequent to October 31. The Capital Appreciation Fund plans to defer, on a tax basis, late year losses of $35,346. The Opportunity Fund did not defer any late year losses.
The tax character of distributions paid during the fiscal year ended December 31, 2018 were as follows:
| | | Ordinary | | | Long Term | | | | |
| | | Income* | | | Capital Gains** | | | Total | |
| | | | | | | | | | | | | |
Capital Appreciation Fund | | $ | 229,872 | | | $ | 866,788 | | | $ | 1,096,660 | |
Opportunity Fund | | | 1,257,291 | | | | 7,280,683 | | | | 8,537,974 | |
| * | | For federal income tax purposes, distributions of short-term capital gains are included in ordinary income distributions. |
| ** | | Funds designate long-term capital gain dividends pursuant to IRC Sec. 852(b)(3)(C). |
PROSPECTOR FUNDS, INC.
Notes to the Financial Statements (Unaudited) – Continued
June 30, 2019
5. AGREEMENTS
The Funds have entered into an Investment Advisory Agreement with Prospector Partners Asset Management, LLC (the “Adviser”), with whom certain directors and officers of the Corporation are affiliated, to furnish investment advisory services to the Funds. Pursuant to this Agreement, the Adviser is entitled to receive a management fee, calculated daily and payable monthly, at the annual rate of 1.10% as applied to each Fund’s daily net assets.
The Adviser has contractually agreed to waive its management fee and reimburse each Fund’s other expenses to the extent necessary to ensure that each Fund’s operating expenses do not exceed 1.30% of its average daily net assets. Fees waived and expenses reimbursed by the Adviser may be recouped by the Adviser for a period of three fiscal years following the fiscal year during which such waiver or reimbursement was made if such recoupment can be achieved without exceeding the expense limit in effect at the time the waiver or reimbursement occurred. As of June 30, 2019, the Adviser did not recoup any previously waived fees or reimbursed expenses. The Fee Waiver and Expense Limitation Agreement will be in effect through at least September 30, 2020. Waived fees and reimbursed expenses subject to potential recovery by year of expiration are as follows:
| Expiration | | Capital Appreciation Fund | | | Opportunity Fund | |
| | | | | | | |
12/31/19 | | $ | 184,289 | | | $ | 270,491 | |
12/31/20 | | | 186,958 | | | | 302,782 | |
12/31/21 | | | 182,097 | | | | 286,686 | |
12/31/22 | | | 91,316 | | | | 142,089 | |
Total | | $ | 644,660 | | | $ | 1,002,048 | |
As of June 30, 2019, it was possible, but not probable, those amounts would be recovered by the Adviser. At the end of each fiscal year in the future, the Funds will continue to assess the potential recovery of waived/reimbursed fees and expenses for financial reporting purposes.
Quasar Distributors, LLC (“Quasar”), a subsidiary of U.S. Bancorp, serves as distributor of the Funds’ shares pursuant to a Distribution Agreement with the Corporation. Each Fund’s shares are sold on a no-load basis and, therefore, Quasar receives no sales commission or sales load for providing services to the Funds. The Corporation has adopted a plan pursuant to Rule 12b-1 under the 1940 Act (the “12b-1 Plan”), which authorizes the Corporation to reimburse Quasar and certain financial intermediaries who assist in distributing each Fund’s shares or who provide shareholder services to Fund shareholders a distribution and/or shareholder servicing fee of up to 0.25% of each Fund’s average daily net assets (computed on an annual basis). All or a portion of the fee may be used by the Funds or Quasar to pay the Fund’s distribution fees and costs of printing reports and prospectuses for potential investors and the costs of other distribution and shareholder services expenses. During the six months ended June 30, 2019, Capital Appreciation Fund and Opportunity Fund incurred expenses of $6,212 and $44,060 respectively, pursuant to the 12b-1 Plan.
U.S. Bancorp Fund Services, LLC, doing business as U.S. Bank Global Fund Services serves as transfer agent, administrator and fund accountant for the Funds. U.S. Bank N.A. serves as custodian for the Funds.
6. INDEMNIFICATIONS
The Funds enter into contracts that contain a variety of indemnifications. The Funds’ maximum exposure under these arrangements is unknown. However, the Funds have not had prior claims or losses pursuant to these contracts and expect the risk of loss to be remote.
PROSPECTOR FUNDS, INC.
Additional Information (Unaudited)
June 30, 2019
AVAILABILITY OF FUND PORTFOLIO INFORMATION
The Funds file complete schedules of portfolio holdings with the SEC for the first and third quarters of each fiscal year on Form N-Q, which is available on the SEC’s website at www.sec.gov. The Funds’ Form N-Q may be reviewed and copied at the SEC’s Public Reference Room in Washington, D.C. For information on the Public Reference Room call 1-800-SEC-0330. In addition, the Funds’ Form N-Q is available without charge upon request by calling 1-877-734-7862.
AVAILABILITY OF PROXY VOTING INFORMATION
A description of the Funds’ Proxy Voting Policies and Procedures is available without charge, upon request, by calling 1-877-734-7862. Information regarding how the Funds voted proxies relating to portfolio securities during the most recent 12 month period ended June 30, is available (1) without charge, upon request, by calling 1-877-734-7862, or (2) on the SEC’s website at www.sec.gov.
(This Page Intentionally Left Blank.)
DIRECTORS
John D. Gillespie
Harvey D. Hirsch
Joseph Klein III
Roy L. Nersesian
John T. Rossello, Jr.
INVESTMENT ADVISER
Prospector Partners Asset Management, LLC
370 Church Street
Guilford, CT 06437
DISTRIBUTOR
Quasar Distributors, LLC
777 East Wisconsin Avenue
Milwaukee, WI 53202
CUSTODIAN
U.S. Bank, N.A.
1555 North River Center Drive
Milwaukee, WI 53212
ADMINISTRATOR AND TRANSFER AGENT
U.S. Bancorp Fund Services, LLC
Third Floor
615 East Michigan Street
Milwaukee, WI 53202
INDEPENDENT REGISTERED PUBLIC ACCOUNTING FIRM
Ernst & Young LLP
220 South Sixth Street, Suite 1400
Minneapolis, MN 55402
LEGAL COUNSEL
Seward & Kissel LLP
One Battery Plaza
New York, NY 10004
This report should be accompanied or preceded by a prospectus.
The Funds’ Statement of Additional Information contains additional information about the
Funds’ directors and is available without charge upon request by calling 1-877-734-7862.
Item 2. Code of Ethics.
Not applicable for semi-annual reports.
Item 3. Audit Committee Financial Expert.
Not applicable for semi-annual reports.
Item 4. Principal Accountant Fees and Services.
Not applicable for semi-annual reports.
Item 5. Audit Committee of Listed Registrants.
Not applicable to registrants who are not listed issuers (as defined in Rule 10A-3 under the Securities Exchange Act of 1934).
Item 6. Schedule of Investments.
Schedule of Investments is included as part of the report to shareholders filed under Item 1 of this Form.
Item 7. Disclosure of Proxy Voting Policies and Procedures for Closed-End Management Investment Companies.
Not applicable to open-end investment companies.
Item 8. Portfolio Managers of Closed-End Management Investment Companies.
Not applicable to open-end investment companies.
Item 9. Purchases of Equity Securities by Closed‑End Management Investment Company and Affiliated Purchases.
Not applicable to open-end investment companies.
Item 10. Submission of Matters to a Vote of Security Holders.
Not Applicable.
Item 11. Controls and Procedures.
(a) | The Registrant’s President and Treasurer have reviewed the Registrant's disclosure controls and procedures (as defined in Rule 30a-3(c) under the Investment Company Act of 1940 (the “Act”)) as of a date within 90 days of the filing of this report, as required by Rule 30a-3(b) under the Act and Rules 13a-15(b) or 15d‑15(b) under the Securities Exchange Act of 1934. Based on their review, such officers have concluded that the disclosure controls and procedures are effective in ensuring that information required to be disclosed in this report is appropriately recorded, processed, summarized and reported and made known to them by others within the Registrant and by the Registrant’s service provider. |
(b) | There were no significant changes in the Registrant's internal control over financial reporting (as defined in Rule 30a-3(d) under the Act) that occurred during the first and second fiscal quarter of the period covered by this report that has materially affected, or is reasonably likely to materially affect, the Registrant's internal control over financial reporting. |
Item 12. Disclosure of Securities Lending Activities for Closed-End Management Investment Companies
Not applicable to open-end investment companies.
Item 13. Exhibits.
(a) | (1) Any code of ethics or amendment thereto, that is subject of the disclosure required by Item 2, to the extent that the registrant intends to satisfy Item 2 requirements through filing an exhibit. Not applicable for semi-annual reports. |
(2) Certifications pursuant to Section 302 of the Sarbanes-Oxley Act of 2002. Filed herewith.
(3) Any written solicitation to purchase securities under Rule 23c‑1 under the Act sent or given during the period covered by the report by or on behalf of the registrant to 10 or more persons. Not applicable to open-end investment companies.
(4) Change in the registrant’s independent public accountant. There was no change in the registrant’s independent public accountant for the period covered by this report.
| (b) | Certification pursuant to Section 906 of the Sarbanes‑Oxley Act of 2002. Furnished herewith. |
SIGNATURES
Pursuant to the requirements of the Securities Exchange Act of 1934 and the Investment Company Act of 1940, the registrant has duly caused this report to be signed on its behalf by the undersigned, thereunto duly authorized.
(Registrant) Prospector Funds, Inc.
By (Signature and Title)* /s/ John D. Gillespie
John D. Gillespie, President
Date September 6, 2019
Pursuant to the requirements of the Securities Exchange Act of 1934 and the Investment Company Act of 1940, this report has been signed below by the following persons on behalf of the registrant and in the capacities and on the dates indicated.
By (Signature and Title)* /s/ John D. Gillespie
John D. Gillespie, President
Date September 6, 2019
By (Signature and Title)* /s/ Peter N. Perugini, Jr.
Peter N. Perugini, Jr., Treasurer
Date September 6, 2019
* Print the name and title of each signing officer under his or her signature.