Exhibit 99.1
| Orion Group Holdings, Inc. Delivering Predictable Excellence November 2024 |

| DISCLAIMER This presentation contains, and the officers and directors of the Company may from time to time make, statements that are considered forward looking statements within the meaning of the Securities Act of 1933 and the Securities Exchange Act of 1934. These forward-looking statements are subject to a number of risks and uncertainties, many of which are beyond our control, which may include statements about: our business strategy; our financial strategy; our industry outlook; and our expected margin growth; and our plans, objectives, expectations, forecasts, outlook and intentions. All of these types of statements, other than statements of historical fact included in this presentation, are forward-looking statements. In some cases, forward-looking statements can be identified by terminology such as “may,” “will,” “could,” “should,” “expect,” “plan,” “project,” “intend,” “anticipate,” “believe,” “estimate,” “predict,” “potential,” “pursue,” “target,” “continue,” the negative of such terms or other comparable terminology. The forward-looking statements contained in this presentation are largely based on our expectations, which reflect estimates and assumptions made by our management. These estimates and assumptions reflect our best judgment based on currently known market conditions and other factors. Although we believe such estimates and assumptions to be reasonable, they are inherently uncertain and involve a number of risks and uncertainties that are beyond our control. In addition, management’s assumptions about future events may prove to be inaccurate. Management cautions all readers that the forward-looking statements contained in this presentation are not guarantees of future performance, and we cannot assure any reader that such statements will be realized or the forward-looking events and circumstances will occur. Actual results may differ materially from those anticipated or implied in the forward-looking statements due to factors listed in the “Risk Factors” section in our filings with the U.S. Securities and Exchange Commission and elsewhere in those filings. Additional factors or risks that we currently deem immaterial, that are not presently known to us or that arise in the future could also cause our actual results to differ materially from our expected results. Given these uncertainties, investors are cautioned that many of the assumptions upon which our forward-looking statements are based are likely to change after the date the forward-looking statements are made. The forward-looking statements speak only as of the date made, and we undertake no obligation to publicly update or revise any forward-looking statements for any reason, whether as a result of new information, future events or developments, changed circumstances, or otherwise, notwithstanding any changes in our assumptions, changes in business plans, actual experience or other changes. These cautionary statements qualify all forward-looking statements attributable to us or persons acting on our behalf. This presentation may contain the financial measures: adjusted net income, EBITDA, adjusted EBITDA, and adjusted EPS, which are not calculated in accordance with U.S. GAAP. If presented, a reconciliation of the non-GAAP financial measures to the most directly comparable GAAP financial measure will be provided in the Appendix to this presentation. |
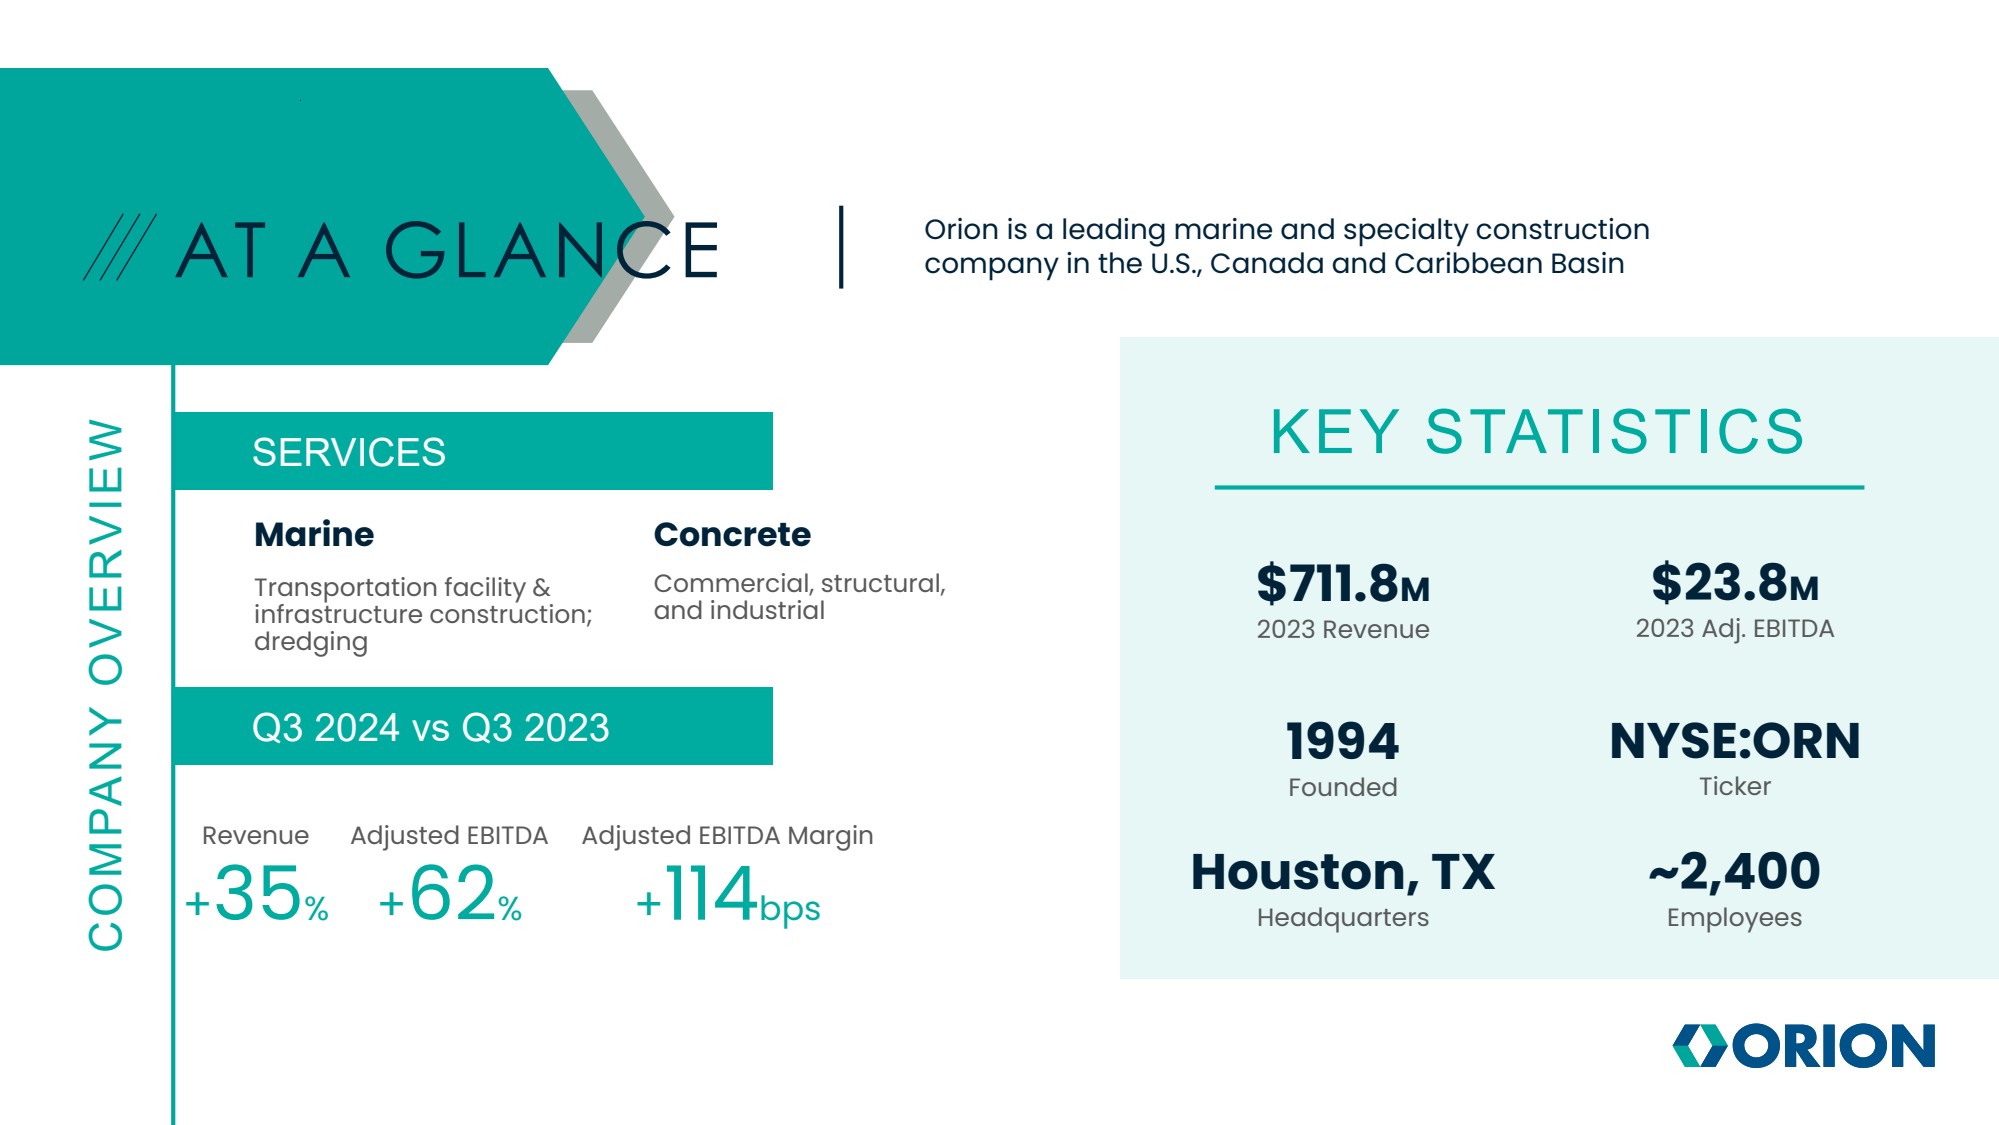
| AT A GLANCE Orion is a leading marine and specialty construction company in the U.S., Canada and Caribbean Basin KEY STATISTICS $711.8M 2023 Revenue $23.8M 2023 Adj. EBITDA 1994 Founded Houston, TX Headquarters NYSE:ORN Ticker ~2,400 Employees COMPANY OVERVIEW Marine Transportation facility & infrastructure construction; dredging SERVICES Concrete Commercial, structural, and industrial Q3 2024 vs Q3 2023 Revenue +35% Adjusted EBITDA +62% Adjusted EBITDA Margin +114bps |
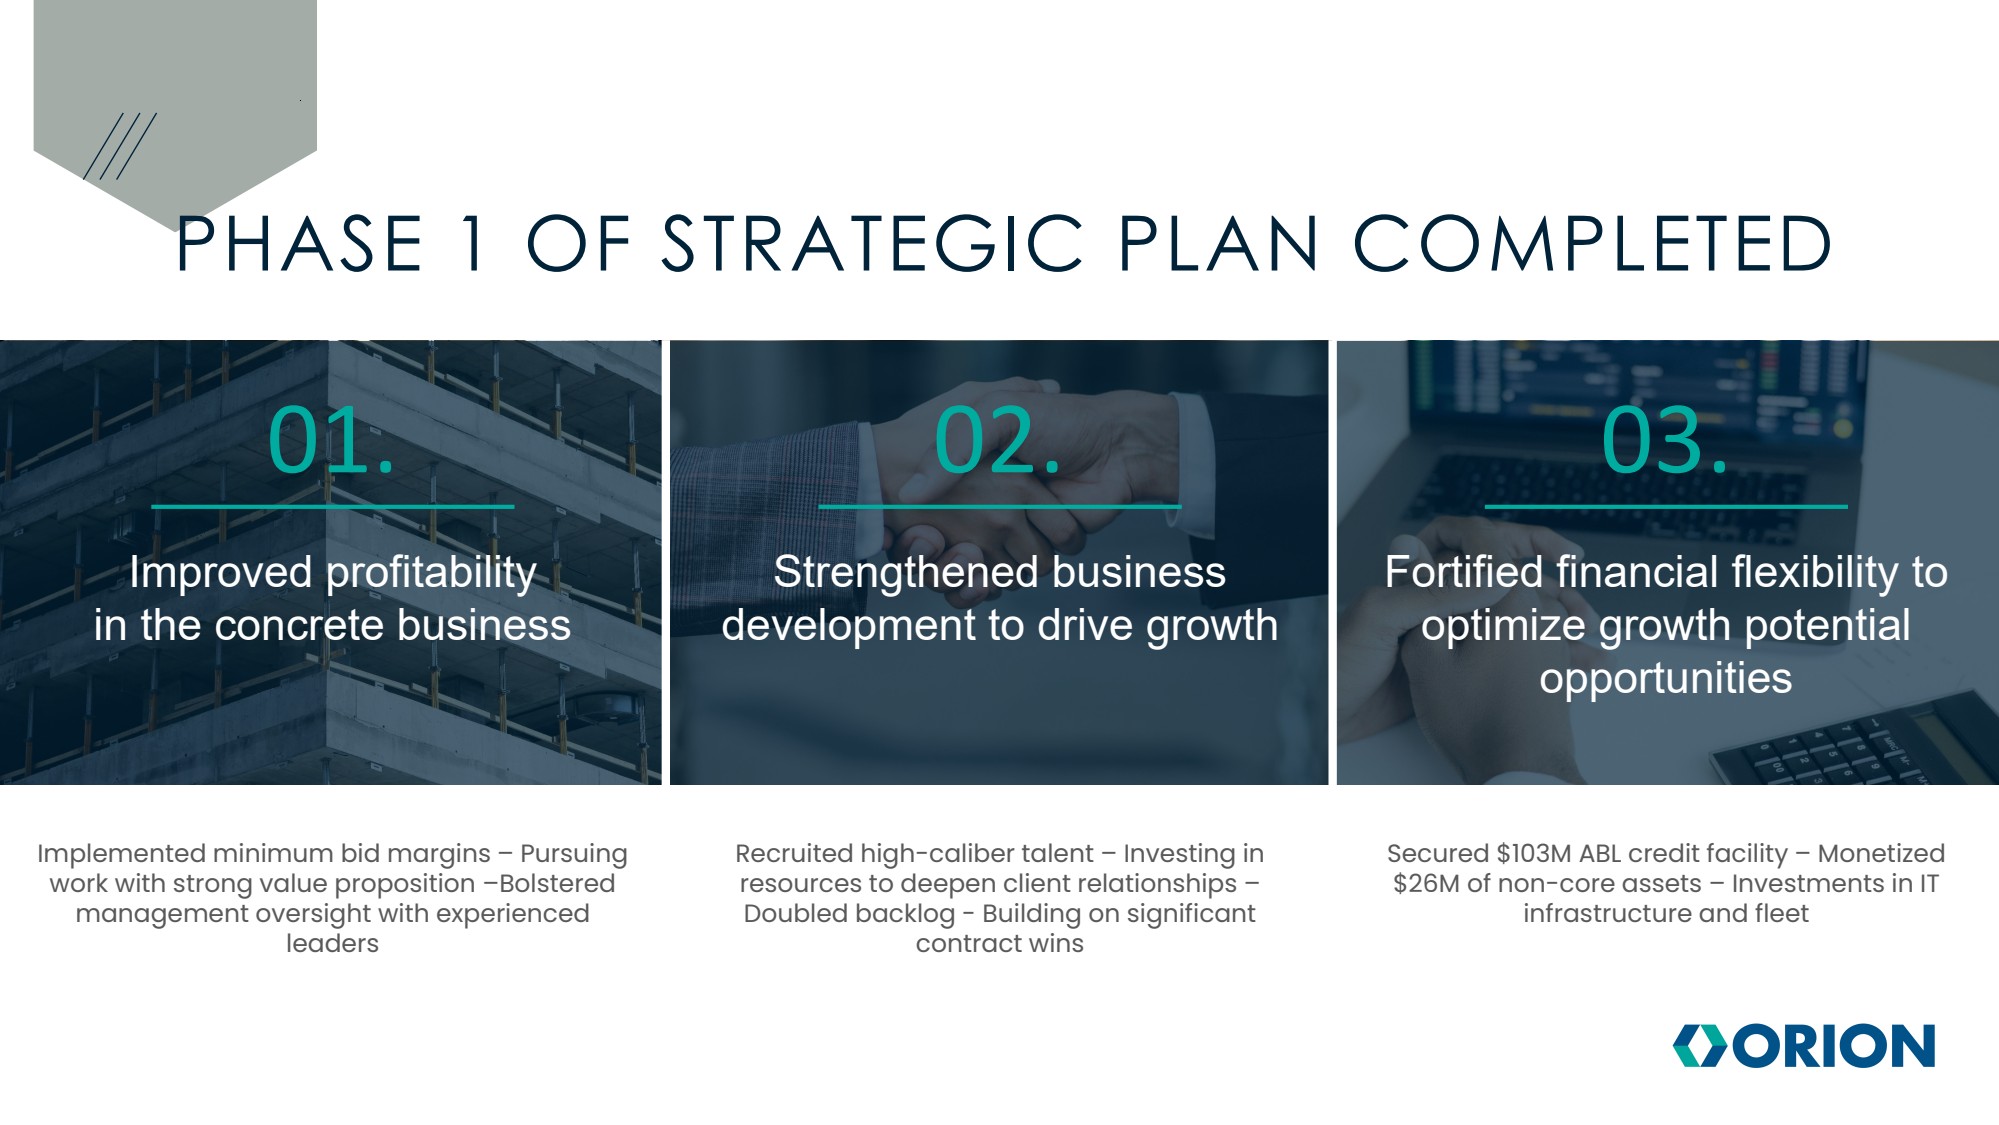
| PHASE 1 OF STRATEGIC PLAN COMPLETED Improved profitability in the concrete business Strengthened business development to drive growth Fortified financial flexibility to optimize growth potential opportunities Implemented minimum bid margins – Pursuing work with strong value proposition –Bolstered management oversight with experienced leaders Recruited high-caliber talent – Investing in resources to deepen client relationships – Doubled backlog - Building on significant contract wins Secured $103M ABL credit facility – Monetized $26M of non-core assets – Investments in IT infrastructure and fleet 01. 02. 03. |
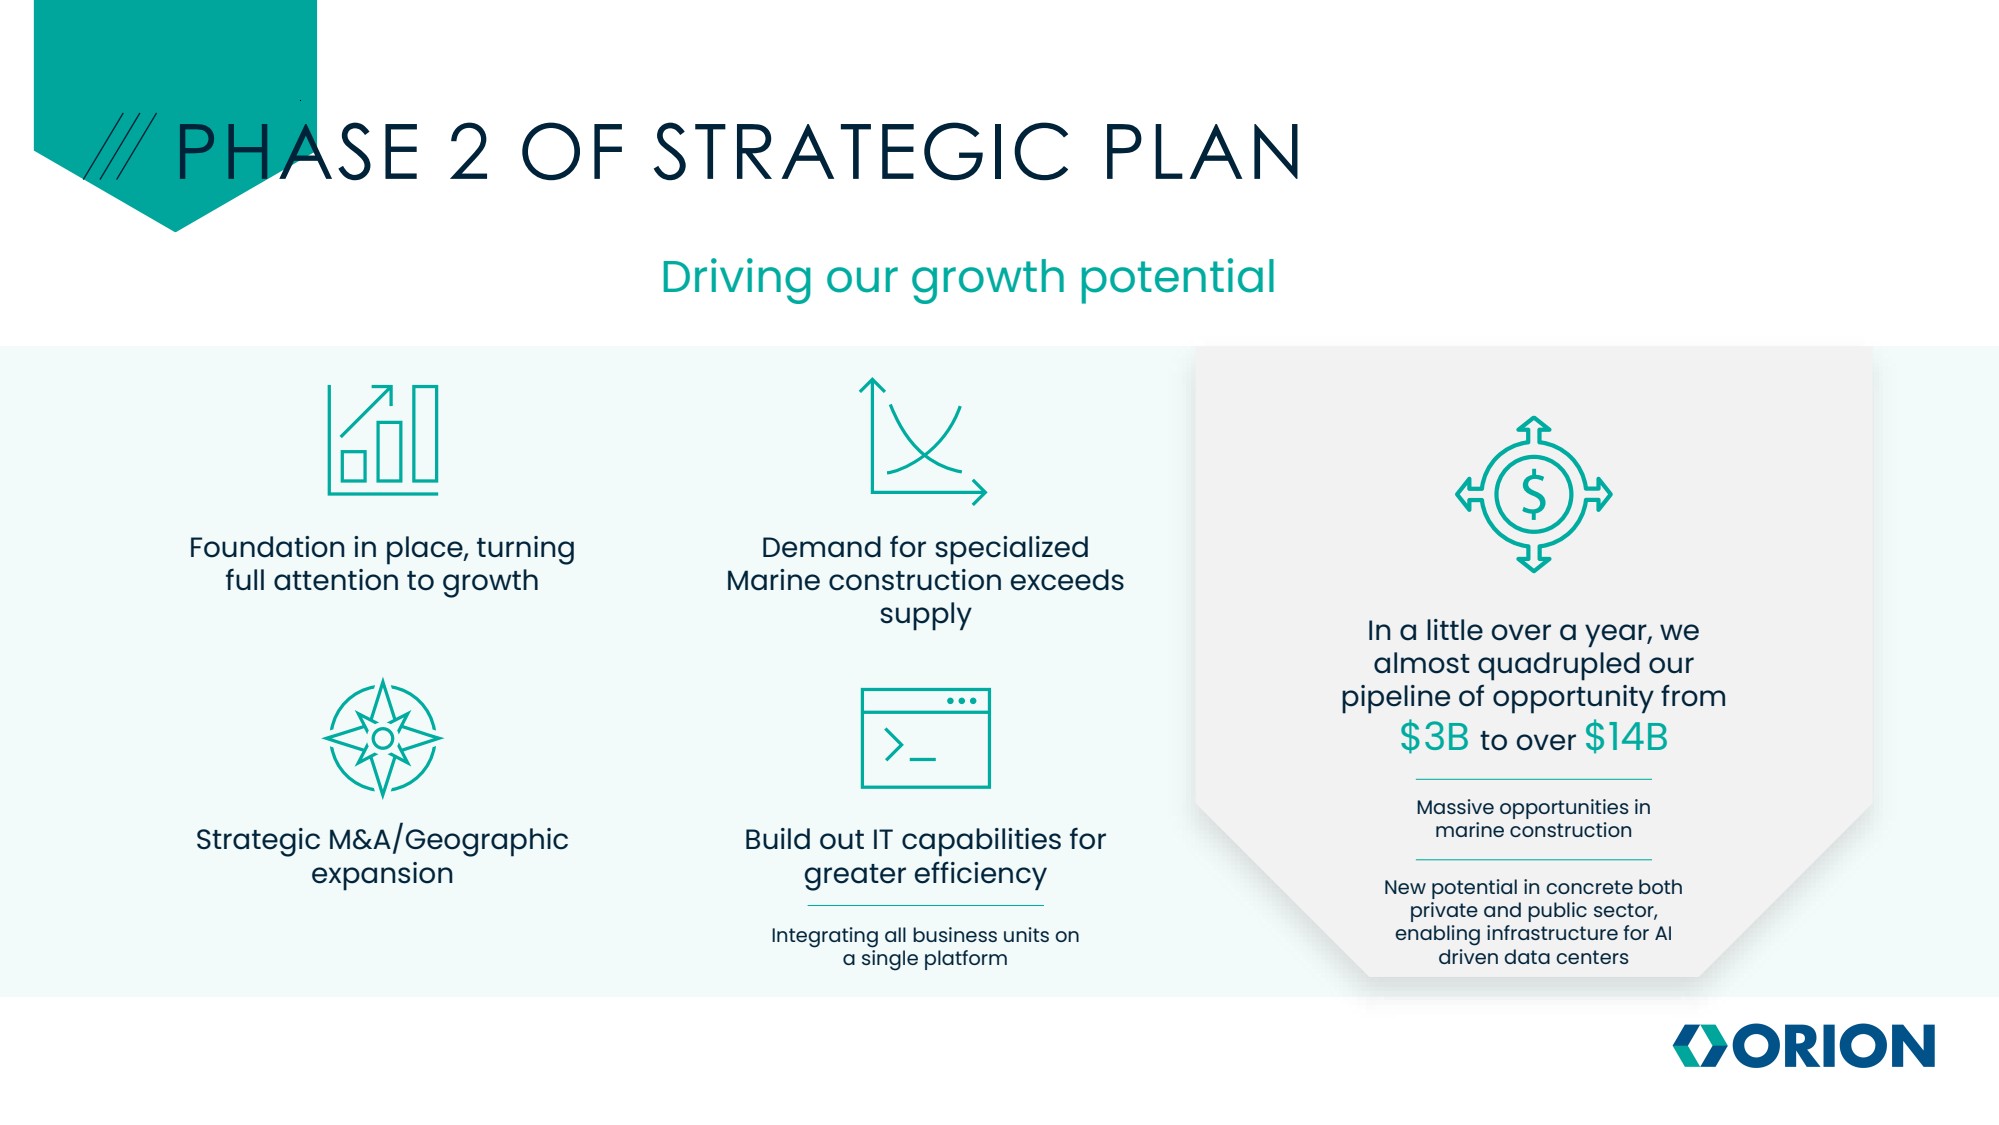
| Driving our growth potential Foundation in place, turning full attention to growth PHASE 2 OF STRATEGIC PLAN Demand for specialized Marine construction exceeds supply Strategic M&A/Geographic expansion Build out IT capabilities for greater efficiency Integrating all business units on a single platform In a little over a year, we almost quadrupled our pipeline of opportunity from $3B to over $14B Massive opportunities in marine construction New potential in concrete both private and public sector, enabling infrastructure for AI driven data centers |
| STRONG INDUSTRY TAILWINDS $1.2 trillion Infrastructure Act 01. Multi-year catalyst for public sector projects such as transportation funding, ports, waterways, water infrastructure and bridges. Port expansion and maintenance 02. Larger ships via expanded Panama Canal require deeper shipping channels and expanded infrastructure. U.S. Navy expansions in the Pacific 03. U.S. Navy investments in assets to support the U.S. Navy fleet. Coastal rehabilitation 04. Increased disaster recovery from regional weather events, environmental remediation and sea level rise; $10B projected in Louisiana alone. Growing public sector construction market 08. New market opportunity for Orion Concrete. Data center demand 07. AI driving need for more data centers in North Texas and other weather-safe regions. Economic growth and expansion 06. Leading job and population growth rates in Gulf region. Downstream energy 05. Private investment in LNG and methanol terminals. $30B TAM. Diverse end markets. Multiple sources of funding. |

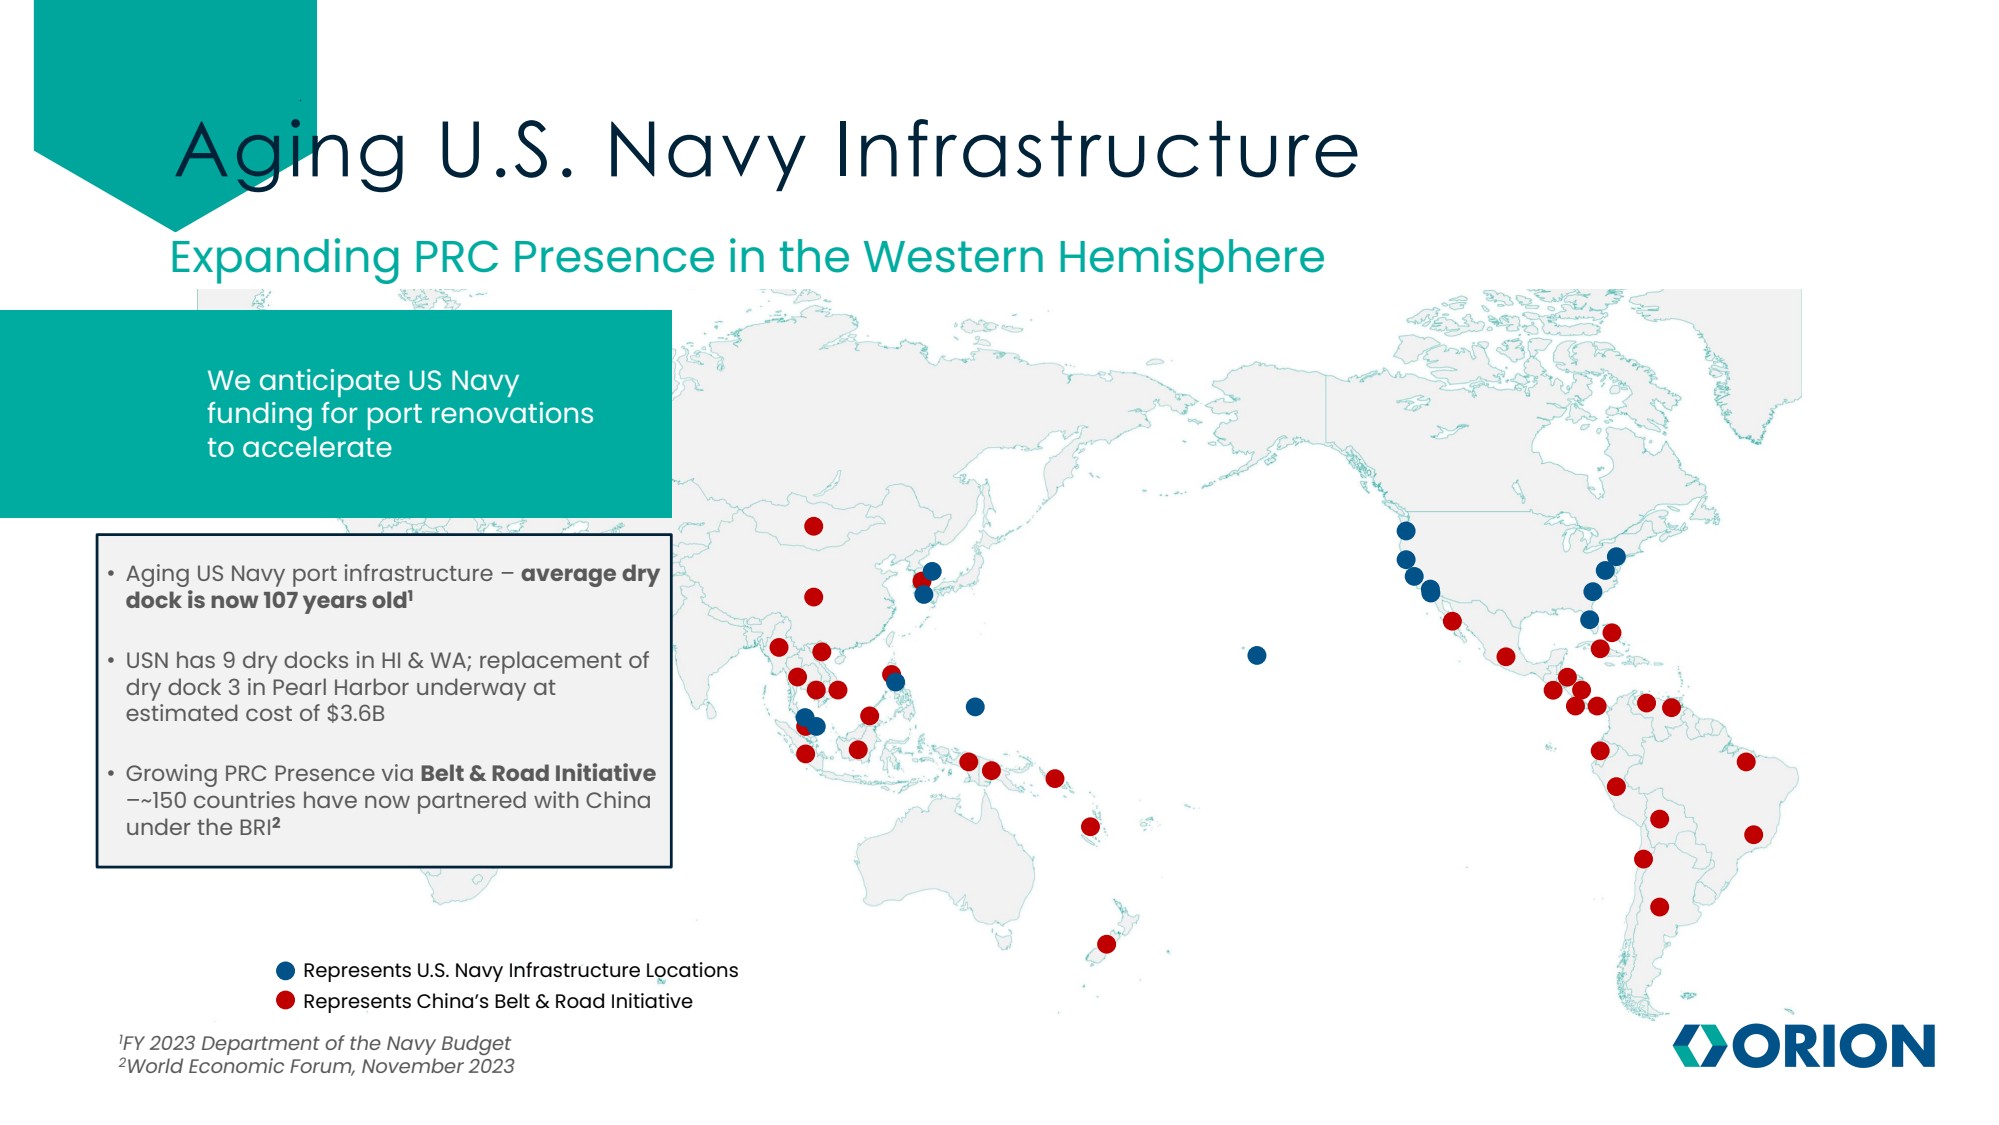
| Aging U.S. Navy Infrastructure Expanding PRC Presence in the Western Hemisphere Represents U.S. Navy Infrastructure Locations Represents China’s Belt & Road Initiative We anticipate US Navy funding for port renovations to accelerate • Aging US Navy port infrastructure – average dry dock is now 107 years old1 • USN has 9 dry docks in HI & WA; replacement of dry dock 3 in Pearl Harbor underway at estimated cost of $3.6B • Growing PRC Presence via Belt & Road Initiative –~150 countries have now partnered with China under the BRI2 1FY 2023 Department of the Navy Budget 2World Economic Forum, November 2023 |
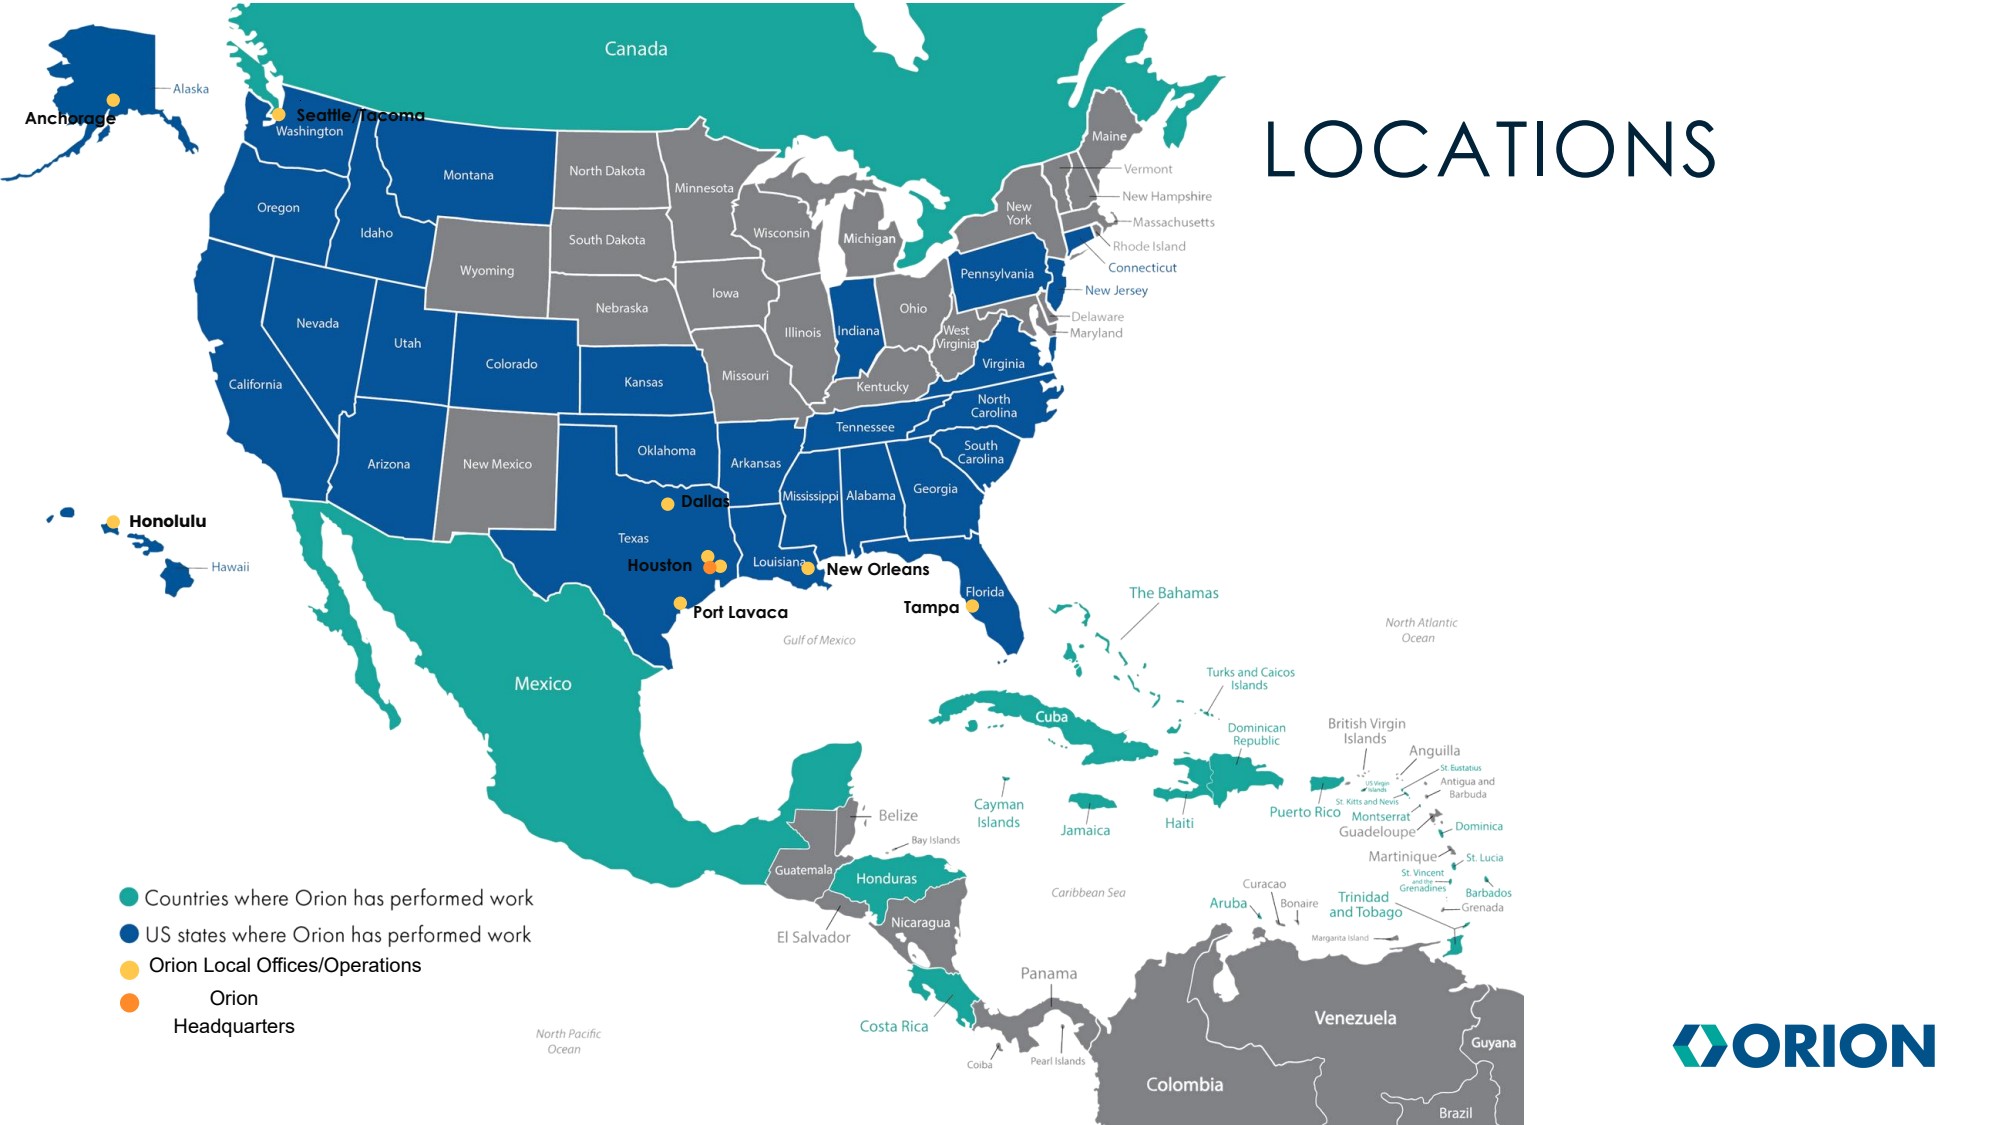
| Tampa New Orleans Dallas Houston Port Lavaca Honolulu Anchorage Seattle/Tacoma Orion Local Offices/Operations Orion Headquarters LOCATIONS |
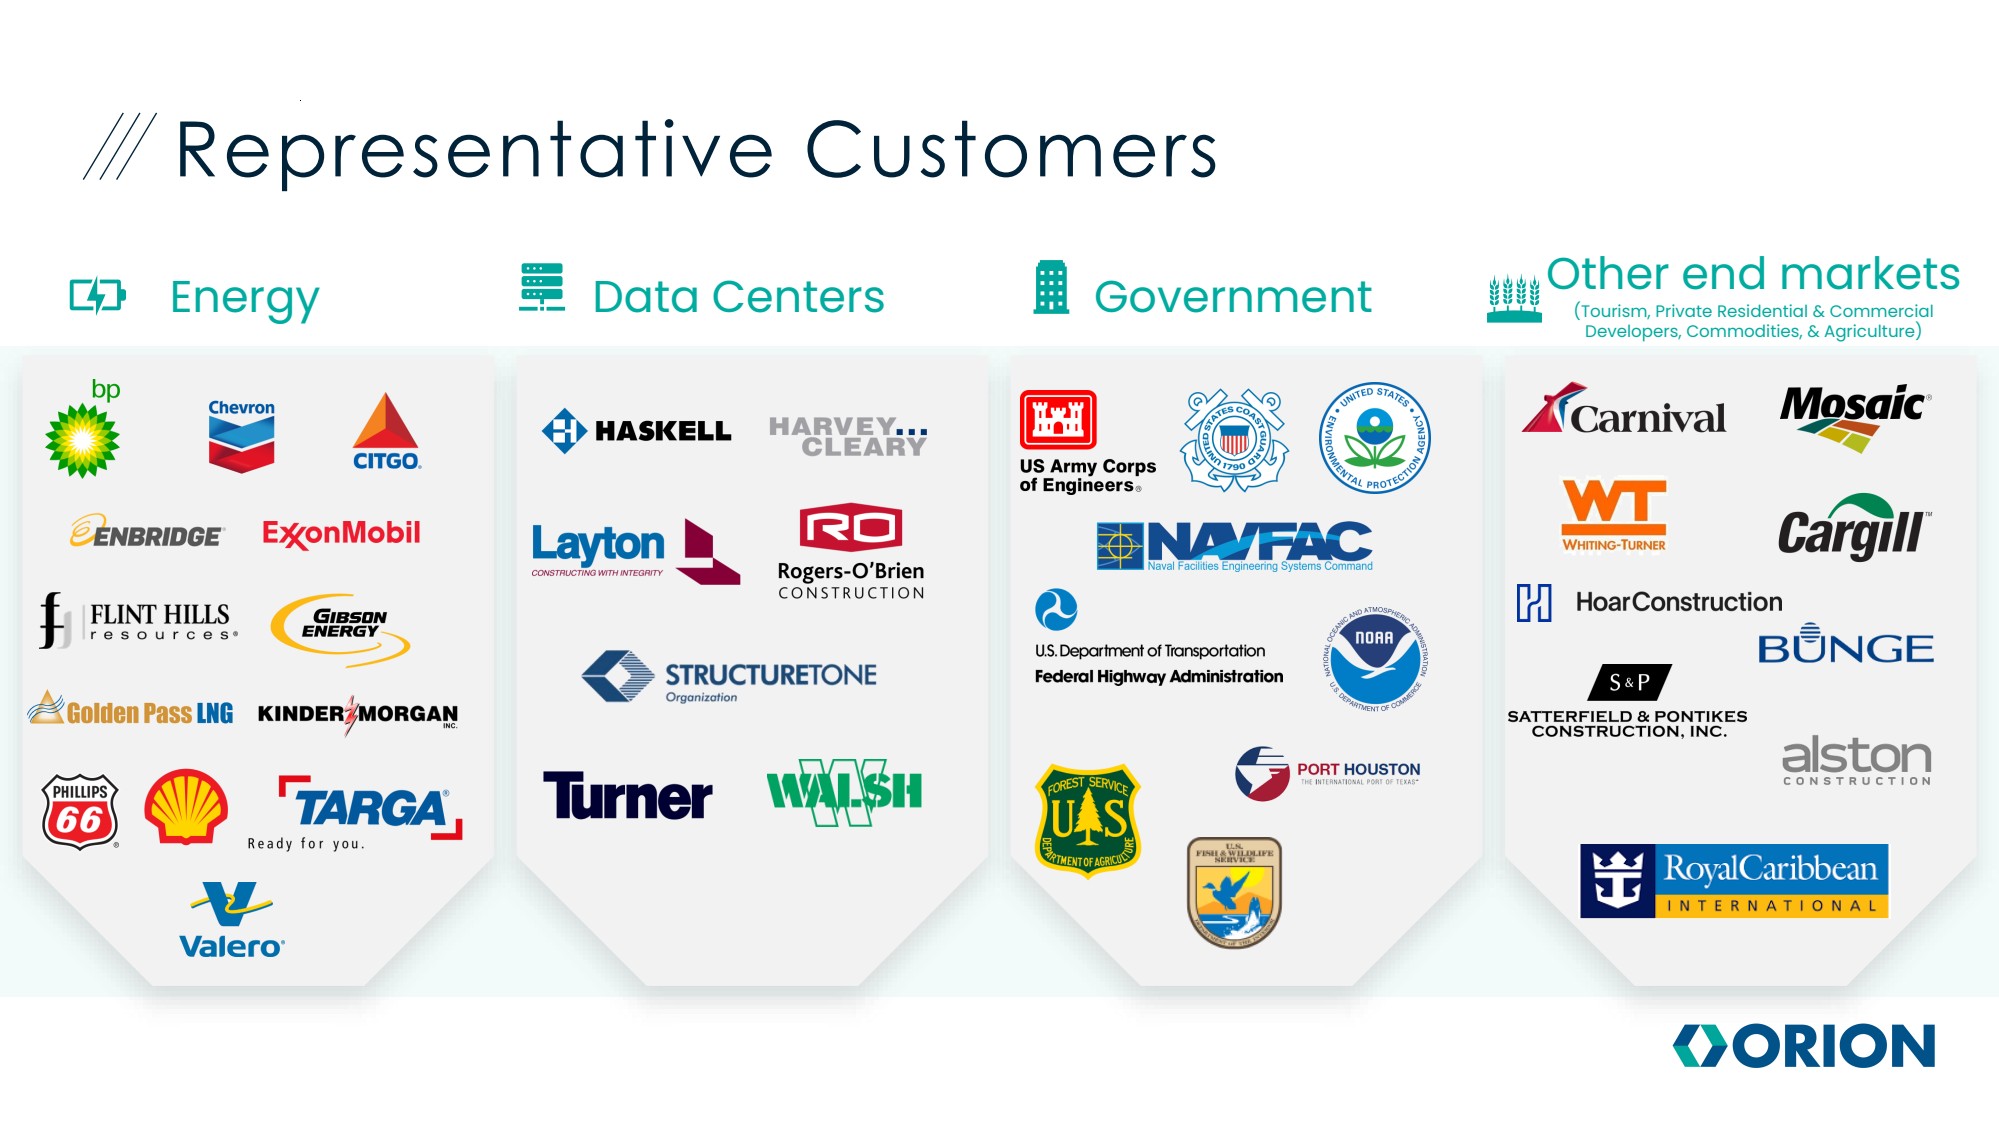
| Representative Customers Energy Data Centers Government Other end markets (Tourism, Private Residential & Commercial Developers, Commodities, & Agriculture) |
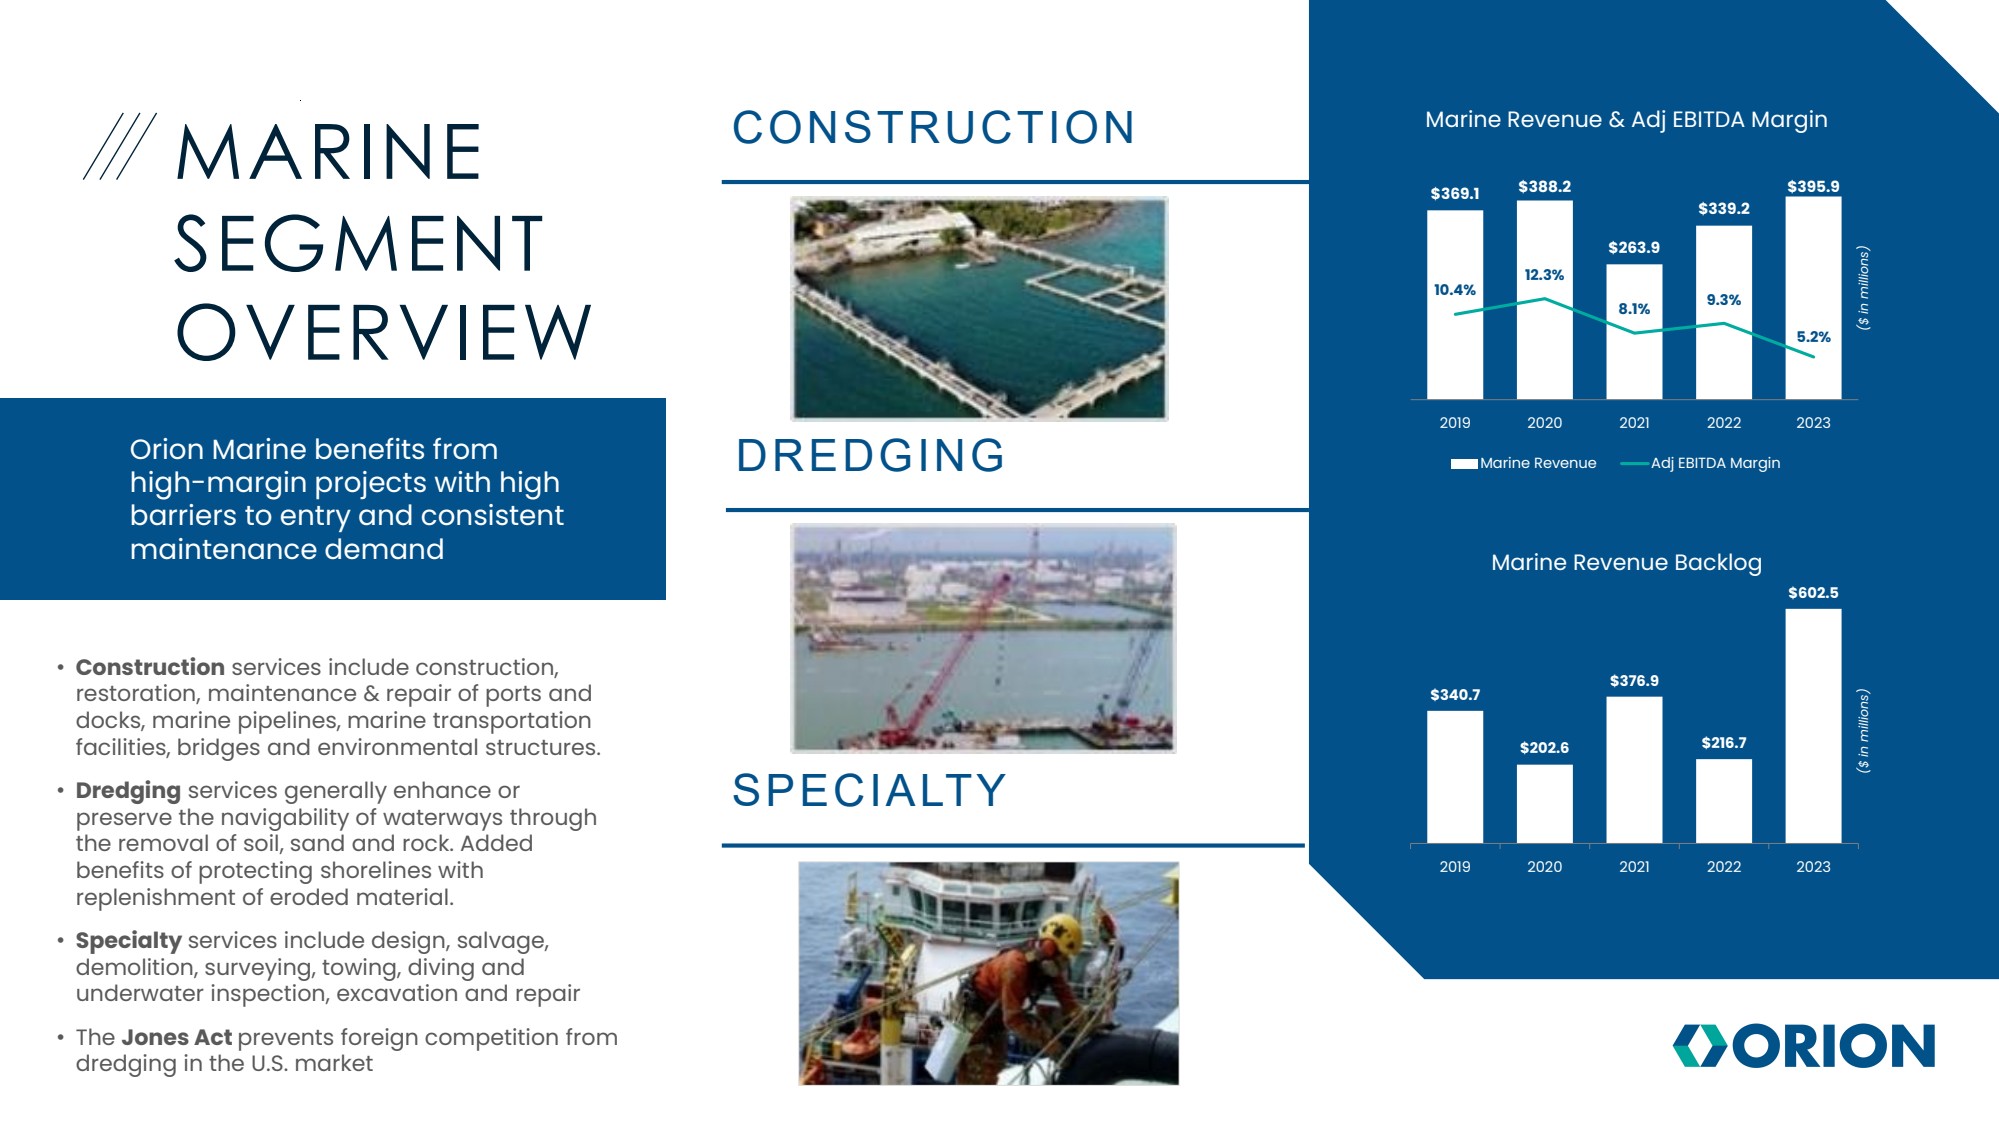
| $340.7 $202.6 $376.9 $216.7 $602.5 2019 2020 2021 2022 2023 $369.1 $388.2 $263.9 $339.2 $395.9 10.4% 12.3% 8.1% 9.3% 5.2% 2019 2020 2021 2022 2023 Marine Revenue Adj EBITDA Margin MARINE SEGMENT OVERVIEW Orion Marine benefits from high -margin projects with high barriers to entry and consistent maintenance demand • Construction services include construction, restoration, maintenance & repair of ports and docks, marine pipelines, marine transportation facilities, bridges and environmental structures. • Dredging services generally enhance or preserve the navigability of waterways through the removal of soil, sand and rock. Added benefits of protecting shorelines with replenishment of eroded material. • Specialty services include design, salvage, demolition, surveying, towing, diving and underwater inspection, excavation and repair • The Jones Act prevents foreign competition from dredging in the U.S. market CONSTRUCTION DREDGING SPECIALTY Marine Revenue & Adj EBITDA Margin Marine Revenue Backlog ($ in millions) ($ in millions) |
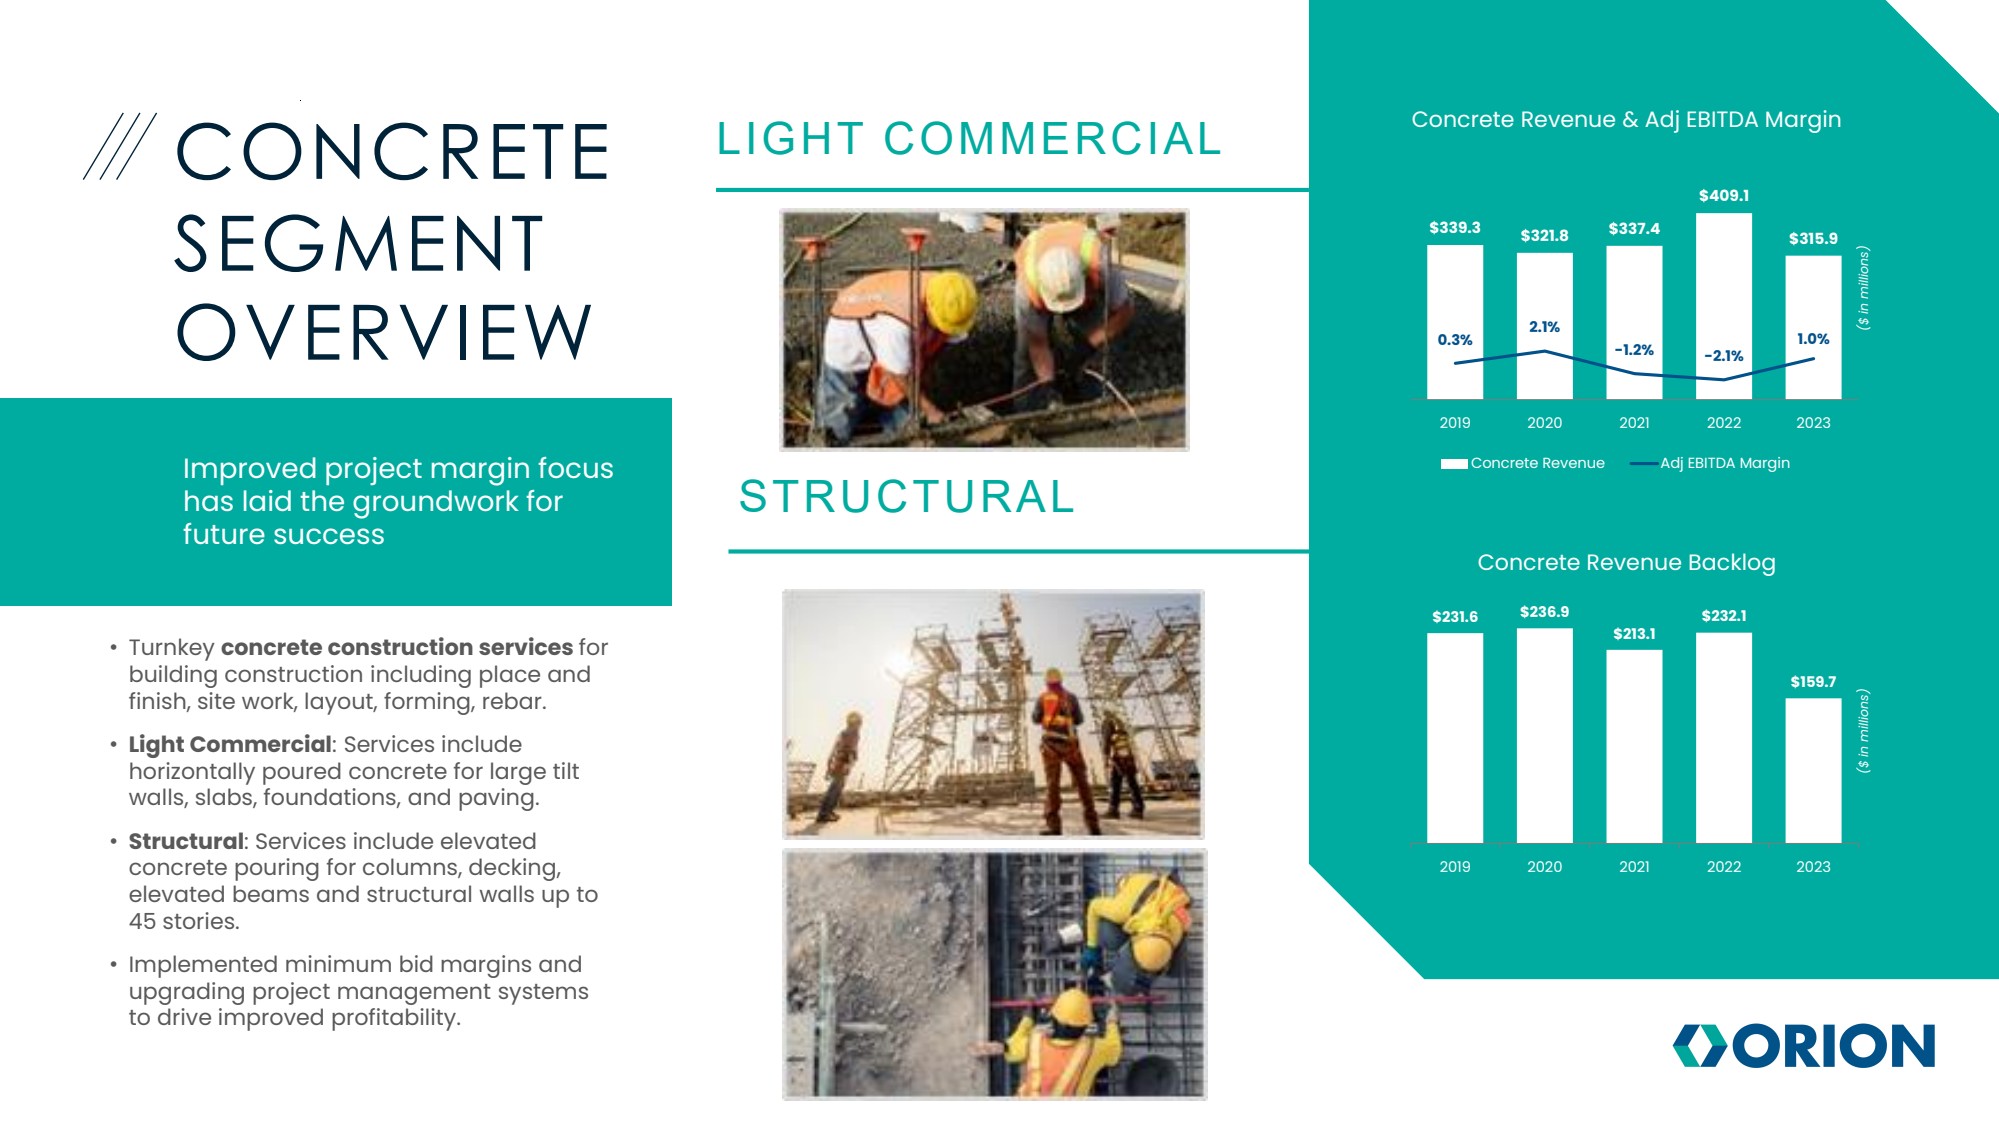
| $231.6 $236.9 $213.1 $232.1 $159.7 2019 2020 2021 2022 2023 $339.3 $321.8 $337.4 $409.1 $315.9 0.3% 2.1% -1.2% -2.1% 1.0% 2019 2020 2021 2022 2023 Concrete Revenue Adj EBITDA Margin CONCRETE SEGMENT OVERVIEW Improved project margin focus has laid the groundwork for future success • Turnkey concrete construction services for building construction including place and finish, site work, layout, forming, rebar. • Light Commercial: Services include horizontally poured concrete for large tilt walls, slabs, foundations, and paving. • Structural: Services include elevated concrete pouring for columns, decking, elevated beams and structural walls up to 45 stories. • Implemented minimum bid margins and upgrading project management systems to drive improved profitability. LIGHT COMMERCIAL STRUCTURAL Concrete Revenue & Adj EBITDA Margin Concrete Revenue Backlog ($ in millions) ($ in millions) |
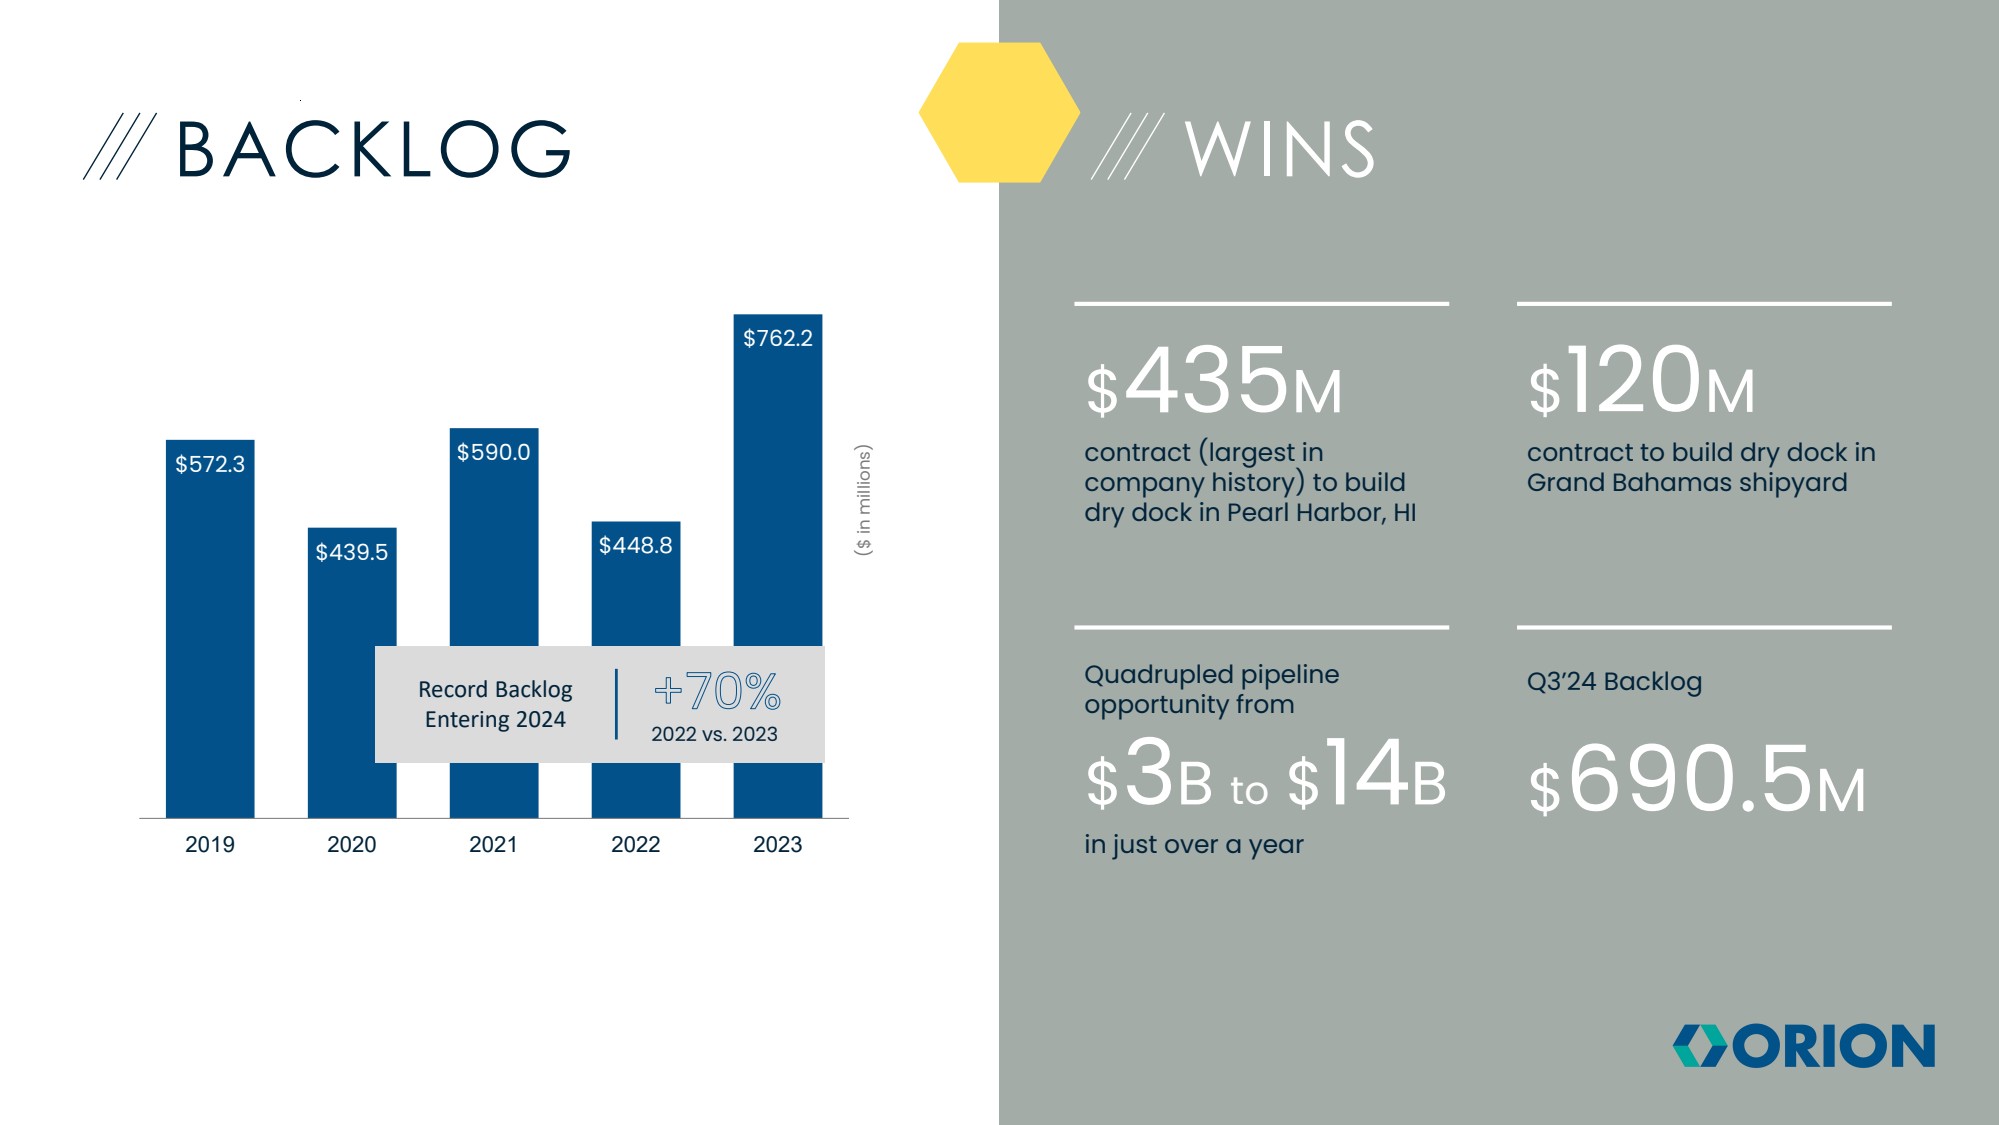
| BACKLOG WINS $572.3 $439.5 $590.0 $448.8 $762.2 2019 2020 2021 2022 2023 ($ in millions) +70% 2022 vs. 2023 Record Backlog Entering 2024 $435M contract (largest in company history) to build dry dock in Pearl Harbor, HI $120M contract to build dry dock in Grand Bahamas shipyard Quadrupled pipeline opportunity from $3B to $14B in just over a year Q3’24 Backlog $690.5M |
| EXPERIENCED MANAGEMENT TEAM Travis Boone, PE Chief Executive Officer Leadership and management experience in civil, utility/pipeline, commercial building and construction industries. Former regional Chief Executive of AECOM Ardell Allred Executive Vice President Orion Concrete Group Held construction and management roles at companies including Kiewit and Zachry Construction Scott Thanisch Chief Financial Officer Multi-disciplinary finance experience, including corporate development, FP&A, treasury, strategy and accounting across numerous industries Scott Cromack Executive Vice President Orion Marine Group Recently served as a Senior Vice President at Texas Sterling Construction. Also held roles at Kiewit and Zachry Construction Chip Earle General Counsel impressive legal, compliance and risk management background. Recently served as General Counsel of Newpark Resources, Inc. and Bristow Group Alan Eckman Senior Vice President, Strategy & Growth Recently served as Vice President of Business Development at AECOM |

| FINANCIAL OVERVIEW |

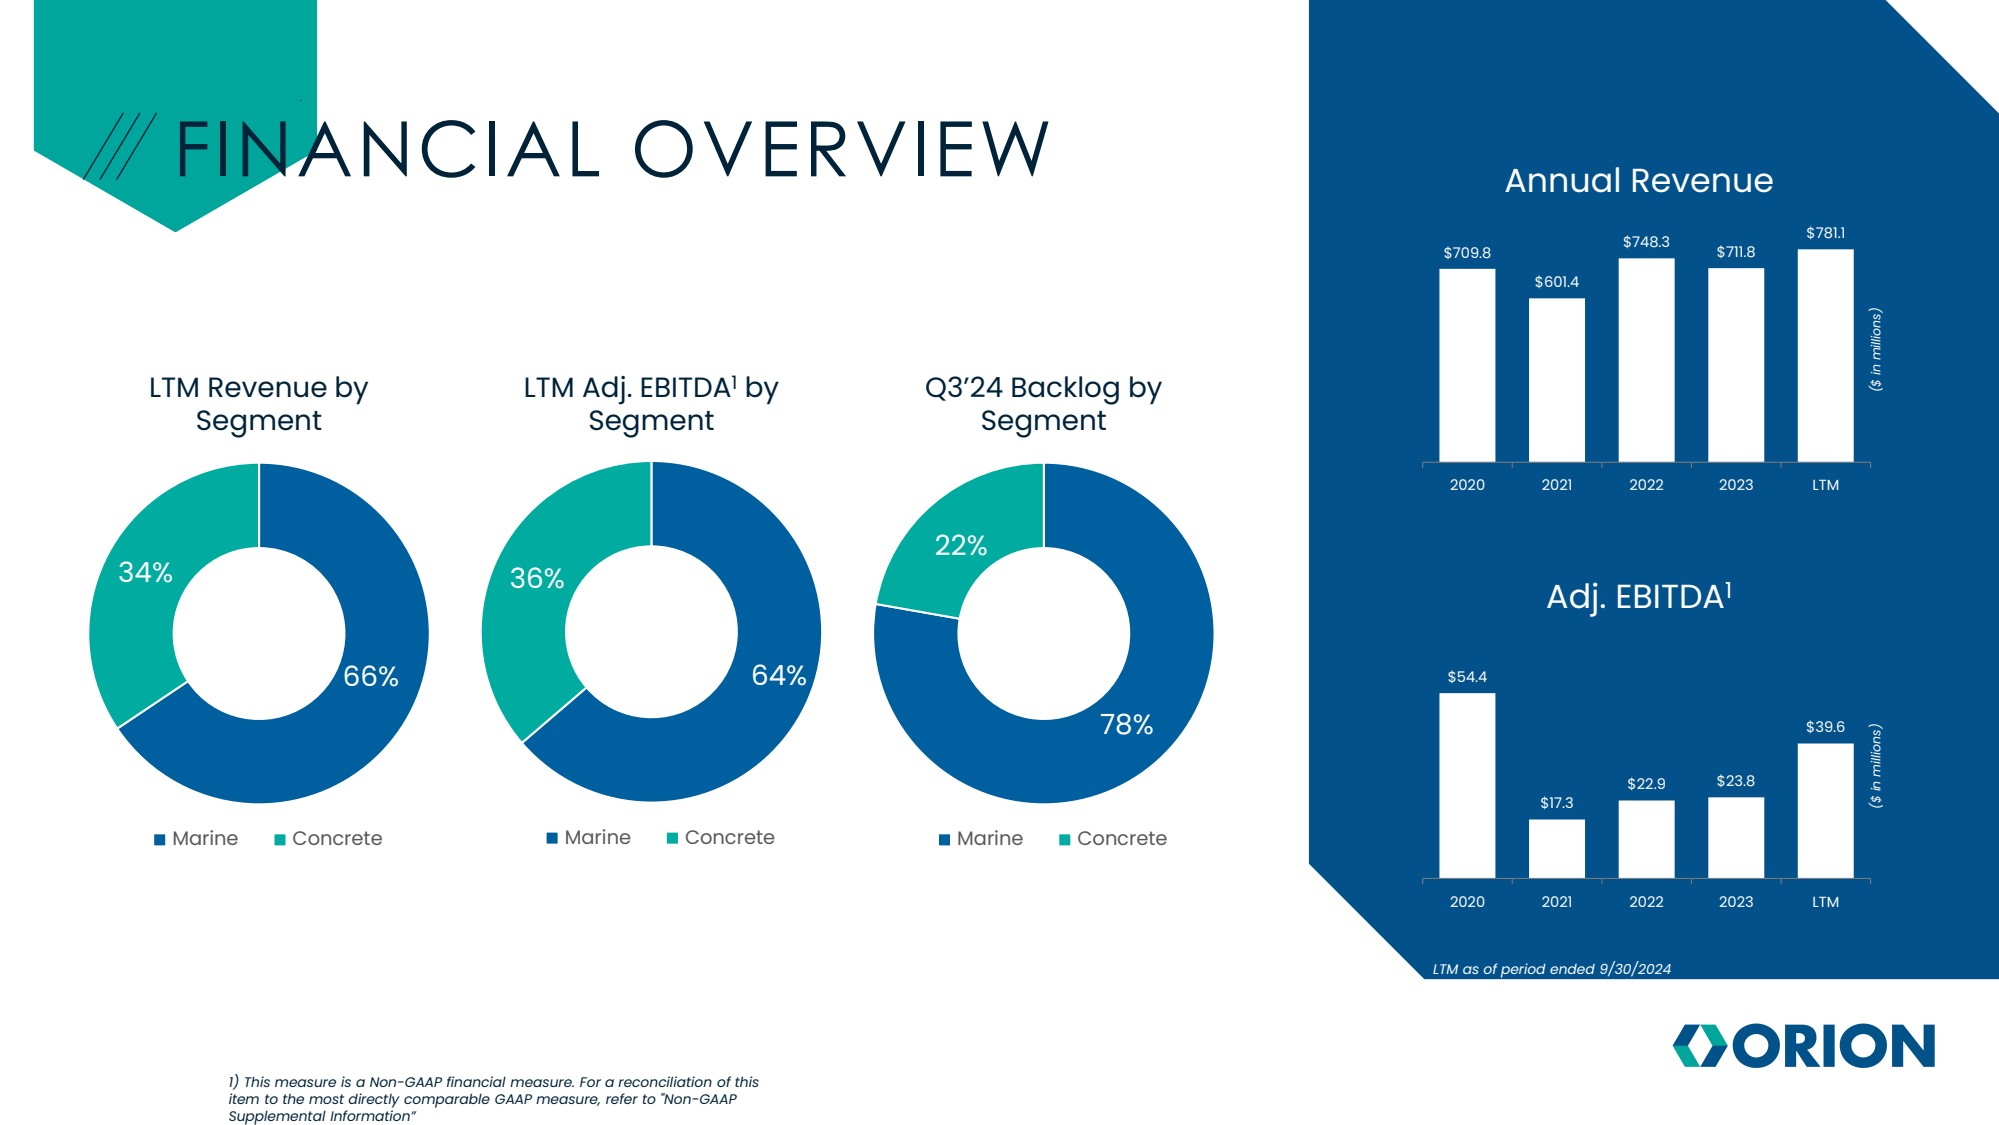
| FINANCIAL OVERVIEW $709.8 $601.4 $748.3 $711.8 $781.1 2020 2021 2022 2023 LTM Annual Revenue ($ in millions) $54.4 $17.3 $22.9 $23.8 $39.6 2020 2021 2022 2023 LTM Adj. EBITDA1 ($ in millions) LTM Revenue by Segment Q3’24 Backlog by Segment LTM Adj. EBITDA1 by Segment 66% 34% Marine Concrete 78% 22% Marine Concrete 64% 36% Marine Concrete 1) This measure is a Non-GAAP financial measure. For a reconciliation of this item to the most directly comparable GAAP measure, refer to "Non-GAAP Supplemental Information” LTM as of period ended 9/30/2024 |
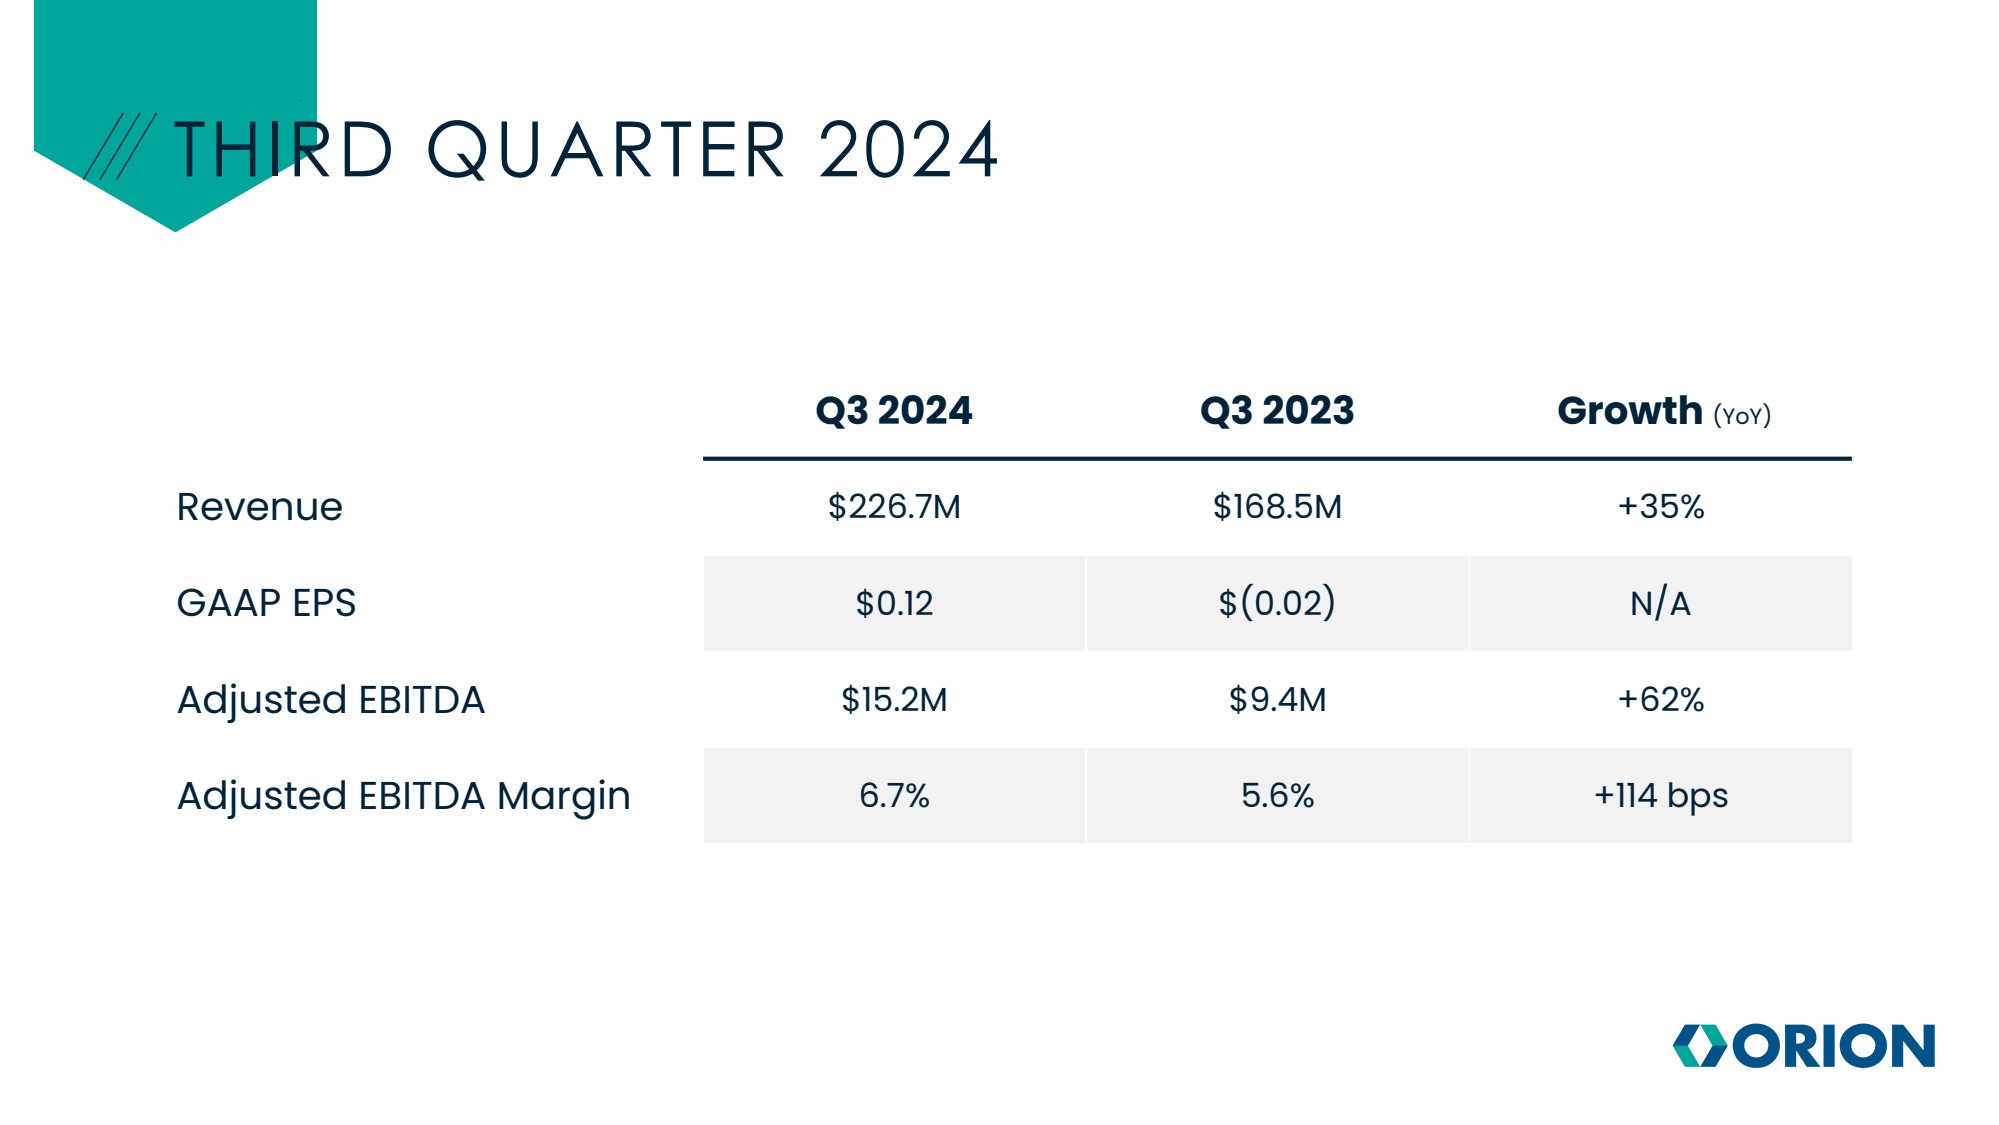
| Q3 2024 Q3 2023 Growth (YoY) Revenue $226.7M $168.5M +35% GAAP EPS $0.12 $(0.02) N/A Adjusted EBITDA $15.2M $9.4M +62% Adjusted EBITDA Margin 6.7% 5.6% +114 bps THIRD QUARTER 2024 |
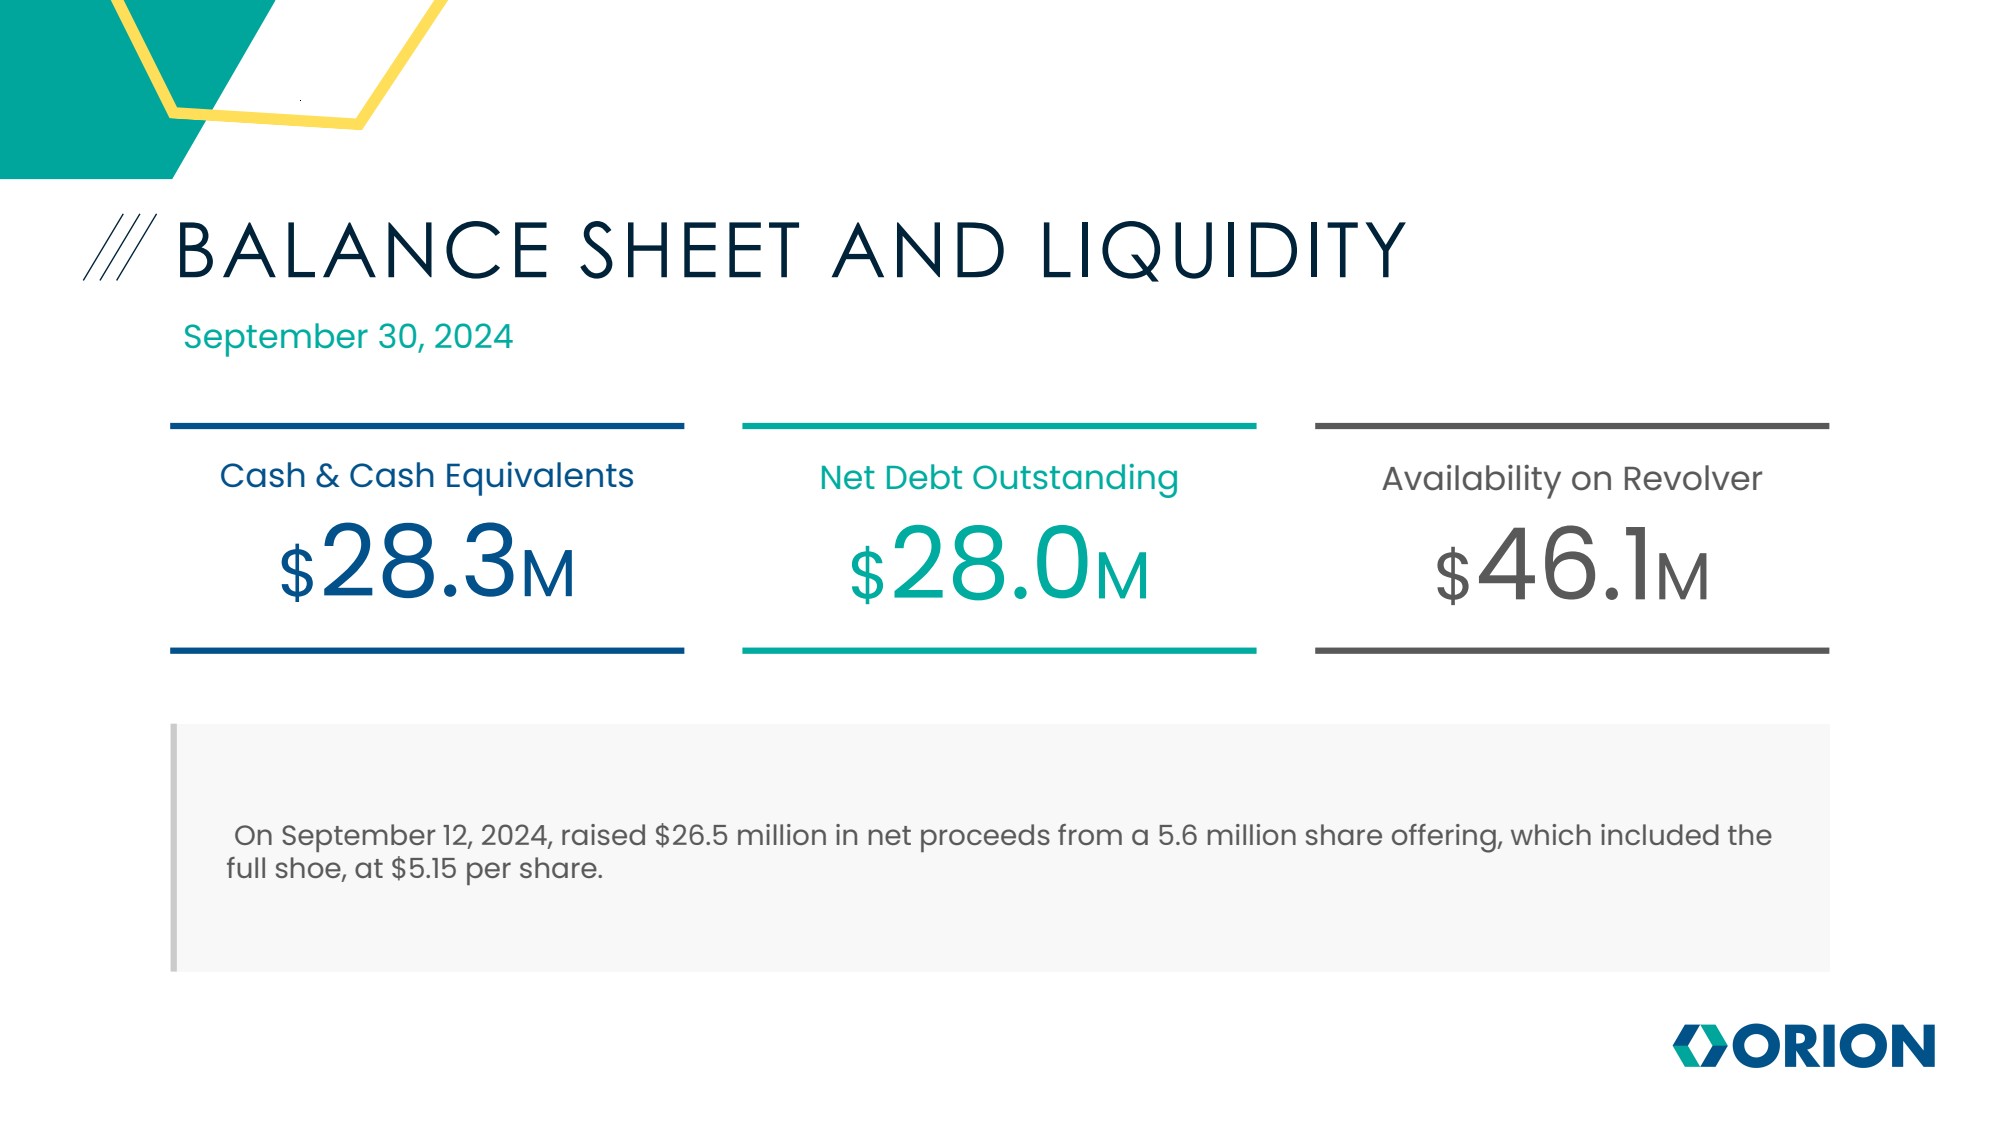
| BALANCE SHEET AND LIQUIDITY Cash & Cash Equivalents $28.3M Net Debt Outstanding $28.0M Availability on Revolver $46.1M September 30, 2024 On September 12, 2024, raised $26.5 million in net proceeds from a 5.6 million share offering, which included the full shoe, at $5.15 per share. |
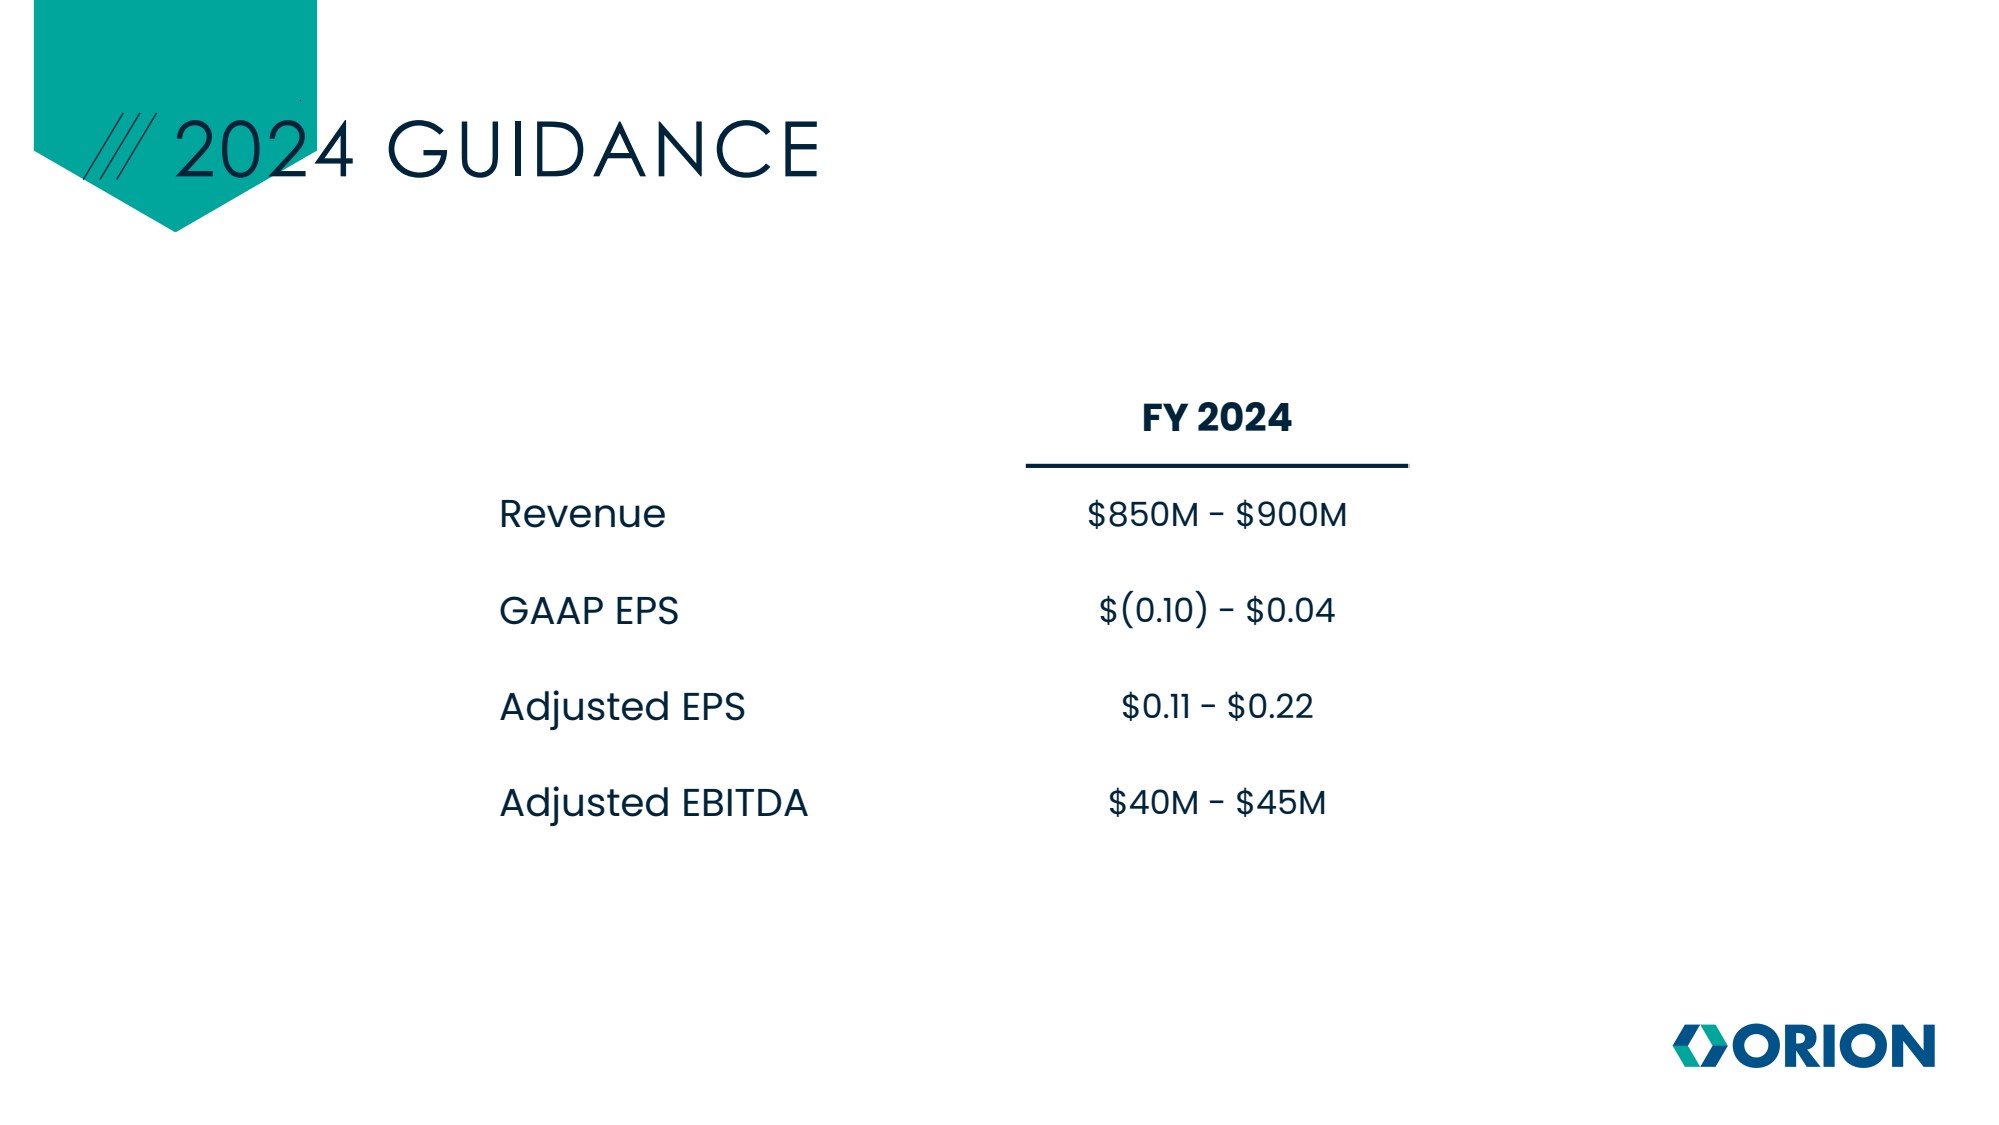
| FY 2024 Revenue $850M - $900M GAAP EPS $(0.10) - $0.04 Adjusted EPS $0.11 - $0.22 Adjusted EBITDA $40M - $45M 2024 GUIDANCE |
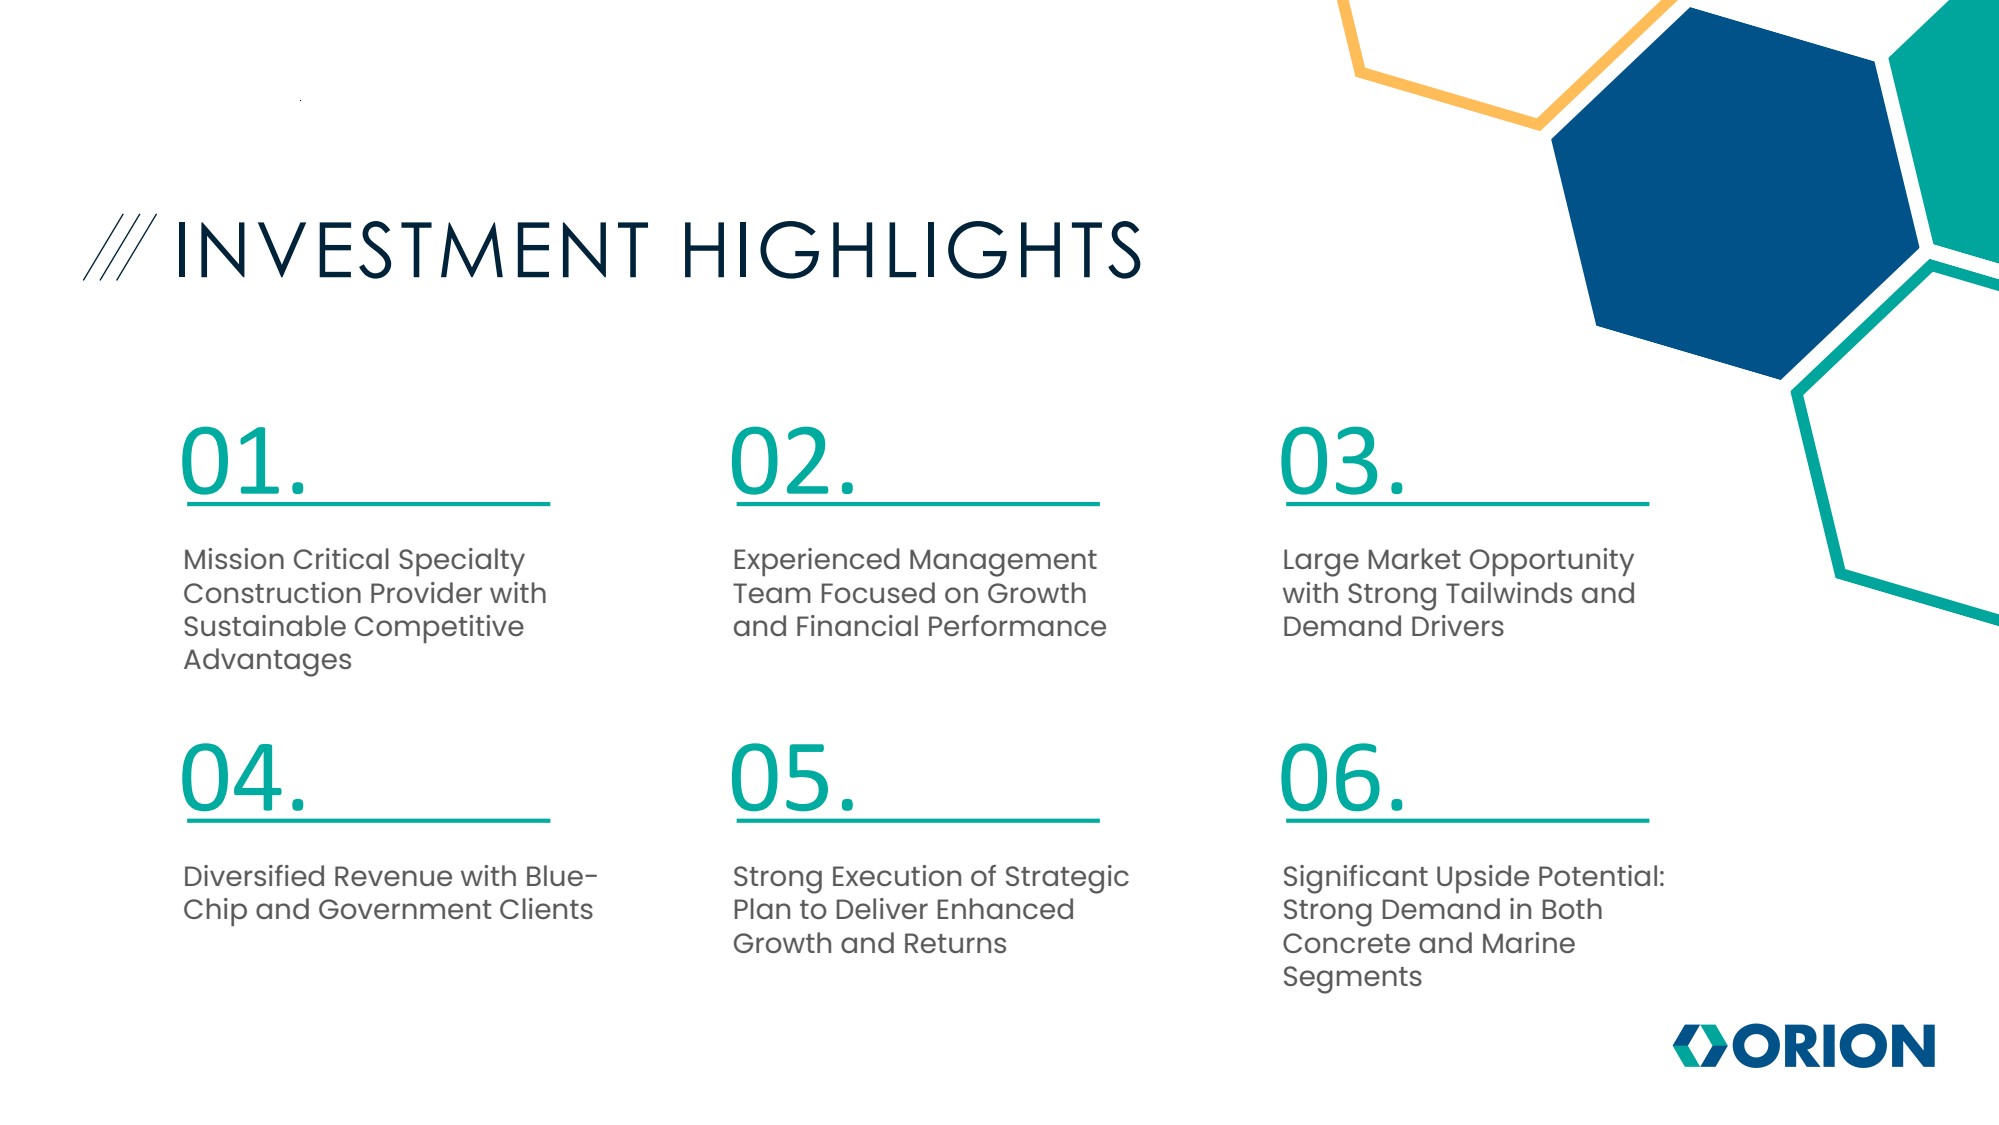
| INVESTMENT HIGHLIGHTS Mission Critical Specialty Construction Provider with Sustainable Competitive Advantages 01. Experienced Management Team Focused on Growth and Financial Performance 02. Large Market Opportunity with Strong Tailwinds and Demand Drivers 03. Diversified Revenue with Blue-Chip and Government Clients 04. Strong Execution of Strategic Plan to Deliver Enhanced Growth and Returns 05. Significant Upside Potential: Strong Demand in Both Concrete and Marine Segments 06. |
| APPENDIX |

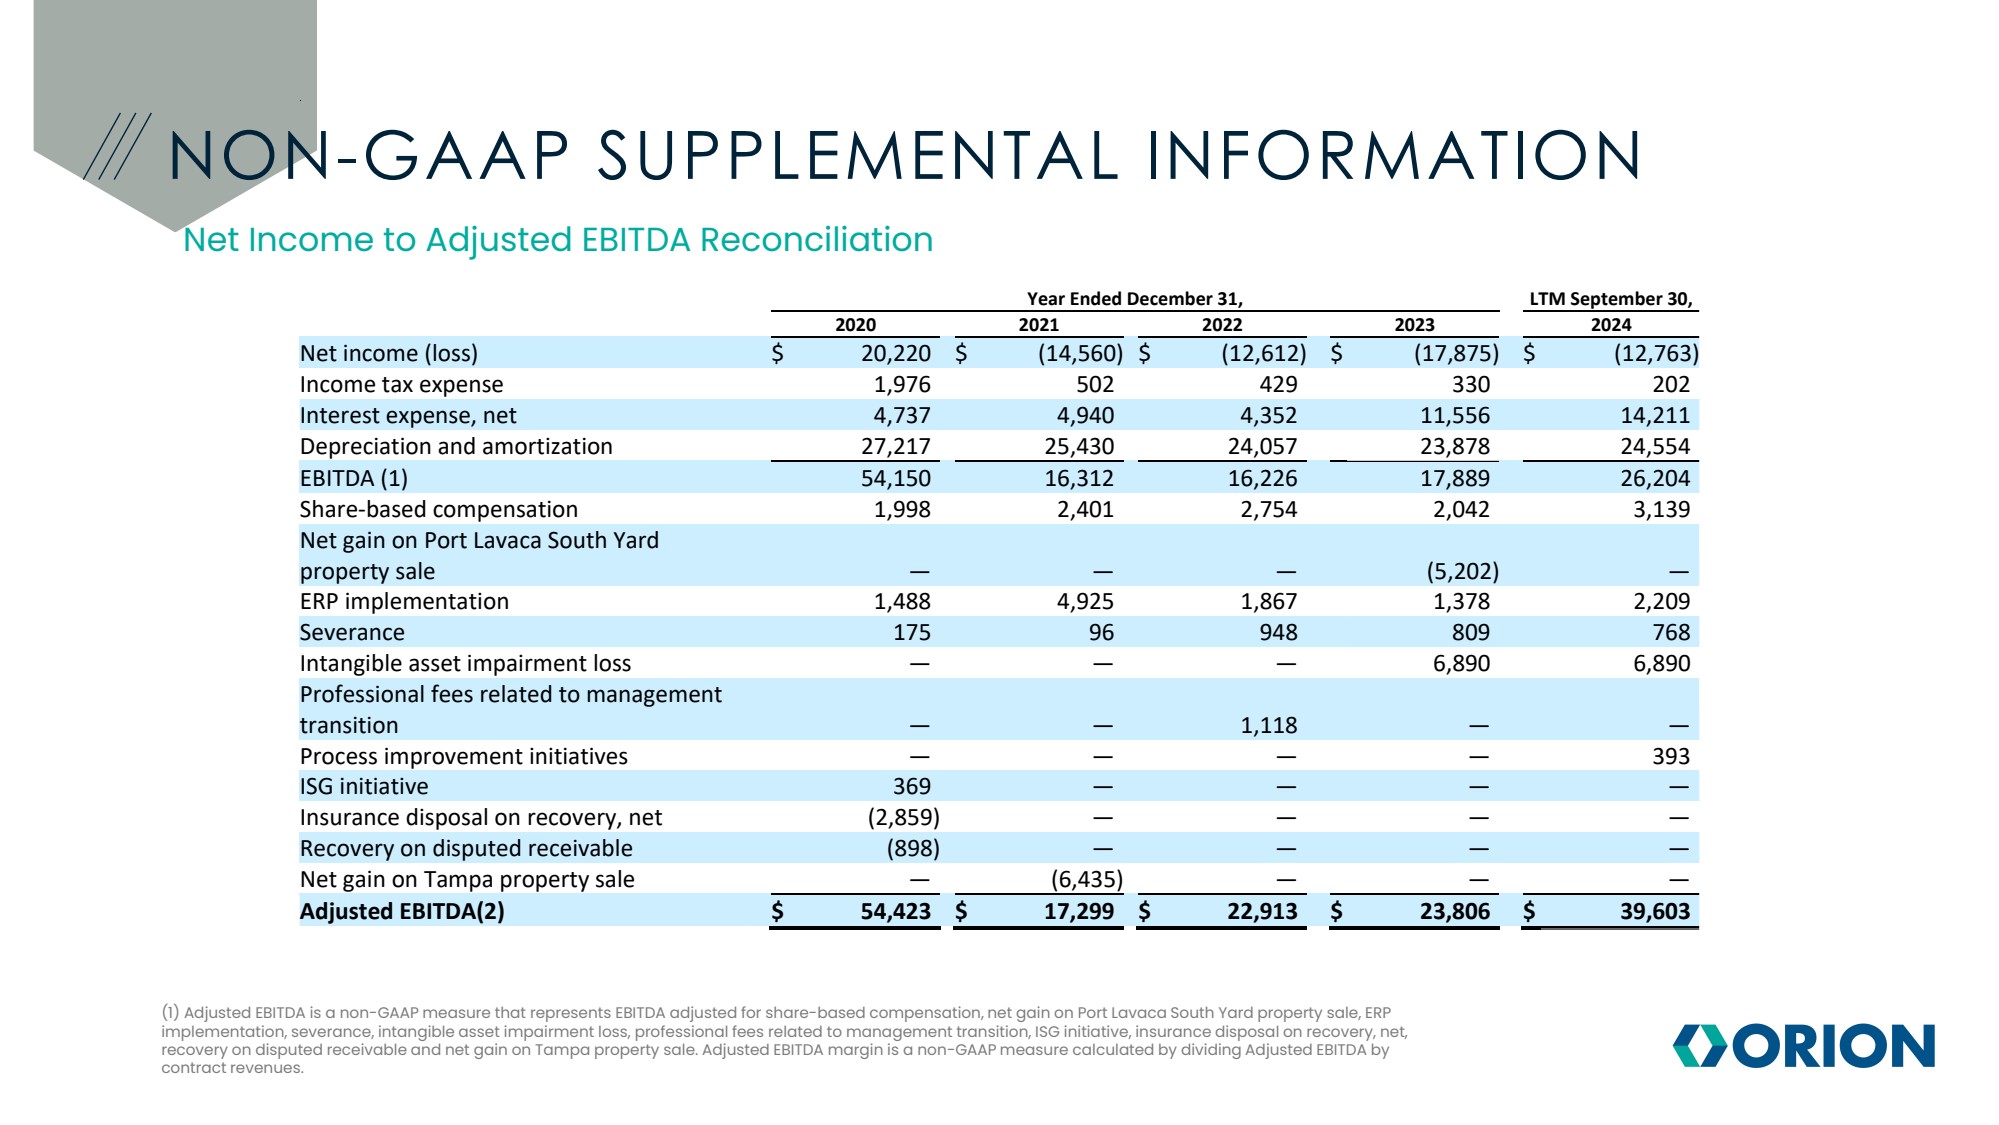
| NON-GAAP SUPPLEMENTAL INFORMATION Net Income to Adjusted EBITDA Reconciliation (1) Adjusted EBITDA is a non-GAAP measure that represents EBITDA adjusted for share-based compensation, net gain on Port Lavaca South Yard property sale, ERP implementation, severance, intangible asset impairment loss, professional fees related to management transition, ISG initiative, insurance disposal on recovery, net, recovery on disputed receivable and net gain on Tampa property sale. Adjusted EBITDA margin is a non-GAAP measure calculated by dividing Adjusted EBITDA by contract revenues. Year Ended December 31, LTM September 30, 2020 2021 2022 2023 2024 Net income (loss) $ 20,220 $ (14,560) $ (12,612) $ (17,875) $ (12,763) Income tax expense 1,976 502 429 330 202 Interest expense, net 4,737 4,940 4,352 11,556 14,211 Depreciation and amortization 27,217 25,430 24,057 23,878 24,554 EBITDA (1) 54,150 16,312 16,226 17,889 26,204 Share-based compensation 1,998 2,401 2,754 2,042 3,139 Net gain on Port Lavaca South Yard property sale — — — (5,202) — ERP implementation 1,488 4,925 1,867 1,378 2,209 Severance 175 96 948 809 768 Intangible asset impairment loss — — — 6,890 6,890 Professional fees related to management transition — — 1,118 — — Process improvement initiatives — — — — 393 ISG initiative 369 — — — — Insurance disposal on recovery, net (2,859) — — — — Recovery on disputed receivable (898) — — — — Net gain on Tampa property sale — (6,435) — — — Adjusted EBITDA(2) $ 54,423 $ 17,299 $ 22,913 $ 23,806 $ 39,603 |
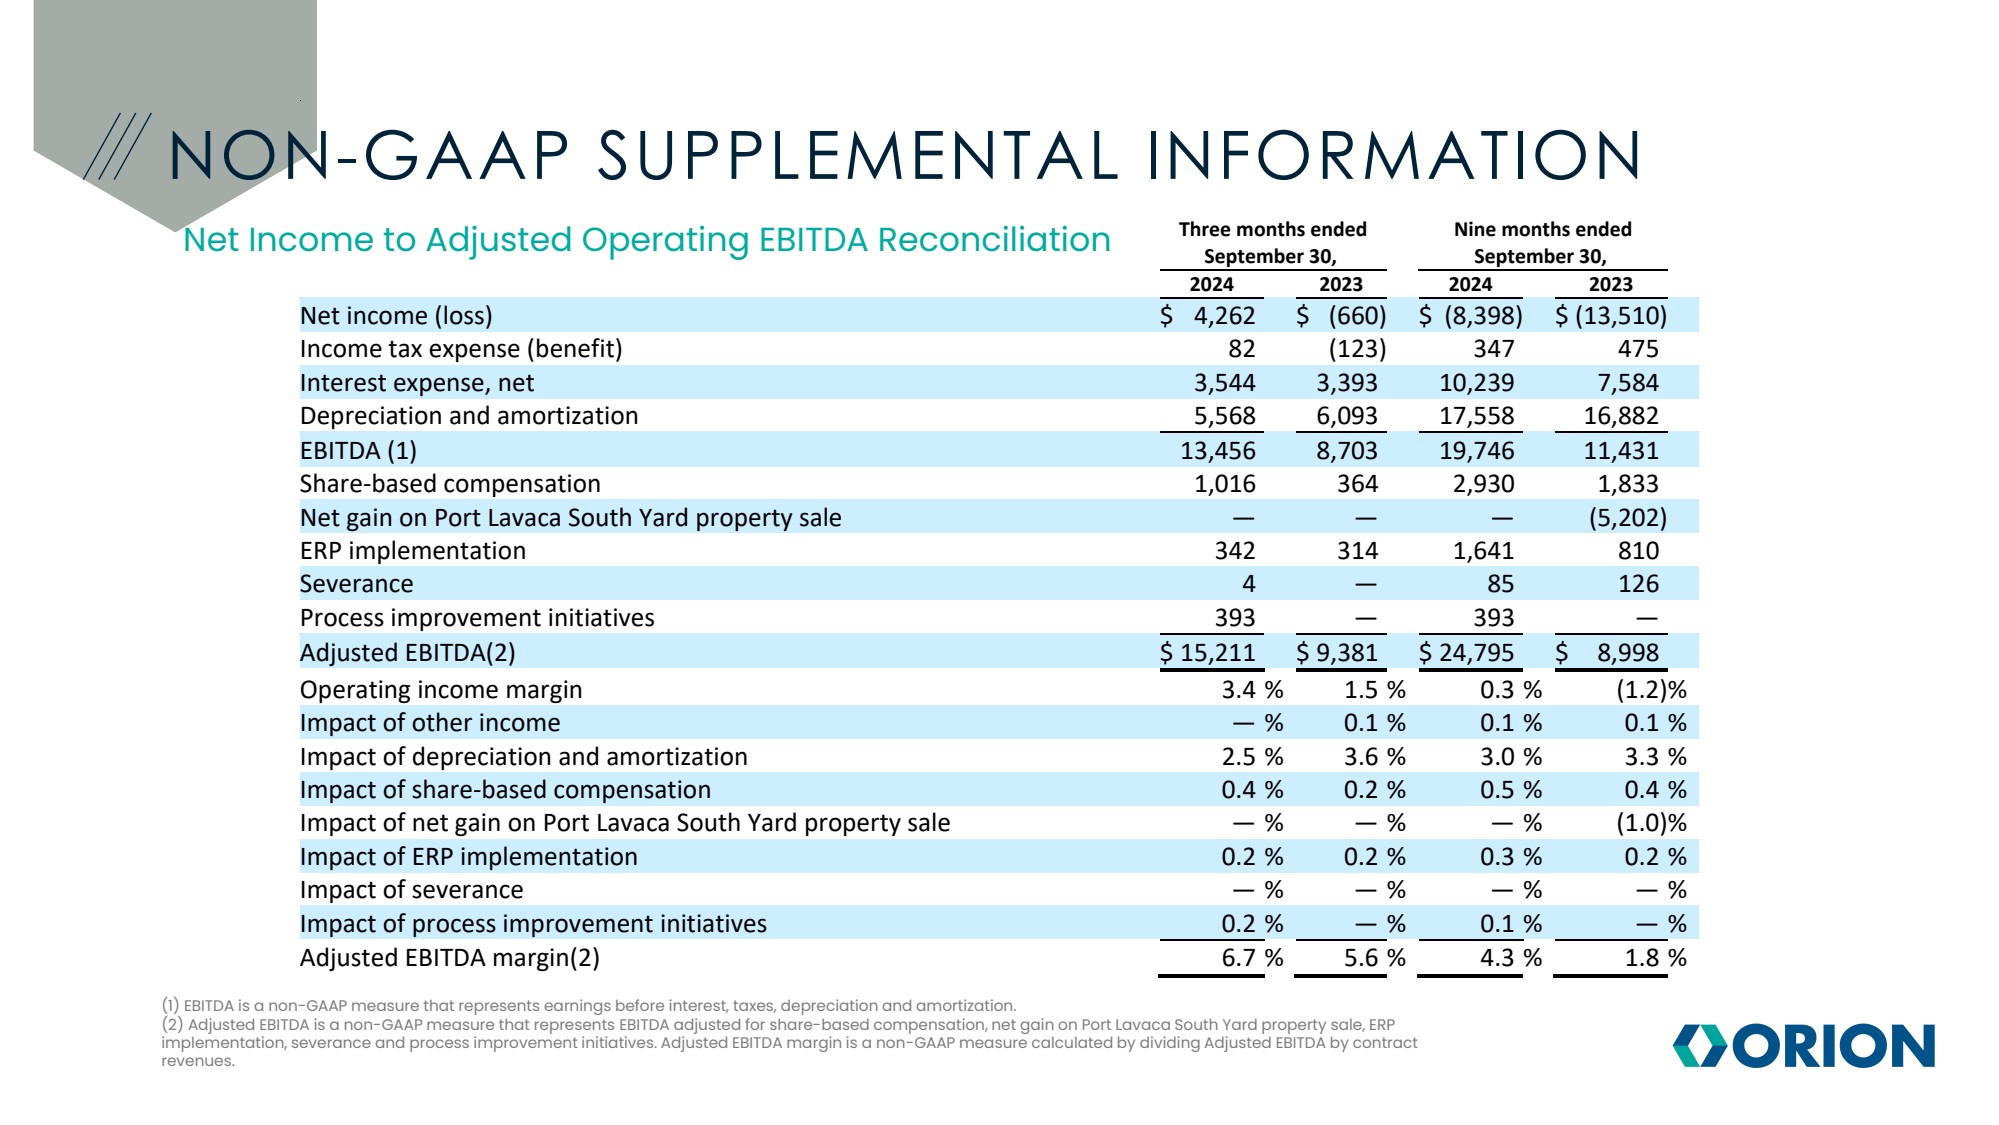
| NON-GAAP SUPPLEMENTAL INFORMATION Net Income to Adjusted Operating EBITDA Reconciliation (1) EBITDA is a non-GAAP measure that represents earnings before interest, taxes, depreciation and amortization. (2) Adjusted EBITDA is a non-GAAP measure that represents EBITDA adjusted for share-based compensation, net gain on Port Lavaca South Yard property sale, ERP implementation, severance and process improvement initiatives. Adjusted EBITDA margin is a non-GAAP measure calculated by dividing Adjusted EBITDA by contract revenues. Three months ended Nine months ended September 30, September 30, 2024 2023 2024 2023 Net income (loss) $ 4,262 $ (660) $ (8,398) $ (13,510) Income tax expense (benefit) 82 (123) 347 475 Interest expense, net 3,544 3,393 10,239 7,584 Depreciation and amortization 5,568 6,093 17,558 16,882 EBITDA (1) 13,456 8,703 19,746 11,431 Share-based compensation 1,016 364 2,930 1,833 Net gain on Port Lavaca South Yard property sale — — — (5,202) ERP implementation 342 314 1,641 810 Severance 4 — 85 126 Process improvement initiatives 393 — 393 — Adjusted EBITDA(2) $ 15,211 $ 9,381 $ 24,795 $ 8,998 Operating income margin 3.4 % 1.5 % 0.3 % (1.2)% Impact of other income — % 0.1 % 0.1 % 0.1 % Impact of depreciation and amortization 2.5 % 3.6 % 3.0 % 3.3 % Impact of share-based compensation 0.4 % 0.2 % 0.5 % 0.4 % Impact of net gain on Port Lavaca South Yard property sale — % — % — % (1.0)% Impact of ERP implementation 0.2 % 0.2 % 0.3 % 0.2 % Impact of severance — % — % — % — % Impact of process improvement initiatives 0.2 % — % 0.1 % — % Adjusted EBITDA margin(2) 6.7 % 5.6 % 4.3 % 1.8 % |
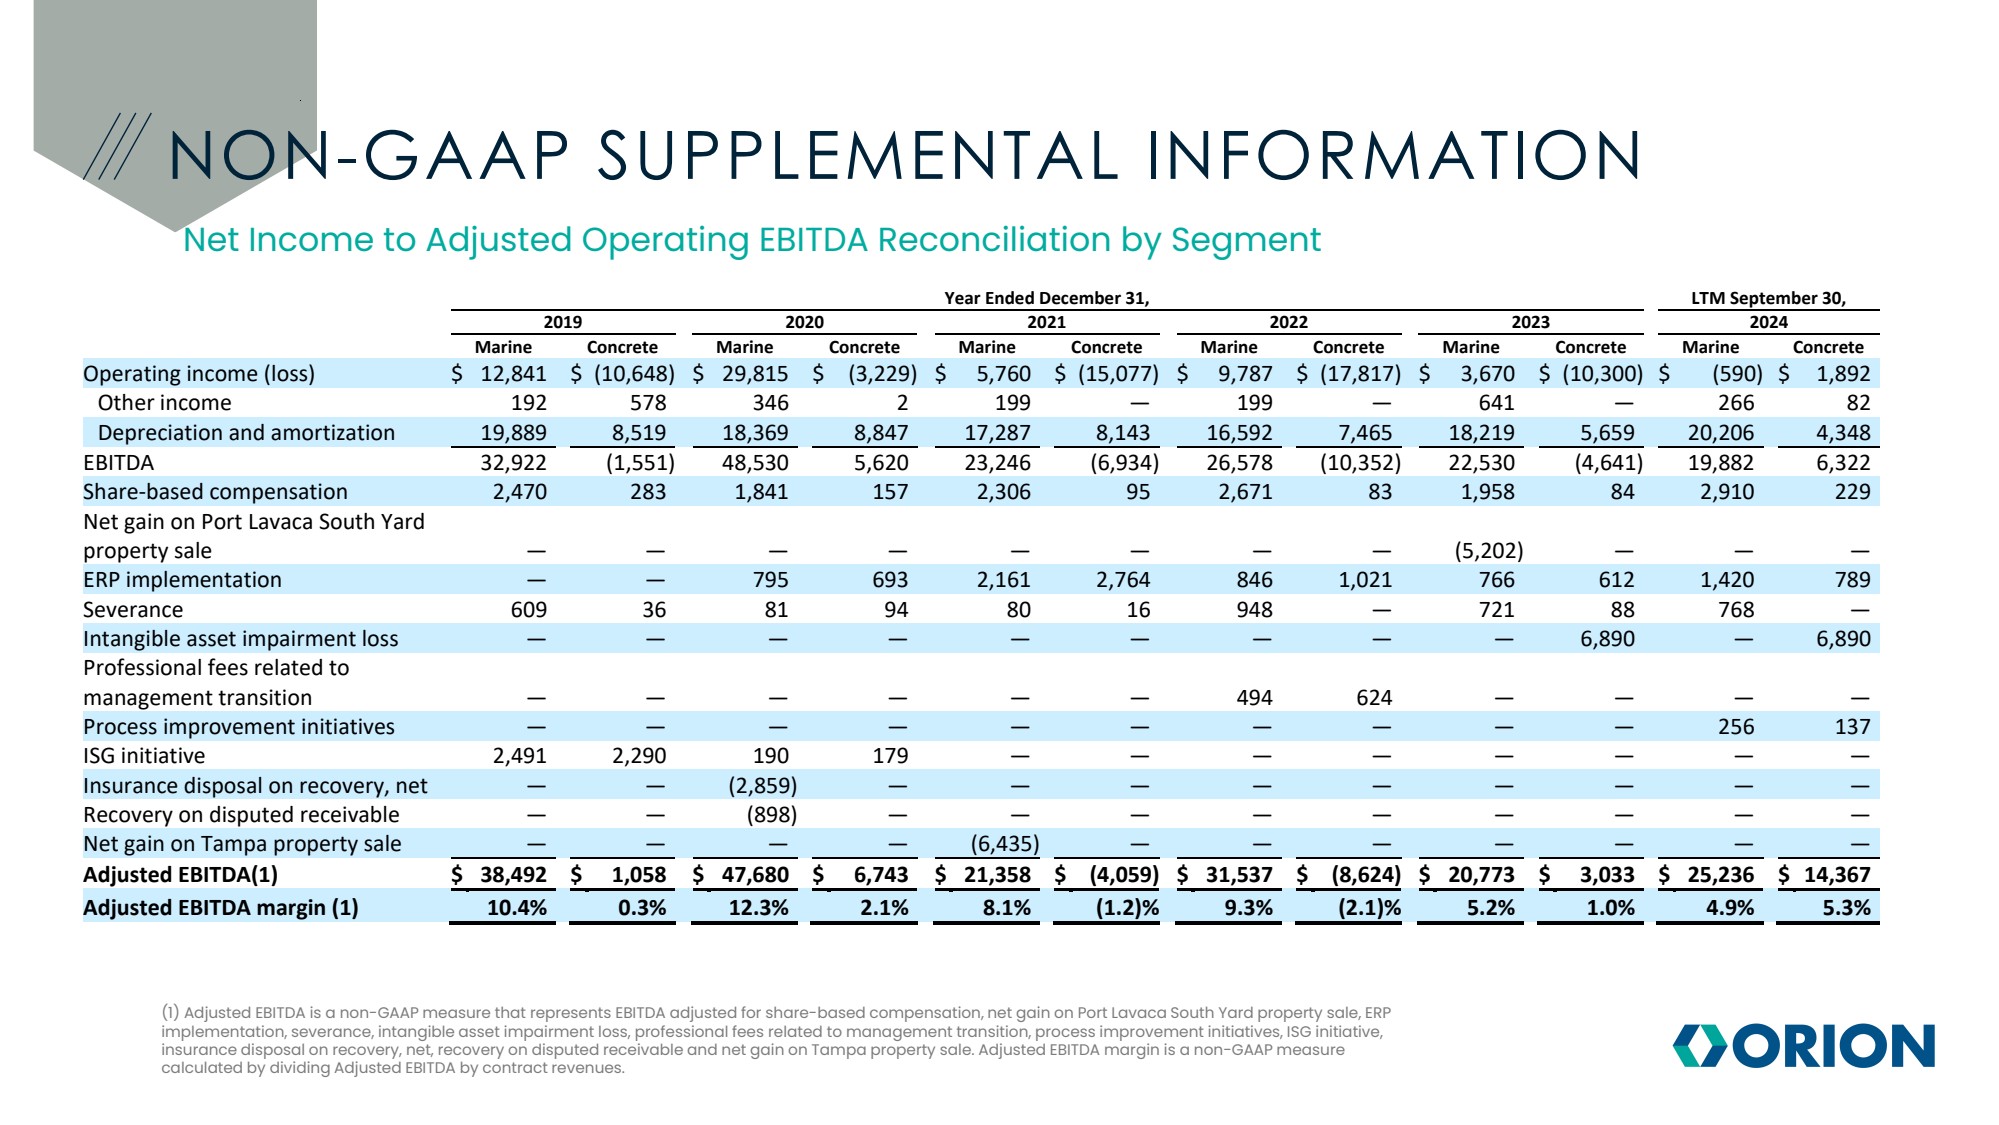
| NON-GAAP SUPPLEMENTAL INFORMATION Net Income to Adjusted Operating EBITDA Reconciliation by Segment (1) Adjusted EBITDA is a non-GAAP measure that represents EBITDA adjusted for share-based compensation, net gain on Port Lavaca South Yard property sale, ERP implementation, severance, intangible asset impairment loss, professional fees related to management transition, process improvement initiatives, ISG initiative, insurance disposal on recovery, net, recovery on disputed receivable and net gain on Tampa property sale. Adjusted EBITDA margin is a non-GAAP measure calculated by dividing Adjusted EBITDA by contract revenues. Year Ended December 31, LTM September 30, 2019 2020 2021 2022 2023 2024 Marine Concrete Marine Concrete Marine Concrete Marine Concrete Marine Concrete Marine Concrete Operating income (loss) $ 12,841 $ (10,648) $ 29,815 $ (3,229) $ 5,760 $ (15,077) $ 9,787 $ (17,817) $ 3,670 $ (10,300) $ (590) $ 1,892 Other income 192 578 346 2 199 — 199 — 641 — 266 82 Depreciation and amortization 19,889 8,519 18,369 8,847 17,287 8,143 16,592 7,465 18,219 5,659 20,206 4,348 EBITDA 32,922 (1,551) 48,530 5,620 23,246 (6,934) 26,578 (10,352) 22,530 (4,641) 19,882 6,322 Share-based compensation 2,470 283 1,841 157 2,306 95 2,671 83 1,958 84 2,910 229 Net gain on Port Lavaca South Yard property sale — — — — — — — — (5,202) — — — ERP implementation — — 795 693 2,161 2,764 846 1,021 766 612 1,420 789 Severance 609 36 81 94 80 16 948 — 721 88 768 — Intangible asset impairment loss — — — — — — — — — 6,890 — 6,890 Professional fees related to management transition — — — — — — 494 624 — — — — Process improvement initiatives — — — — — — — — — — 256 137 ISG initiative 2,491 2,290 190 179 — — — — — — — — Insurance disposal on recovery, net — — (2,859) — — — — — — — — — Recovery on disputed receivable — — (898) — — — — — — — — — Net gain on Tampa property sale — — — — (6,435) — — — — — — — Adjusted EBITDA(1) $ 38,492 $ 1,058 $ 47,680 $ 6,743 $ 21,358 $ (4,059) $ 31,537 $ (8,624) $ 20,773 $ 3,033 $ 25,236 $ 14,367 Adjusted EBITDA margin (1) 10.4% 0.3% 12.3% 2.1% 8.1% (1.2)% 9.3% (2.1)% 5.2% 1.0% 4.9% 5.3% |
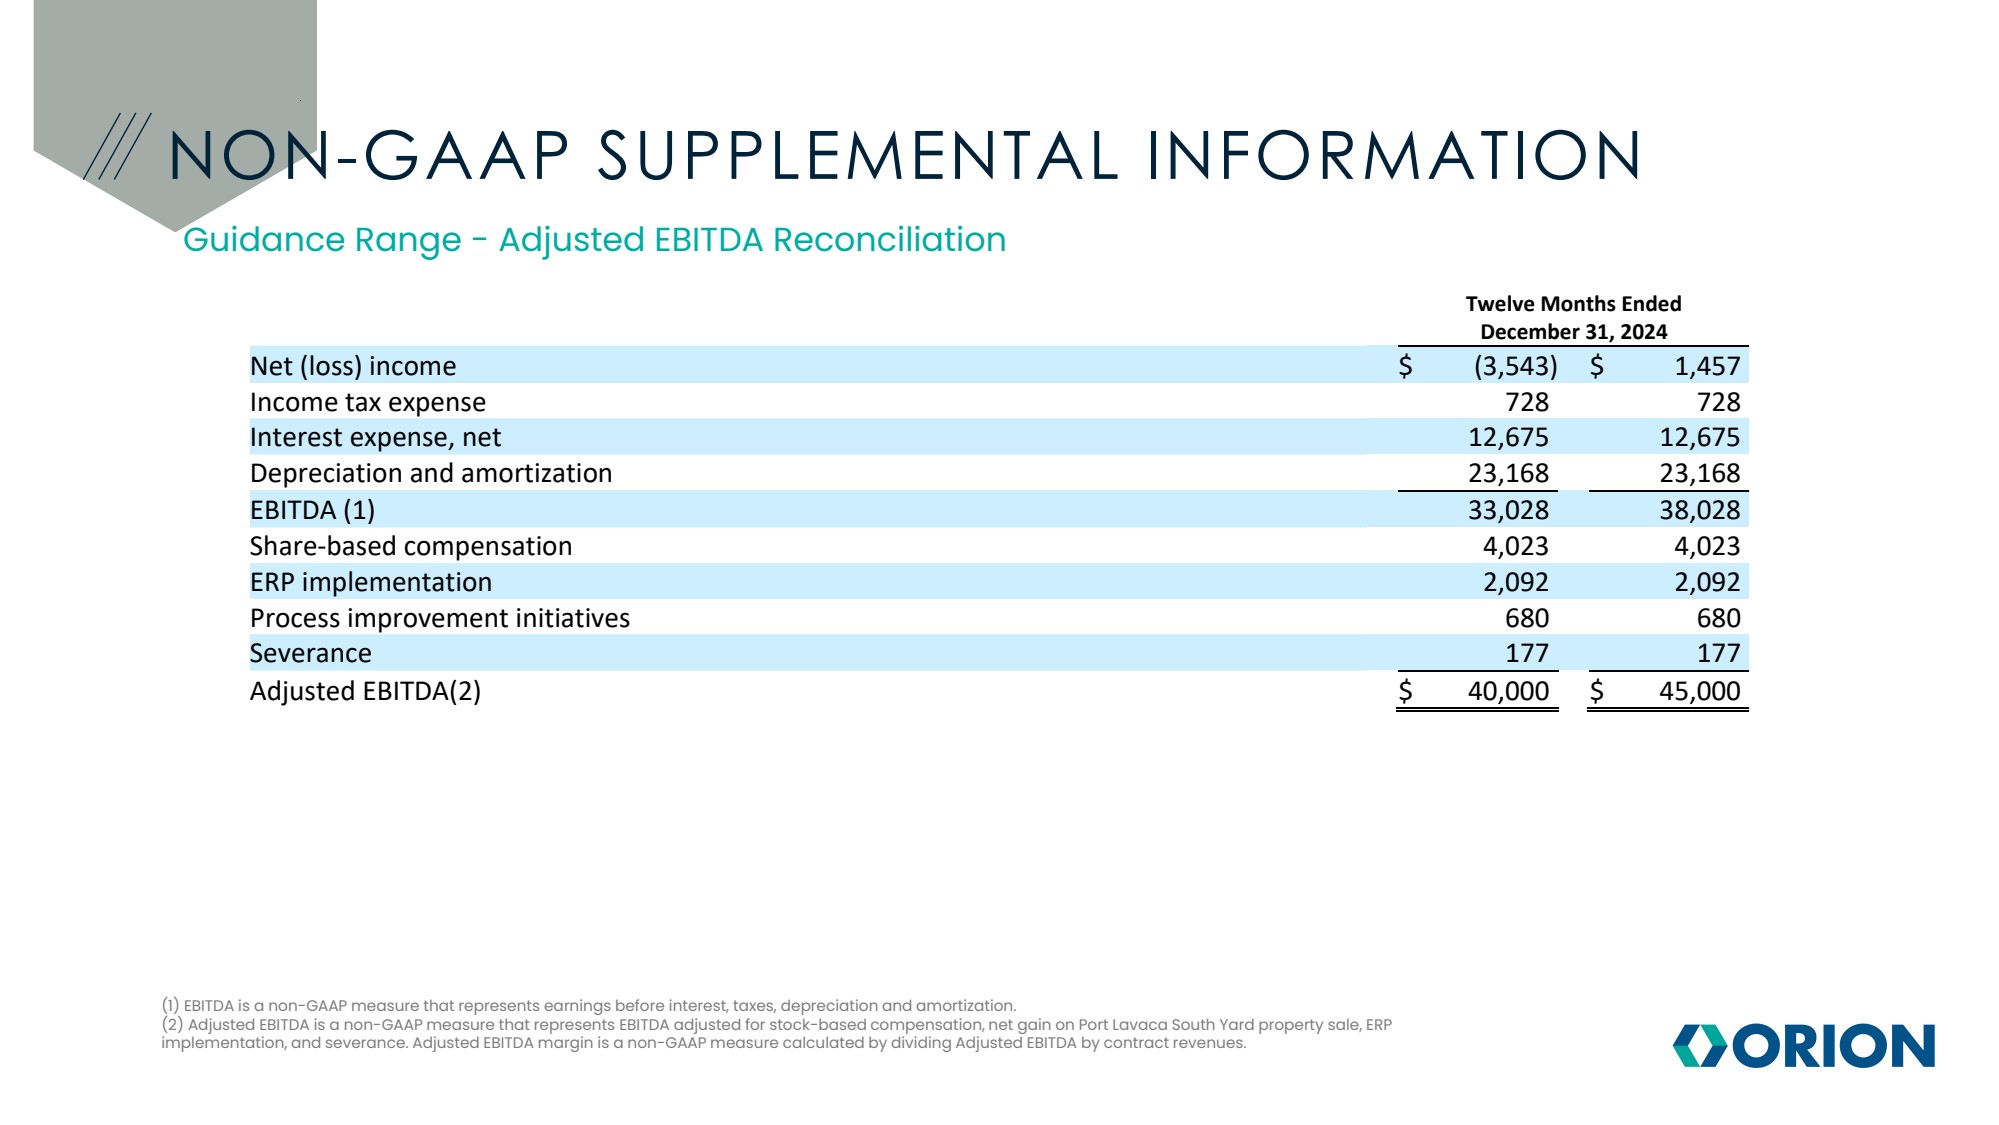
| NON-GAAP SUPPLEMENTAL INFORMATION Guidance Range - Adjusted EBITDA Reconciliation (1) EBITDA is a non-GAAP measure that represents earnings before interest, taxes, depreciation and amortization. (2) Adjusted EBITDA is a non-GAAP measure that represents EBITDA adjusted for stock-based compensation, net gain on Port Lavaca South Yard property sale, ERP implementation, and severance. Adjusted EBITDA margin is a non-GAAP measure calculated by dividing Adjusted EBITDA by contract revenues. Twelve Months Ended December 31, 2024 Net (loss) income $ (3,543) $ 1,457 Income tax expense 728 728 Interest expense, net 12,675 12,675 Depreciation and amortization 23,168 23,168 EBITDA (1) 33,028 38,028 Share-based compensation 4,023 4,023 ERP implementation 2,092 2,092 Process improvement initiatives 680 680 Severance 177 177 Adjusted EBITDA(2) $ 40,000 $ 45,000 |
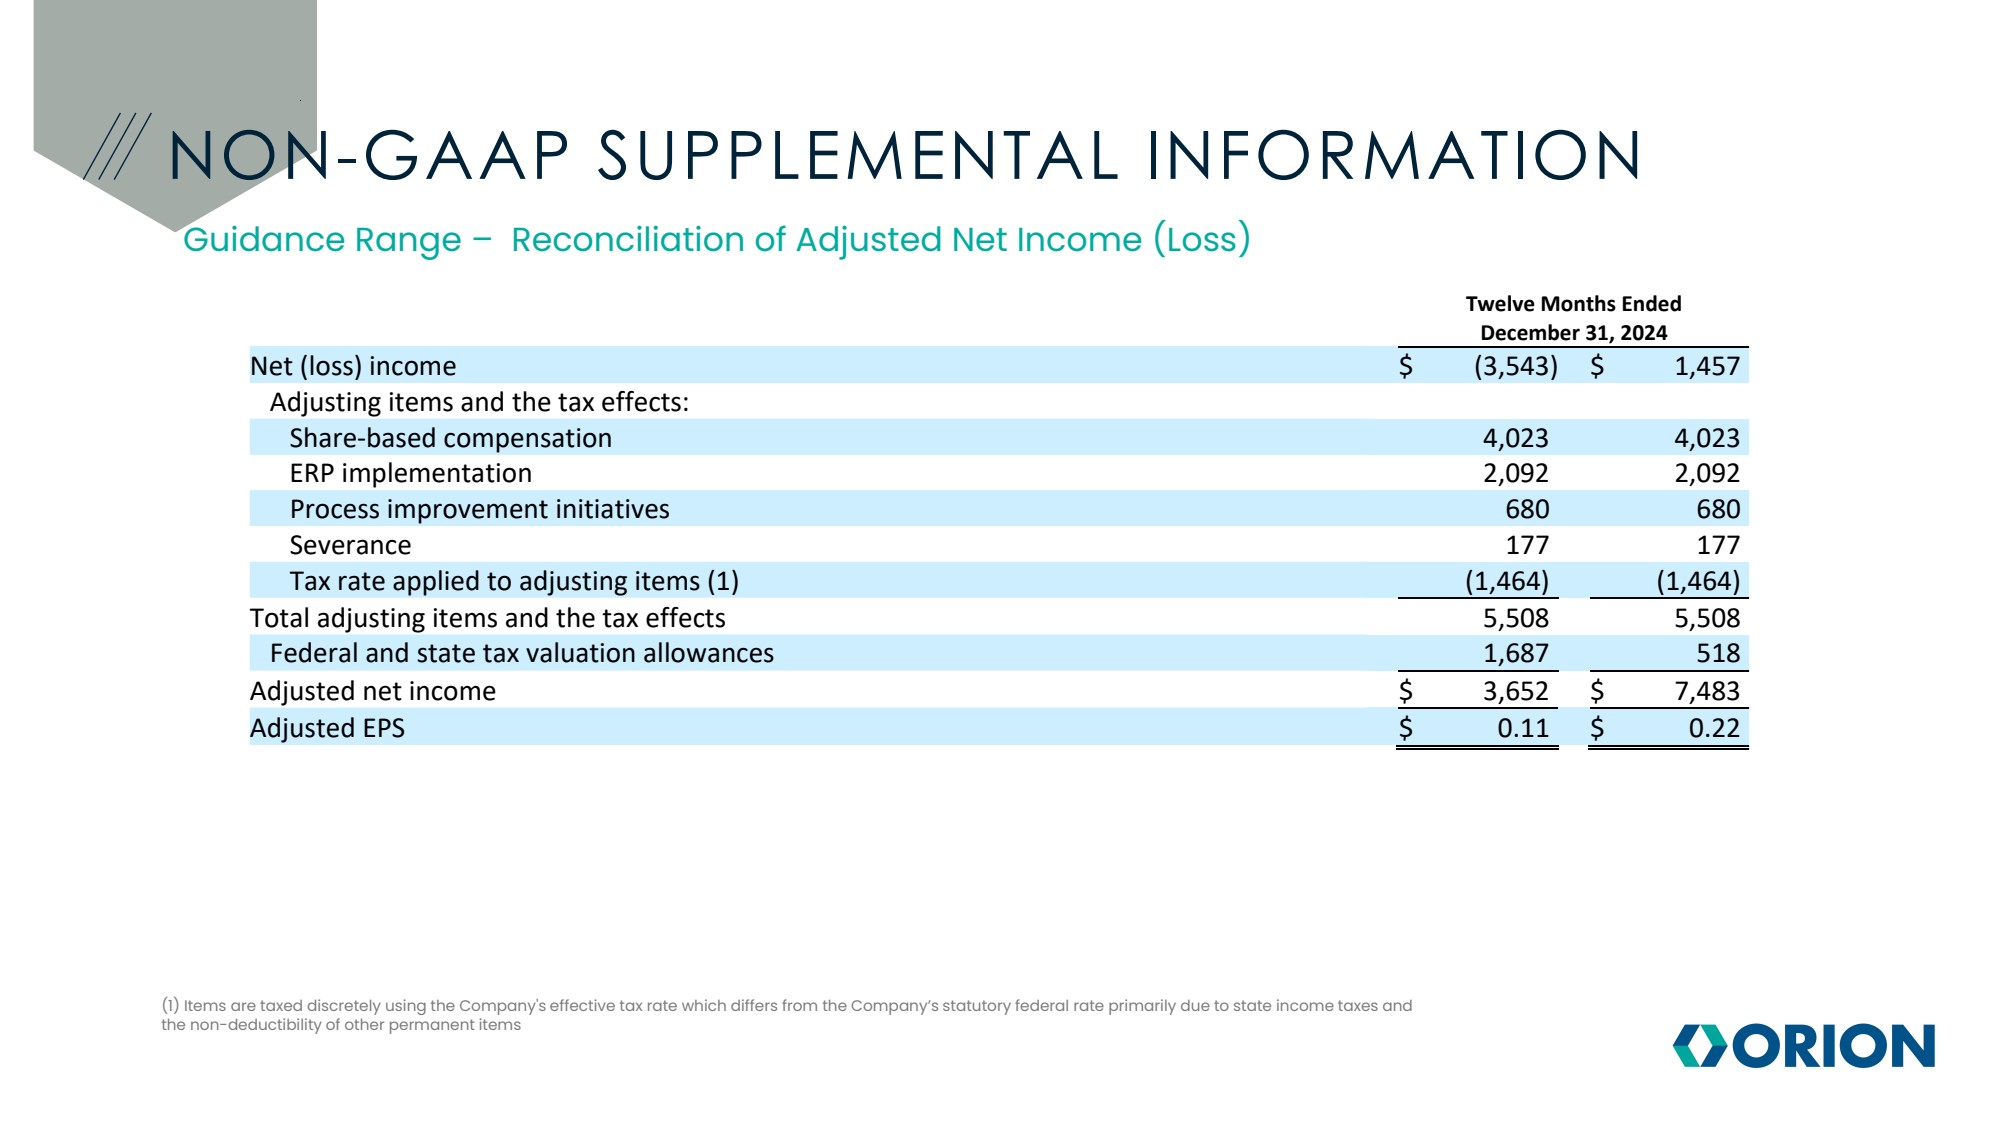
| NON-GAAP SUPPLEMENTAL INFORMATION Guidance Range – Reconciliation of Adjusted Net Income (Loss) (1) Items are taxed discretely using the Company's effective tax rate which differs from the Company’s statutory federal rate primarily due to state income taxes and the non-deductibility of other permanent items Twelve Months Ended December 31, 2024 Net (loss) income $ (3,543) $ 1,457 Adjusting items and the tax effects: Share-based compensation 4,023 4,023 ERP implementation 2,092 2,092 Process improvement initiatives 680 680 Severance 177 177 Tax rate applied to adjusting items (1) (1,464) (1,464) Total adjusting items and the tax effects 5,508 5,508 Federal and state tax valuation allowances 1,687 518 Adjusted net income $ 3,652 $ 7,483 Adjusted EPS $ 0.11 $ 0.22 |
| THANK YOU! |
